Abstract
DNase I was used to probe the higher order chromatin structure in whole nuclei. The digestion profiles obtained were the result of single-stranded cuts and were independent of pH, type of divalent ion and chromatin repeat length. Furthermore, the protection from digestion of the DNA at the entry/exit points on the nucleosome was found to be caused not by the H1/H5 histone tails, but by the compact structure that these proteins support. In order to resolve symmetry ambiguities, DNase I digestion fragments over several nucleosome repeat lengths were analysed quantitatively and compared with computer simulations using combinations of the experimentally obtained rate constants (some of which were converted to 0 to simulate steric protection from DNase I digestion). A clear picture of precisely defined, alternating, asymmetrically protected nucleosomes emerged. The linker DNA is inside the fibre, while the nucleosomes are positioned above and below a helical path and/or with alternating orientation towards the dyad axis. The dinucleosomal modulation of the digestion patterns comes from alternate protection of cutting sites inside the nucleosome and not from alternating exposure to the enzyme of the linker DNA.
INTRODUCTION
Although the structure of the 30 nm chromatin fibre has been the subject of intensive studies, it is still not fully understood (for reviews see 1,2). The lack of a clear picture of how the nucleosomes are packed in the fibre has hampered further understanding of the transition(s) between transcriptionally active and inactive chromatin. It is not yet known whether there are only two states of chromatin, condensed and extended, or whether there are one or more intermediate structures. DNase I and DNase II digestion patterns have provided insight into the protection that the linker histones and the higher order chromatin structure exert upon the DNA in bulk nucleosomes (3–16). Digestion and 5"-end-labelling have been used to footprint the core particle (17–20) and H1-depleted and non-depleted chromatosomes in solution (21,22). These experiments have shown that H1/H5 histones protect the nucleosome at the entry and exit points of the linker DNA around the dyad axis at positions S[0], S[1], S[2] and S[7] and that the chromatosomal DNA is symmetrical with respect to the core particle (Fig. 1).
Figure 1.
Schematic presentation of a nucleosome, showing the DNA entry and exit points around the dyad axis and the numbering of the DNase I cutting sites in the core particle from S[–8] to S[+8], with S[0] in the centre of the nucleosomal DNA, on the dyad axis as proposed by Klug et al. (28).
It is, however, very difficult to obtain uniform size fragments of several nucleosome lengths for end-labelling experiments in order to study the structure of the 30 nm fibre. On the other hand, unlabelled digests of periodical structures do not need to be prepared as homogeneous sizes and their patterns reveal specific features of their periodicity. Only one previous attempt has been made to quantitatively simulate the multinucleosomal DNase I digestion patterns (11). Recently, we used experimentally obtained rate constants for DNase I digestion of different sites in the chromatosome (22), while varying the rate constant for the linker DNA, to simulate the additional protection that the higher order structure imposes on the nucleosomes (23). We showed that in polynucleosomes this additional periodic protection can be used to determine the orientation of the nucleosomes in the 30 nm fibre, which have their linker DNA entry and exit points inside the fibre. We also showed that the bulk of the nucleosomes in chicken erythrocyte polynucleosome samples are in a highly ordered structure. Our conclusions about protection from digestion, however, were limited to a symmetrical solution.
Here it is shown that DNase I always cuts nucleosomal DNA in a single-stranded mode and that the digestion patterns obtained do not depend on the digestion conditions, but reflect the actual accessibility of the linker and the nucleosomal DNA to the enzyme. The symmetry uncertainties were resolved from the periodicity of the multinucleosomal length digestion patterns (up to four nucleosomes), which were compared by computer simulation. The linker DNA was found to be strongly protected and hence is proposed to be within the fibre, with the nucleosomes being positioned alternately above and below a smooth superhelix and/or with alternating orientation towards the dyad axis.
MATERIALS AND METHODS
Nuclei
Chicken blood was collected in 0.15 M NaCl, 15 mM phosphate, pH 7.6, containing 50 mg/l heparin. Cells were never exposed to EDTA. The cells were lysed in 50 mM Tris, pH 7.5, 6 mM MgCl2, 0.25 M sucrose and 1% Triton X-100, followed by several washes in the same buffer without Triton (22).
Oligo- and polynucleosomes
Chromatin was prepared by digesting nuclei (6 mg/ml DNA) with 2.5 U/ml micrococcal nuclease in 20 mM Tris–HCl, pH 7.5, 15 mM NaCl, 1 mM CaCl2 and 0.1 mM phenylmethylsulfonyl fluoride (PMSF) at 37ºC for 20 min and terminated with 10 mM Na3EDTA. Nuclei were sedimented in a bench top centrifuge for 1 min and the chromatin fragments in the supernatant (50–70% yield) were fractionated on 6–40% sucrose gradients in 15 mM Tris–HCl, pH 7.5, 10 mM NaCl, 0.2 mM Na3EDTA, 0.1 mM PMSF using a SW40 Beckman rotor spun at 40 000 r.p.m., usually for 16 h (23). SDS–protein gel electrophoresis of histone proteins was carried out according to Laemmli (24)
DNase I digestion
Nuclei were digested at 1 or 2 mg/ml in 20 mM Tris–HCl, pH 7.5 (or as described in the figure legends), 15 mM NaCl, 10 mM MgCl2 (or MnCl2), 0.2 mM Na3EDTA, 0.2 mM PMSF. No detectable material diffused out of the nuclei after termination of digestion. After termination of DNase I digestion with 20 mM Na3EDTA (final concentration) samples were digested with proteinase K and DNA was extracted with phenol and phenol/chloroform. Poly- and oligonucleosomes were digested as previously described (23).
Densitometry and simulations
Densitometry and simulations were carried out as in Staynov and Proykova (23) (see Supplementary Material).
RESULTS
We have shown previously that the DNase I digestion patterns of unlabelled DNA can give an insight into the protection exerted by the linker histones as well as by the higher order structure (23). Although we found that the protection imposed by the higher order structure is limited to entry and exit of the linker DNA around the dyad axis, symmetry limitations (resulting from the use of single nucleosome size fragments) restricted our solution to an average (i.e. symmetrical) protection picture. However, the single- and double-stranded digestion patterns of fragments up to four nucleosomes in size allow elucidation of the asymmetrical pattern of protection imposed by the higher order structure. To interpret the digestion profiles, however, the mode of digestion of the nucleosomal DNA must be known, i.e. whether a nick in one strand of DNA in the nucleosome exposes the other strand for digestion or whether the two strands of DNA are cut independently.
The DNase I digestion pattern of whole nuclei reflects the exposure of DNA to the enzyme and does not depend on the conditions of digestion
DNase I is very sensitive to pH, salt and divalent ion concentrations in the buffer. In the presence of Mg2+ ions it cuts DNA in a single-stranded mode, whereas in the presence of Mn2+ or Mg2+ and Ca2+ it cuts the second strand where it has become exposed after a first strand cut, thus generating ‘double-stranded’ cuts (25). The limit digest also depends on pH and the concentration of divalent ions.
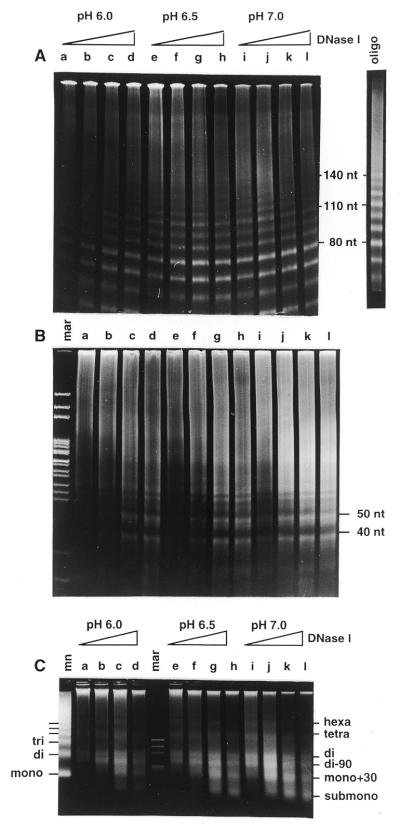
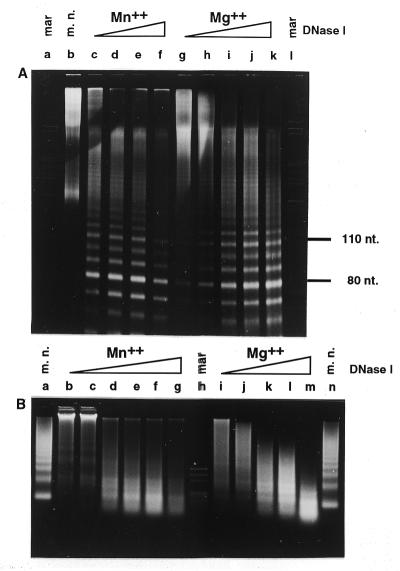
To assess whether the nuclease digestion patterns of whole nuclei reflect the accessibility of DNA or the mode of digestion of the enzyme, nuclei were digested under different conditions. In Figure 2, single- and double-stranded gels of nuclei digested at pH 6.0, 6.5 and 7.0 are presented. With the exception of a slight increase in the rate of digestion with increasing pH, the three patterns are indistinguishable. Moreover, even the change in digestion conditions from Mn2+ to Mg2+ produced almost identical digestion patterns (Fig. 3). Identical patterns were also obtained when digestion was performed in the presence of Mg2+ and Ca2+ (data not shown). These findings suggest that the histones protect the inner side of the double helix, so that the DNA is cut in single-stranded mode even in the presence of Mn2+ ions.
Figure 2.
DNase I digestion patterns obtained when chicken erythrocyte chromatin is digested in whole nuclei. (A and B) 8% polyacrylamide gel in TBE: (A) with 7 M urea; (B) without urea. (C) 2% agarose gel in glycine buffer. Nuclei were digested with increasing amounts of DNase I (10, 30, 100 and 300 U/mg DNA) on ice for 50 min at pH 6.0 (lanes a–d), at pH 6.5 (lanes e–h) and at pH 7.0 (lanes i–l). (A) Lane oligo, digestion pattern obtained when tri- and tetranucleosomes containing H1/H5 histones were digested with DNase I (taken from 23). mar, restriction marker pAT/HpaII; mn, micrococcal nuclease digest of the same nuclei.
Figure 3.
DNase I digestion patterns of chicken erythrocyte chromatin digested in whole nuclei in the presence of 5 mM MnCl2 or in the presence of 5 mM MgCl2 with increasing amounts of DNase I (10, 30, 100 and 300 U/mg DNA) on ice for 50 min. (A) 8% polyacrylamide gel in TBE, 7 M urea. (B) 2% agarose gel in glycine buffer. mar, restriction marker pAT/HpaII; m.n., micrococcal nuclease digest.
The digestion pattern seen in the denaturing gel in Figure 2A is very similar to that obtained when polynucleosomes were digested with DNase I in solution and is distinguishably different from the digestion pattern of oligonucleosomes (see Fig. 2A, lane oligo; taken from 23). Strong bands are seen at 80 and 110 nt, whilst the 130 and 140 nt bands are attenuated and a smear is observed above 120 nt. The same characteristic pattern with a strong 10 nt repeat and a suppressed 140 nt band are produced in polynucleosomes from DNase I digestion of HeLa nuclei, which have a repeat length that is 15 nt shorter (see Supplementary Material).
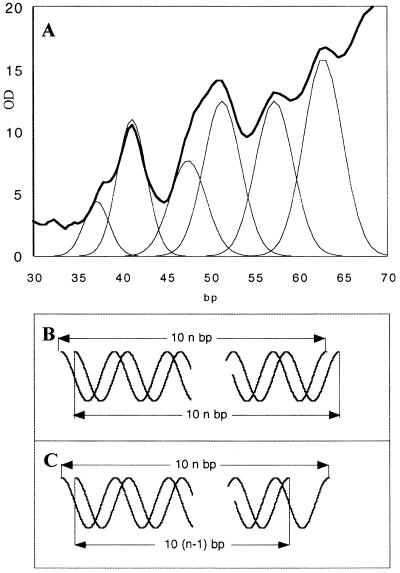
The double-stranded polyacrylamide gel in Figure 2B shows intermediate bands between the 10 bp ladder (seen clearly in front of the 40 and 50 bp bands in Fig. 2B, lanes g, h and j–l). Resolution of these patterns into 10n bp bands, where n is an integer, shows that the intermediate bands are about 4 bp shorter than the main bands (Fig. 4A). Because no intermediate bands are seen in the single-stranded gel (Fig 2A), none of the DNA strands can have been cut within a single nucleosome in a 10n + 5 nt fashion; furthermore, these bands are too short to result from cuts in adjacent nucleosomes. This suggests that the double-stranded pattern observed comprises a mixture of: (i) two strands of equal length, as in Figure 4B, to give the 10n bp ladder; (ii) two strands differing by 10 nt, as in Figure 4C, to give a 10n + 5 bp ladder. These results confirm that the nucleosomal DNA is only digested on the outer exposed strand at a particular site and that the inner strand is not exposed to digestion. The intermediate bands do not appear exactly equidistant from, but closer to 4 and 6 bp from, the adjacent strong bands. It is very likely that these two kinds of structures do not obey the same mobility versus size relationship.
Figure 4.
(A) Densitometer trace of the digestion profile in Figure 2B, lane j, with resolution into its contributing Gaussian curves. The positions of the Gaussian bands are 37, 41, 47.5, 51.5, 57.5 and 62.5 bp. (B and C) Two possible double-stranded fragments that can contribute to the 10n and 10n + 5 bp ladders, respectively. (B) The two DNA chains are of equal size. (C) One of the DNA chains is 10 nt shorter. OD, optical density.
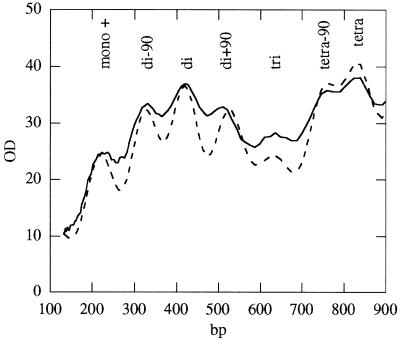
The double-stranded agarose gels in Figures 2C and 3B show the previously reported dinucleosomal repeat with the characteristic di–90 bp bands (12–15). The dinucleosomal band migrates slower than the dinucleosomal band in the micrococcal nuclease digest and better reflects the nucleosomal repeat length (418 nt = 2 × 209 5 nt from this experiment; see Supplementary Material). Its mobility does not increase over the course of digestion. This pattern does not depend on the digestion conditions and it thus reflects an additional protection with dinucleosomal periodicity which is imposed by the higher order structure. Dinucleosomal modulation of the DNase I digestion patterns of whole nuclei revealing dinucleosomal symmetry of the higher order chromatin structure has been previously reported and it has been shown that it is independent of the nucleosome repeat length (12–15). There are, however, some small differences between previous reports and the patterns shown in Figures 2C and 3B. (i) The odd multiple nucleosomal bands are not absent, but are widened and thus almost lost in the background. (ii) Two well-resolved bands of ∼180 and 240 bp are formed late in digestion. (iii) The additional bands on both sides of every even multiple band are at around 2N 90 bp, where N is the repeat length (see also Fig. 8 and Supplementary Material), and not at 2N 70, as previously reported (15).
Figure 8.
Comparison of the densitometer trace of the actual digestion profile in Figure 2C lane c (solid line) with a computer simulation for the digestion profile as would be seen on a double-stranded gel (dashed line). The same rate constants were used as in Figure 7.
DNase I digests linker DNA faster than nucleosomal DNA when the linker is exposed to the enzyme
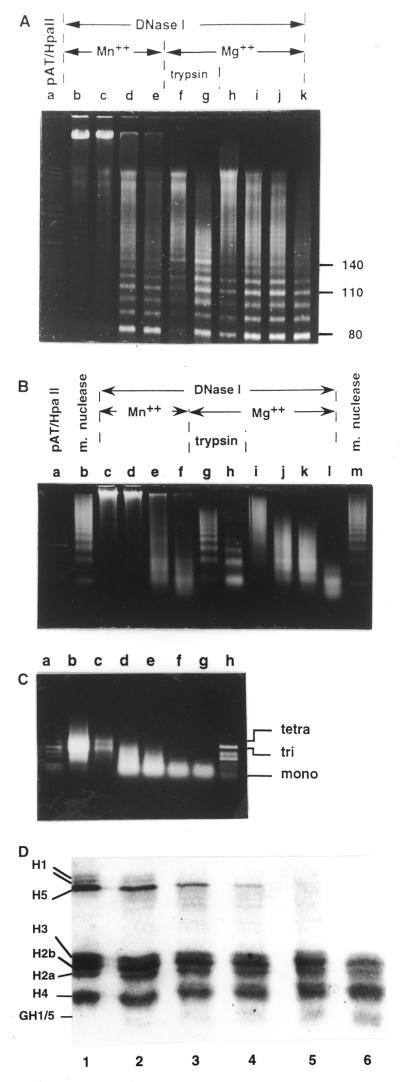
Figure 5A and B shows DNase I digestion profiles of high molecular weight chromatin (around 50 nucleosomes in size) digested in the presence of Mn2+ or Mg2+ ions and in the presence of Mg2+ ions after mild trypsin digestion, which converted about half of the histone H1 into its globular form or into intermediate sized fragments while almost all the histone H5 remained intact (Fig. 5D, lane 2).
Figure 5.
(A) Single- and (B) double-stranded gels of a polynucleosome sample (larger than 20 nucleosomes) that was digested with DNase I, either in the presence of MnCl2 (A, lanes b–e; B, lanes c–f), in the presence of MgCl2 (A, lanes f–k; B, lanes g–l) or in the presence of MgCl2 after mild trypsin digestion (A, lanes f and g, B, lanes g and h). Samples were digested with 2, 4, 8 or 16 U DNase I/mg DNA at 37°C. In (A) lanes f and g and (B) lanes g and h samples were digested with 2 µg trypsin/mg DNA at room temperature for 2 min (D, lane 2). The reactions were terminated with 40 µg trypsin inhibitor/mg DNA and 1 mM PMSF final, after which digestion was performed with 2 or 4 U DNase I on ice for 15 min. (C) Double-stranded gel of a DNase I-digested mixture of tri- and tetranucleosomes, which were not digested with trypsin and thus have H1/H5 histones present. They were digested with 0, 1, 2, 4, 6 or 8 U DNase I/mg DNA. (D) SDS–PAGE of histones from the chromatin samples digested with 2 mg trypsin/mg DNA for 0, 2, 4, 8, 12 or 16 min (lanes 1–6, respectively). GH1/5, globular parts of H1/H5 histones.
Several interesting changes can be seen in the digestion profiles obtained after trypsin digestion. (i) Whereas the character of the pattern below 120 nt is preserved in the denaturing gel (Fig. 5A), the trypsin-digested chromatin profile contains a strong 140 nt band and is thus similar to the digestion profiles of short oligonucleosomes (Fig. 5A, lanes f and g; see also Fig. 2A, lane oligo; 23). (ii) In the double-stranded gel (Fig. 5B), the dinucleosomal periodicity is abolished and DNase I produces a nucleosome ladder indistinguishable from a micrococcal nuclease digestion profile (compare lanes g and h with lanes b and m). Moreover, although DNase I does not have exonucleolytic activity, the oligo- and mononucleosomal bands move faster as digestion progresses, as in a micrococcal nuclease digest. (iii) Even after extensive digestion, when all the material has been converted into mono- to trinucleosomes (Fig. 5B, lane h), there is no subnucleosome sized DNA.
The same digestion profiles (not shown) were obtained when trypsin had removed all of the linker histone and some of the core histone tails (Fig. 5D, lanes 4–6). Thus the intensity of the 140 nt band in the single-stranded profile and the appearance of mononucleosomal periodicity in the double-stranded pattern is not proportional to the loss of H1/H5 tails, but appears almost simultaneously after only some of the linker histones are digested. Figure 5C shows the DNase I digestion pattern of short oligonucleosomes (mainly tri- and tetranucleosomes) that contain the same amount of H1/H5 histones and have not been digested with trypsin. DNase I converted this sample into mononucleosome sized DNA without the characteristic dinucleosomal pattern or subnucleosomal length material. Apparently, without any exonucleolytic activity, DNase I digests the linker DNA in oligonucleosomes and in trypsinised polynucleosomes (when it is not sterically protected by higher order structure) so rapidly that the nucleosome ladder appears before any subnucleosomal fraction. These results all suggest that the enzyme cuts that produce the 140 nt band are not prevented by the stoichiometric presence of the linker histone tails, but by the compact structure that these histones support.
Simulations: The DNase I digestion pattern of DNA fragments of several repeat lengths reflects the multinucleosomal symmetry of the chromatin structure
The strong additional protection imposed by higher order structure is manifested by three noticeable features of the DNase I digestion patterns. (i) The attenuation of the 140 nt band in the 10 nt ladder. This is caused by additional protection of some of the sites S[6], S[7] and S[8] (23). (ii) The absence of a nucleosome ladder and splitting of the mononucleosomal band into two bands of 160–190 and 220–280 nt. This must be caused by an additional protection of either all or some of the DNA linkers. (iii) The strong even numbered nucleosome bands (dinucleosomal modulation of the pattern). This contradicts random asymmetrical protection and can only support a structure with dinucleosomal symmetry. Thus either the linkers or the nucleosomes or both must be alternately protected (26,27).
The minimum requirement for the disappearance of the strong 140 nt band is full protection of one of the two sites S[7] and two of the four sites S[6] and S[8]. There are 12 such combinations. They are all asymmetrical and six of them are mirror images of the other six:
S[–7] and S[8] and its mirror image S[+7] and S[8]
S[6] and S[–7] and its mirror image S[6] and S[+7]
S[–6], S[–7] and S[–8] and its mirror image S[+6], S[+7] and S[+8]
S[–6], S[+7] and S[+8] and its mirror image S[+6], S[–7] and S[–8]
S[–6], S[–7] and S[+8] and its mirror image S[+6], S[+7] and S[–8]
S[–6], S[+7] and S[–8] and its mirror image S[+6], S[–7] and S[+8]
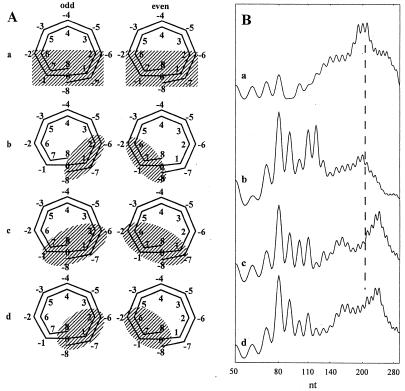
Combinations ii, iv, v and vi, however, do not make sense from a structural point of view, because they contain a mosaic of interspersed unprotected and completely protected sites. Thus the single- and double-stranded digestion profiles for chicken erythrocyte nuclei were simulated by using 0 for kS[0] and kS[4], averaged rate constants for S[1], S[2], S[3], S[5], S[6], S[7] and S[8] from Staynov and Crane-Robinson and Staynov and Proykova (22,23) and 0 for alternately protected sites of either one of the combinations i or iii. The rate constants for S[1] and S[2] were also taken as 0 with their corresponding sites S[6] and S[7] (see Supplementary Material). Neither combination i nor iii, however, produced simulations that were similar to the experimentally obtained digestion patterns. Thus a broader protection was required and these combinations were expanded by addition of one or more adjacent protected sites. Some simulations are shown in Figure 6. They all show a strong 80 nt band, which comes from the 80 bp periodicity inside the nucleosome. The pattern of the rest of the bands, however, strongly depends on the choice of protected sites. A symmetrical protection of all S[6], S[7] and S[8] sites (Fig. 6A a) produces a strange pattern dominated by small size bands up to 80 nt and the 100 nt band but not the 110 nt band. The mononucleosomal band is not split (Fig. 6B a). The asymmetrical protection caused by alternating protection of S[6], S[7] and S[8] (combination iii; Fig. 6A b) failed to split the mononucleosomal band and also produced unusually strong 120 nt and moderate 130 nt bands (Fig. 6B b). Full protection of S[7] and S[8] and alternating protection of S[6] sites (Fig. 6A c) gave a simulation pattern very similar to, but still different from, the experimental pattern. Although it shows a split mononucleosomal band, strong 80 and 110 nt bands and a weak 140 nt band, the 100 nt band is stronger than in the digestion profile and the 130 nt band, which is always weak, is moderately strong in this simulation profile. Only when it was assumed that both sites S[8] are completely protected and the four sites S[6] and S[7] (and their corresponding sites S[1] and S[2]) are alternately protected and unprotected (Fig. 6A d) did the simulation curves become remarkably similar to the experimental patterns obtained (Fig. 6B d).
Figure 6.
(A) Four different combinations of asymmetrical protection of the nucleosomal DNA from DNase I by the higher order chromatin structure. (B) Computer simulations for the corresponding protection combinations. The dashed line in (B) indicates nucleosomal repeat length.
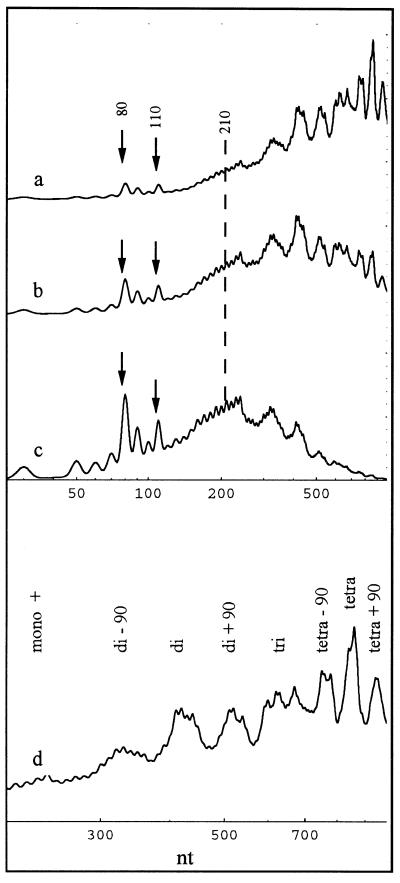
A time course of a single-stranded simulated digestion for the combination shown in Figure 6A d is shown in Figure 7a–c and on an expanded scale of up to 1000 nt in Figure 7d. It is seen that: (i) the discrete strong 10 nt ladder appears up to 120 nt with the characteristic strong 80 and 110 nt and weak 60 and 100 nt bands; (ii) the 140 nt band is attenuated to the level of the faint bands; (iii) the repeat length (210 nt) does not coincide with a maximum, but is surrounded by two broad bands with maxima at 150–180 and 230–250 nt; (iv) in the expanded scale (Fig. 7d), well formed di-, tetra-, di90 and tetra90 nt bands are seen, as well as a mononucleosome-like band that has a maximum at 240 nt (as in the experimental curves) instead of at 210 nt or lower. A partially split trinucleosome band is also seen. This character of the pattern is preserved over a large time interval of digestion.
Figure 7.
Computer simulations of three digestion time points (a–c) for polynucleosomes with full protection at positions S[0] and S[8] and alternating protection at sites S[1], S[2], S[6] and S[7] (the combination shown in Fig. 6A d). The remaining rate constants are the same as for oligonucleosomes in solution (Table S1, Supplementary Material). (d) Curve (a) on an expanded scale.
The densitometer trace of the digestion profile in Figure 2C, lane d, and a simulation curve as it would appear on a double-stranded gel are shown in Figure 8. It is seen that the double-stranded pattern simulation (dashed line) also reflects the character of the experimental curve. It contains all the major and minor bands observed experimentally. It is, however, better resolved than the experimental curve. This may be caused by the lower resolution of an agarose gel over a region of several hundred base pairs or, alternatively, by ∼10% of chromatin material not being in a 30 nm fibre conformation. All simulations required the use of very low rate constants for the linker DNA (see Supplementary Material). Attempts to simulate dinucleosomal protection by the higher order structure using alternating nucleosomes and asymmetrically bound, randomly distributed linker histones produced a very high background and almost no dinucleosomal enhancement. Attempts to simulate the dinucleosomal repeat using conditions involving alternating exposure of the linker also failed (see Supplementary Material).
DISCUSSION
DNase I always digests the exposed strand of the nucleosomal DNA in single-stranded mode
DNase I and DNase II produce different digestion patterns to micrococcal nuclease. Both enzymes, however, are sensitive to digestion conditions. Furthermore, it has been argued that the one or half nucleosomal repeats obtained with DNase II in the absence or presence of divalent ions might not reflect changes in the higher order chromatin structure, but rather changes in the mode of digestion of this enzyme. It has been shown here, however, that DNase I always digests the nucleosomal DNA in single-stranded mode, even in the presence of Mn2+ ions. Thus both DNA strands are digested independently of each other, according to their exposure to the enzyme, so that the digestion pattern reflects the steric hindrances or distortions (29–30) that are imposed by the core histones, by the linker histones and by the higher order structure. This may also be true for other nucleases, since indirect end-labelling experiments on micrococcal nuclease digests show a considerable amount of single-stranded nicking inside the nucleosomes (see for example 31–33).
When oligonucleosomes are digested with DNase I they are converted to mononucleosomes without internucleosome sized fragments being produced (Fig. 5C). Thus the full complement of linker histones does not prevent the enzyme from digesting the linker DNA first, when it is not in a higher order structure. When digesting high molecular weight chromatin, however, DNase I does not cut the linker DNA first, but produces a dinucleosome ladder superimposed on several internucleosome sized bands that look like a smear (Figs 2C, 3B and 5B j–l). This smeared background is not caused by a damaged structure, but, on the contrary, it suggests a highly regular structure in which all the sensitive cutting sites (linkers) are protected. Indeed, the clear regular nucleosome ladder is restored by the slight damage caused to the structure by trypsin (Fig. 5B g and h). The even numbered nucleosome bands have a different origin from the corresponding micrococcal nuclease bands; they are slightly larger in size, very close to the real repeat length and they do not change their mobilities with increasing digestion time (Fig. 2C a–d and e–l). This suggests that they come from cuts within a limited size ‘window’, i.e. cutting sites inside the nucleosome rather than the linker DNA. The mono+ and submono bands, however, shift slightly with the progression of digestion from 280 to 220 nt and from 180 to 150 nt, respectively.
All simulated variants of models with uniformly protected nucleosomes and alternately exposed linkers failed (see Supplementary Material). Instead of strong dinucleosomal bands with double repeat length and split mononucleosomal bands, they produced a well-defined mononucleosomal band with the actual repeat length and a dinucleosomal band shorter by one linker length, as would be expected if every second linker was protected.
The simulations for alternating nucleosomes and strongly protected linkers produced one combination that very closely resembles the single- as well as the double-stranded digestion patterns. The simulations shown in Figures 7 and 8 were carried out using experimentally obtained rate constants (22,23). Alternating sets of these were converted to 0 in order to simulate protection from digestion. Only the rate constant for the linker DNA was varied. Thus, we obtain a clear picture of the exposed and protected sites of nucleosomes in the higher order structure. Both the alternating and the full protection imposed by the higher order structure involve only the sites that are partially protected by the linker histones in solution (23). This supports our previous conclusion that the protection imposed by the higher order chromatin structure is caused by close nucleosome–nucleosome contacts around positions that interact with linker histones, i.e. S[0], S[1], S[2], S[6], S[7] and S[8] (23). Thus, if the linker histones bind asymmetrically to the nucleosomes and impose an asymmetrical protection from DNase I, they must alternate in phase with the fibre.
Alternatively, the linker histones cause folding of the fibre, but protection comes mainly from nucleosome–nucleosome contacts that sterically exclude the DNase I molecule. Although it is less likely, these results do not exclude the possibility that linker histones occupy different positions in the folded fibre and in oligo- or mononucleosomes and that in the fibre they don’t interfere with positions S[2] and S[6], which are then only protected by nucleosome–nucleosome interactions.
We have shown previously that in native dinucleosomes in solution the linker histones fully protect site S[0] on the dyad axis. In order to explain partial protection of the surrounding sites we suggested that there are two overlapping binding sites for H1/H5. Both are central and slightly off centre (22). It has recently been reported that histone H1 binds much further away asymmetrically to a reconstituted nucleosome on unique DNA sequences (34–37). However, as these results were obtained with reconstituted nucleosomes on a single DNA sequence, higher order structure was not involved. Reconstitution of the globular domain of H5 on mixed DNA sequence chromatosomes has confirmed our results and has shown that it binds very closely to the dyad axis and to either S[–8] or S[+8] (38). As these results (38), as well as our results (22), were obtained using free chromatosomes in solution, they cannot reveal a mechanism that determines which of the S[8] sites is favoured by the globular domain. One distinct possibility is that the higher order structure may define the choice between S[–8] and S[+8]. Until more results are obtained using oligo- or polynucleosomes, these questions cannot be answered.
Differences and similarities between the digestion patterns of DNase I and DNase II
The different protection or accessibility of chromatin to micrococcal nuclease and DNase I was previously suggested to originate mainly from the larger size of the latter (31 versus 17 kDa); this was supported by the fact that free DNase I and DNase I immobilised on a large carrier (ferritin) produce very similar digestion patterns (15). It is interesting to compare these findings with the digestion patterns of DNase II (8), which is an even larger molecule (38 kDa). The half nucleosome repeat produced by DNase II in the presence of divalent ions is similar to the dinucleosomal repeat of DNase I. The difference is that the di90 bp bands in the DNase I digest are shifted ∼10 bp away from the dinucleosome band in the DNase II digest and resemble one and a half and two and a half nucleosome length bands. It was shown later that this pattern comes from cuts at sites S[5] and not from the linker (9,10). DNase II cuts the nucleosomal DNA with reduced rate constants around the centre (S[2] and S[3]) and with higher rates only near the ends of the core particle (sites S[5] and S[6]) (20). Thus if, as the simulations suggest, sites S[6] are alternately, or even fully, protected from the larger nuclease molecule, the most abundant products will indeed come from cuts at sites S[5].
CONCLUSIONS
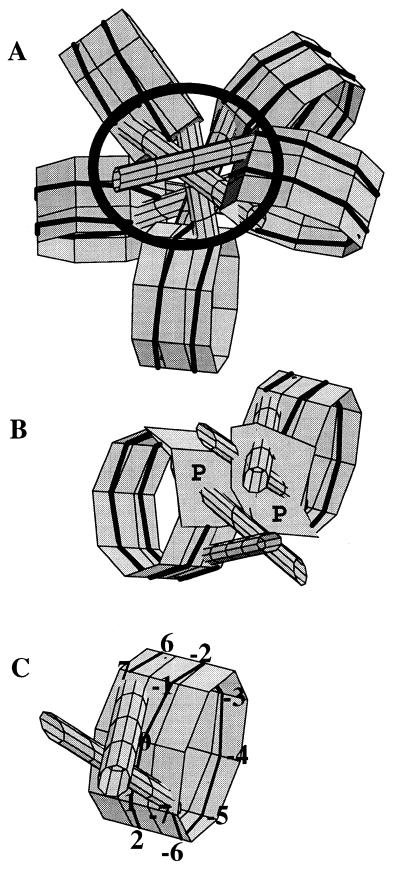
While these results do not provide an unambiguous solution for the structure of the 30 nm fibre, they confirm the emerging picture from recent electron microscopic, diffusion and scanning force microscopy data (39–40) and neutron and X-ray scattering data (41–46) of a fibre with internal linkers. Indeed, there are several different geometrical solutions for this type of structure, which all look very similar; further studies are needed to distinguish between them. Nevertheless, what is novel about these results is that they show that the dinucleosomal periodicity is the result of alternating exposure of the nucleosomes, and not the linkers, to DNase I. A particular combination of asymmetrically protected sites satisfies both the single- and the double-stranded digestion patterns. This finding in turn supports a structure of the linker-inside-the-fibre type (26,43,47). To illustrate the implications of the results presented in this paper, Figure 9A shows a pentanucleosome according to one possible geometrical solution for such a structure: it satisfies the requirements of full and alternating protection of different sites caused only by close nucleosome–nucleosome contacts. It can be seen that sites S[0] and S[8], as well as the linkers, are inside the fibre: hence their inaccessibility to the DNase I molecule. The inaccessible area is marked with a black circle. In Figure 9B, two adjacent nucleosomes are shown from a different projection. They can be seen to be alternately shifted up and down so that the upper part of one nucleosome is in close contact with the lower part of the adjacent nucleosome. The alternately protected positions are illustrated as polygons P in Figure 9B. This alternating proximity can explain the dinucleosomal periodicity observed in the DNase I digestion profiles. The actual path of the linkers does not follow from, and is irrelevant to, these results. The question of whether they are straight (26,39,41–43), bent (48) or like the outline of a tennis racket (49) needs further investigation.
Figure 9.
(A) Graphic presentation of a pentanucleosome according to one geometrical solution for the 30 nm fibre (26). The black circle depicts the area of the fibre where DNase I cannot digest the nucleosomal and linker DNA because of the steric hindrances imposed. (B) Two adjacent nucleosomes from (A) shown in a different projection. Polygons P depict the corresponding protected areas. (C) A nucleosome, showing the numbering of the digestion sites.
SUPPLEMENTARY MATERIAL
See Supplementary Material available at NAR Online
Acknowledgments
ACKNOWLEDGEMENTS
I am grateful to S. Santangelo, D. Cousins and Y. Proykova for critical reading of the manuscript. This work was supported by Wellcome Trust grant no. 037008.
REFERENCES
- 1.van Holde K. (1988) Chromatin. Springer-Verlag, New York, NY.
- 2.Ramakrishnan V. (1987) Crit. Rev. Eukaryot. Gene Expr., 7, 215–230. [DOI] [PubMed] [Google Scholar]
- 3.Hewish D. and Burgoyne,L. (1973) Biochem. Biophys. Res. Commun., 52, 504–510. [DOI] [PubMed] [Google Scholar]
- 4.Kornberg R.D. (1974) Science, 184, 868–871. [DOI] [PubMed] [Google Scholar]
- 5.Noll M. (1974) Nature, 251, 249–251. [DOI] [PubMed] [Google Scholar]
- 6.Noll M. (1974) Nucleic Acids Res., 1, 1573–1578. [DOI] [PMC free article] [PubMed] [Google Scholar]
- 7.Prunell A., Kornberg,R.D., Lutter,L., Klug,A., Levitt,M. and Crick,F.H.C. (1979) Science, 204, 855–858. [DOI] [PubMed] [Google Scholar]
- 8.Altenburger W., Hörz,W. and Zachau,H.G. (1976) Nature, 264, 517–522. [DOI] [PubMed] [Google Scholar]
- 9.Hörz W. and Zachau,H.G. (1980) J. Mol. Biol., 144, 305–327. [DOI] [PubMed] [Google Scholar]
- 10.Hörz W., Miller,F., Klobeck,G. and Zachau,H.G. (1980) J. Mol. Biol., 144, 329–351. [DOI] [PubMed] [Google Scholar]
- 11.Lohr D. and van Holde,K.E. (1979) Proc. Natl Acad. Sci. USA, 76, 6326–6330. [DOI] [PMC free article] [PubMed] [Google Scholar]
- 12.Arceci R.J. and Gross,P.R (1980) Dev. Biol., 80, 210–224. [DOI] [PubMed] [Google Scholar]
- 13.Khachatrian A.T., Pospelov,V.A., Svetlikova,S.B. and Vorob’ev,V.I. (1981) FEBS Lett., 128, 90–92. [DOI] [PubMed] [Google Scholar]
- 14.Pospelov V.A. and Svetlikova,S.B. (1982) FEBS Lett. 146, 157–160. [DOI] [PubMed] [Google Scholar]
- 15.Burgoyne L.A. and Skinner,J.D. (1982) Nucleic Acids Res., 10, 665–673. [DOI] [PMC free article] [PubMed] [Google Scholar]
- 16.Strauss F. and Prunell,A. (1983) EMBO J., 2, 51–56. [DOI] [PMC free article] [PubMed] [Google Scholar]
- 17.Simpson R.T. and Whitlock,J.P. (1976) Cell, 9, 347–353. [DOI] [PubMed] [Google Scholar]
- 18.Whitlock J.P. Jr, Rushizky,G.W. and Simpson,R.T. (1977) J. Biol. Chem., 252, 3003–3006. [PubMed] [Google Scholar]
- 19.Lutter L. (1978) J. Mol. Biol., 124, 391–420. [DOI] [PubMed] [Google Scholar]
- 20.Lutter L. (1981) Nucleic Acids Res., 9, 4251–4265. [DOI] [PMC free article] [PubMed] [Google Scholar]
- 21.Simpson R.T. (1978) Biochemistry, 17, 5524–5531. [DOI] [PubMed] [Google Scholar]
- 22.Staynov D.Z. and Crane-Robinson,C. (1988) EMBO J., 7, 3685–3691. [DOI] [PMC free article] [PubMed] [Google Scholar]
- 23.Staynov D.Z. and Proykova,Y.G. (1998) J. Mol. Biol., 279, 59–71. [DOI] [PubMed] [Google Scholar]
- 24.Laemmli U.K. (1970) Nature, 227, 680–685. [DOI] [PubMed] [Google Scholar]
- 25.Laskowski M. Sr (1971) In Boyer,P.D. (ed.), The Enzymes, Vol. IV, pp. 289–311. Academic Press, New York, NY.
- 26.Staynov D.Z. (1983) Int. J. Biol. Macromol., 5, 3–9. [Google Scholar]
- 27.Staynov D.Z., Dunn S., Baldwin J.P. and Crane-Robinson C. (1983) FEBS Lett., 157, 311–314 [DOI] [PubMed] [Google Scholar]
- 28.Klug A., Rhodes,D., Smith,J., Finch,J.T. and Thomas,J.O. (1980) Nature, 287, 509–516. [DOI] [PubMed] [Google Scholar]
- 29.Richmond T.J., Searls,M.A. and Simpson,R.T. (1988) J. Mol. Biol., 199, 161–170. [DOI] [PubMed] [Google Scholar]
- 30.Luger K., Mäger,A.W., Richmond,R.K. Sargent,D.F. and Richmond,T.J. (1997) Nature, 389, 251–260. [DOI] [PubMed] [Google Scholar]
- 31.Roth S.Y.,Dean,A. and Simpson,R.T. (1990) Mol. Cell. Biol., 10, 2247–2260 [DOI] [PMC free article] [PubMed] [Google Scholar]
- 32.Shimizu M., Roth,S.Y., Szent-Gyorgyi,C. and Simpson,R.T. (1991) EMBO J., 10, 3033–3041 [DOI] [PMC free article] [PubMed] [Google Scholar]
- 33.Wu L. and Winston,F. (1997) Nucleic Acids Res., 25, 4230–4234 [DOI] [PMC free article] [PubMed] [Google Scholar]
- 34.Hayes J.J. and Wolfe,A.P. (1993) Proc. Natl Acad. Sci. USA, 90, 6475–6419. [Google Scholar]
- 35.Hayes J.J. (1996) Biochemistry, 35, 11931–11937. [DOI] [PubMed] [Google Scholar]
- 36.Pruss D., Bartholomew,B., Presinger,B., Hayes,J. Arents,G., Moudrianakis,N. and Wolfe,A.P. (1996) Science, 274, 614–617. [DOI] [PubMed] [Google Scholar]
- 37.An W., Leuba,S.H., van Holde,K. and Zlatanova,J. (1998) Proc. Natl Acad. Sci. USA, 95, 3396–3401. [DOI] [PMC free article] [PubMed] [Google Scholar]
- 38.Zhou Y.-B., Gerchman,S.E., Ramakrishnan,V., Travers,A. and Muyldermans,S. (1998) Nature, 395, 402–405 [DOI] [PubMed] [Google Scholar]
- 39.Bednar J., Horowitz,R.A, Dubochet,J. and Woodcock,C.L. (1995) J. Cell Biol., 131, 1365–1376. [DOI] [PMC free article] [PubMed] [Google Scholar]
- 40.Leuba S.H., Yang,G., Robert,C., Samori,B., van Holde,K., Zlatanova,J. and Bustamante,C. (1994) Proc. Natl Acad. Sci. USA, 91, 11621–11625. [DOI] [PMC free article] [PubMed] [Google Scholar]
- 41.Bordas J., Perez-Grau,L., Koch,M.H.J., Vega,M.C. and Nave,C. (1986) Eur. Biophys. J., 13, 157–173. [DOI] [PubMed] [Google Scholar]
- 42.Bordas J., Perez-Grau,L., Koch,M.H.J., Vega,M.C. and Nave,C. (1986) Eur. Biophys. J., 13, 175–185. [DOI] [PubMed] [Google Scholar]
- 43.Williams S.P., Athey,B.D., Muglia,L.J., Schappe,R.S. Gough,A.H. and Langmore,J.P. (1986) Biophys. J., 49, 233–248. [DOI] [PMC free article] [PubMed] [Google Scholar]
- 44.Gerchman S.E. and Ramakrishnan,V. (1987) Proc. Natl Acad. Sci. USA, 84, 7802–7806. [DOI] [PMC free article] [PubMed] [Google Scholar]
- 45.Smith M.F., Athey,B.D., Williams,S.P. and Langmore,J.P. (1990) J. Cell Biol., 110, 245–254. [DOI] [PMC free article] [PubMed] [Google Scholar]
- 46.Graziano V., Gerchman,S.E., Schneider,D.K. and Ramakrishnan,V. (1994) Nature, 368, 351–354. [DOI] [PubMed] [Google Scholar]
- 47.Thoma F., Koller,Th. and Klug,A. (1979) J. Cell Biol., 83, 403–427. [DOI] [PMC free article] [PubMed] [Google Scholar]
- 48.Butler P.J.G. and Thomas,J.O. (1998) J. Mol. Biol., 281, 401–407. [DOI] [PubMed] [Google Scholar]
- 49.Prunell A. (1998) Biophys. J., 74, 2531–2544. [DOI] [PMC free article] [PubMed] [Google Scholar]
Associated Data
This section collects any data citations, data availability statements, or supplementary materials included in this article.


