Abstract
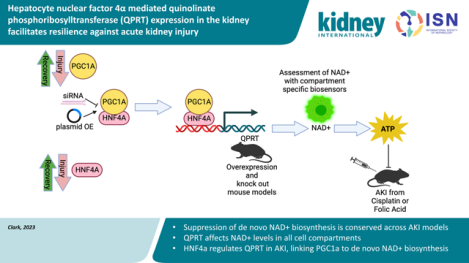
Nicotinamide adenine dinucleotide (NAD+) levels decline in experimental models of acute kidney injury (AKI). Attenuated enzymatic conversion of tryptophan to NAD+ in tubular epithelium may contribute to adverse cellular and physiological outcomes. Mechanisms underlying defense of tryptophan-dependent NAD+ production are incompletely understood. Here we show that regulation of a bottleneck enzyme in this pathway, quinolinate phosphoribosyltransferase (QPRT) may contribute to kidney resilience. Expression of QPRT declined in two unrelated models of AKI. Haploinsufficient mice developed worse outcomes compared to littermate controls whereas novel, conditional gain-of-function mice were protected from injury. Applying these findings, we then identified hepatocyte nuclear factor 4 alpha (HNF4α) as a candidate transcription factor regulating QPRT expression downstream of the mitochondrial biogenesis regulator and NAD+ biosynthesis inducer PPARgamma coactivator-1-alpha (PGC1α). This was verified by chromatin immunoprecipitation. A PGC1α - HNF4α -QPRT axis controlled NAD+ levels across cellular compartments and modulated cellular ATP. These results propose that tryptophan-dependent NAD+ biosynthesis via QPRT and induced by HNF4α may be a critical determinant of kidney resilience to noxious stressors.
Keywords: Acute Kidney Injury, HNF4α, metabolism, NAD
Graphical Abstract
TRANSLATIONAL STATEMENT
Understanding the molecular mechanisms of AKI will be critical to the development of AKI therapies. The present study highlights the conserved significance of de novo NAD+ biosynthesis suppression in AKI and proposes HNF4α as a novel transcription linking PGC1α to de novo NAD+ biosynthesis. This metabolic axis and the downstream effects of NAD+ metabolism and HNF4α target genes in renal tubule cells may represent actionable therapeutic targets for AKI management.
INTRODUCTION
Acute kidney injury (AKI) affects roughly 20–25% of hospitalized children and adults and is associated with substantial morbidity and mortality.1,2 Normal renal tubule function requires efficient adenosine triphosphate (ATP) generation, and impairment in renal energy metabolism is a key feature of AKI.3 Nicotinamide adenine dinucleotide (NAD+) is a critical electron receptor required for ATP production. Reduction of NAD+ becomes rate-limiting for ATP production.4 During AKI, degradation of cellular NAD+ is upregulated and, maladaptively, NAD+ biosynthesis is attenuated.5–9 Suppression of NAD+ biosynthesis, particularly the de novo pathway of NAD+ biosynthesis from tryptophan, has been described as an element of AKI in experimental models and humans.7,10,8,11,12 Specifically, the bottleneck enzyme of de novo NAD+ biosynthesis, quinolinate phosphoribosyltransferase (QPRT), is suppressed in post-ischemic kidney injury.7 Despite existence of alternate NAD+ biosynthetic pathways, QPRT+/− mice exhibit reduced basal kidney NAD+, reduced basal kidney ATP, and increased susceptibility to post-ischemic AKI.7
We have previously shown that QPRT is regulated by PPARgamma coactivator 1 alpha (PGC1α), a transcriptional co-activator known to regulate diverse genes involved in energy metabolism, mitochondrial biogenesis, and mitochondrial quality control.13–18 PGC1α is suppressed in renal injury with resultant decreases in NAD+ and ATP; furthermore, reduced PGC1α exacerbates AKI.13–17 Conversely, induction of PGC1α protects mice from post-ischemia injury, cisplatin injury, and experimental renal fibrosis.13,14,18,19 A transcription factor linking PGC1α to NAD+ biosynthesis has yet to be identified.
Hepatocyte nuclear factor 4 alpha (HNF4α) is a nuclear receptor and transcription factor that regulates genes associated with lipid metabolism, glucose metabolism, and cellular differentiation. In the liver, HNF4α modulates insulin responsiveness, with HNF4α loss of function mutations leading to mature onset diabetes of the young (MODY) Impaired HNF4α activity has also been linked to non-alcoholic fatty liver disease,20,21 inflammation,22 fibrosis, and cirrhosis.23 HNF4α is also critical for hepatocyte differentiation from stem lineages.24 In the developing kidney, HNF4α is necessary for proximal tubular cell differentiation from progenitor cells.25 In the adult kidney, HNF4α expression and enhancer binding is decreased in acute injury.26,27 Re-expression of HNF4α appears to be a marker and requirement of cellular repair.27,28 However, little is known about HNF4α-mediated metabolism in the healthy kidney or its role in kidney cellular injury.
We hypothesized that de novo NAD+ biosynthesis -- the tryptophan pathway of NAD+ biosynthesis -- suppression would be a consistent feature of toxic AKI. We further hypothesized that augmented kidney QPRT expression would be sufficient to protect against toxic insults. Finally, we tested whether HNF4α is an essential transcription factor that regulates renal NAD+ biosynthesis via QPRT modulation, thus implicating HNF4α in metabolic resilience against AKI.
METHODS
Mouse Models
All experiments were conducted in compliance with the NIH Guide for the Care and Use of Laboratory Animals and approved by an institutional animal care and use committee (IACUC). QPRT +/− mice were previously described.7 iNephQPRT mice were generated by crossing a Pax8-rtTA mice (Jax #007176)29 to a custom tetO-QPRT mouse. The tetO-QPRT mouse was generated by cloning mouse QPRT cDNA into a pBT264 plasmid, which was digested with PvuI and PciI and microinjected into C57bl/6J zygotes. Genotyping was performed with Transnetyx. Experimental animals were bred to be hemizygous for both the Pax8-rtTA and the tetO-QPRT transgenes. Siblings carrying only the tetO-QPRT transgene were used as controls. Overexpression was induced via delivery of doxycycline (Fisher Scientific) in the water (0.2mg/mL+ 5% dextrose)30 or chow (Teklad 625mg/kg) offered ad lib. Doxycycline was started at the time of injury and continued until sacrifice for both iNephQPRT mice and controls. iNephPGC1α (Pax8-rtTA, tetO-PGC1α) mice were previously described.14
Cisplatin nephrotoxicity was induced via a single intraperitoneal (IP) injection of cisplatin (Aldrich) 25mg/kg in normal saline. Animals were harvested at 72 hours. Folic acid AKI was generated by an IP injection of folic acid (Fisher) 250mg/kg dissolved in 0.3M sodium bicarbonate. Animals were harvested at 24 hours. Mice were randomly assigned to injury groups or vehicle. Mice were bred, cared for, and injected in the temperature-controlled animal facility at University of Texas Southwestern. To reduce confounding, study mice and controls were injected simultaneously. Only 8–12-week-old male mice were used as trials in females resulted in excessive mortality. Experimental groups of 25 mice were planned to detect p-value of 0.05 based on preliminary data suggesting an average BUN of 150 ± 75 in the study group and an average of 90 in controls after AKI. Actual data showed more variability than predicted, so additional mice were added to reach statistical significance. With both injury models, <10% of mice required humane euthanasia due to severe injury before the endpoint based on an objective measure of pain and distress used by University of Texas Southwestern IACUC. Those animals were excluded from endpoint analysis. There was no difference in euthanized mice between experimental groups. All animals that survived to the endpoint were included in final analyses.
Metabolomics
Metabolomics were performed on whole kidney lysate performed by Metabolon. In brief, proteins were precipitated with methanol followed by centrifugation. The resulting extract was divided into five fractions: two for analysis by two separate reverse phase (RP)/UPLC-MS/MS methods with positive ion mode electrospray ionization (ESI), one for analysis by RP/UPLC-MS/MS with negative ion mode ESI, one for analysis by HILIC/UPLC-MS/MS with negative ion mode ESI, and one sample was reserved for backup. Raw data were extracted, peak-identified, and QC processed using Metabolon’s hardware and software. Compounds were identified by comparison to a maintained library of known compounds based on retention time/ index, mass to charge ratio, and chromatographic data. Peaks were quantified using area under the cure.
RT-qPCR and biochemical assays.
For cell and animal experiments, RNA was isolated from cell or tissue lysate using Bio-Rad Aurum Total RNA Mini Kit. cDNA was made using Bio-rad iScript Advanced cDNA Synthesis Kit. qPCR was performed using SYBR green, and the listed primers (Supplementary Table S1). BUN was measured using a colorimetric assay (Invitrogen). Serum creatinine was measured using capillary electrophoresis at the University of Texas Southwestern renal physiology core. ATP was measured using a luminescent assay (Abcam).
Histopathology
Kidneys were placed in formalin at the time of harvest. Before staining and paraffin embedded before staining. Serial sections were obtained by rotary microtome at 5um thickness. PAS staining was performed manually by the Research Histo Pathology Core at the University of Texas Southwestern. Injury scoring was performed by a blinded pathologist or by two blinded physicians and averaged. Tubular injury was defined as denudation of the renal tubular cells, loss of brush border, tubular dilation, intratubular casts, and cell sloughing with the following scoring system, 0 = no evidence, 1 = <10% involved, 2 = 10–25% involved, 3 = 25–50% involved, 4 = 50–75% involved, and 5 = >75%involved.
Cell models
Unless otherwise specified cell experiments were conducted in HK2 (ATCC), an immortalized human proximal tubule cell line at an early passage grown in DMEM with 10% fetal bovine serum (FBS). PGC1α or HNF4α overexpression was induced using plasmids from Addgene as gifts from Toren Finkel (#10974)31 and Gerhart Ryffel (#31100).32 QPRT plasmid was purchased from Origene (RC202960). Plasmids were transfected using Lipofectamine 3000 (Invitrogen). siRNA knockdowns were performed using pre-made siRNA smartpools (Horizon) and transfected with siRNAiMax (Invitrogen). Supplemental studies were conducted in immortalized pig proximal tubule cells (LLC-PK1) (ATCC) grown in Medium 199 with 3% FBS. A stable PGC1α cell line was created by infecting LLC-PK1 cells with a previously published lentivirus18 followed by selection with puromycin.
NAD+ Biosensors
Biosensor plasmids were a gift from Dr. Richard Goodman.33 Sensors were transfected into cells using Lipofectamine 3000. Cells with sensors were imaged using confocal microscopy at both an NAD+ responsive 488nm excitation and a non-NAD+ responsive internal control that excited at 405nm. Relative NAD+ was quantified using Image J software to calculate the ratio of 488 fluorescence to 405 fluorescence per cell. Values were normalized to empty vector control cells. Results are displayed as the inverse of the fluorescence calculation so that higher values correlate with increased NAD+ abundance.
ChIP qPCR
Chromatin immunoprecipitation (ChIP) was performed on kidney lysate from iNephPGC1α mice using the EpiQuik Tissue Chromatin Immunoprecipitation Kit. Tissue was crosslinked in 1% formaldehyde and mechanically disrupted using a cell strainer. Cells were lysed and chromatin was sheared using sonication. Immunoprecipitation was accomplished using plate based-beads in the EpiQuik Kit along with HNF4α antibodies (Novus NB100–1783 and Abcam ab181604) to validate enrichment at QPRT. Comparison between iNephPGC1α and control kidneys used Abcam antibody alone. Anti-goat non-immune IgG was used as a non-targeting control. QPRT qPCR was completed using SYBR green mouse QPRT gDNA primers (Supplemental TableS1).
Statistical Analysis and Blinding
Correlations were assessed using simple linear regression. Continuous variables were compared using Mann-Whitney test. Multiple group comparisons were compared using Kruskal-Wallis test. All statistics were completed using Prism 9 software. A p-value less than 0.05 was considered statistically significant. All experiments using animal tissue were completed by investigators who were blinded to the animals’ treatment groups.
RESULTS
In a cisplatin model of AKI, unbiased metabolic profiling of injured and control kidney tissue (Supplemental Table S2) identified accumulation of de novo NAD+ biosynthetic intermediates, reduction of NAD+ itself, and reduction of metabolites arising from NAD+ degradation (Fig1 A–C). Semiquantitative qPCR confirmed suppression of NAD+ biosynthesis enzymes (Fig 1D) in cisplatin-treated kidneys. Among these, the suppression of QPRT was most marked. Given the heterogeneity of functional impairment in the cisplatin model, we evaluated the proportionality of QPRT expression with injury severity. Indeed, QPRT was proportionally suppressed to injury severity as quantified by several readouts: LCN2 kidney mRNA, BUN, and serum creatinine (Fig 1E–F). To understand if this phenomenon may also apply to females, we analyzed a published dataset of spatially resolved kidney transcriptomics from female mice with ischemia reperfusion injury.34 There, QPRT was suppressed during peak injury and recovered as the injury resolved in an opposite pattern to the injury marker LCN2. (Supplemental Fig S1A,C)
Figure 1: De novo NAD+ Biosynthesis suppression is a component of nephrotoxic AKI.
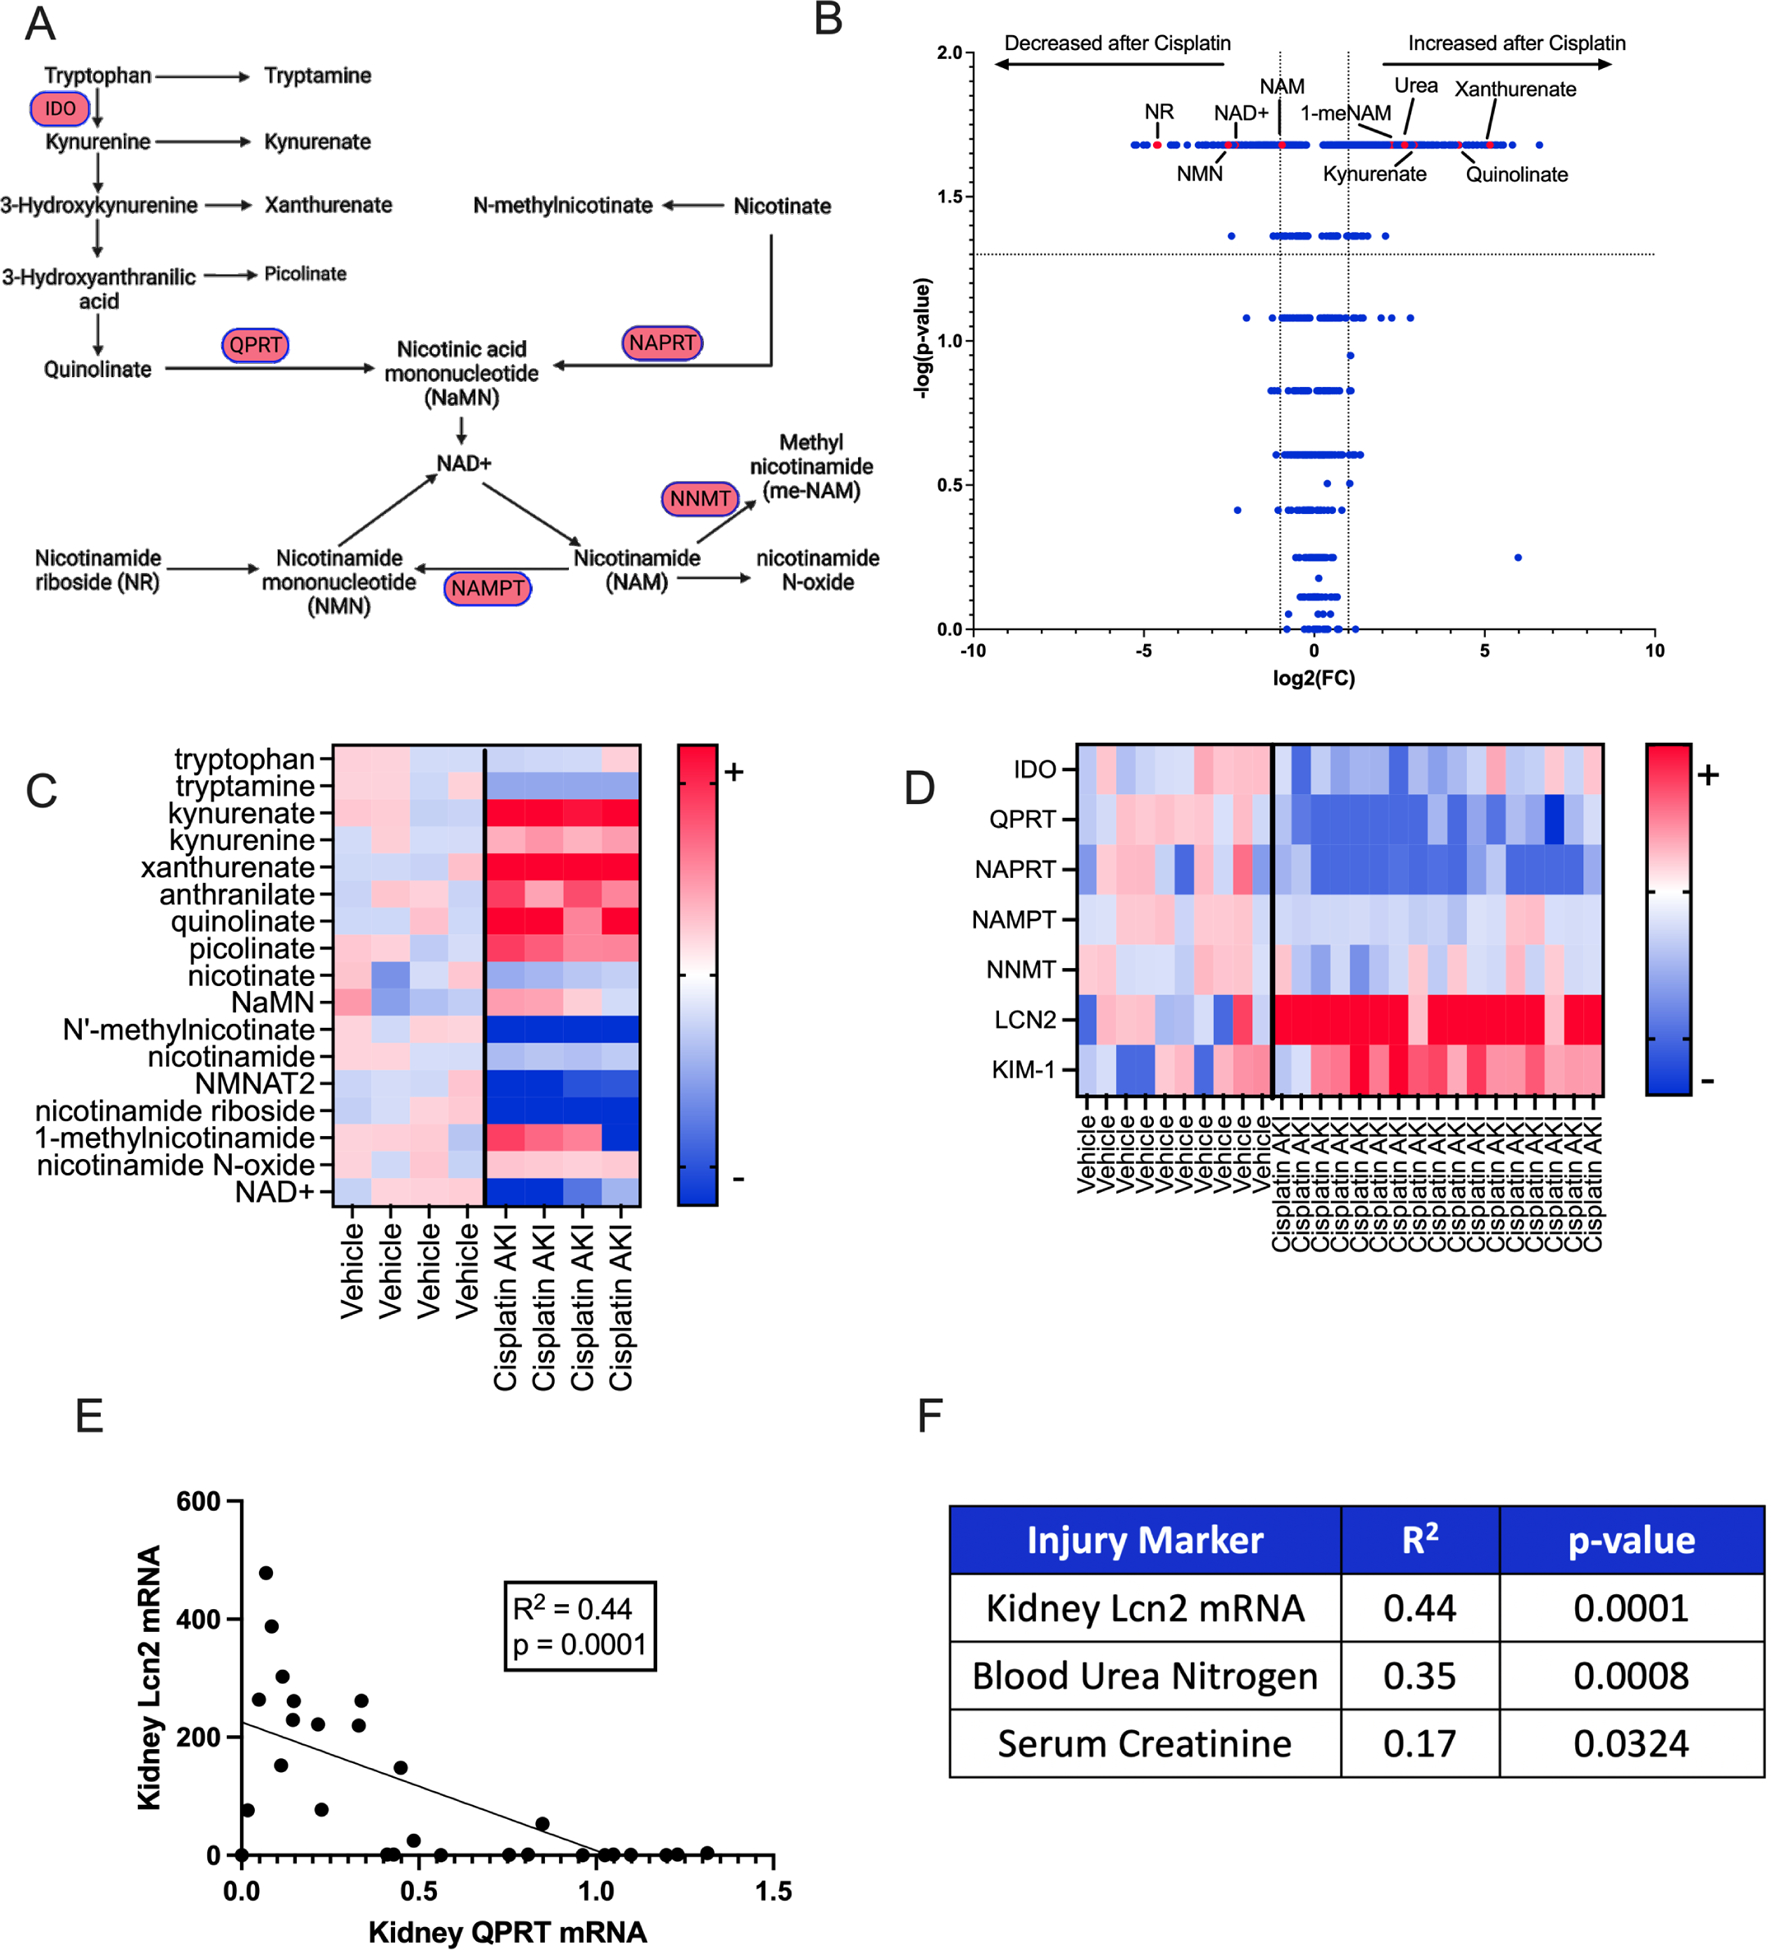
a. Schema of NAD+ Biosynthesis. b. Volcano plot of mouse kidney metabolites from mice that received cisplatin or vehicle. P-values calculated using Mann-Whitney. Dotted lines indicate p value greater of 0.05 (horizontal) and fold change < or > 2 (vertical). c. Heat map showing individual values of selected metabolites. Values are normalized to average of vehicle animals and presented as fold change. Darkest colors indicate fold change ≥6 (red) or ≤-6 (blue). d. Heatmap representing gene expression of selected genes in WT male mice who received 25mg/kg IP cisplatin (n=17) or Vehicle (n=10). Data are normalized to the vehicle average and expressed as fold change. Darkest colors indicate fold change ≥5 (red) or ≤-5 (blue). e. Correlation of kidney QPRT expression to kidney Lcn2 expression in WT mice that received cisplatin or vehicle. Correlation and p-value calculation using a simple linear regression, f. Correlation of 3 kidney injury markers to kidney QPRT mRNA expression. Correlation and p-values calculated with simple linear regression.
Because intracellular levels of NAD+ are distinct across cellular compartments with compartment-specific actions,33 we sought to further understand the metabolic implications of QPRT suppression by assessing which cellular compartments demonstrated NAD+ modulation following manipulation of QPRT expression. We first established that QPRT plasmid or siQPRT could be transfected into cells to overexpress or suppress QPRT expression, respectively (Supplemental Fig S2A–B). We then employed compartmentalized NAD+ biosensors33 to elucidate the effect of QPRT modulation on compartment-specific NAD+ levels (Fig 2A). QPRT siRNA decreased NAD+ in all cellular compartments while QPRT overexpression increased NAD+ in all cellular compartments. (Fig 2B–G, Supplemental Fig S3). QPRT siRNA reduced cellular ATP (Fig 2H) whereas QPRT overexpression increased ATP (Fig 2I) relative to control cells. This pattern mirrored PGC1α overexpression, which also increased NAD+ in all cellular compartments and increased cellular ATP (Supplemental Fig S4A–E)
Figure 2: QPRT expression mediates NAD+ and ATP.
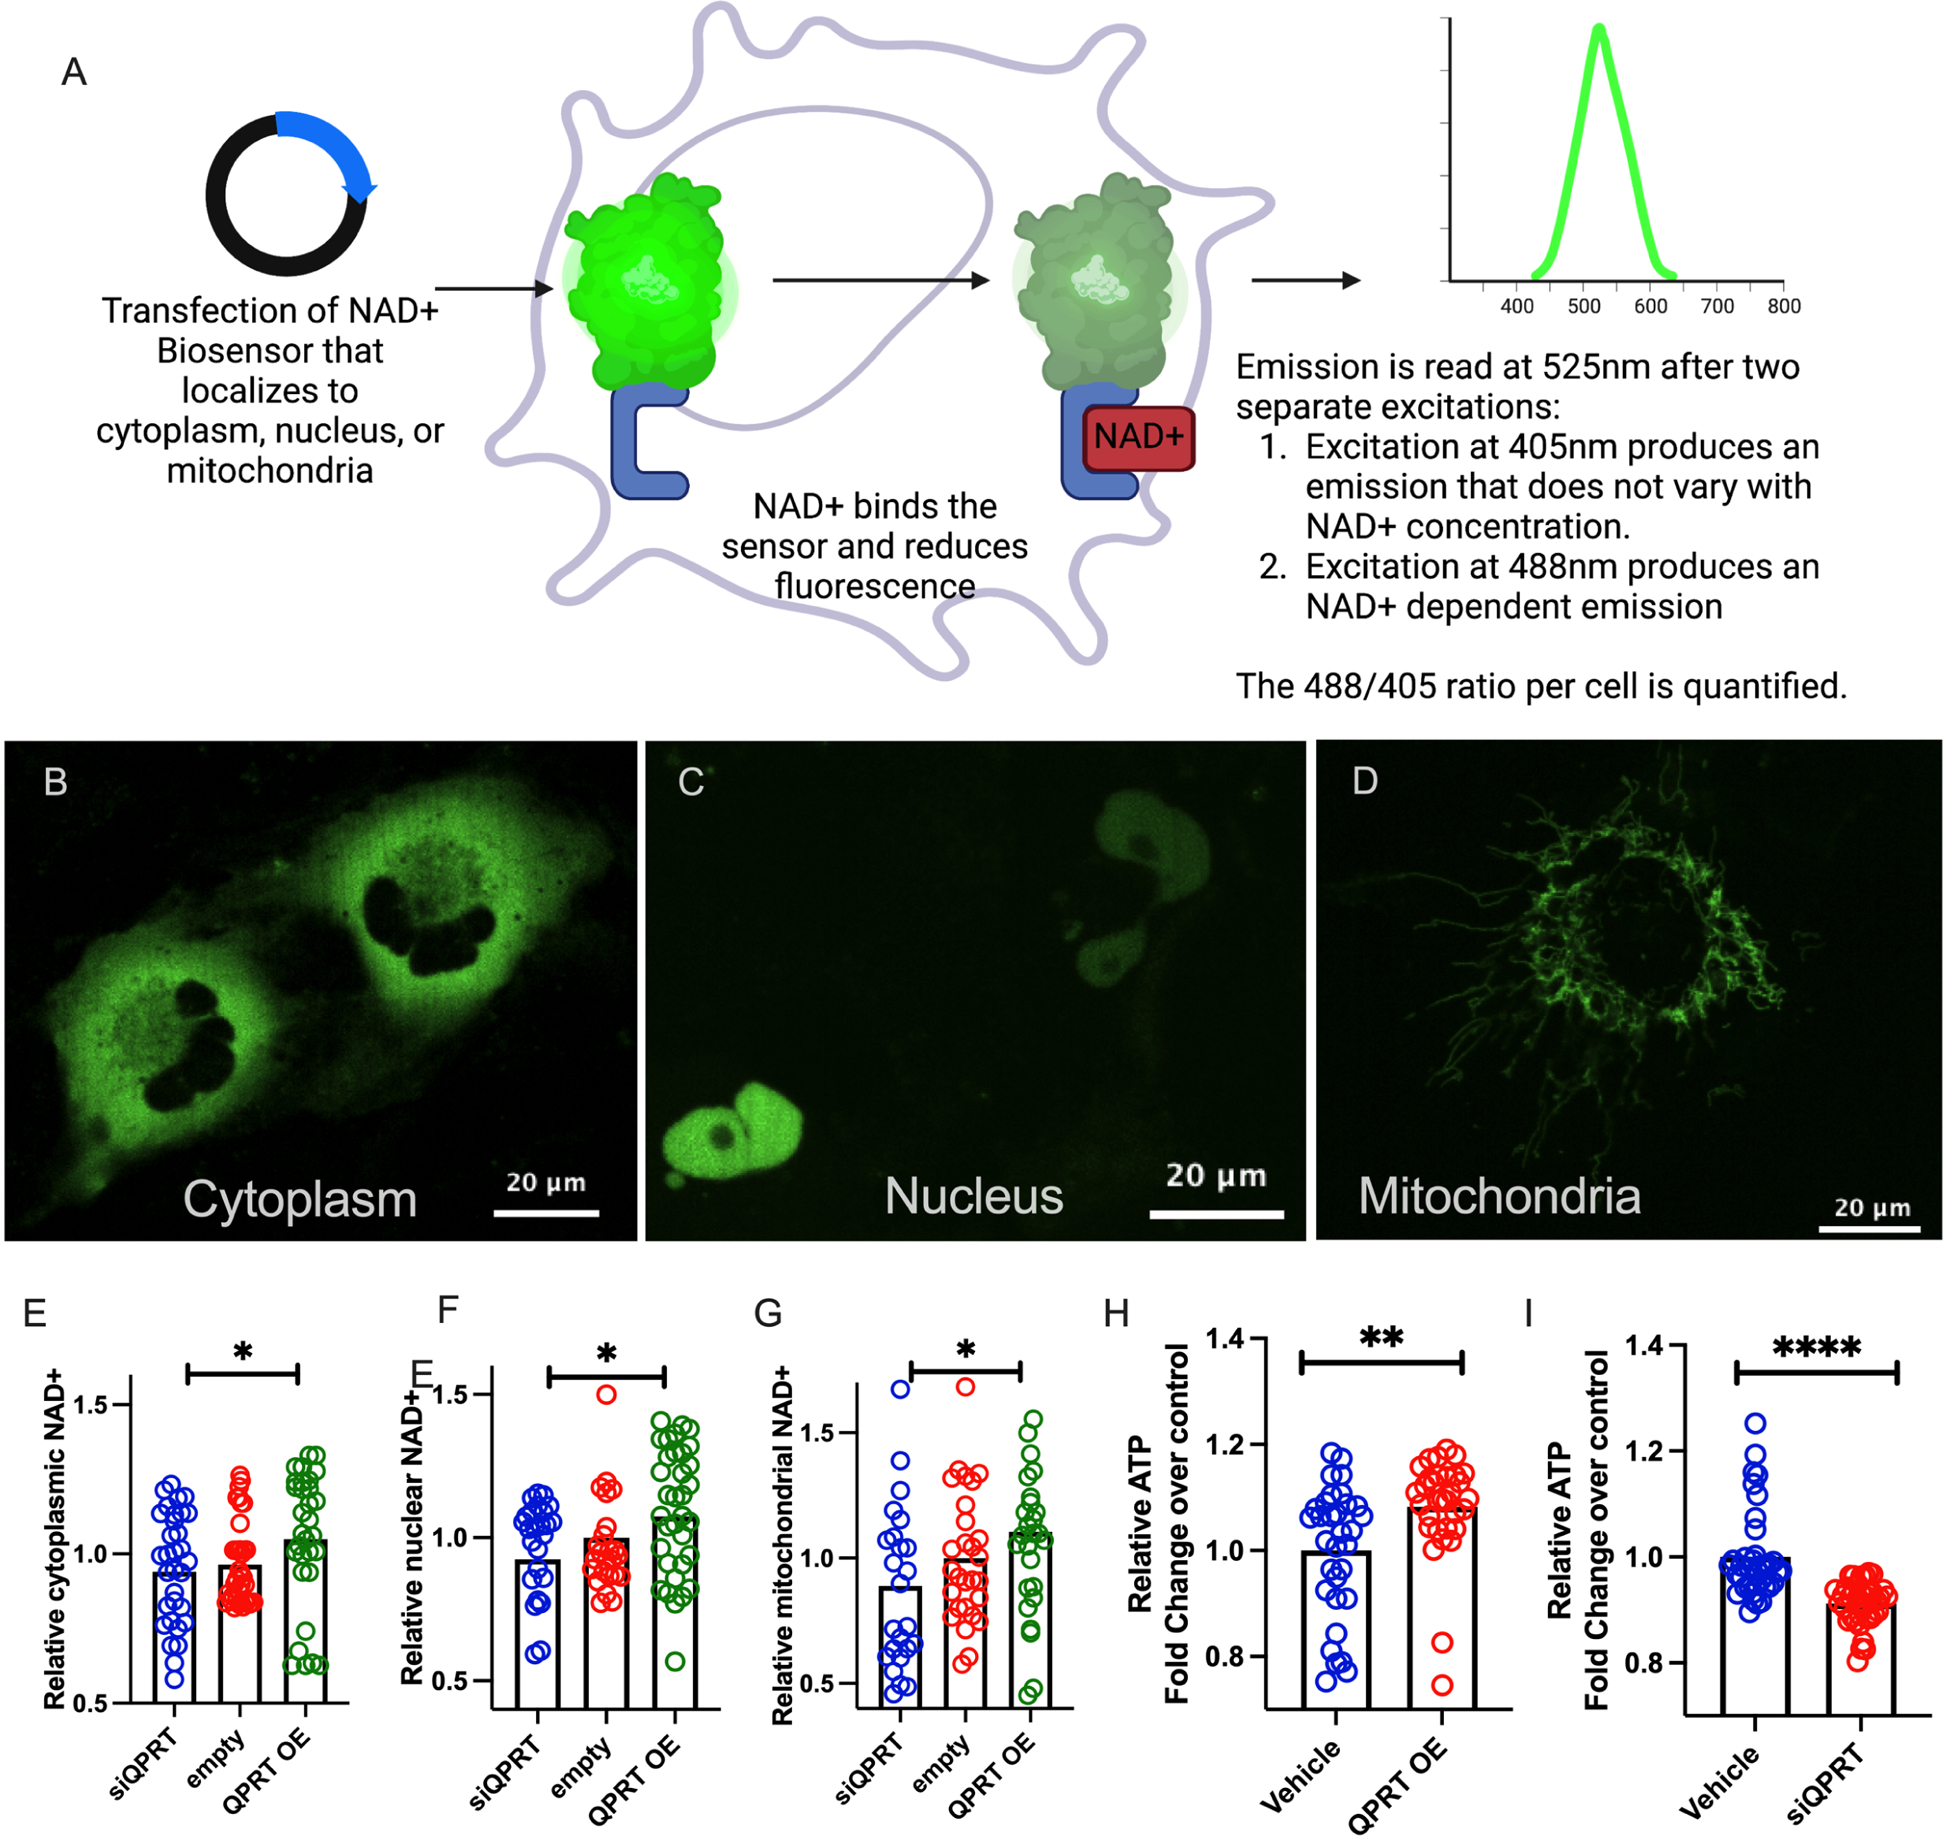
a. Schematic describing a compartment-specific NAD+ biosensor. b-d Representative images of compartment-specific NAD+ biosensor in use. Relative cytoplasmic (e), nuclear (f), and mitochondrial (g) NAD+ in QPRT overexpression (OE), control, and siQPRT knock down in HK-2 cells. h. Relative ATP in QPRT OE and Control I. Relative ATP in siQPRT and Control. P-values were calculated using Mann-Whitney. * = p<0.05, ** = p<0.01, *** = p<0.001, **** = p<0.0001.
We next evaluated the effect of distinct nephrotoxins in vivo. After cisplatin (Fig 3A), QPRT +/− mice developed higher serum creatinine (Fig 3B), higher BUN (Fig 3C), increased expression of renal LCN2 (Fig 3D), and worse histological injury (Fig 3E–F) compared to wild type littermates. Given the heterogeneity of the cisplatin AKI model, we validated the correlation of injury markers with histological scoring (Supplemental Fig S5A). In the unrelated nephrotoxicity that arises 24 hours after systemic folic acid administration (Fig 3G), QPRT is also suppressed (Supplemental Fig S5B), QPRT +/− mice demonstrated a trend toward more elevated serum creatinine (Fig 3H), increased BUN (Fig 3I), increased expression of renal LCN2 (Fig 3J), and more severe histological injury (Fig 3K–L) compared to littermate controls.
Figure 3: QPRT +/− mice are more susceptible to two distinct models of nephrotoxic AKI.
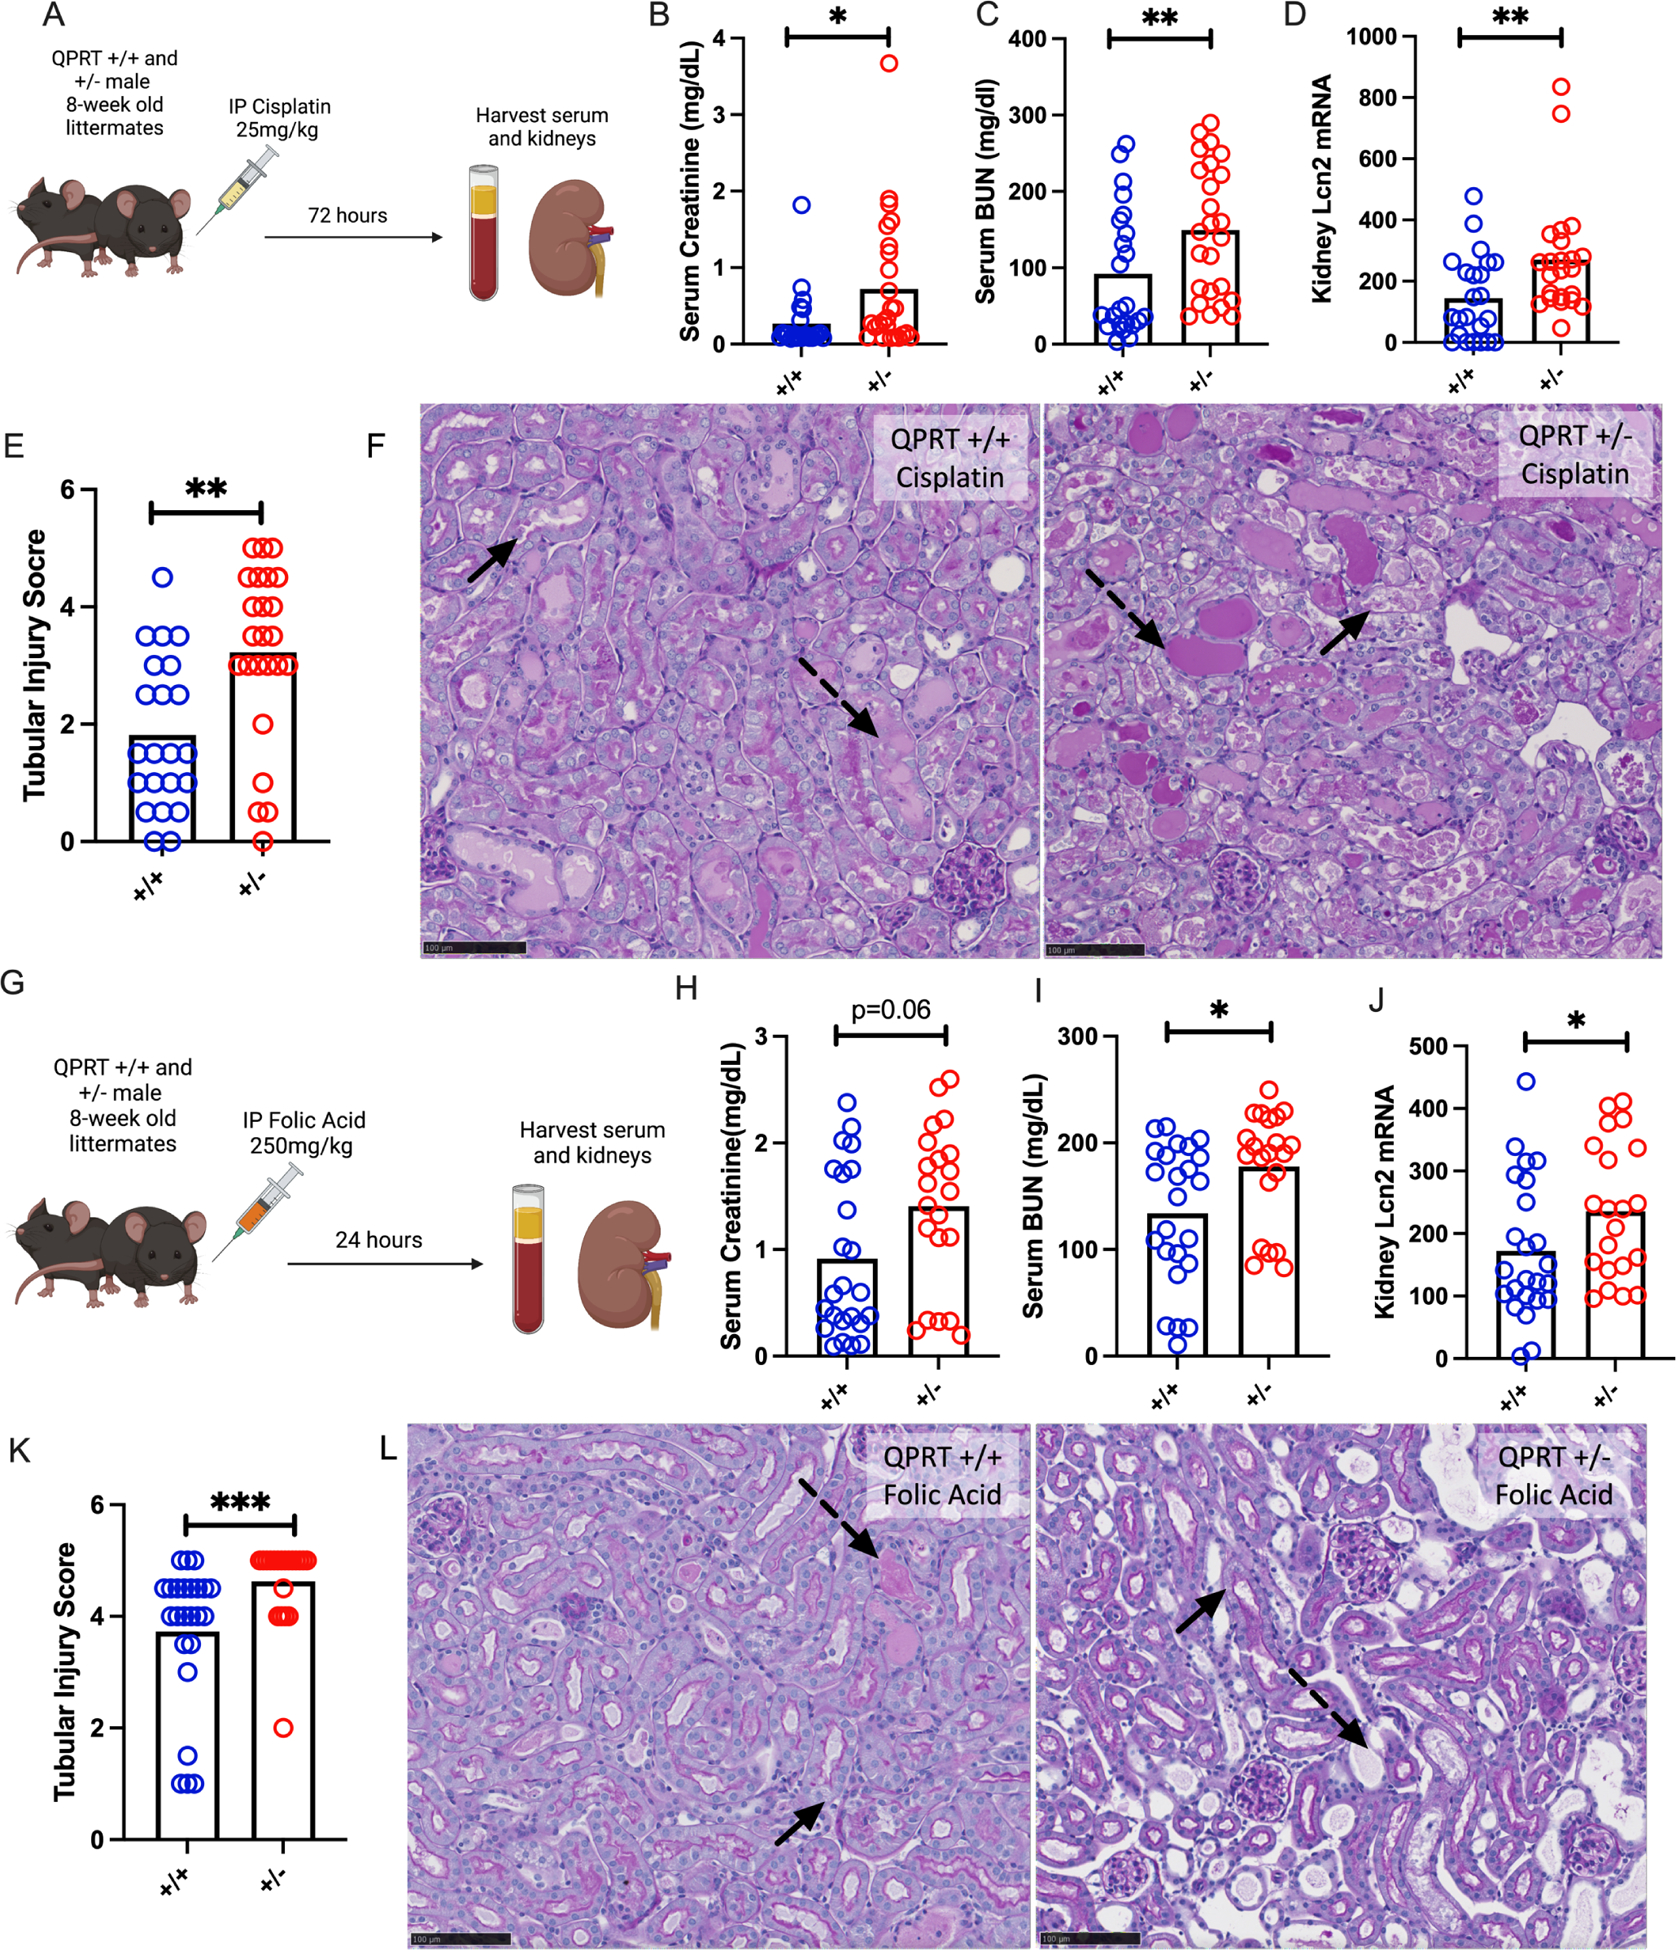
a. Schema of Cisplatin AKI experiment. b. Serum creatinine, c. serum BUN, and d. renal mRNA expression of Lcn2 after cisplatin (72 hours after 25mg/kg IP) in QPRT +/+ (n=23) and QPRT +/− (n=25) littermates. All compared with Mann-Whitney. e. Tubular injury scoring from histology. f. Representative PAS images after cisplatin. g. Schema of folic acid AKI experiment. h. Serum creatinine, i. renal mRNA expression of Lcn2, j. serum BUN, and k. tubular injury scoring after folic acid (24 hours after 250mg/kg IP) in QPRT +/+ (n=24) and QPRT +/− (n=21) littermates. l. Representative PAS images after folic acid. Dotted arrows represent dilated tubules with intratubular casts. Solid arrows represent necrotic cells and denuded tubules. Black scale bars represents 100um. * = p<0.05, ** = p<0.01, *** = p<0.001, **** = p<0.0001.
To investigate whether overcoming QPRT suppression in toxic AKI was sufficient to mitigate AKI, we generated a novel, renal tubule specific, inducible QPRT overexpression mouse (iNephQPRT) by breeding Pax8-rtTA mice to tetO-QPRT transgenic mice (Fig 4A). These animals exhibited non-leaky kidney specific overexpression of QPRT after administration of doxycycline (Supplemental Fig S5C). When given cisplatin (Fig 4B), iNephQPRT mice exhibited lower BUN (Fig 4C) and less expression of kidney LCN2 mRNA compared to control littermates. While there was no difference in serum creatinine (Fig 4E) and only a trend toward worsened histological injury (Supplemental Fig S5D), we found that the degree of renal injury inversely correlated with QPRT expression (Fig 4F). We next evaluated acute folic acid nephropathy in this QPRT gain-of-function model (Fig 4G). In this model, we used dox chow to induce overexpression to overcome any confounding introduced from the dextrose administered with dox water. Compared to controls, iNephQPRT mice developed less severe injury as measured by BUN (Fig 4H), renal LCN2 expression (Fig 4I), serum creatinine (Fig 4J), and quantification of histological injury (Fig 4K–L).
Figure 4: iNephQPRT mice are protected against two distinct models of nephrotoxic AKI.
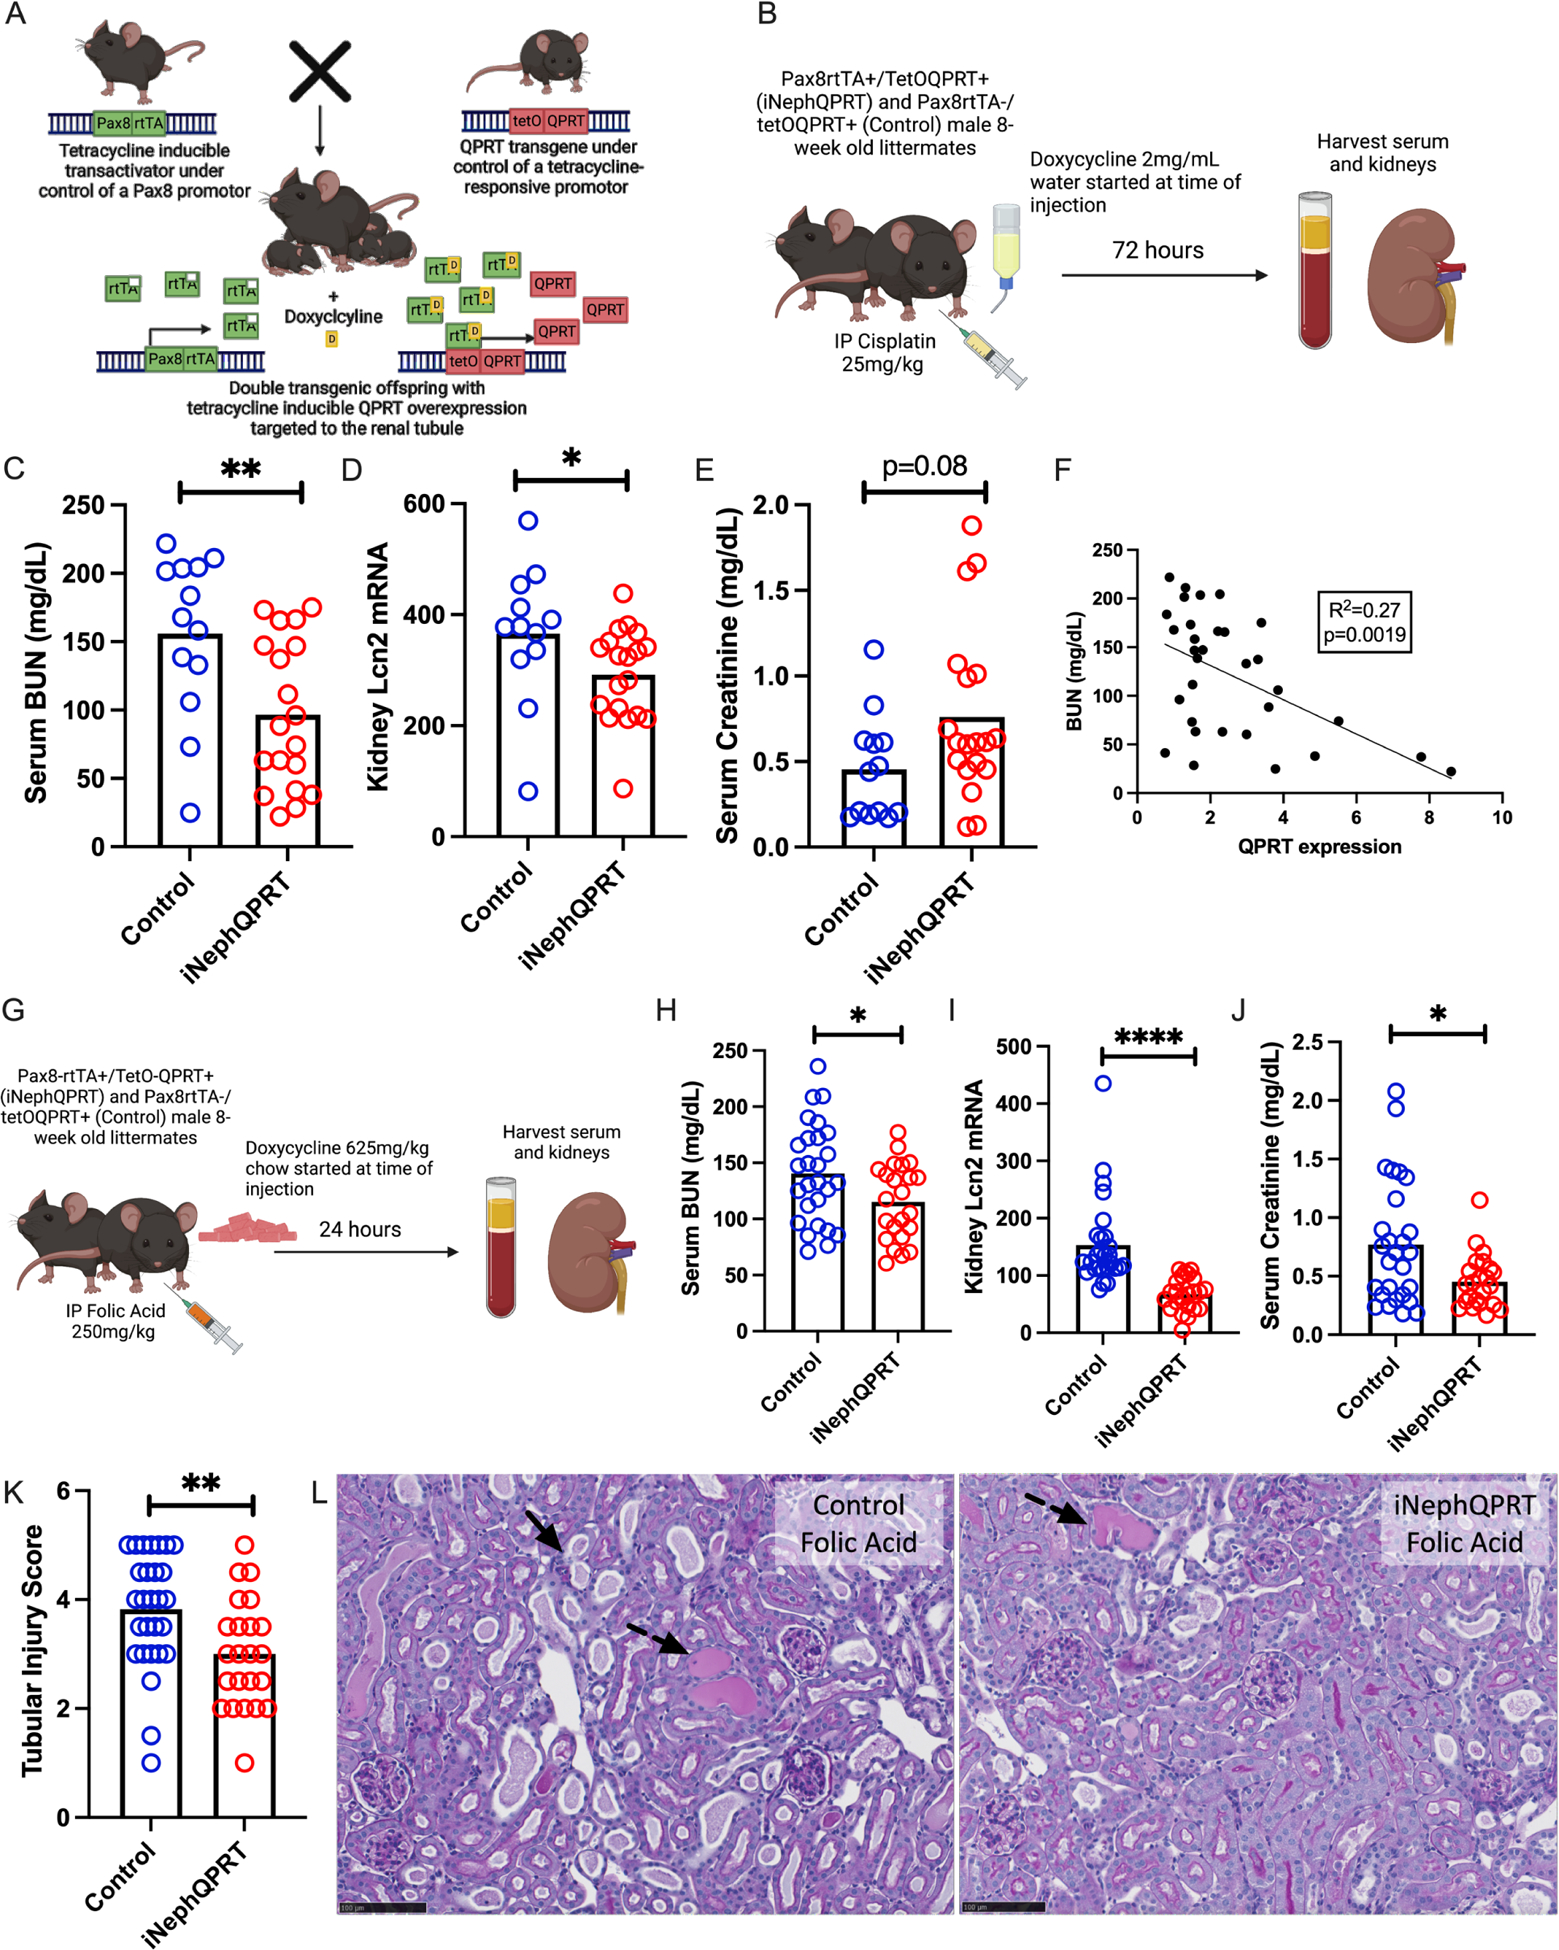
a. Schema of iNephQPRT mouse generation. b. Schema of iNephQPRT cisplatin experiment. c. Serum BUN, renal lcn2 mRNA (d), and serum creatinine (e) in iNephQPRT (n=19) and control (n=13) littermates after cisplatin (72 hours after cisplatin 25mg/kg IP). f. Correlation of serum BUN with QPRT mRNA expression. g. Schema of folic acid experiment. Serum BUN (h), renal lcn2 mRNA (i), serum creatinine (j), and tubular injury scoring after folic acid (24 hours after 250mg/kg IP) (k) in iNeph QPRT mice (n=23) and control littermates (n=27). l. Representative histology after folic acid iNephQPRT mice and controls. Dotted arrows represent dilated tubules with intratubular casts. Solid arrows represent necrotic cells and denuded tubules. Black scale bars represent 100um.* = p<0.05, ** = p<0.01, *** = p<0.001, **** = p<0.0001.
We next sought to identify transcription factor(s) through which PGC1α co-activates QPRT expression (Fig 5A). We first searched the ENCODE Transcription Factor Targets dataset for transcription factors that bind the QPRT promoter based on published ChIP-seq data.35 We next compared that list with known transcription factors that interact with PGC1α in the Human Reference Protein Interactome Mapping Project36,37 and Biogrid38 (Supplemental Table S3) The intersection identified RXRA and HNF4α as primary candidate transcription factors mediating PGC1α upregulation of QPRT gene expression. (Fig 5B). Since no RXRA loss of function mutations have been described to cause any renal phenotype in humans based on Clinvar analysis,39 and HNF4α loss of function mutations in humans can cause a renal tubulopathy phenotype, we chose to focus on HNF4α.40
Figure 5: Bioinformatic analysis proposed HNF4α as a transcription factor linking PGC1α and QPRT.
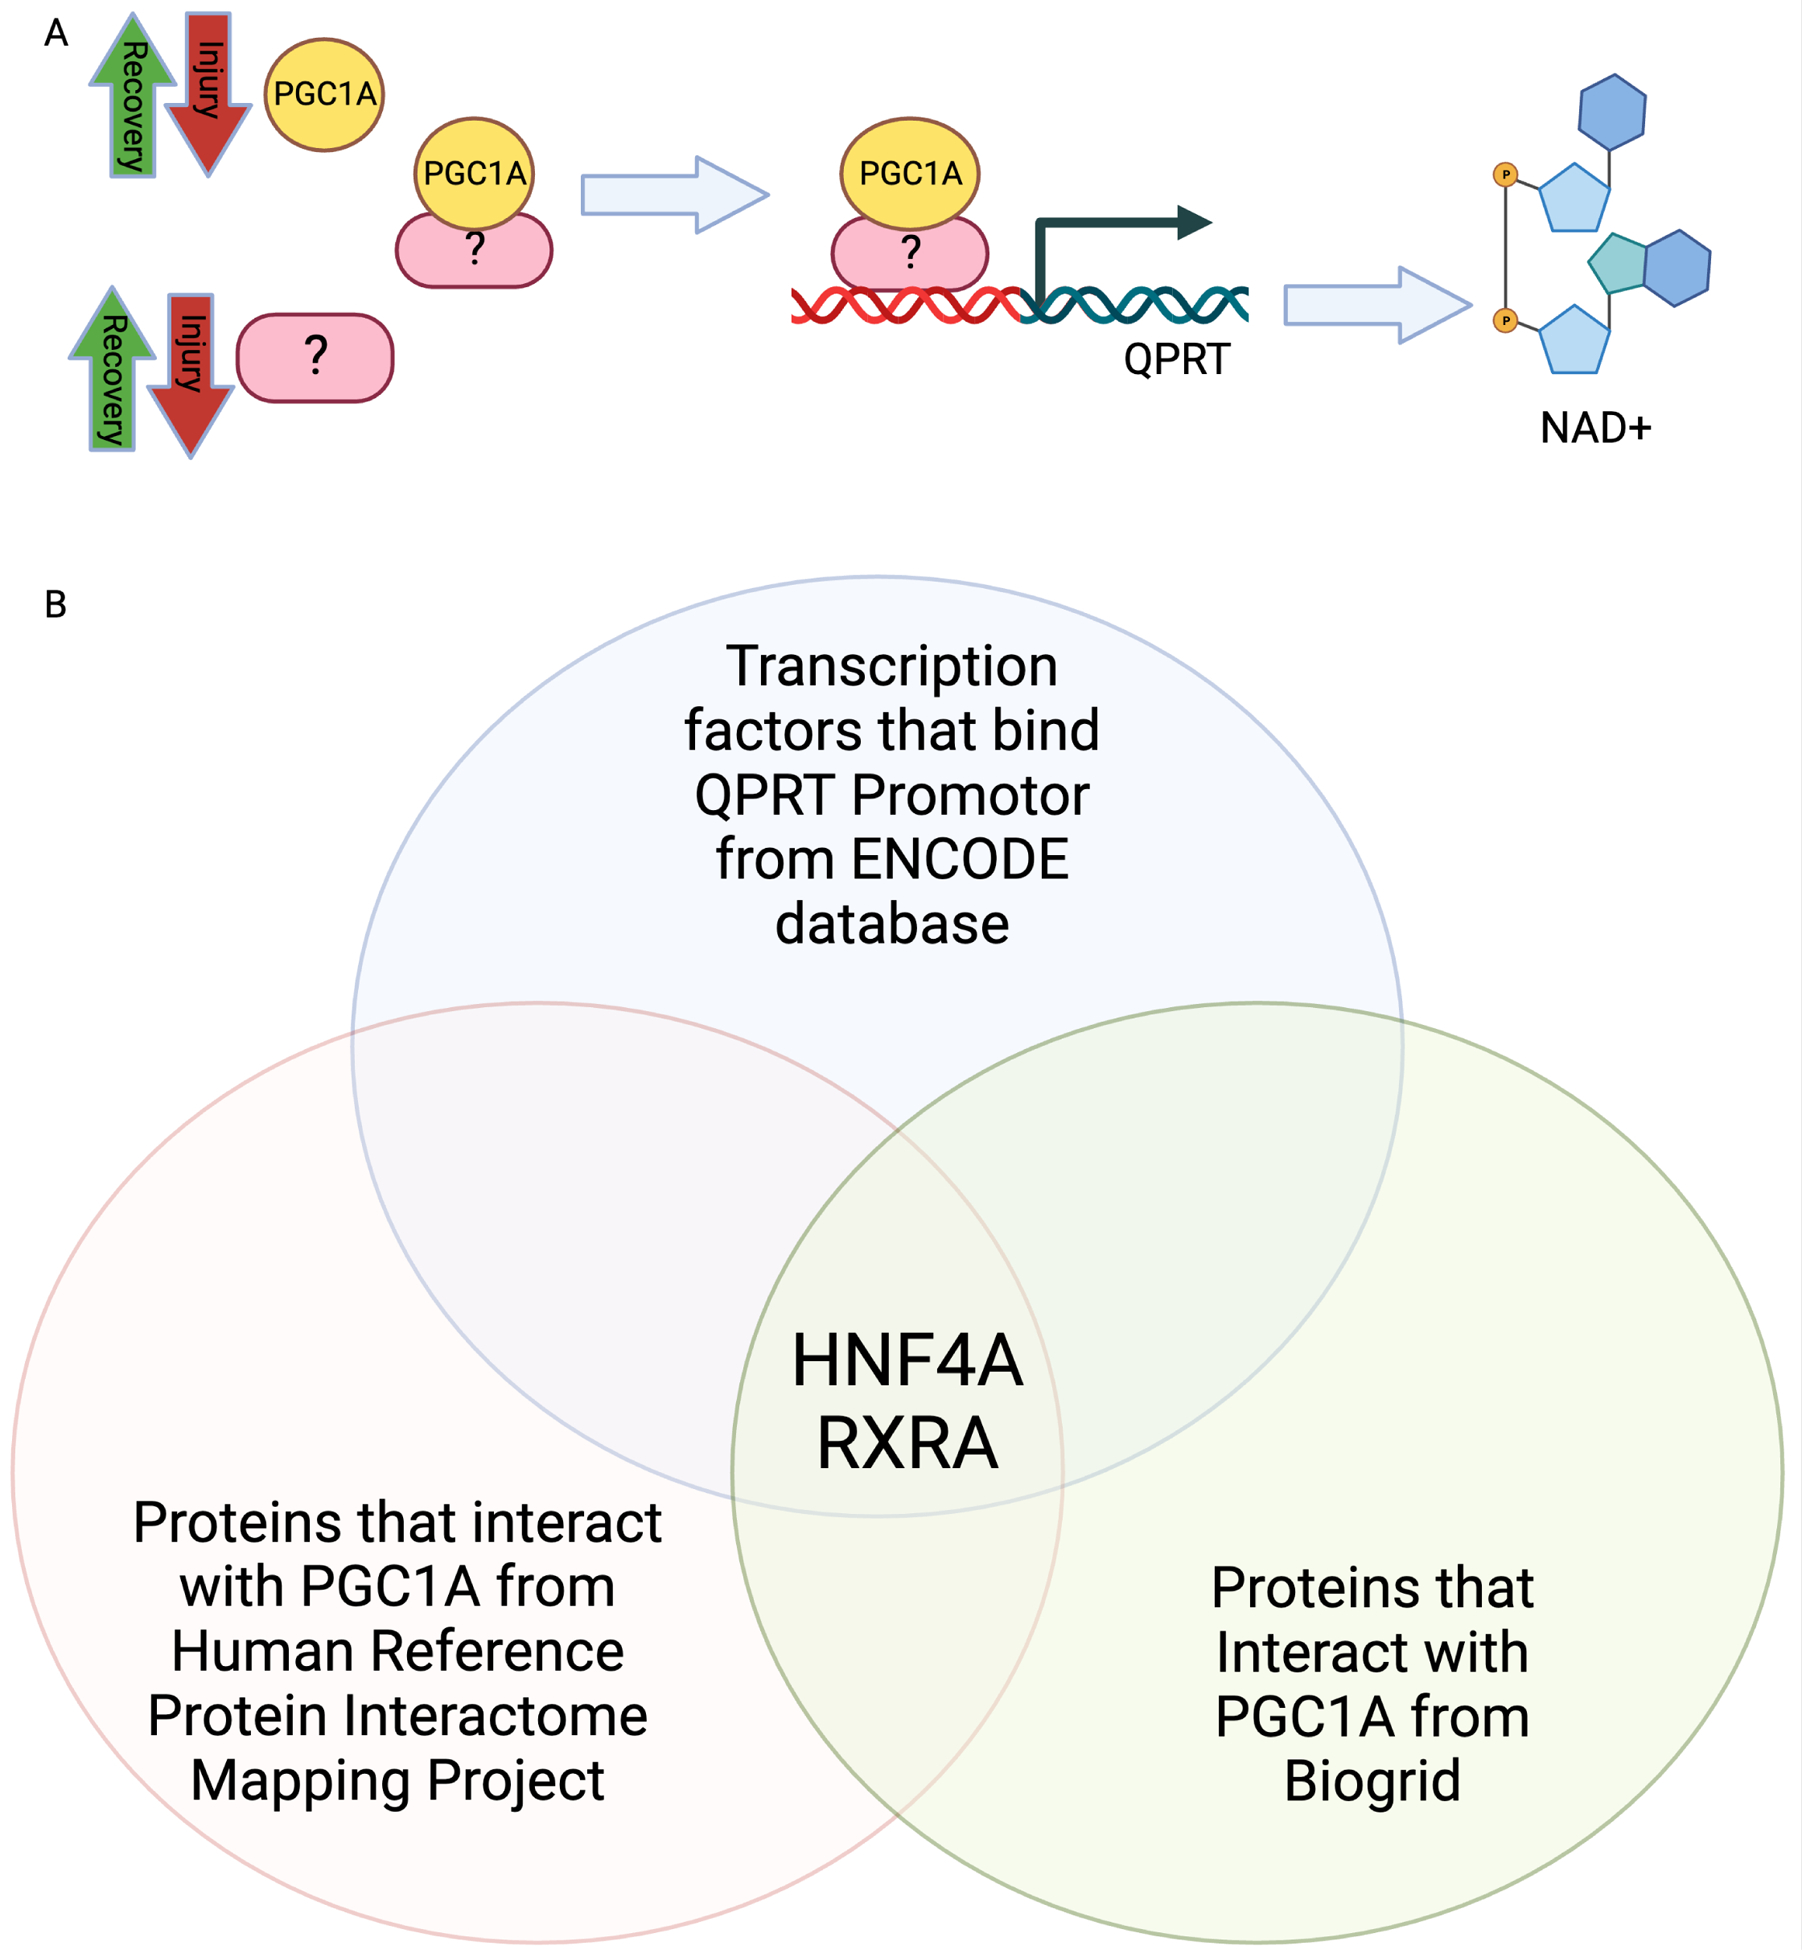
a. Schematic representing role of unknown transcription factor linking PGC1α and QPRT. b. Venn diagram comparing transcription factors known to bind QPRT with transcription factors activated by PGC1α.
Publicly available scRNASeq data of human kidney show that PGC1α is ubiquitously expressed throughout human renal tubule, but HNF4α is localized to the proximal tubule (Fig 6A).41 Likewise, enzymes of de novo NAD+ biosynthesis, including QPRT, localize to the proximal tubule, while enzymes from independent NAD+ biosynthetic pathways do not, consistent with the possibility that HNF4α may be responsible for PGC1α -dependent induction of de novo enzyme gene expression (Fig 6C). We therefore sought to determine if expression of HNF4α and QPRT were strongly linked in our models. In kidneys from wild type mice that received cisplatin, HNF4α expression correlated with QPRT expression (Fig 6C). Likewise, HNF4a expression mirrored QPRT expression in female mice after ischemia reperfusion injury (Supplemental Fig 1B).34
Figure 6: HNF4α activity mirrors QPRT activity.
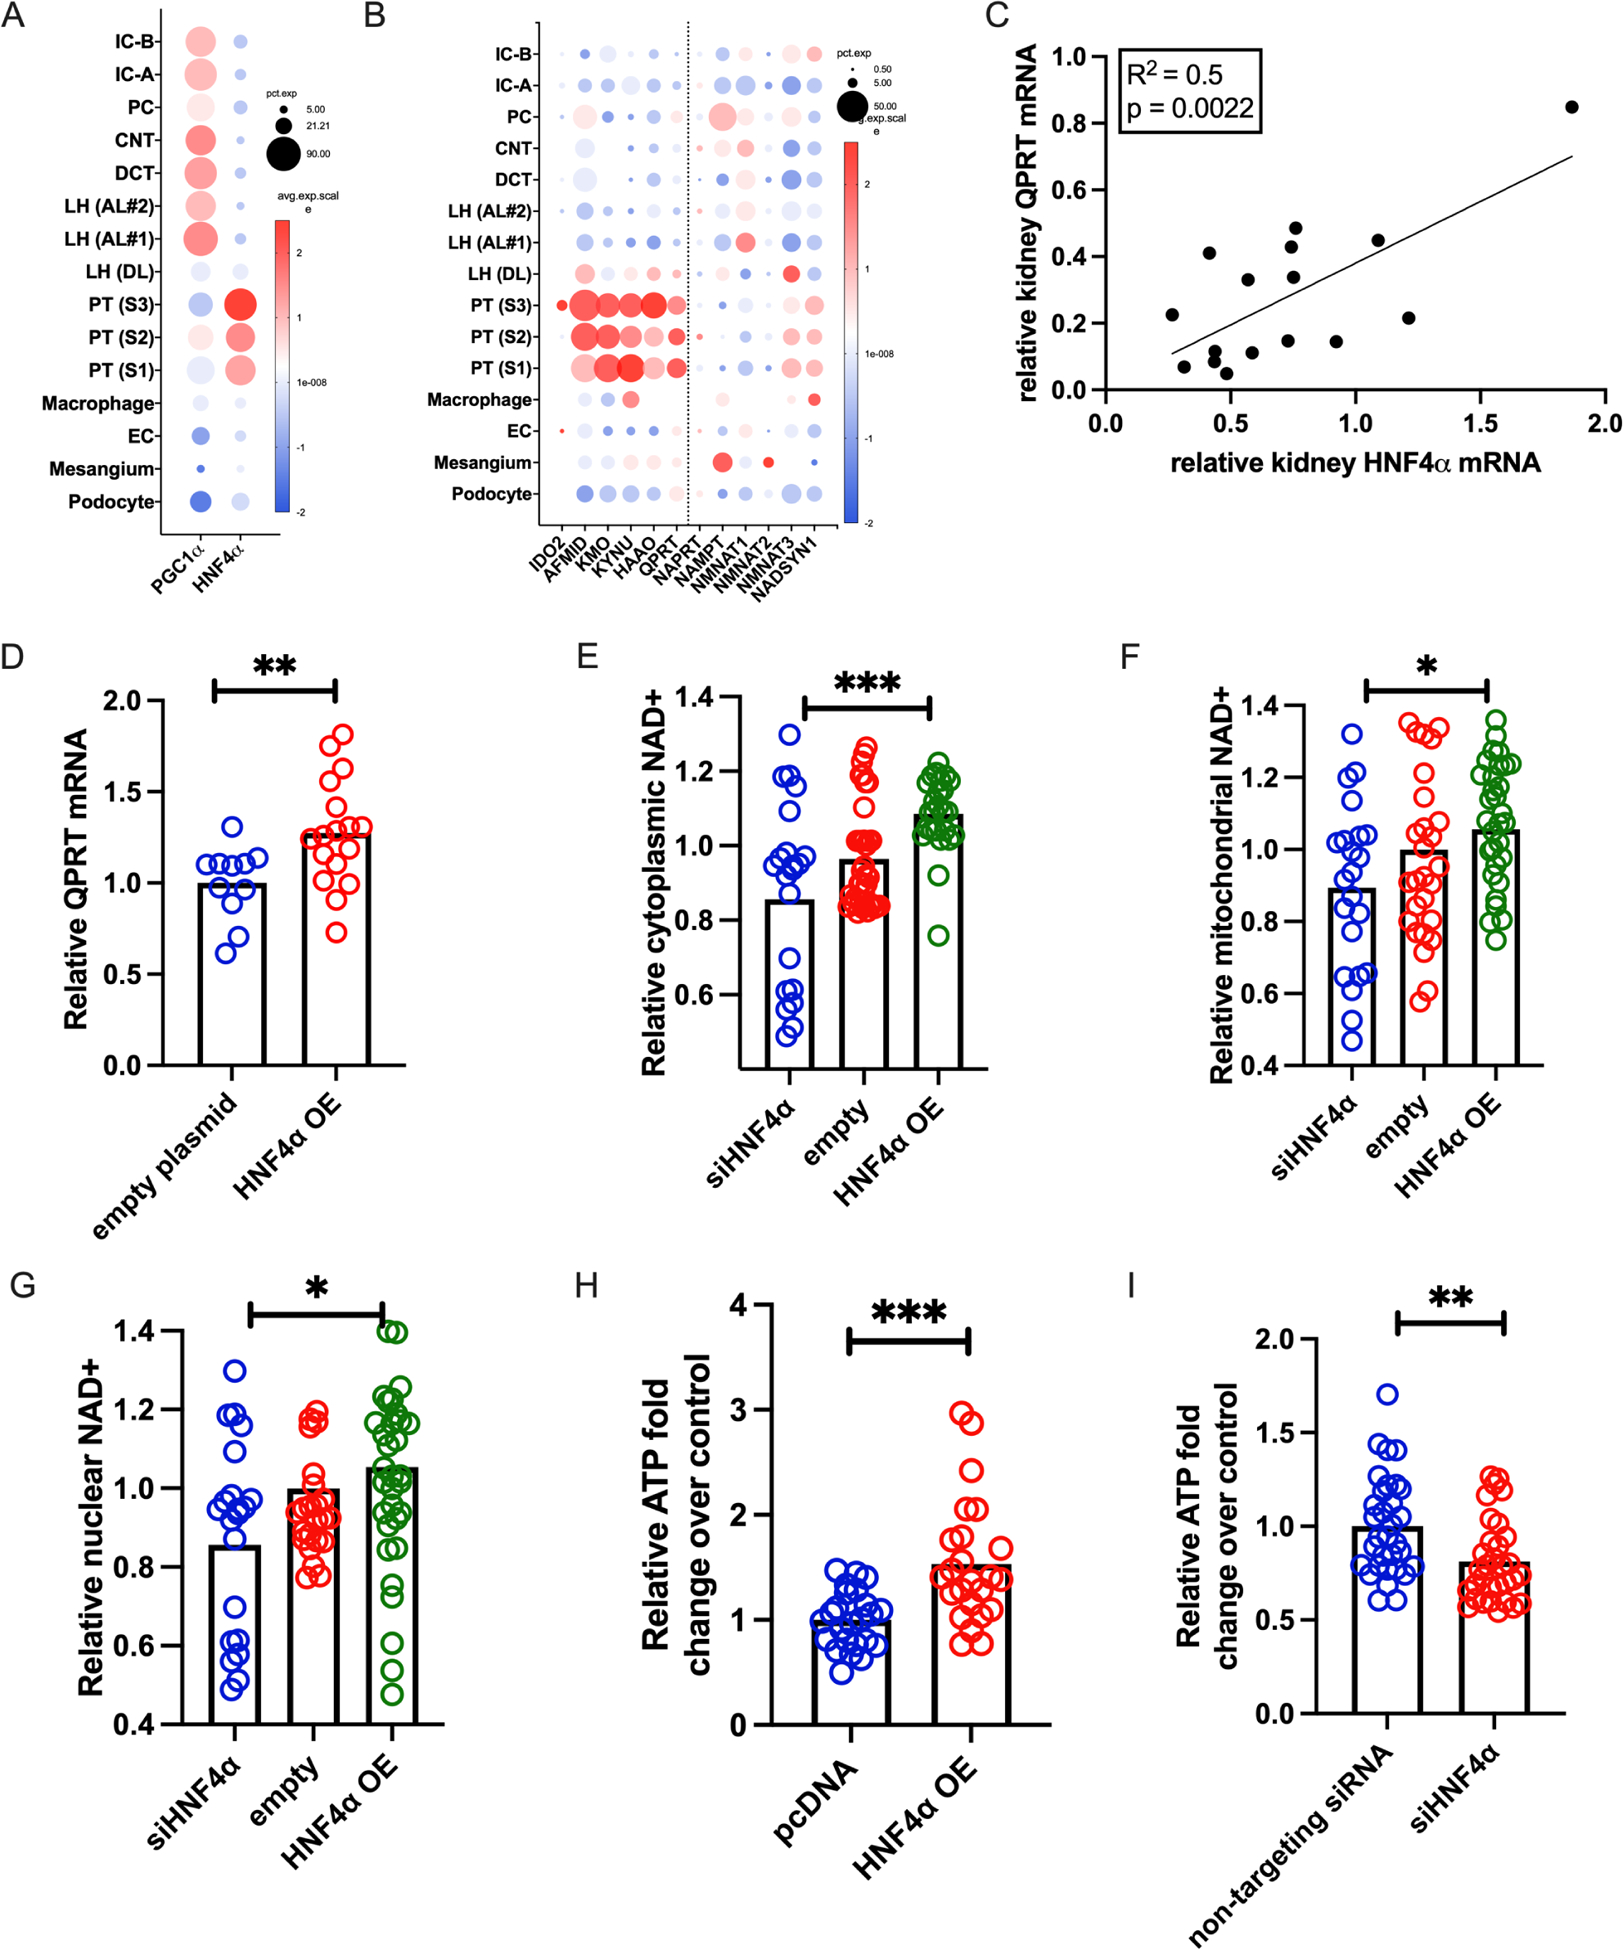
a. In human kidney snRNASeq, PGC1α is ubiquitously expressed, but HNF4α localizes to the proximal tubule. b. De novo NAD+ biosynthesis and QPRT also localize to the proximal tubule (left of dotted line), while enzymes of other NAD+ biosynthetic pathways are expressed throughout the kidney. c. After cisplatin, the degree of QPRT suppression correlates with HNF4α suppression in mouse kidneys. d. Overexpressing HNF4α (OE) increases QPRT expression. HNF4α OE increases NAD+, while siHNF4a decreases NAD+ in the cytoplasmic (e) nuclear (f), and mitochondrial (g) compartments. h. HNF4α OE increases ATP, and siHNF4α decreases ATP (I). * = p<0.05, ** = p<0.01, *** = p<0.001, **** = p<0.0001.
Overexpression of HNF4α in proximal tubule cells increased QPRT expression (Fig 6D). To evaluate HNF4α’s effect on cellular NAD+, we co-transfected NAD+ biosensors with a validated HNF4α expression plasmid or HNF4α siRNA (Supplemental Fig S6A–B). HNF4α overexpression increased NAD+ while HNF4α siRNA decreased NAD+ in each cellular compartment: cytoplasm (Fig 6E), mitochondria (Fig 6F), and nucleus (Fig 6G). Likewise, HNF4α overexpression increased cellular ATP (Fig 6H) while siHNF4α decreased cellular ATP (Fig 6I). Therefore, the effects of HNF4α and QPRT gene manipulation on NAD+ and ATP were analogous. The results further demonstrate that distinct genetic interventions to manipulate NAD+ result in concomitant changes in cellular ATP, reinforcing the concept that free NAD+ levels are rate-limiting for ATP production in kidney tubular epithelium.
To confirm the PGC1a- HNF4α -QPRT axis in mouse kidney, we performed HNF4α chromatin immunoprecipitation with 2 different antibodies followed by genomic qPCR (ChIP qPCR) for QPRT in wild type mouse kidneys and confirmed HNF4α binding at the QPRT locus in mouse kidney (Fig 7A). We repeated HNF4α ChIP qPCR for QPRT in kidney homogenates from iNephPGC1α mice and littermate controls. These results verified increased enrichment of HNF4α at QPRT with PGC1α overexpression (Fig 7B) and that the degree of HNF4α pulldown of QPRT chromatin correlated with the extent of PGC1α induction (Fig 7C). Overexpression of PGC1α (Supplemental Fig6C) in human proximal tubule cells increased QPRT expression in cell-autonomous fashion (Fig 7D). Moreover, HNF4α siRNA abrogated the PGC1α-dependent increase in QPRT expression (Fig 7D).
Figure 7: HNF4α modulates renal QPRT, connecting PGC1α to de novo NAD+ biosynthesis.
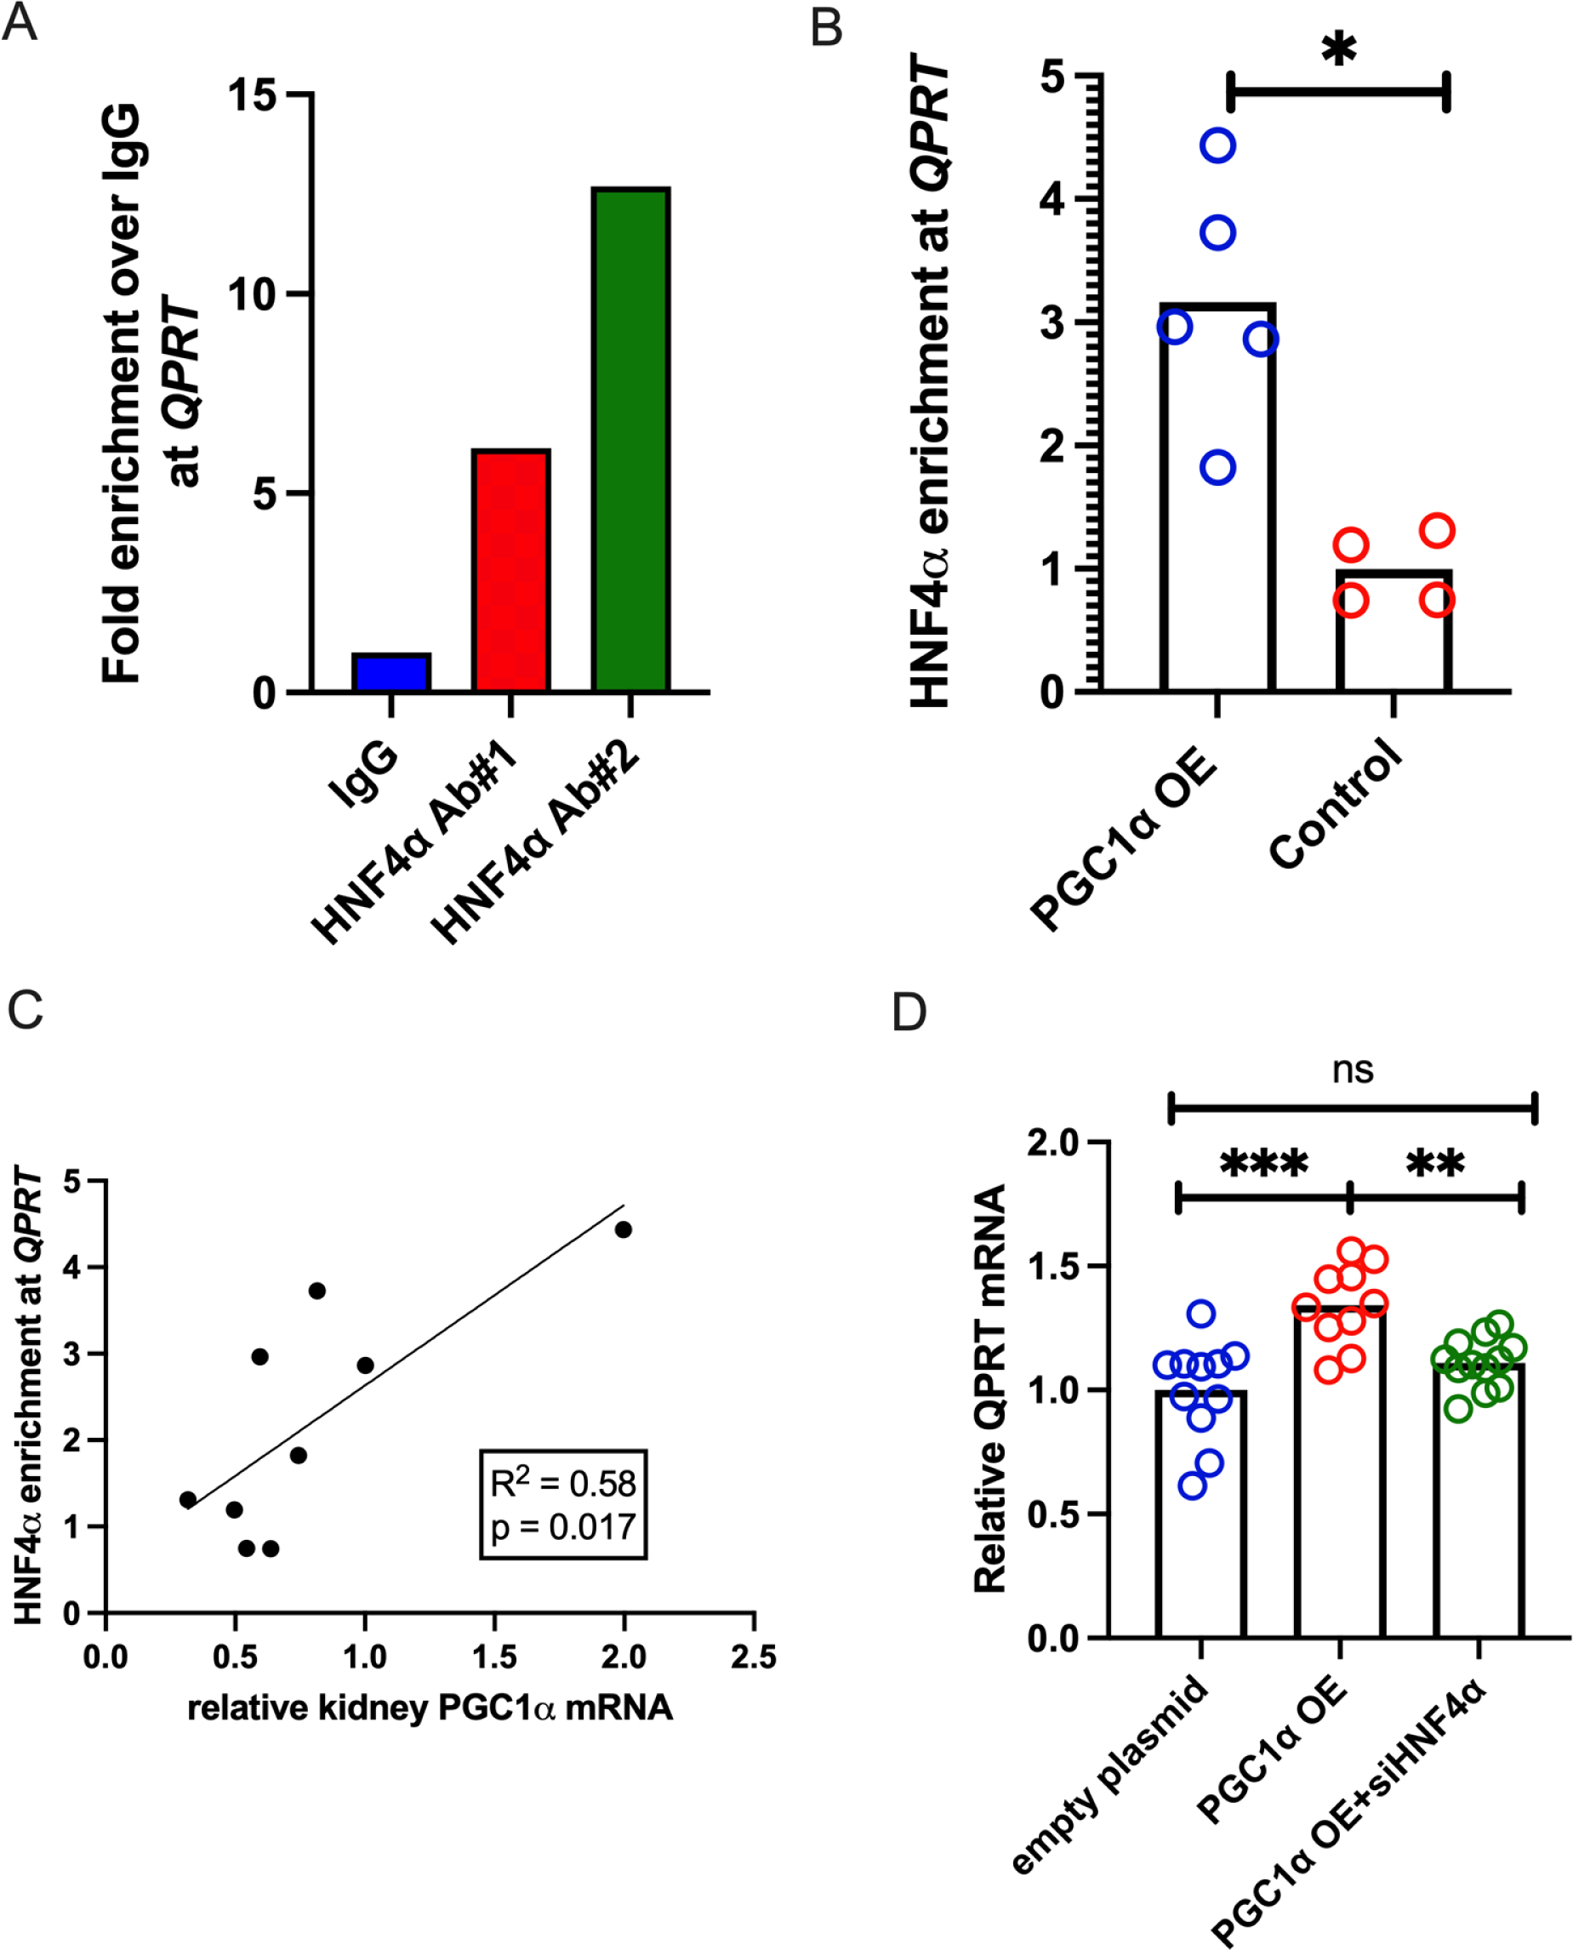
a. QPRT qPCR of HNF4α ChIP confirms that HNF4α does enrich at the QPRT locus in kidney tissue. b. In iNephPGC1α mice, PGC1α overexpression increases HNF4α enrichment at QPRT, and (c) the level of enrichment correlates with the degree of PGC1α overexpression. d. siHNF4α abrogates the PGC1α mediated increase in QPRT expression. * = p<0.05, ** = p<0.01, *** = p<0.001, **** = p<0.0001.
DISCUSSION
The present studies examined the role of the de novo NAD+ biosynthetic enzyme, QPRT, in experimental acute kidney injury. Previous work linking suppression of this enzyme to AKI was largely limited to post-ischemic models.7,8,10,11 The present results advance this concept by evaluating QPRT expression in two distinct models of toxic kidney injury. Cisplatin is an antineoplastic agent that leads to cellular apoptosis via pathologic DNA crosslinking.42 Folic acid injures kidney cells via acute tubular obstruction from folate crystals43 and subsequent generation of oxidative stress and cellular membrane destruction.44 The suppression of QPRT in these non-ischemic settings highlights that de novo NAD+ biosynthesis suppression may be a conserved injury response across different classes of stressors. Therefore, QPRT suppression is likely a feature of the multifactorial AKI that is commonly observed in patients. This has been supported by a study in humans showing elevated urine quinolinic acid to tryptophan ratio in critically ill adults with diverse clinical pathologies who subsequently developed AKI.7
Further, the prevention of AKI via kidney tubule specific overexpression of QPRT demonstrates that overcoming the AKI-induced suppression of QPRT is sufficient to restore resilience. This highlights that QPRT enzyme abundance becomes rate-limiting for quinolinic acid flux through the de novo pathway. This is further supported by multiple studies showing that restoration of NAD+ via dietary precursors of alternative NAD+ biosynthetic pathways restores AKI resilience in QPRT haploinsufficent mice7 and protects against AKI in wild type animals.14,42,9,12
There are known sex differences in NAD+ metabolism with male sex typically associated with lower NAD+ levels in plasma and tissue.46,47 The incidence of AKI and end stage kidney disease are also both higher in males.48,49 Published data show no sexually dimorphic expression of NAD+ biosynthetic enzymes or NAD+ consumers in the kidney cortex or other tissues.50 Our lab is actively optimizing kidney injury models in female rodents that will allow additional study of this question.
Our cellular results highlight that QPRT enzyme abundance is rate-limiting for both NAD+ and ATP production at baseline. The physiological importance of sustained QPRT levels to combat stress is further evidenced by renoprotection in the inducible gain-of-function mouse. Therefore, two broad possibilities can be considered for a pathogenic role of QPRT suppression following acute stress: (1) decreased flux toward NAD+; and (2) increased accumulation of upstream metabolites in the tryptophan pathway. We have previously shown that AKI susceptibility in the QPRT haploinsufficient state can be “orthogonally” rescued by augmenting NAD+ biosynthesis through an alternate pathway.7 However, in support of the latter possibility, quinolinic acid is known to accumulate in CKD and ESKD11,51–53 and is a known neurotoxin.54 Even more upstream, buildup of other tryptophan products such as kynurenine may have complex effects on immunity and inflammation.55,56 The long-term implications of metabolite accumulation upstream of QPRT merits further investigation.
While NAD+ is necessary for ATP generation, it has other cellular functions that vary based on cellular compartmentalization. In the nucleus, NAD+ influences gene expression via PARPs and sirtuins; in the cytoplasm, NAD+ enhances glycolytic flux; and in the mitochondria, NAD+ enhances oxidative respiration.57 Using compartmentalized NAD+ biosensors, we found that QPRT modulation affects NAD+ in all compartments. On one hand, this illustrates the cellular significance of QPRT suppression during injury; on the other, it suggests that QPRT suppression affects more cellular functions than oxidative phosphorylation to generate ATP. Previous studies have demonstrated that manipulation of nicotinamide mononucleotide adenyltransferase (NMNAT) isoforms can alter NAD+ concentrations in compartment-specific ways.57,58 Our results provide rationale to explore the role of compartment-specific NAD+ biosynthesis in kidney stress resistance.
Finally, the present results provide novel evidence that HNF4α links PGC1α to the tryptophan pathway of NAD+ biosynthesis. While HNF4α has already been described as a powerful regulator of metabolic pathways in the liver and as a critical component of renal tubular cell differentiation, few studies have examined the metabolic role of HNF4α in the adult kidney. Given the growing evidence of renal metabolism contributing to AKI stress resilience59 and even development of chronic kidney disease,60 additional studies are urgently needed to understand the breadth of HNF4α mediated gene expression in the healthy and injured kidney. This is especially true as recent multi-omics based investigations have identified recovery of HNF4α expression after injury as one of the most pronounced features of “recovered” tubular cells.26–28 These findings also highlight the interesting phenomena of renal tubule cell “de-differentiation” that takes place during injury with loss of expression of genes indicative of differentiated proximal tubule cells, activation of growth factor signaling pathways,61 and a reversion from oxidative phosphorylation to glycolysis for energy production.62,63 Loss of HNF4α expression is a hallmark of this phenomenon, and re-expression of HNF4α is one of the most prominent markers of cell recovery.27 These findings may implicate de novo NAD+ biosynthesis in cellular differentiation, and additional studies may suggest methods of augmenting NAD+ biosynthesis as a mechanism to modulate cellular differentiation both in injury and in developmental models.
The physiologic activities of HNF4α in the healthy kidney need further study. Our results describe a cell-intrinsic transcriptional axis for regulating tryptophan-dependent NAD+ production. Existing HNF4α fl/fl mice will enable exploration of this axis in animals.64,65 Second, NAD+ metabolism exhibits significant inter-organ crosstalk – for example, the liver and kidney may be the only mammalian organs that synthesize NAD+ from tryptophan and export nicotinamide.66 Further evidence of cross-talk comes from rare humans with loss-of-function mutations in this tryptophan pathway manifesting with multi-organ developmental lesions, including prominent renal anomalies.67 Therefore, dissecting the organ- and tissue-specific contributions of QPRT will be valuable. For example, studying whether hepatic induction of QPRT can defend against kidney stress is important, particularly since the liver is well-appreciated to influence kidney function. Similarly, conditional deletion experiments are needed.
Finally, as HNF4α is a widely active transcription factor, it is unlikely that QPRT is the only HNF4α target gene responsible for NAD+ biosynthesis and consumption. Indeed, evaluation of all HNF4α gene targets reveals that HNF4α acts on two other enzymes in the de novo NAD+ biosynthetic pathway -- kynureninase (KYNU) and aminocarboxymuconate semialdehyde decarboxylase (ACMSD). HNF4α additionally regulates several NAD+ consumers including PARP2, 4, 12, and 14 and Sirt1, 2, 4, 5, and 7.68 The specificity of HNF4α regulation on the de novo pathway of NAD+ biosynthesis and the coordinated control of NAD+ consumption warrants further study.
In summary, the present results demonstrate a conserved and physiologically significant phenomenon of QPRT suppression and NAD+ depletion in response to acute kidney stress, and furthermore, identify a transcriptional mechanism for this response involving HNF4α. These results should advance our current understanding of the relation between NAD+ metabolism and kidney health and disease.
Supplementary Material
Figure S1: Published data (Dixon et al. JASN 2022) assessing spatially resolved kidney transcriptomics in female mice undergoing ischemia reperfusion injury demonstrate that both QPRT (a) and HNF4a (b) are suppressed during injury, marked by Lcn2 expression (c), in females and recover as injury subsides.
Figure S2: Validation of QPRT siRNA (a) and QPRT overexpression plasmid (b) in HK2 cells.
Fig S3: Representative images of the 488 wavelength in NAD+ biosensor images of QPRT overexpression and knock down. Emission at the 488 wavelength is NAD+ specific. Emission at a 405 wavelength (not pictured) is not NAD+ dependent and allows for correction of variations in plasmid expression, microscope focus, etc. The intensity of the 488/405 emission ratio is inversely related to NAD+. Lower NAD+ leads to brighter emission. After image gating in ImageJ and fluorescent intensity measurement of 488/405, the inverse is calculated to reflect relative NAD+ levels. (See Fig2E–G, Fig6 D–F, Fig S4 B-D).
Figure S4: a. Validation of PGC1α overexpression in an LLC-PK1 cell line after transduction of Lentivirus carrying PGC1α OE plasmid. PGC1α OE increases NAD+ in the cytoplasm (b), nucleus (c), and mitochondria (d). PGC1α overexpression increases cellular ATP (e).
Figure S5: a. In the cisplatin AKI model, injury severity as assessed by kidney lcn2 expression, BUN, and serum creatinine all correlate to injury scoring on histology. b. Folic acid induced AKI leads to QPRT suppression in kidney. c. The iNephQPRT mouse exhibits non-leaky overexpression of QPRT in the kidney only when both transgenes are present with the addition of doxycycline. d. There is no difference in histological scoring in iNephQPRT mice compared to controls after cisplatin.
Figure S6: a-b. Validation of an HNF4α overexpression plasmid and siHNF4α in HK2 cells. c. Validation of PGC1α overexpression plasmid.
Table S1: Primers described in methods
Table S2: Metabolomics from Vehicle vs Cisplatin kidneys
Table S3: Identification of a Transcription Factor Linking PGC1α and HNF4α.
ACKNOWLEDGEMENTS
AJC thanks ASN KidneyCure and the Pediatric Scientist Development Program for funding and mentorship. The authors additionally acknowledge the Quantitative Light Microscopy Core, a resource of the Harold C. Simmons Cancer Center, supported by an NCI Cancer Center support grant, 1P30 CA142543-01.
Support:
American Society of Nephrology Ben J. Lipps Fellowship, Pediatric Scientist Development Program (K12HD000850), 2R01DK095072, 5R01AG027002, 1S10OD028630-01, The Paul and Phyllis Fireman Charitable Foundation.
Footnotes
Publisher's Disclaimer: This is a PDF file of an unedited manuscript that has been accepted for publication. As a service to our customers we are providing this early version of the manuscript. The manuscript will undergo copyediting, typesetting, and review of the resulting proof before it is published in its final form. Please note that during the production process errors may be discovered which could affect the content, and all legal disclaimers that apply to the journal pertain.
DISCLOSURE STATEMENT
SMP receives consulting fees from Janssen, Pfizer, Astellas, Merck, Boehringer Ingelheim, Astra Zeneca, Maze Therapeutics, and Entrada Therapeutics and is on the scientific advisory boards of Cytokinetics, Mission Therapeutics, NovMetaPharma, and DaVita. KZN previously received consulting fees and served on the advisory board for Calliditas Therapeutics US Inc.
SUPPLEMENTARY MATERIALS
Supplementary information is available on Kidney International’s website
REFERENCES
- 1.Meena J, Mathew G, Kumar J, Chanchlani R. Incidence of Acute Kidney Injury in Hospitalized Children: A Meta-analysis. Pediatrics. 2023;151(2):e2022058823. doi: 10.1542/peds.2022-058823 [DOI] [PubMed] [Google Scholar]
- 2.Susantitaphong P, Cruz DN, Cerda J, et al. World incidence of AKI: a meta-analysis. Clin J Am Soc Nephrol. 2013;8(9):1482–1493. doi: 10.2215/CJN.00710113 [DOI] [PMC free article] [PubMed] [Google Scholar]
- 3.Emma F, Montini G, Parikh SM, Salviati L. Mitochondrial dysfunction in inherited renal disease and acute kidney injury. Nat Rev Nephrol. 2016;12(5):267–280. doi: 10.1038/nrneph.2015.214 [DOI] [PMC free article] [PubMed] [Google Scholar]
- 4.Bai P, Canto C, Oudart H, et al. PARP-1 inhibition increases mitochondrial metabolism through SIRT1 activation. Cell Metab. 2011;13(4):461–468. doi: 10.1016/j.cmet.2011.03.004 [DOI] [PMC free article] [PubMed] [Google Scholar]
- 5.Ralto KM, Rhee EP, Parikh SM. NAD+ homeostasis in renal health and disease. Nat Rev Nephrol. 2020;16(2):99–111. doi: 10.1038/s41581-019-0216-6 [DOI] [PMC free article] [PubMed] [Google Scholar]
- 6.Wang YM, Han RL, Song SG, Yuan XP, Ren XS. Inhibition of PARP overactivation protects acute kidney injury of septic shock. Eur Rev Med Pharmacol Sci. 2018;22(18):6049–6056. doi: 10.26355/eurrev_201809_15942 [DOI] [PubMed] [Google Scholar]
- 7.Poyan Mehr A, Tran MT, Ralto KM, et al. De novo NAD+ biosynthetic impairment in acute kidney injury in humans. Nat Med. 2018;24(9):1351–1359. doi: 10.1038/s41591-018-0138-z [DOI] [PMC free article] [PubMed] [Google Scholar]
- 8.Mede AI, Milne GL, Wei D, Smith DK, Smith LE. NAD+ Biosynthesis Impairment and Acute Kidney Injury after Major Vascular Surgery. Antioxidants (Basel). 2023;12(4):821. doi: 10.3390/antiox12040821 [DOI] [PMC free article] [PubMed] [Google Scholar]
- 9.Morevati M, Egstrand S, Nordholm A, et al. Effect of NAD+ boosting on kidney ischemia-reperfusion injury. PLOS ONE. 2021;16(6):e0252554. doi: 10.1371/journal.pone.0252554 [DOI] [PMC free article] [PubMed] [Google Scholar]
- 10.Raines NH, Cheung MD, Wilson LS, et al. Nicotinamide Adenine Dinucleotide Biosynthetic Impairment and Urinary Metabolomic Alterations Observed in Hospitalized Adults With COVID-19–Related Acute Kidney Injury. Kidney International Reports. 2021;6(12):3002–3013. doi: 10.1016/j.ekir.2021.09.001 [DOI] [PMC free article] [PubMed] [Google Scholar]
- 11.Bignon Y, Rinaldi A, Nadour Z, et al. Cell stress response impairs de novo NAD+ biosynthesis in the kidney. JCI Insight. 2022;7(1). doi: 10.1172/jci.insight.153019 [DOI] [PMC free article] [PubMed] [Google Scholar]
- 12.Doke T, Mukherjee S, Mukhi D, et al. NAD+ precursor supplementation prevents mtRNA/RIG-I-dependent inflammation during kidney injury. Nat Metab. 2023;5(3):414–430. doi: 10.1038/s42255-023-00761-7 [DOI] [PMC free article] [PubMed] [Google Scholar]
- 13.Tran M, Tam D, Bardia A, et al. PGC-1α promotes recovery after acute kidney injury during systemic inflammation in mice. doi: 10.1172/JCI58662 [DOI] [PMC free article] [PubMed] [Google Scholar]
- 14.Tran MT, Zsengeller ZK, Berg AH, et al. PGC1α drives NAD biosynthesis linking oxidative metabolism to renal protection. Nature. 2016;531(7595):528–532. doi: 10.1038/nature17184 [DOI] [PMC free article] [PubMed] [Google Scholar]
- 15.Stallons LJ, Whitaker RM, Schnellmann RG. Suppressed Mitochondrial Biogenesis in Folic Acid-Induced Acute Kidney Injury and Early Fibrosis. Toxicol Lett. 2014;224(3):326–332. doi: 10.1016/j.toxlet.2013.11.014 [DOI] [PMC free article] [PubMed] [Google Scholar]
- 16.Ruiz-Andres O, Suarez-Alvarez B, Sánchez-Ramos C, et al. The inflammatory cytokine TWEAK decreases PGC-1α expression and mitochondrial function in acute kidney injury. Kidney International. 2016;89(2):399–410. doi: 10.1038/ki.2015.332 [DOI] [PubMed] [Google Scholar]
- 17.Fontecha-Barriuso M, Martín-Sánchez D, Martinez-Moreno JM, et al. PGC-1α deficiency causes spontaneous kidney inflammation and increases the severity of nephrotoxic AKI. The Journal of Pathology. 2019;249(1):65–78. doi: 10.1002/path.5282 [DOI] [PubMed] [Google Scholar]
- 18.Lynch MR, Tran MT, Ralto KM, et al. TFEB-driven lysosomal biogenesis is pivotal for PGC1α-dependent renal stress resistance. JCI Insight. 4(8):e126749. doi: 10.1172/jci.insight.126749 [DOI] [PMC free article] [PubMed] [Google Scholar]
- 19.Han SH, Wu MY, Nam BY, et al. PGC-1α Protects from Notch-Induced Kidney Fibrosis Development. J Am Soc Nephrol. 2017;28(11):3312–3322. doi: 10.1681/ASN.2017020130 [DOI] [PMC free article] [PubMed] [Google Scholar]
- 20.Huang KW, Reebye V, Czysz K, et al. Liver Activation of Hepatocellular Nuclear Factor-4α by Small Activating RNA Rescues Dyslipidemia and Improves Metabolic Profile. Mol Ther Nucleic Acids. 2019;19:361–370. doi: 10.1016/j.omtn.2019.10.044 [DOI] [PMC free article] [PubMed] [Google Scholar]
- 21.Lee SH, Veeriah V, Levine F. Liver fat storage is controlled by HNF4α through induction of lipophagy and is reversed by a potent HNF4α agonist. Cell Death Dis. 2021;12(6):1–18. doi: 10.1038/s41419-021-03862-x [DOI] [PMC free article] [PubMed] [Google Scholar]
- 22.Babeu JP, Boudreau F. Hepatocyte nuclear factor 4-alpha involvement in liver and intestinal inflammatory networks. World J Gastroenterol. 2014;20(1):22–30. doi: 10.3748/wjg.v20.i1.22 [DOI] [PMC free article] [PubMed] [Google Scholar]
- 23.Yang T, Poenisch M, Khanal R, et al. Therapeutic HNF4A mRNA attenuates liver fibrosis in a preclinical model. Journal of Hepatology. 2021;75(6):1420–1433. doi: 10.1016/j.jhep.2021.08.011 [DOI] [PubMed] [Google Scholar]
- 24.DeLaForest A, Di Furio F, Jing R, et al. HNF4A Regulates the Formation of Hepatic Progenitor Cells from Human iPSC-Derived Endoderm by Facilitating Efficient Recruitment of RNA Pol II. Genes (Basel). 2018;10(1):21. doi: 10.3390/genes10010021 [DOI] [PMC free article] [PubMed] [Google Scholar]
- 25.Marable SS, Chung E, Park JS. Hnf4a Is Required for the Development of Cdh6-Expressing Progenitors into Proximal Tubules in the Mouse Kidney. J Am Soc Nephrol. 2020;31(11):2543–2558. doi: 10.1681/ASN.2020020184 [DOI] [PMC free article] [PubMed] [Google Scholar]
- 26.Gerhardt LMS, McMahon AP. Multi-omic approaches to acute kidney injury and repair. Current Opinion in Biomedical Engineering. 2021;20:100344. doi: 10.1016/j.cobme.2021.100344 [DOI] [PMC free article] [PubMed] [Google Scholar]
- 27.Kirita Y, Wu H, Uchimura K, Wilson PC, Humphreys BD. Cell profiling of mouse acute kidney injury reveals conserved cellular responses to injury. Proceedings of the National Academy of Sciences. 2020;117(27):15874–15883. doi: 10.1073/pnas.2005477117 [DOI] [PMC free article] [PubMed] [Google Scholar]
- 28.Wilflingseder J, Willi M, Lee HK, et al. Enhancer and super-enhancer dynamics in repair after ischemic acute kidney injury. Nat Commun. 2020;11:3383. doi: 10.1038/s41467-020-17205-5 [DOI] [PMC free article] [PubMed] [Google Scholar]
- 29.Traykova-Brauch M, Schönig K, Greiner O, et al. An efficient and versatile system for acute and chronic modulation of renal tubular function in transgenic mice. Nat Med. 2008;14(9):979–984. doi: 10.1038/nm.1865 [DOI] [PMC free article] [PubMed] [Google Scholar]
- 30.Duerr J, Gruner M, Schubert SC, Haberkorn U, Bujard H, Mall MA. Use of a New-Generation Reverse Tetracycline Transactivator System for Quantitative Control of Conditional Gene Expression in the Murine Lung. Am J Respir Cell Mol Biol. 2011;44(2):244–254. doi: 10.1165/rcmb.2009-0115OC [DOI] [PubMed] [Google Scholar]
- 31.Ichida M, Nemoto S, Finkel T. Identification of a specific molecular repressor of the peroxisome proliferator-activated receptor gamma Coactivator-1 alpha (PGC-1alpha). J Biol Chem. 2002;277(52):50991–50995. doi: 10.1074/jbc.M210262200 [DOI] [PubMed] [Google Scholar]
- 32.Thomas H, Senkel S, Erdmann S, et al. Pattern of genes influenced by conditional expression of the transcription factors HNF6, HNF4alpha and HNF1beta in a pancreatic beta-cell line. Nucleic Acids Res. 2004;32(19):e150. doi: 10.1093/nar/gnh144 [DOI] [PMC free article] [PubMed] [Google Scholar]
- 33.Cambronne XA, Stewart ML, Kim D, et al. NAD+ biosensor reveals multiple sources for mitochondrial NAD+. Science. 2016;352(6292):1474–1477. doi: 10.1126/science.aad5168 [DOI] [PMC free article] [PubMed] [Google Scholar]
- 34.Dixon EE, Wu H, Muto Y, Wilson PC, Humphreys BD. Spatially Resolved Transcriptomic Analysis of Acute Kidney Injury in a Female Murine Model. J Am Soc Nephrol. 2022;33(2):279–289. doi: 10.1681/ASN.2021081150 [DOI] [PMC free article] [PubMed] [Google Scholar]
- 35.Gene - QPRT. Accessed May 7, 2023. https://maayanlab.cloud/Harmonizome/gene/QPRT
- 36.Rolland T, Taşan M, Charloteaux B, et al. A Proteome-Scale Map of the Human Interactome Network. Cell. 2014;159(5):1212–1226. doi: 10.1016/j.cell.2014.10.050 [DOI] [PMC free article] [PubMed] [Google Scholar]
- 37.Luck K, Kim DK, Lambourne L, et al. A Reference Map of the Human Protein Interactome. Systems Biology; 2019. doi: 10.1101/605451 [DOI] [Google Scholar]
- 38.Stark C, Breitkreutz BJ, Reguly T, Boucher L, Breitkreutz A, Tyers M. BioGRID: a general repository for interaction datasets. Nucleic Acids Res. 2006;34(Database issue):D535–D539. doi: 10.1093/nar/gkj109 [DOI] [PMC free article] [PubMed] [Google Scholar]
- 39.RXRA[gene] - ClinVar - NCBI. Accessed May 18, 2023. https://www.ncbi.nlm.nih.gov/clinvar/?term=RXRA%5Bgene%5D&redir=gene
- 40.Marchesin V, Pérez-Martí A, Le Meur G, et al. Molecular Basis for Autosomal-Dominant Renal Fanconi Syndrome Caused by HNF4A. Cell Rep. 2019;29(13):4407–4421.e5. doi: 10.1016/j.celrep.2019.11.066 [DOI] [PMC free article] [PubMed] [Google Scholar]
- 41.Wu H, Uchimura K, Donnelly EL, Kirita Y, Morris SA, Humphreys BD. Comparative Analysis and Refinement of Human PSC-Derived Kidney Organoid Differentiation with Single-Cell Transcriptomics. Cell Stem Cell. 2018;23(6):869–881.e8. doi: 10.1016/j.stem.2018.10.010 [DOI] [PMC free article] [PubMed] [Google Scholar]
- 42.McSweeney KR, Gadanec LK, Qaradakhi T, Ali BA, Zulli A, Apostolopoulos V. Mechanisms of Cisplatin-Induced Acute Kidney Injury: Pathological Mechanisms, Pharmacological Interventions, and Genetic Mitigations. Cancers (Basel). 2021;13(7):1572. doi: 10.3390/cancers13071572 [DOI] [PMC free article] [PubMed] [Google Scholar]
- 43.Fink M, Henry M, Tange JD. Experimental folic acid nephropathy. Pathology. 1987;19(2):143–149. doi: 10.3109/00313028709077125 [DOI] [PubMed] [Google Scholar]
- 44.Gupta A, Puri V, Sharma R, Puri S. Folic acid induces acute renal failure (ARF) by enhancing renal prooxidant state. Exp Toxicol Pathol. 2012;64(3):225–232. doi: 10.1016/j.etp.2010.08.010 [DOI] [PubMed] [Google Scholar]
- 45.Raines NH, Ganatra S, Nissaisorakarn P, et al. Niacinamide May Be Associated with Improved Outcomes in COVID-19-Related Acute Kidney Injury: An Observational Study. Kidney360. 2021;2(1):33. doi: 10.34067/KID.0006452020 [DOI] [PMC free article] [PubMed] [Google Scholar]
- 46.Schwarzmann L, Pliquett RU, Simm A, Bartling B. Sex-related differences in human plasma NAD+/NADH levels depend on age. Biosci Rep. 2021;41(1):BSR20200340. doi: 10.1042/BSR20200340 [DOI] [PMC free article] [PubMed] [Google Scholar]
- 47.van der Velpen V, Rosenberg N, Maillard V, et al. Sex-specific alterations in NAD+ metabolism in 3xTg Alzheimer’s disease mouse brain assessed by quantitative targeted LC-MS. J Neurochem. 2021;159(2):378–388. doi: 10.1111/jnc.15362 [DOI] [PMC free article] [PubMed] [Google Scholar]
- 48.Loutradis C, Pickup L, Law JP, et al. Acute kidney injury is more common in men than women after accounting for socioeconomic status, ethnicity, alcohol intake and smoking history. Biol Sex Differ. 2021;12:30. doi: 10.1186/s13293-021-00373-4 [DOI] [PMC free article] [PubMed] [Google Scholar]
- 49.Harris RC, Zhang MZ. The role of gender disparities in kidney injury. Ann Transl Med. 2020;8(7):514. doi: 10.21037/atm.2020.01.23 [DOI] [PMC free article] [PubMed] [Google Scholar]
- 50.Gershoni M, Pietrokovski S. The landscape of sex-differential transcriptome and its consequent selection in human adults. BMC Biology. 2017;15(1):7. doi: 10.1186/s12915-017-0352-z [DOI] [PMC free article] [PubMed] [Google Scholar]
- 51.Saade MC, Clark AJ, Parikh SM. States of quinolinic acid excess in urine: A systematic review of human studies. Front Nutr. 2022;9:1070435. doi: 10.3389/fnut.2022.1070435 [DOI] [PMC free article] [PubMed] [Google Scholar]
- 52.Suhre K, Schwartz JE, Sharma VK, et al. Urine Metabolite Profiles Predictive of Human Kidney Allograft Status. J Am Soc Nephrol. 2016;27(2):626–636. doi: 10.1681/ASN.2015010107 [DOI] [PMC free article] [PubMed] [Google Scholar]
- 53.Suhre K, Dadhania DM, Lee JR, et al. Kidney Allograft Function Is a Confounder of Urine Metabolite Profiles in Kidney Allograft Recipients. Metabolites. 2021;11(8):533. doi: 10.3390/metabo11080533 [DOI] [PMC free article] [PubMed] [Google Scholar]
- 54.Lugo-Huitrón R, Ugalde Muñiz P, Pineda B, Pedraza-Chaverrí J, Ríos C, Pérez-de la Cruz V. Quinolinic Acid: An Endogenous Neurotoxin with Multiple Targets. Oxid Med Cell Longev. 2013;2013:104024. doi: 10.1155/2013/104024 [DOI] [PMC free article] [PubMed] [Google Scholar]
- 55.Cervenka I, Agudelo LZ, Ruas JL. Kynurenines: Tryptophan’s metabolites in exercise, inflammation, and mental health. Science. 2017;357(6349):eaaf9794. doi: 10.1126/science.aaf9794 [DOI] [PubMed] [Google Scholar]
- 56.Clark AJ, Saade MC, Parikh SM. The Significance of NAD+ Biosynthesis Alterations in Acute Kidney Injury. Seminars in Nephrology. 2022;42(3):151287. doi: 10.1016/j.semnephrol.2022.10.013 [DOI] [PMC free article] [PubMed] [Google Scholar]
- 57.Ryu KW, Nandu T, Kim J, Challa S, DeBerardinis RJ, Kraus WL. Metabolic regulation of transcription through compartmentalized NAD+ biosynthesis. Science. 2018;360(6389):eaan5780. doi: 10.1126/science.aan5780 [DOI] [PMC free article] [PubMed] [Google Scholar]
- 58.Jones A, Kraus WL. Multiomics analysis of the NAD+-PARP1 axis reveals a role for site-specific ADP-ribosylation in splicing in embryonic stem cells. Genes Dev. 2022;36(9–10):601–617. doi: 10.1101/gad.349335.121 [DOI] [PMC free article] [PubMed] [Google Scholar]
- 59.Clark AJ, Parikh SM. Mitochondrial Metabolism in Acute Kidney Injury. Seminars in Nephrology. 2020;40(2):101–113. doi: 10.1016/j.semnephrol.2020.01.002 [DOI] [PMC free article] [PubMed] [Google Scholar]
- 60.Liu X, Luo D, Huang S, et al. Impaired Nicotinamide Adenine Dinucleotide Biosynthesis in the Kidney of Chronic Kidney Disease. Front Physiol. 2021;12:723690. doi: 10.3389/fphys.2021.723690 [DOI] [PMC free article] [PubMed] [Google Scholar]
- 61.Chang-Panesso M, Humphreys BD. Cellular plasticity in kidney injury and repair. Nat Rev Nephrol. 2017;13(1):39–46. doi: 10.1038/nrneph.2016.169 [DOI] [PubMed] [Google Scholar]
- 62.Faivre A, Verissimo T, Auwerx H, Legouis D, de Seigneux S. Tubular Cell Glucose Metabolism Shift During Acute and Chronic Injuries. Front Med (Lausanne). 2021;8:742072. doi: 10.3389/fmed.2021.742072 [DOI] [PMC free article] [PubMed] [Google Scholar]
- 63.Liu J, Edgington-Giordano F, Dugas C, et al. Regulation of Nephron Progenitor Cell Self-Renewal by Intermediary Metabolism. J Am Soc Nephrol. 2017;28(11):3323–3335. doi: 10.1681/ASN.2016111246 [DOI] [PMC free article] [PubMed] [Google Scholar]
- 64.Hayhurst GP, Lee YH, Lambert G, Ward JM, Gonzalez FJ. Hepatocyte nuclear factor 4alpha (nuclear receptor 2A1) is essential for maintenance of hepatic gene expression and lipid homeostasis. Mol Cell Biol. 2001;21(4):1393–1403. doi: 10.1128/MCB.21.4.1393-1403.2001 [DOI] [PMC free article] [PubMed] [Google Scholar]
- 65.Parviz F, Li J, Kaestner KH, Duncan SA. Generation of a conditionally null allele of hnf4α. genesis. 2002;32(2):130–133. doi: 10.1002/gene.10058 [DOI] [PubMed] [Google Scholar]
- 66.Liu L, Su X, Quinn WJ, et al. Quantitative analysis of NAD synthesis-breakdown fluxes. Cell Metab. 2018;27(5):1067–1080.e5. doi: 10.1016/j.cmet.2018.03.018 [DOI] [PMC free article] [PubMed] [Google Scholar]
- 67.Shi H, Enriquez A, Rapadas M, et al. NAD Deficiency, Congenital Malformations, and Niacin Supplementation. New England Journal of Medicine. 2017;377(6):544–552. doi: 10.1056/NEJMoa1616361 [DOI] [PubMed] [Google Scholar]
- 68.Rouillard AD, Gundersen GW, Fernandez NF, et al. The harmonizome: a collection of processed datasets gathered to serve and mine knowledge about genes and proteins. Database. 2016;2016:baw100. doi: 10.1093/database/baw100 [DOI] [PMC free article] [PubMed] [Google Scholar]
Associated Data
This section collects any data citations, data availability statements, or supplementary materials included in this article.
Supplementary Materials
Figure S1: Published data (Dixon et al. JASN 2022) assessing spatially resolved kidney transcriptomics in female mice undergoing ischemia reperfusion injury demonstrate that both QPRT (a) and HNF4a (b) are suppressed during injury, marked by Lcn2 expression (c), in females and recover as injury subsides.
Figure S2: Validation of QPRT siRNA (a) and QPRT overexpression plasmid (b) in HK2 cells.
Fig S3: Representative images of the 488 wavelength in NAD+ biosensor images of QPRT overexpression and knock down. Emission at the 488 wavelength is NAD+ specific. Emission at a 405 wavelength (not pictured) is not NAD+ dependent and allows for correction of variations in plasmid expression, microscope focus, etc. The intensity of the 488/405 emission ratio is inversely related to NAD+. Lower NAD+ leads to brighter emission. After image gating in ImageJ and fluorescent intensity measurement of 488/405, the inverse is calculated to reflect relative NAD+ levels. (See Fig2E–G, Fig6 D–F, Fig S4 B-D).
Figure S4: a. Validation of PGC1α overexpression in an LLC-PK1 cell line after transduction of Lentivirus carrying PGC1α OE plasmid. PGC1α OE increases NAD+ in the cytoplasm (b), nucleus (c), and mitochondria (d). PGC1α overexpression increases cellular ATP (e).
Figure S5: a. In the cisplatin AKI model, injury severity as assessed by kidney lcn2 expression, BUN, and serum creatinine all correlate to injury scoring on histology. b. Folic acid induced AKI leads to QPRT suppression in kidney. c. The iNephQPRT mouse exhibits non-leaky overexpression of QPRT in the kidney only when both transgenes are present with the addition of doxycycline. d. There is no difference in histological scoring in iNephQPRT mice compared to controls after cisplatin.
Figure S6: a-b. Validation of an HNF4α overexpression plasmid and siHNF4α in HK2 cells. c. Validation of PGC1α overexpression plasmid.
Table S1: Primers described in methods
Table S2: Metabolomics from Vehicle vs Cisplatin kidneys
Table S3: Identification of a Transcription Factor Linking PGC1α and HNF4α.


