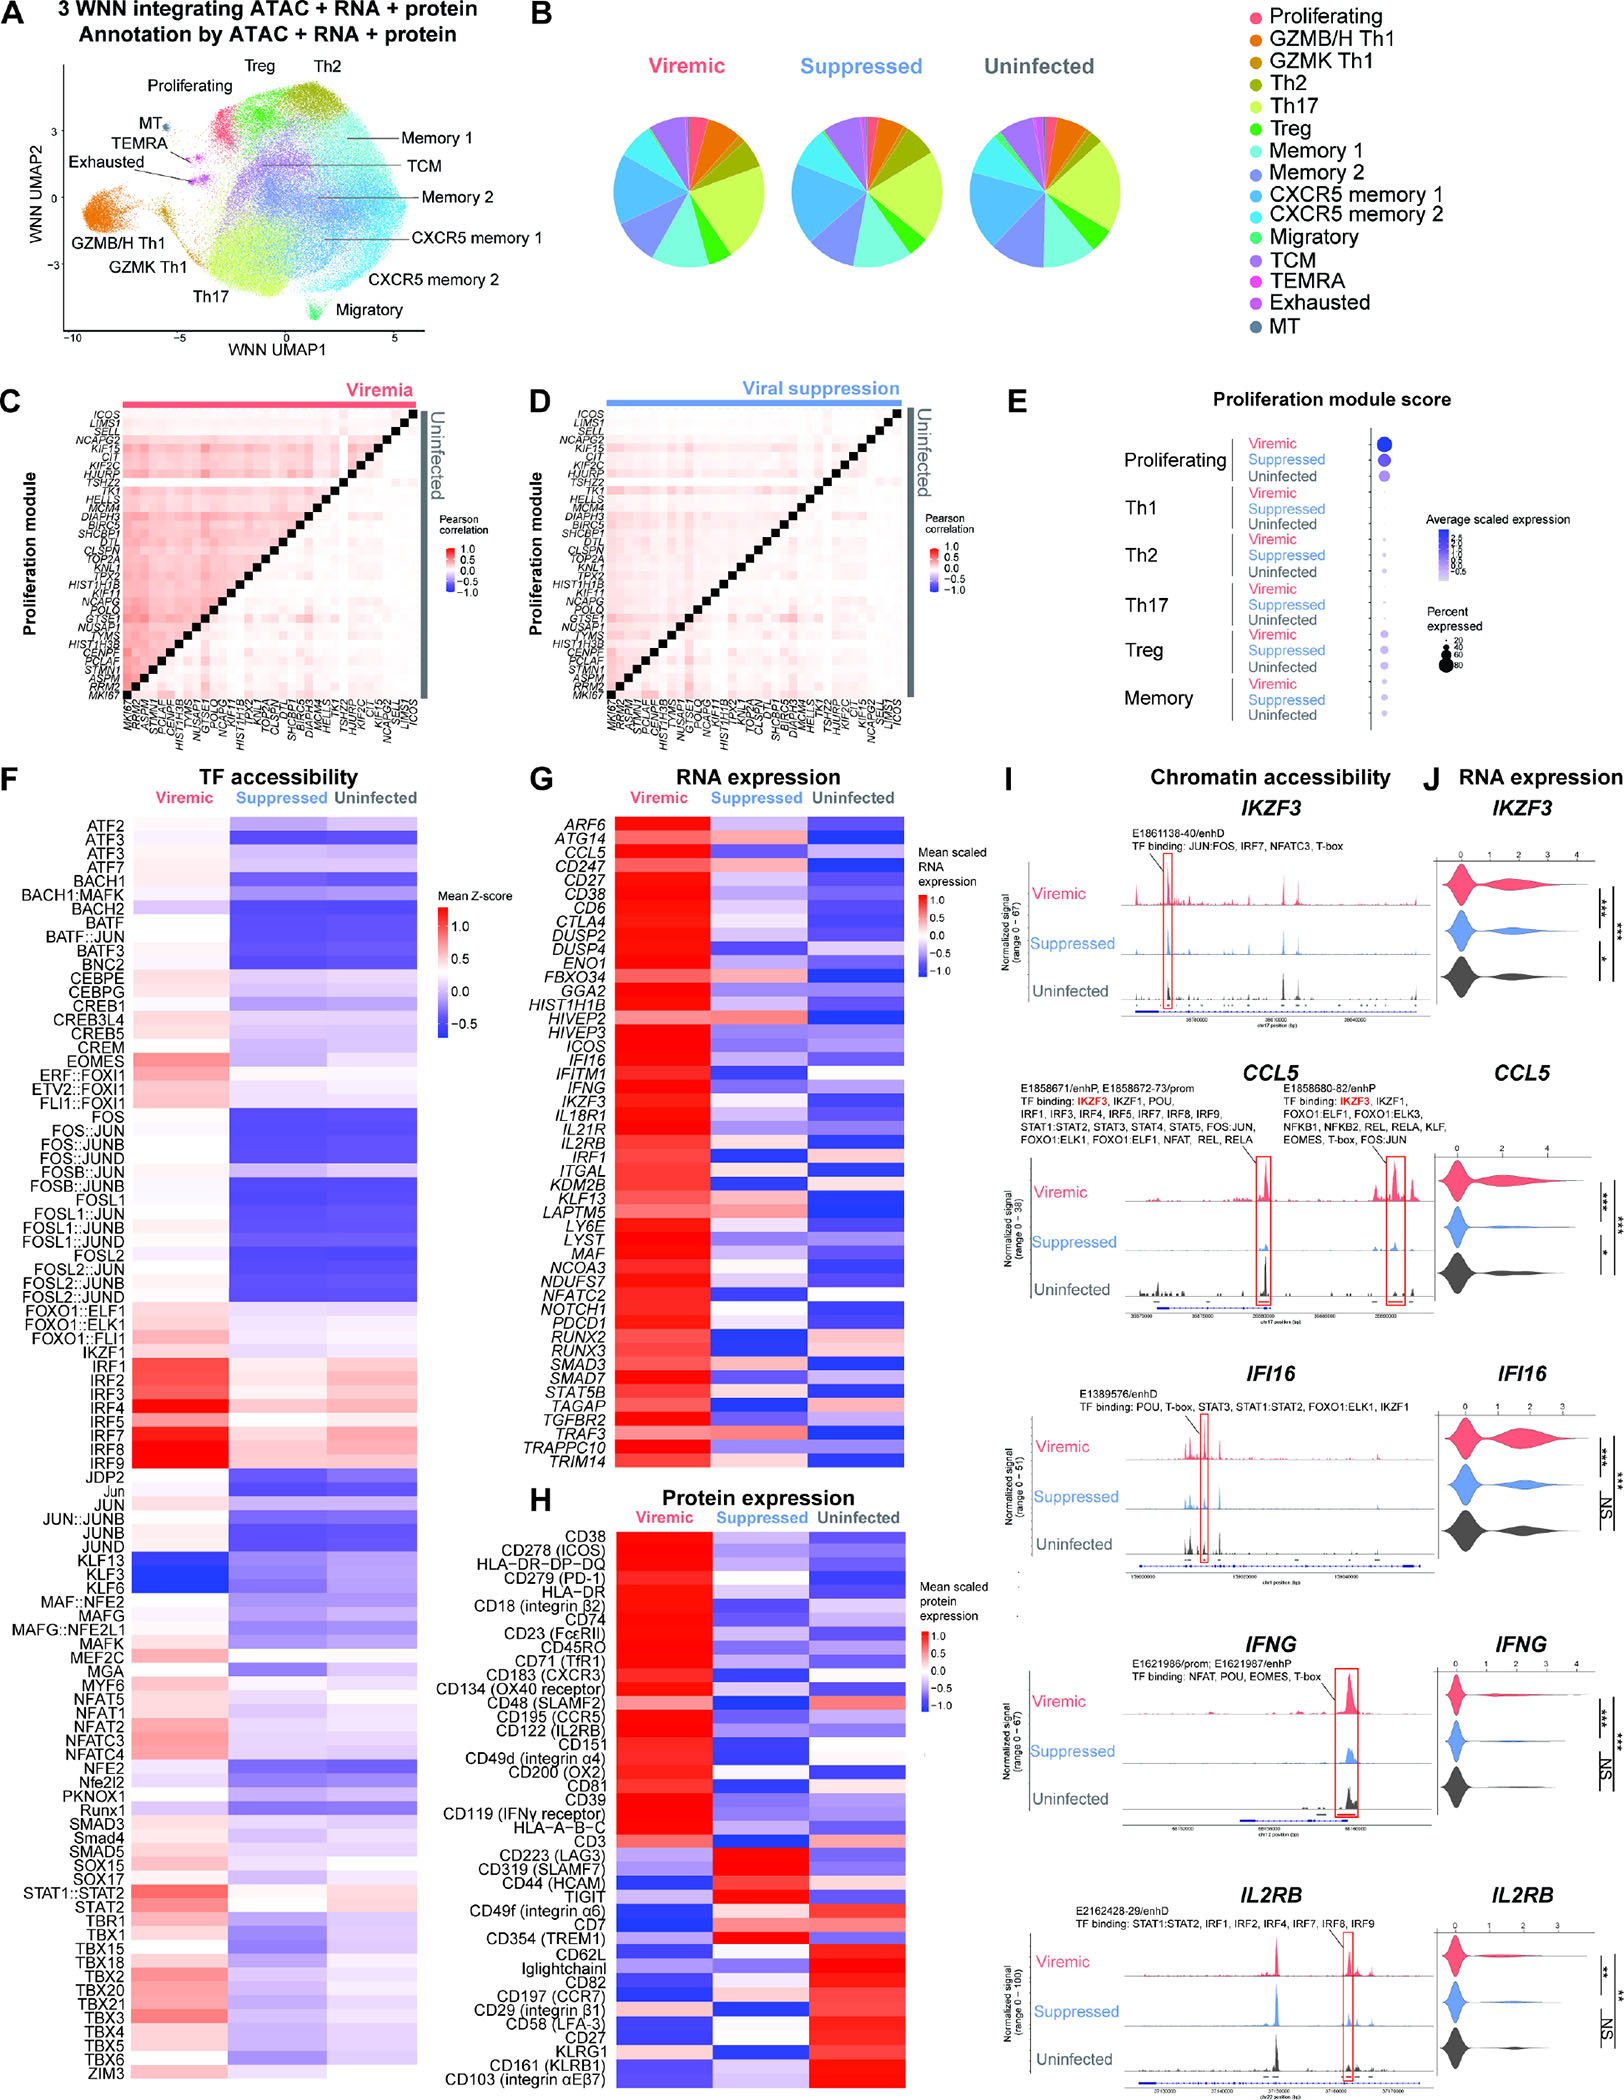
Figure 1. Single-cell DOGMA-seq captures the heterogeneous epigenetic, transcriptional, and surface protein states of memory CD4+ T cells during HIV-1 infection.

(A) Harmonized WNN UMAP projection of memory CD4+ T cells identified by cell-to-cell multimodal neighbors (weighted combination of ATAC, RNA, and protein similarities) (n = 93,209 cells, including 25,778, 56,771, 10,660 cells in the viremic, viral suppression, and uninfected conditions, respectively). (B) Pie charts indicating cell subset distributions in viremia, viral suppression, and uninfected conditions. (C–D) Heatmap comparisons of pairwise gene expression Pearson’s correlation coefficient, for the proliferation gene program identified by WGCNA. The Proliferation gene program was identified by WGCNA using top 50 genes most positively and negatively associated with the first 7 principal components in the transcriptional profiles of 25,778 cells in viremia. P < 0.05 for at least 95% Wilcoxon rank-sum tests against 10,000 random module permutations. (E) Proliferation module score per cell subset and infection condition. (F) Chromatin accessibility of transcription factor binding motifs in proliferating cluster cells grouped by conditions, represented in heatmap as comparisons of group means in ATAC-seq chromVAR bias-corrected deviations (Z-score). All motifs shown had significantly increased accessibility (P < 0.05 and mean Z-score difference ≥ 0.3). (G) Genes differentially expressed in proliferating cluster cells, represented in heatmap as comparisons of group means in normalized and scaled RNA expression. All genes passed P < 0.05 in viremic, min.pct ≥ 0.1, log2 fold change (FC) ≥ 0.25). (H) Surface proteins differentially expressed in proliferating cluster cells, represented in heatmap as comparisons of group means in DSB-normalized and scaled protein expression. All features passed P < 0.05 and log2FC ≥ 0.25. The mean expression of all protein features shown were also tested to be greater than the mean expression of their specific isotype controls in cells from the proliferating cluster (Z > 2; two-sample Z-test). For all heatmaps, n = 1,073, 1,373, 281 proliferating cells in the viremic, viral suppression, and uninfected conditions, respectively. Statistical significance for heatmaps was determined by Wilcoxon rank-sum test for comparisons between each group and all cells in the other two groups. All P values were false discovery rate (FDR)-adjusted using the Benjamini-Hochberg procedure. (I and J) Matching increase in chromatin accessibility and scaled gene expression at IKZF3, CCL5, IFI16, IFNG, and IL2RB in proliferating cells in viremia. (I) Highlighted red on the genome track corresponds to significantly differentially accessible peaks called by MACS3 (FDR-adjusted P < 0.05, min.pct ≥ 0.05, log2FC ≥ 0.15) (see Figure S2) and overlap with candidate cis-regulatory elements as predicted by ENCODE Registry of Candidate Cis-Regulatory Elements (cCREs). All transcription factors were identified using the JASPAR2022 Core Vertebrates collection, with binding confidence of P > 0.05 by PWMscan. (I) The corresponding RNA expression of genes. * P < 0.05, ** P < 0.01, *** P < 0.001, Wilcoxon rank-sum test. See also Figures S1–S4.
