

Abstract
Background:
Thiazide diuretics (TD) are the first-line treatment of hypertension (HTN) because of its consistent benefit in lowering BP and cardiovascular risk. TD is also known to cause excess risk of diabetes mellitus, which may limit long-term use. Although potassium (K) depletion was thought to be the main mechanism of TD-induced hyperglycemia, TD also triggers magnesium (Mg) depletion. However, the role of Mg supplementation in modulating metabolic side-effects of TD has not been investigated. Therefore, we aim to determine the effect of KMgCitrate on fasting plasma glucose (FPG) and liver fat by magnetic resonance imaging (MRI) during TD therapy.
Methods:
Accordingly, we conducted a double-blinded RCT in 60 nondiabetic HTN patients to compare the effects of KCl vs. KMgCitrate during chlorthalidone (CTD) treatment. Each patient received CTD alone for 3-weeks before randomization. Primary endpoint was the change in FPG after 16-weeks of KCl or KMgCit supplementation from CTD alone.
Results:
Mean age of subjects was 59±11 years (30% Black participants). CTD alone induced a significant rise in FPG, and a significant fall in serum K, serum Mg, and 24-h urinary citrate excretion (all p<0.05). KMgCit attenuated the rise in FPG by 7.9 mg/dL vs. KCl (p<0.05), which was not observed with KCl. There were no significant differences in liver fat between the two groups.
Conclusion:
KMgCit is superior to KCl, the common form of K supplement used in clinical practice, in preventing TD-induced hyperglycemia. This action may improve tolerability and cardiovascular safety in hypertensive patients treated with this drug class.
Keywords: Chlorthalidone, Potassium Magnesium Citrate, Metabolic Side Effects, Thiazide Diuretics, Hyperglycemia, Diabetes Mellitus, Hypertension
Graphical Abstract

Introduction
Thiazide diuretics (TD), particularly chlorthalidone (CTD), are considered the first-line treatment of hypertension (HTN) by many guidelines1,2 because of its superiority in reducing BP compared to other classes of antihypertensive drugs. TD is known to cause a number of metabolic side effects such as hypokalemia, dyslipidemia, and insulin resistance, raising safety concerns over lifetime use3,4. Mechanisms underlying TD-induced insulin resistance are poorly understood. Hypokalemia was thought to be the main mechanism of TD-induced hyperglycemia, possibly via impairing pancreatic insulin release and peripheral insulin sensitivity5. Another mechanism proposed is the TD-induced activation of renin-angiotensin-aldosterone-system (RAAS), which can cause an inflammatory state in addition to renal K wasting6. However, potassium (K) supplementation alone has not consistently prevented TD-induced hyperglycemia, despite maintaining normal serum K concentration4,7. In addition to reducing serum K, TD also triggers magnesium (Mg) depletion, which is preventable by Mg supplementation alone or in combination with K8,9. Clinical implications of Mg depletion associated with TD use is unknown, but numerous epidemiological studies have demonstrated a protective role of dietary Mg against the metabolic syndrome10,11. Accordingly, we conducted a randomized clinical trial to determine the effect of KMgCit in modulating metabolic side effects of TD in hypertensive patients.
Methods
The data that support the findings of this study are available from the corresponding author upon reasonable request. We conducted studies in 60 subjects with treated or untreated HTN with office systolic BP 130–159 or diastolic BP 80–99 mmHg (NCT02665117) after obtaining written informed consent. The study was approved by the Institutional Review Board of the University of Texas Southwestern Medical Center. Key exclusion criteria include concomitant cardiovascular diseases, chronic kidney diseases, or compelling indication for treatment with angiotensin converting enzyme inhibitor (ACEI), beta blockers (BB), or angiotensin receptor blocker (ARB), type-2 diabetes mellitus (T2DM), unprovoked hypokalemia (serum K < 3.5 mmol/L) or hyperkalemia (serum K > 5.3 mmol/L), or requirement for any K supplement on a regular basis for any reason, such as primary aldosteronism. Complete exclusion criteria are provided in the Supplemental Materials.
The study included four consecutive phases (Figure 1). Phase 1 (3–12 weeks) was a screening period during which patients continued their individual background therapy. During phase 2, the patients were asked to discontinue their antihypertensive medications for 3 weeks and were seen weekly in the research clinic for BP monitoring4. Phase 3 was the active-treatment period in which patients received open label chlorthalidone (CTD, 25 mg daily) for 3 weeks. Participants who developed hypokalemia (serum K of < 3.5 mmol/L) were able to enter phase 4 after 2 weeks of CTD therapy without delay for safety reasons. During phase 4, each subject was randomized to receive either KCl powder containing 40 mEq KCl /day (n=31) vs. KMgCit (IND 116,208) powder containing 40 mEq K, 20 mEq Mg and 74 mEq citrate/day (n=29) in a double-blinded manner. Additional details regarding each study phase, biochemical12–14, hormonal15, muscle free Mg concentration16,17, side effects9, and hepatic fat measurements18, are provided in the Supplemental Materials.
Figure 1.
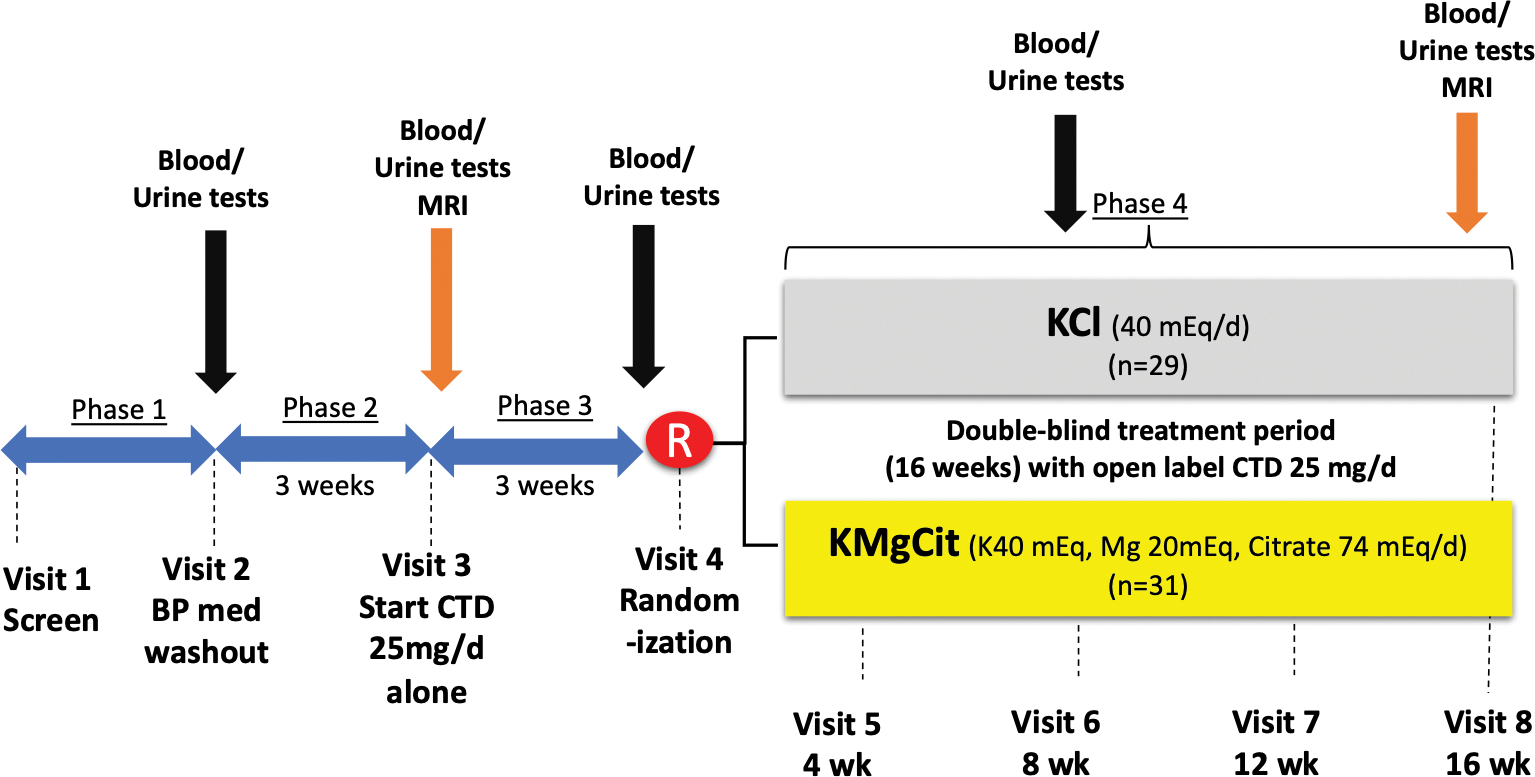
Study visits and interventions.
Note: total of 39 participants underwent MRI for measures of muscle Mg and hepatic fat (20 from KCl group, and 19 from KMgCit group, respectively).
Statistical Methods
It was determined that 60 participants (randomized 1:1 to each study arm) would provide power of at least 0.80 at α=0.05 to detect differences in FPG (primary outcome) of 6.5 mg/dL with SD of delta of 8.5 between the two study arms for the 4-month response. This sample size would also provide power to detect a net mean difference in HOMA-IR of 0.59 (assuming SD of 0.8), muscle Mg of 0.06 mM (assuming SD of 0.08), and hepatic fat of 2.9% (assuming SD of 4.0). Although it was expected that serum K would be similar in both arms, the sample size of 60 yielded power to detect the mean difference in mean serum of K of at least 0.22 mEq/L (assuming SD of 0.3). To account for a dropout rate of 20%, we had planned to enroll 72 participants for this study. During the COVID-19 pandemic between 2020–2021, the research MRI scans were all suspended and the requirement for MRI was discontinued. Participants were allowed to continue study intervention and collection of data for primary endpoint (FPG) and other secondary endpoints.
All statistical analysis was conducted using SAS 9.4 (SAS Institute Inc., Cary, NC). To assess the extent of CTD-induced metabolic side effects, a linear mixed model was used to determine changes in plasma and urinary levels of fasting glucose (FPG), insulin, HOMA-IR, potassium (K), Mg, sodium (Na), calcium (Ca), phosphate (Pi), renin, aldosterone, parathyroid hormone (PTH), Klotho, fibroblast growth factor-23 (FGF-23), high-sensitivity C-reactive protein (hs-CRP), and 8-isoprostane (8-IsoP) after CTD alone for 3 weeks (during phase 3) from washout period in phase 2. Similarly, a linear mixed model was used to compare the change during KCl vs. KMgCit supplementation at the end of phase 4 from CTD alone in phase 3 of plasma and urinary levels of FPG, insulin HOMA-IR, K, Mg, Na, Ca, Pi, renin, aldosterone, PTH, Klotho, FGF-23, hs-CRP, and 8-IsoP. The model included treatment group effect (KCl vs. KMgCit), visit, and group-by-visit interaction with the corresponding baseline plasma and urinary levels prior to randomization (at the end of phase 3 or CTD alone) as covariates. If the model assumptions were not met, rank transformation was applied. The primary endpoint was FPG. The primary efficacy endpoint was summarized by previous treated vs. untreated HTN. For continuous secondary efficacy variables, the same analysis model was used. Significance (α-level) was defined as p <0.05. No multiplicity adjustment was applied to the analysis of all variables.
Results
Overall, 109 individuals were screened, and 81 participants met inclusion/exclusion criteria. The most common reason for exclusion prior to randomization was abnormal laboratory test results or medical history (18% of all screened patients). Among the 81 participants who met inclusion/exclusion criteria, 21 dropped out prior to randomization. The reasons for dropout included 7 new medical problems unrelated to study interventions (n=7), side effects to CTD (n=4), relocation/scheduling issue (n=6), incidental findings detected during MRI scan (n=2), claustrophobia (n=1), and non-compliance to CTD (n=1). The remaining 60 subjects were randomized to KCl or KMgCit (figure 1) and all completed 16-week study intervention. Due to the suspension of research MRI scans during COVID-19, muscle mg and liver data were only available in 39 participants (20 from KCl group and 19 from KMgCit group). Characteristics of participants during the screening period (phase 1) are shown in Table 1.
Table 1.
Subject Characteristics at Screening
| Variables | KCl (n=31) | KMgCit (n=29) |
|---|---|---|
|
| ||
| Age (year) | 58.1 ± 12.8 | 60.7 ± 9.3 |
| Sex (M/F) | 20/11 | 15/14 |
| Black Participants (%) | 22.58% | 34.48% |
| Body Mass Index, kg/m2 | 29.0 ± 5.7 | 28.8 ± 4.6 |
| Systolic Blood Pressure, mmHg | 127.9 ± 13.0 | 128.9 ± 10.6 |
| Diastolic Blood Pressure, mmHg | 80.2 ± 7.1 | 77.4 ± 8.8 |
| Heart Rate, bpm | 66.6 ± 12.6 | 63.6 ± 8.9 |
| Fasting Plasma Glucose, mg/dL | 92.6 ± 7.9 | 93.6 ± 9.5 |
| Creatinine Clearance, mL/min | 123.4 ± 42.8 | 104.2 ± 33.4 |
| Serum Creatinine, mg/dL | 0.84 ± 0.14 | 0.89 ± 0.16 |
| Serum Sodium, mmol/L | 139.4 ± 2.23 | 138.9 ± 2.04 |
| Serum Potassium, mmol/L | 4.19 ± 0.27 | 4.2 ± 0.36 |
| Serum Calcium, mg/dL | 9.51 ± 0.45 | 9.59 ± 0.28 |
| Serum Magnesium, mg/dL | 2.08 ± 0.11 | 2.07 ± 0.18 |
| Serum Phosphorus, mg/dL | 3.42 ± 0.48 | 3.65 ± 0.50 |
Responses to CTD alone
We found that, prior to randomization, CTD alone induced a significant reduction in office BP, body weight, serum K, Na, 24-hour urinary Ca, 24-hour urinary uric acid, and 24-hour urinary citrate excretion; and a significant increase in levels of heart rate, urine pH, FPG, insulin, HOMA-IR, total cholesterol, LDL-C, serum Ca, klotho, renin, and aldosterone levels (Table 2 and Figure 2). Serum Mg was also reduced by CTD (p = 0.0506, Figure 2). These changes were not different among participants in two groups (all interaction p-value > 0.05, Table 2). CTD had no effect on levels of HDL-C, triglyceride, plasma 8-IsoP, 24-hour urinary Na, or 24-hour urinary K, and 24-hour urinary Mg excretion.
Table 2.
Biochemical and BP Response to CTD Alone
| Variables | KCl (n=31) | KMgCit (n=29) | P - value | ||||
|---|---|---|---|---|---|---|---|
|
|
|||||||
| Baseline (washout) | Post-CTD alone | Baseline (washout) | Post-CTD alone | CTD Factor | Group | Interaction * | |
|
|
|||||||
| Body weight, kg | 86.0 ± 20.8 | 85.2 ± 20.5 | 81.9 ± 14.3 | 80.7 ± 14.2 | <0.01 | 0.35 | 0.12 |
| SBP, mmHg | 142.5 ± 18.3 | 132.0 ± 12.9 | 144.8 ± 15.3 | 129.0 ± 14.0 | <0.01 | 0.92 | 0.18 |
| DBP, mmHg | 85.8 ± 8.8 | 82.5 ± 7.1 | 84.9 ± 6.5 | 81.2 ± 8.0 | <0.01 | 0.54 | 0.84 |
| Heart Rate, bpm | 66.5 ± 12.2 | 68.5 ± 11.1 | 65.2 ± 10.2 | 69.7 ± 10.9 | <0.01 | 0.98 | 0.14 |
| Glucose, mg/dL | 92.1 ± 10.6 | 95.1 ± 12.6 | 94.0 ± 10.9 | 96.1 ± 9.7 | 0.04 | 0.56 | 0.71 |
| Insulin, mU/L | 12.6 ± 7.4 | 14.6 ± 8.6 | 14.8 ± 9.2 | 16.2 ± 9.5 | <0.01 | 0.41 | 0.56 |
| HOMA-IR | 1.6 ± 1.0 | 1.9 ± 1.1 | 1.9 ± 1.2 | 2.4 ± 1.9 | <0.01 | 0.37 | 0.76 |
| Total Chol, ng/ml | 176.9 ± 39.6 | 180.5 ± 39.7 | 180.3 ± 36.7 | 187.0 ± 40.3 | 0.01 | 0.58 | 0.35 |
| HDL-C, mg/dL | 54.1 ± 17.0 | 52.9 ± 16.1 | 52.4 ± 16.6 | 54.6 ± 17.4 | 0.61 | 0.98 | 0.04 |
| LDL-C, mg/dL | 102.5 ± 32.5 | 106.6 ± 35.1 | 106.5 ± 28.9 | 109.3 ± 30.7 | 0.03 | 0.62 | 0.99 |
| TG, mg/dL | 101.8 ± 49.6 | 113.7 ± 73.2 | 113.8 ± 49.1 | 125.5 ± 45.3 | 0.07 | 0.38 | 0.94 |
| iPTH, pg/mL | 51.9 ± 23.4 | 53.8 ± 52.0 | 60.6 ± 35.3 | 60.0 ± 63.4 | 0.05 | 0.47 | 0.91 |
| Klotho, pmol/L | 19.1 ± 10.7 | 24.3 ± 13.3 | 19.6 ± 10.5 | 20.6 ± 13.0 | 0.01 | 0.61 | 0.11 |
| FGF-23, pg/mL | 247.5 ± 953.2 | 691.4 ± 2916.3 | 92.10 ± 111.6 | 114.3 ± 191.9 | 0.42 | 0.72 | 0.55 |
| Renin, pg/mL | 374.3 ± 209.0 | 652.2 ± 444.7 | 332.1 ± 216.0 | 714.2 ± 416.8 | <0.01 | 0.91 | 0.26 |
| Aldo, pg/mL | 189.1 ± 91.0 | 221.9 ± 92.8 | 159.9 ± 74.8 | 227.8 ± 114.2 | <0.01 | 0.56 | 0.18 |
| Serum Measures | |||||||
| Na, mmol/L | 139.2 ± 2.08 | 136.9 ± 2.42 | 138.8 ± 2.27 | 137.1 ± 2.34 | <0.01 | 0.78 | 0.51 |
| K, mmol/L | 4.23 ± 0.26 | 3.69 ± 0.31 | 4.19 ± 0.21 | 3.59 ± 0.31 | <0.01 | 0.24 | 0.49 |
| Ca, mg/dL | 9.30 ± 0.38 | 9.57 ± 0.38 | 9.37 ± 0.34 | 9.61 ± 0.37 | <0.01 | 0.55 | 0.68 |
| Mg, mg/dL | 2.05 ± 0.10 | 1.99 ± 0.17 | 2.00 ± 0.13 | 1.98 ± 0.21 | 0.05 | 0.39 | 0.41 |
| Pi, mg/dL | 3.43 ± 0.38 | 3.35 ± 0.42 | 3.33 ± 0.51 | 3.45 ± 0.42 | 0.79 | 0.97 | 0.16 |
| CO2, mmol/L | 24.4 ± 2.0 | 26.5 ± 2.3 | 24.6 ± 2.3 | 26.3 ± 2.6 | <0.01 | 0.91 | 0.40 |
| 8-isoP, pg/mL | 577.6 ± 530.0 | 593.8 ± 625.1 | 596.3 ± 537.3 | 577.3 ± 543.7 | 0.82 | 0.52 | 0.98 |
| hs-CRP, ng/mL | 5.49 ± 11.70 | 7.54 ± 15.24 | 5.74 ± 8.29 | 4.87 ± 5.65 | 0.14 | 0.48 | 0.45 |
| Urinary Measures | |||||||
| Na, mmol/24-h | 129.6 ± 61.4 | 134.2 ± 61.8 | 140.6 ± 66.2 | 134.9 ± 50.3 | 0.94 | 0.66 | 0.52 |
| K, mmol/24-h | 54.1 ± 20.6 | 55.4 ± 23.5 | 47.4 ± 15.0 | 51.1 ± 20.7 | 0.25 | 0.25 | 0.57 |
| Ca, mg/24-h | 169.6 ± 109.0 | 119.6 ± 90.9 | 164.3 ± 86.5 | 105.0 ± 102.8 | <0.01 | 0.67 | 0.62 |
| Mg, mg/24-h | 95.6 ± 42.6 | 100.2 ± 48.4 | 90.0 ± 31.9 | 96.6 ± 38.3 | 0.20 | 0.64 | 0.81 |
| Pi, mg/24-h | 827.6 ± 380.3 | 751.7 ± 323.4 | 799.6 ± 364.9 | 739.9 ± 338.5 | 0.11 | 0.81 | 0.85 |
| Citrate, mg/24-h | 562.8 ± 216.1 | 427.3 ± 299.5 | 626.1 ± 304.3 | 405.8 ± 206.3 | <0.01 | 0.73 | 0.14 |
| NAE, mEq/24-h | 52.1 ± 36.7 | 53.2 ± 30.7 | 53.3 ± 33.3 | 52.7 ± 32.3 | 0.96 | 0.96 | 0.86 |
| 8-isoP, ng/mg Cr | 1.14 ± 0.64 | 1.05 ± 0.37 | 1.29 ± 1.16 | 1.26 ± 0.87 | 0.50 | 0.35 | 0.75 |
| pH | 6.0 ± 0.5 | 6.1 ± 0.5 | 5.8 ± 0.4 | 6.1 ± 0.5 | 0.02 | 0.65 | 0.18 |
| Uric Acid, mg/24-h | 587.0 ± 268.7 | 533.4 ± 233.7 | 506.2 ± 167.6 | 475.8 ± 176.9 | 0.04 | 0.19 | 0.57 |
Interaction between CTD effect and group (KMgCit vs KCl).
Aldo; aldosterone, Ca; calcium, DBP; diastolic blood pressure, FGF-23; fibroblast growth factor 23, HDL-C; high density lipoprotein cholesterol, hs-CRP; high-sensitivity C-reactive protein, iPTH; intact parathyroid hormone, K; potassium, LDL-C; low density lipoprotein cholesterol, Mg; magnesium, Na; sodium, NAE; net acid excretion, Pi; phosphorous, SBP; systolic blood pressure, TG; triglycerides, 8-isoP; 8-isoprostanes.
Figure 2.

Summary data showing mean and 95% confidence intervals.
Fasting serum A) glucose, B) insulin, C) potassium, and D) magnesium in the KCl vs. KMgCit group at baseline and in response to CTD alone prior to randomization. * P < 0.05 post-CTD alone vs Baseline.
Responses to KCl vs. KMgCit
As expected, 24-h urinary citrate excretion was significantly increased while 24-h NAE was significantly reduced in the KMgCit group than the KCl group (all p < 0.05, Table 3). Urine pH was also significantly increased in the KMgCit group then the KCl group (interaction p-value < 0.01, Table 3). Moreover, 24-h urinary Mg and 24-h urinary uric acid significantly increased in both KCl and KMgCit group, however there was no significant interaction (p < 0.05 for time, interaction p-value = 0.10, Table 3). Serum K was also increased significantly in both KCl and KMgCit group, but the magnitude of increase was greater in the KMgCit than KCl group at week 16 visit (p < 0.01 for time, interaction p value = 0.04, Table 3 and Figure 3). There was no significant change in serum Mg, or muscle tissue Mg by MRI, between the 2 groups (Table 3 and Figure 3, and Figure S1, respectively). KMgCit significantly reduced FPG by 5.6 mg/dL compared to pre-randomization values, and by 7.9 mg/dL compared to KCl group at week 16 (p < 0.05, Figure 3), while KCl had no significant effect on FPG. Fasting plasma insulin, HOMA-IR, Na, Ca, Pi, renin, aldosterone, PTH, Klotho, FGF-23, hs-CRP, and 8-IsoP, were not altered by KMgCit or KCl (Table 3). Further, hepatic fat was not altered by KMgCit or KCl (Figure S1). Similarly, SBP, DBP, and HR were not altered by KMgCit or KCl (Table 3). Response to KMgCit vs KCl among untreated hypertensive patients (n=9), and previously treated hypertensive patients (n=51), are shown in Table S1 and S2, respectively. Overall, FPG response to KMgCit vs KCl was not modified by treatment status prior to study enrollment (interaction p-value = 0.9).
Table 3.
Biochemical and BP Response to KCl vs. KMgCit from CTD Alone
| Variables | KCl (n=31) | KMgCit (n=29) | P - value | |||
|---|---|---|---|---|---|---|
|
|
||||||
| 8 weeks | 16 weeks | 8 weeks | 16 weeks | Time | Interaction * | |
|
|
||||||
| ΔBody weight, kg | −0.1 ± 2.0 | 0.0 ± 2.7 | 0.0 ± 1.6 | 0.0 ± 1.4 | 0.96 | 0.99 |
| ΔSBP, mmHg | −5.3 ± 11.8† | −9.4 ± 11.5† | −4.8 ± 14.8† | −5.6 ± 11.9† | <0.01 | 0.38 |
| ΔDBP, mmHg | −3.7 ± 6.7† | −5.4 ± 7.1† | −3.3 ± 8.0† | −4.9 ± 7.3† | <0.01 | 0.96 |
| ΔHeart Rate, bpm | 0.9 ± 7.2 | 0.9 ± 5.5 | 0.1 ± 7.4 | 1.3 ± 10.1 | 0.58 | 0.79 |
| ΔGlucose, mg/dL | 0.8 ± 11.9 | 2.3 ± 9.9 | −2.3 ± 9.2 | −5.6 ± 13.3†‡ | 0.53 | 0.03 |
| ΔInsulin, mU/L | 1.2 ± 4.1 | 2.8 ± 7.7 | 2.1 ± 9.5 | 1.6 ± 9.3 | 0.68 | 0.85 |
| ΔHOMA-IR | 0.2 ± 0.5 | 0.4 ± 1.0† | 0.2 ± 1.1 | 0.2 ± 1.1 | 0.08 | 0.41 |
| ΔTotal Chol, | 1.1 ± 24.5 | 2.8 ± 20.9 | 11.8 ± 25.7† | 4.9 ± 22.5 | 0.10 | 0.14 |
| ΔHDL-C, mg/dL | 1.7 ± 6.3 | 0.9 ± 8.7 | 3.0 ± 6.6† | 3.8 ± 8.5† | 0.02 | 0.39 |
| ΔLDL-C, mg/dL | 2.2 ± 19.5 | 3.4 ± 14.5 | 8.8 ± 23.4† | 2.7 ± 21.2 | 0.10 | 0.26 |
| ΔTG, mg/dL | −12.9 ± 50.8 | −6.0 ± 71.6 | 4.3 ± 46.0 | −8.1 ± 49.9 | 0.62 | 0.19 |
| ΔiPTH, pg/mL | −0.3 ± 49.3 | −7.4 ± 47.0 | −10.0 ± 53.1 | −4.0 ± 28.4 | 0.57 | 0.38 |
| ΔKlotho, pmol/L | −1.7 ± 10.6 | −1.6 ± 10.10 | 0.6 ± 8.5 | −0.9 ± 7.1 | 0.59 | 0.50 |
| ΔFGF-23, pg/mL | −3.4 ± 74.4 | 13.6 ± 104.2 | 19.2 ± 98.4 | 38.1 ± 123.3 | 0.19 | 0.68 |
| ΔRenin, pg/mL | −37.1 ± 208.3 | 12.4 ± 202.6 | 1.3 ± 175.4 | 1.5 ± 237.2 | 0.57 | 0.56 |
| ΔAldo, pg/mL | 50.3 ± 105.8† | 46.0 ± | 14.5 ± 121.5 | 27.1 ± 123.1 | 0.03 | 0.44 |
| Serum Measures | ||||||
| ΔNa, mmol/L | 0.55 ± 1.82 | 1.06 ± 2.93 | −0.04 ± 2.30 | 0.29 ± 2.39 | 0.12 | 0.46 |
| ΔK, mmol/L | 0.21 ± 0.49† | 0.00 ± 0.28 | 0.12 ± 0.38 | 0.18 ± 0.34† | <0.01 | 0.04 |
| ΔCa, mg/dL | −0.10 ± 0.26† | −0.05 ± 0.34 | −0.01 ± 0.29 | 0.00 ± 0.25 | 0.39 | 0.30 |
| ΔMg, mg/dL | 0.00 ± 0.14 | 0.04 ± 0.19 | 0.09 ± 0.21†‡ | 0.08 ± 0.17† | 0.04 | 0.09 |
| ΔPi, mg/dL | −0.13 ± 0.35† | 0.05 ± 0.35 | −0.11 ± 0.38 | −0.05 ± 0.48 | 0.03 | 0.94 |
| ΔCO2, mmol/L | −0.4 ± 2.3† | −0.5 ± 2.6 | 0.8 ± 2.1‡ | 0.1 ± 2.4 | 0.42 | 0.10 |
| Δ8-isoP, pg/mL | −140 ± 491.1 | −81.8 ± 756.0 | 64 ± 616.5 | 23.2 ± 509.6 | 0.36 | 0.68 |
| Δhs-CRP, ng/mL | −1.23 ± 6.85 | 1.63 ± 11.82 | −0.34 ± 5.05 | 0.68 ± 4.42 | 0.10 | 0.99 |
| Urinary Measures | ||||||
| ΔNa, mmol/24-h | 16.1 ± 75.0 | 15.2 ± 58.8 | 14.5 ± 70.4 | 28.5 ± 65.5† | 0.06 | 0.66 |
| ΔK, mmol/24-h | 31.4 ± 32.7† | 25.7 ± 28.1† | 35.6 ± 31.9† | 31.0 ± 29.1† | <0.01 | 0.80 |
| ΔCa, mg/24-h | 22.6 ± 69.5† | 26.8 ± 67.0† | 10.4 ± 64.9 | 22.1 ± 63.6 | 0.02 | 0.70 |
| ΔMg, mg/24-h | 20.3 ± 37.9† | 12.7 ± 36.5 | 34.1 ± 58.7† | 40.3 ± 46.6†‡ | <0.01 | 0.10 |
| ΔPi, mg/24-h | 58.5 ± 298.5 | 87.9 ± 273.5 | 10.0 ± 279.2 | 58.7 ± 425.6 | 0.26 | 0.82 |
| ΔCitrate, mg/24-h | 98.0 ± 204.1† | 32.5 ± 204.9 | 260.6 ± 270.4†‡ | 266.2 ± 287.0†‡ | <0.01 | <0.01 |
| ΔNAE, mEq/24-h | 13.7 ± 60.8 | 15.2 ± 34.0 | −38.3 ± 34.2†‡ | −25.6 ± 56.5†‡ | 0.15 | <0.01 |
| Δ8-isoP, ng/mg Cr | 0.33 ± 1.5 | 0.09 ± 0.48 | 0.12 ± 0.63 | 0.21 ± 0.67 | 0.22 | 0.43 |
| ΔpH | 0.01 ± 0.53 | 0.03 ± 0.53 | 0.48 ± 0.53†‡ | 0.42 ± 0.59†‡ | <0.01 | <0.01 |
| ΔUric Acid, mg/24-h | 60.5 ± 168.0 | 69.2 ± 195.0 | 51.7 ± 192.8 | 92.2 ± 176.1† | <0.01 | 0.80 |
Interaction between group (KMgCit vs KCl) by time.
P < 0.05 vs week 0
P < 0.05 vs KCl.
Aldo; aldosterone, Ca; calcium, DBP; diastolic blood pressure, FGF-23; fibroblast growth factor 23, HDL-C; high density lipoprotein cholesterol, hs-CRP; high-sensitivity C-reactive protein, iPTH; intact parathyroid hormone, K; potassium, LDL-C; low density lipoprotein cholesterol, Mg; magnesium, Na; sodium, NAE; net acid excretion, Pi; phosphorous, SBP; systolic blood pressure, TG; triglycerides, 8-isoP; 8-isoprostanes.
Figure 3.

Summary data showing mean change (Δ) and 95% confidence intervals post-randomization. A) fasting plasma glucose, B) serum potassium, C) serum magnesium, D) 24-hour urinary K exertion, E) 24-hour urinary Mg excretion, and F) 24-hour urinary citrate excretion in the KCl vs. KMgCit group during follow-up. * P < 0.05 vs week 0, † P < 0.05 vs KCl.
Discussion
There are three major findings of our study. First, Mg supplementation in the form of KMgCit is more effective in reversing detrimental effect of CTD, a thiazide-like diuretic, on plasma glucose than KCl, which is the typical form of K supplementation used in clinical practice. Second, the beneficial effects of KMgCit were not accounted for by modulation in RAAS, which was activated by thiazide diuretics. Third, the improvement in plasma glucose was not accompanied by alteration in oxidative stress marker, liver fat, or tissue Mg in the skeletal muscle.
Thiazide diuretics (TD) are known to induce a variety of metabolic disturbances, including electrolyte abnormalities, elevated plasma glucose, increased total cholesterol levels, and escalated risk of diabetes mellitus 19–21. Although hypokalemia is proposed to be the main mechanisms underlying a lot of its metabolic side effects, K supplementation in the form of KCl has not been shown to prevent CTD induced elevation in FPG 4,7. In addition to hypokalemia, TD induce a significant reduction in serum Mg which was evident within 2–3 weeks of administration8. Previous studies have also shown that short term administration of KMgCit is equally effective as KCl in attenuating hydrochlorothiazide (HCTZ)-induced hypokalemia22,23. However, the duration of KMgCit in previous studies was limited to only 3 weeks22,23, which was not sufficient to allow detection of its potential effect on the glucose metabolism. In the present study, CTD induced a small but significant reduction in serum Mg and K within 3 weeks of administration similar to effects of HCTZ. Furthermore, we found that 16-week of KMgCit is superior to KCl in attenuating CTD-induced hyperglycemia.
Mechanisms underlying benefits of KMgCit in preventing CTD-induced hyperglycemia is unknown. In addition to hypokalemia, TD triggers a sustained activation of RAAS 24 and of the sympathetic nervous system4 in hypertensive patients, which is not explained by hypokalemia alone4,7. Sympathetic activation has been implicated in the pathogenesis of insulin resistance, both by skeletal muscle blood flow-dependent25, and flow-independent mechanisms26, while RAAS activation is also known to inhibit insulin signaling in the adipocytes and skeletal muscle27,28, resulting in impaired insulin-mediated glucose uptake28. Although we did not assess sympathetic nerve activity directly, KMgCit did not attenuate the rise in circulating renin and aldosterone levels, or the small but significant rise in heart rate induced by CTD in our study, suggesting the effect of Mg and/or citrate may be direct.
Several studies also suggested a protective role of Mg intake on the metabolic syndrome. In rats subjected to a Mg-deficient diet, hypomagnesemia had a deleterious effect on glucose metabolism by impairing both insulin secretion and signaling29. In normal volunteers, exposure to low Mg diet for 4 weeks resulted in impaired intravenous glucose tolerance test30. Mg supplementation was also shown to reduce and delay the postprandial rise in serum non-esterified fatty acid and triglyceride levels after a fat load in normal volunteers31. In a meta-analysis from 6 cross-sectional studies, including a total of 24,473 individuals, an inverse association between Mg intake and the risk of metabolic syndrome was observed10. Similarly, citrate supplementation in the form of K citrate (KCit) was shown to reduce marker of insulin resistance (HOMA-IR) in prediabetic subjects, which was not observed with KCl administration32. Several populational studies have shown an association between dietary acid load and insulin resistance as well as the risk of T2DM33. In the NHANES surveys, low serum bicarbonate and high anion gap were independently associated with increased plasma fasting insulin and high triglyceride (TG) levels 34.
A previous trial in hypertensive patients with heart failure with preserved ejection fraction showed that low sodium plus Dietary Approaches to Stop Hypertension (DASH) diet, which is rich in K, Mg, and alkali from the high fruits and vegetables content, reduced urinary F2-isoprostanes by 31%, suggesting decreased oxidative stress35. Our previous trial in patients with Pre- or Stage-I HTN also showed that KMgCit is more effective than KCit, KCl, and placebo, in reducing oxidative stress as evidenced by a significant decline in urinary 8-isoprostanes12. However, none of hypertensive subjects in previous study received diuretic treatment and fasting plasma glucose and insulin were not measured during the study. In the current study, however, we did not find alterations in serum or urinary 8-isoprostane levels with KMgCit during CTD treatment.
Our study is limited by the short duration of the study and inability to separate effects of citrate from Mg on the metabolic outcomes. The increase in serum Mg after KMgCit was relatively modest but nevertheless identical to change observed in our previous study12. The lack of statistical difference in serum Mg between KMgCit vs. KCl group (p = 0.09) is likely to be due to small sample size. Citrate supplementation may further promote metabolic alkalosis induced by chlorthalidone alone and may limit the use of KMgCit in patients with preexisting systemic alkalosis. The glucose lowering effect of KMgCit was observed only among patients treated with CTD in our study and may not be extrapolated to population without diuretic therapy. This is an important distinction as previous randomized clinical trials have not shown a consistent reduction in plasma glucose after Mg supplementation in type 2 DM without diuretic therapy36–41. Despite this limitation, our study has significant implications as TD are the second most prescribed class of antihypertensive in the US 42. Despite the increasing popularity, the excess risk of T2DM associated with TD use may fuel the epidemic of T2DM in the U.S.43,44, and limit its potential cardiovascular benefit when given as a life-long antihypertensive agent. Our current study suggests a novel effect of KMgCit supplementation in addressing not only electrolyte abnormalities more completely, but also in preventing adverse metabolic effects without increased gastrointestinal side-effects. Future studies are needed to determine if KMgCit is superior to KCl in improving cardiovascular outcomes in hypertensive patients treated with thiazide diuretics.
Perspectives
In summary, we identify a novel action of potassium-magnesium-citrate (KMgCit) supplementation in preventing chlorthalidone (CTD)-induced rise in fasting plasma glucose in hypertensive patients, which was not observed with KCl supplementation. These findings suggest that KMgCit may offer a superior alternative to KCl, typically used in clinical practice, in maintaining serum potassium during thiazide-diuretic treatment while avoiding of thiazide-induced hyperglycemia.
Supplementary Material
Novelty and Relevance:
What is new?
We identify a novel action of potassium-magnesium-citrate (KMgCit) supplementation in preventing chlorthalidone (CTD)-induced rise in fasting plasma glucose in hypertensive patients, which was not observed with KCl supplementation.
The beneficial effects of KMgCit were not explained by modulation in the renin-angiotensin-activation system, oxidative stress markers, liver fat, or tissue Mg in the skeletal muscle, suggesting a potential direct effect of Mg and/or citrate.
What Is Relevant?
KMgCit may offer a superior alternative to KCl in maintaining serum potassium during thiazide-diuretic treatment while avoiding of thiazide-induced hyperglycemia; this may alleviate the rising epidemic of type-2 diabetes mellitus.
Clinical/Pathophysiological Implications?
Future studies are needed to determine the mechanism of KMgCit action and if the benefit of KMgCit will translate into improved cardiovascular outcomes during thiazide-diuretic treatment.
Sources of Funding:
Study is funded by the Pak Center Endowed Professor Collaborative Support grant to WV and T32 DK007257 to GK
Disclosure:
Drs. Pak, Vongpatanasin, and Moe are inventors of the patent US-2017/0281578-Al under the application by The Board of Regents of the University of Texas System, Austin, Texas.
Nonstandard Abbreviations
- TD
Thiazide diuretics
- CTD
Chlorthalidone
- HTN
Hypertension
- RAAS
Renin-Angiotensin-Aldosterone-System
- KCl
Potassium Chloride
- KMgCit
Potassium Magnesium Citrate
Footnotes
References
- 1.Whelton PK, Carey RM, Aronow WS, Casey DE Jr., Collins KJ, Dennison Himmelfarb C, DePalma SM, Gidding S, Jamerson KA, Jones DW, et al. 2017 ACC/AHA/AAPA/ABC/ACPM/AGS/APhA/ASH/ASPC/NMA/PCNA Guideline for the Prevention, Detection, Evaluation, and Management of High Blood Pressure in Adults: Executive Summary: A Report of the American College of Cardiology/American Heart Association Task Force on Clinical Practice Guidelines. Circulation. 2018;138:e426–e483. doi: 10.1161/CIR.0000000000000597 [DOI] [PubMed] [Google Scholar]
- 2.Williams B, Mancia G, Spiering W, Agabiti Rosei E, Azizi M, Burnier M, Clement D, Coca A, De Simone G, Dominiczak A, et al. 2018 Practice Guidelines for the management of arterial hypertension of the European Society of Cardiology and the European Society of Hypertension. Blood Press. 2018;27:314–340. doi: 10.1080/08037051.2018.1527177 [DOI] [PubMed] [Google Scholar]
- 3.The Antihypertensive and Lipid-Lowering Treatment to Prevent Heart Attack Trial (ALLHAT). Major Outcomes in High-Risk Hypertensive Patients Randomized to Angiotensin-Converting Enzyme Inhibitor or Calcium Channel Blocker vs Diuretic. JAMA. 2002;288:2981–2997. [DOI] [PubMed] [Google Scholar]
- 4.Menon DV, Arbique D, Wang Z, Adams-Huet B, Auchus RJ, Vongpatanasin W. Differential effects of chlorthalidone versus spironolactone on muscle sympathetic nerve activity in hypertensive patients. The Journal of clinical endocrinology and metabolism. 2009;94:1361–1366. doi: 10.1210/jc.2008-2660 [DOI] [PMC free article] [PubMed] [Google Scholar]
- 5.Ekmekcioglu C, Elmadfa I, Meyer AL, Moeslinger T. The role of dietary potassium in hypertension and diabetes. J Physiol Biochem. 2016;72:93–106. doi: 10.1007/s13105-015-0449-1 [DOI] [PubMed] [Google Scholar]
- 6.Lastra G, Dhuper S, Johnson MS, Sowers JR. Salt, aldosterone, and insulin resistance: impact on the cardiovascular system. Nat Rev Cardiol. 2010;7:577–584. doi: 10.1038/nrcardio.2010.123 [DOI] [PubMed] [Google Scholar]
- 7.Raheja P, Price A, Wang Z, Arbique D, Adams-Huet B, Auchus RJ, Vongpatanasin W. Spironolactone prevents chlorthalidone-induced sympathetic activation and insulin resistance in hypertensive patients. Hypertension. 2012;60:319–325. doi: 10.1161/HYPERTENSIONAHA.112.194787 [DOI] [PMC free article] [PubMed] [Google Scholar]
- 8.Pak CY. Correction of thiazide-induced hypomagnesemia by potassium-magnesium citrate from review of prior trials. Clinical nephrology. 2000;54:271–275. [PubMed] [Google Scholar]
- 9.Ruml LA, Pak CY. Effect of potassium magnesium citrate on thiazide-induced hypokalemia and magnesium loss. American journal of kidney diseases : the official journal of the National Kidney Foundation. 1999;34:107–113. doi: 10.1053/AJKD03400107 [DOI] [PubMed] [Google Scholar]
- 10.Dibaba DT, Xun P, Fly AD, Yokota K, He K. Dietary magnesium intake and risk of metabolic syndrome: a meta-analysis. Diabetic medicine : a journal of the British Diabetic Association. 2014;31:1301–1309. doi: 10.1111/dme.12537 [DOI] [PMC free article] [PubMed] [Google Scholar]
- 11.Cahill F, Shahidi M, Shea J, Wadden D, Gulliver W, Randell E, Vasdev S, Sun G. High Dietary Magnesium Intake Is Associated with Low Insulin Resistance in the Newfoundland Population. Plos One. 2013;8. doi: ARTN e58278 10.1371/journal.pone.0058278 [DOI] [PMC free article] [PubMed] [Google Scholar]
- 12.Vongpatanasin W, Peri-Okonny P, Velasco A, Arbique D, Wang Z, Ravikumar P, Adams-Huet B, Moe OW, Pak CYC. Effects of Potassium Magnesium Citrate Supplementation on 24-Hour Ambulatory Blood Pressure and Oxidative Stress Marker in Prehypertensive and Hypertensive Subjects. Am J Cardiol. 2016;118:849–853. doi: 10.1016/j.amjcard.2016.06.041 [DOI] [PMC free article] [PubMed] [Google Scholar]
- 13.Kok DJ, Poindexter J, Pak CY. Calculation of titratable acidity from urinary stone risk factors. Kidney Int. 1993;44:120–126. doi: 10.1038/ki.1993.221 [DOI] [PubMed] [Google Scholar]
- 14.Sugino KY, Mandala A, Janssen RC, Gurung S, Trammell M, Day MW, Brush RS, Papin JF, Dyer DW, Agbaga MP, et al. Western diet-induced shifts in the maternal microbiome are associated with altered microRNA expression in baboon placenta and fetal liver. Front Clin Diabetes Healthc. 2022;3. doi: 10.3389/fcdhc.2022.945768 [DOI] [PMC free article] [PubMed] [Google Scholar]
- 15.Griffin M, Rao VS, Ivey-Miranda J, Fleming J, Mahoney D, Maulion C, Suda N, Siwakoti K, Ahmad T, Jacoby D, et al. Empagliflozin in Heart Failure: Diuretic and Cardiorenal Effects. Circulation. 2020;142:1028–1039. doi: 10.1161/CIRCULATIONAHA.120.045691 [DOI] [PMC free article] [PubMed] [Google Scholar]
- 16.Ren J, Lakoski S, Haller RG, Sherry AD, Malloy CR. Dynamic monitoring of carnitine and acetylcarnitine in the trimethylamine signal after exercise in human skeletal muscle by 7T 1H-MRS. Magn Reson Med. 2013;69:7–17. doi: 10.1002/mrm.24249 [DOI] [PMC free article] [PubMed] [Google Scholar]
- 17.Ren J, Sherry AD, Malloy CR. Modular (31) P wideband inversion transfer for integrative analysis of adenosine triphosphate metabolism, T1 relaxation and molecular dynamics in skeletal muscle at 7T. Magn Reson Med. 2019;81:3440–3452. doi: 10.1002/mrm.27686 [DOI] [PMC free article] [PubMed] [Google Scholar]
- 18.Yokoo T, Serai SD, Pirasteh A, Bashir MR, Hamilton G, Hernando D, Hu HH, Hetterich H, Kuhn JP, Kukuk GM, et al. Linearity, Bias, and Precision of Hepatic Proton Density Fat Fraction Measurements by Using MR Imaging: A Meta-Analysis. Radiology. 2018;286:486–498. doi: 10.1148/radiol.2017170550 [DOI] [PMC free article] [PubMed] [Google Scholar]
- 19.Cooper-DeHoff RM, Wen S, Beitelshees AL, Zineh I, Gums JG, Turner ST, Gong Y, Hall K, Parekh V, Chapman AB, et al. Impact of abdominal obesity on incidence of adverse metabolic effects associated with antihypertensive medications. Hypertension. 2010;55:61–68. doi: 10.1161/HYPERTENSIONAHA.109.139592 [DOI] [PMC free article] [PubMed] [Google Scholar]
- 20.Messerli FH, Bangalore S, Julius S. Risk/benefit assessment of beta-blockers and diuretics precludes their use for first-line therapy in hypertension. Circulation. 2008;117:2706–2715; discussion 2715. doi: 10.1161/CIRCULATIONAHA.107.695007 [DOI] [PubMed] [Google Scholar]
- 21.Black HR, Davis B, Barzilay J, Nwachuku C, Baimbridge C, Marginean H, Wright JT Jr., Basile J, Wong ND, Whelton P, et al. Metabolic and clinical outcomes in nondiabetic individuals with the metabolic syndrome assigned to chlorthalidone, amlodipine, or lisinopril as initial treatment for hypertension: a report from the Antihypertensive and Lipid-Lowering Treatment to Prevent Heart Attack Trial (ALLHAT). Diabetes Care. 2008;31:353–360. doi: 10.2337/dc07-1452 [DOI] [PubMed] [Google Scholar]
- 22.Wuermser LA, Reilly C, Poindexter JR, Sakhaee K, Pak CYC. Potassium-magnesium citrate versus potassium chloride in thiazide-induced hypokalemia. Kidney international. 2000;57:607–612. [DOI] [PubMed] [Google Scholar]
- 23.Ruml LA, Gonzalez G, Taylor R, Wuermser LA, Pak CY. Effect of varying doses of potassium-magnesium citrate on thiazide-induced hypokalemia and magnesium loss. Am J Ther. 1999;6:45–50. doi: 10.1097/00045391-199901000-00007 [DOI] [PubMed] [Google Scholar]
- 24.Kumagai E, Adachi H, Jacobs DR Jr., Hirai Y, Enomoto M, Fukami A, Otsuka M, Kumagae S, Nanjo Y, Yoshikawa K, et al. Plasma aldosterone levels and development of insulin resistance: prospective study in a general population. Hypertension. 2011;58:1043–1048. doi: HYPERTENSIONAHA.111.180521 [pii] 10.1161/HYPERTENSIONAHA.111.180521 [DOI] [PubMed] [Google Scholar]
- 25.Jamerson KA, Julius S, Gudbrandsson T, Andersson O, Brant DO. Reflex sympathetic activation induces acute insulin resistance in the human forearm. Hypertension. 1993;21:618–623. [DOI] [PubMed] [Google Scholar]
- 26.Lembo G, Capaldo B, Rendina V, Iaccarino G, Napoli R, Guida R, Trimarco B, Sacca L. Acute noradrenergic activation induces insulin resistance in human skeletal muscle. Am J Physiol. 1994;266:E242–247. [DOI] [PubMed] [Google Scholar]
- 27.Wada T, Ohshima S, Fujisawa E, Koya D, Tsuneki H, Sasaoka T. Aldosterone inhibits insulin-induced glucose uptake by degradation of insulin receptor substrate (IRS) 1 and IRS2 via a reactive oxygen species-mediated pathway in 3T3-L1 adipocytes. Endocrinology. 2009;150:1662–1669. doi: 10.1210/en.2008-1018 [DOI] [PubMed] [Google Scholar]
- 28.Hitomi H, Kiyomoto H, Nishiyama A, Hara T, Moriwaki K, Kaifu K, Ihara G, Fujita Y, Ugawa T, Kohno M. Aldosterone suppresses insulin signaling via the downregulation of insulin receptor substrate-1 in vascular smooth muscle cells. Hypertension. 2007;50:750–755. [DOI] [PubMed] [Google Scholar]
- 29.Suarez A, Pulido N, Casla A, Casanova B, Arrieta FJ, Rovira A. Impaired tyrosine-kinase activity of muscle insulin receptors from hypomagnesaemic rats. Diabetologia. 1995;38:1262–1270. [DOI] [PubMed] [Google Scholar]
- 30.Nadler JL, Buchanan T, Natarajan R, Antonipillai I, Bergman R, Rude R. Magnesium deficiency produces insulin resistance and increased thromboxane synthesis. Hypertension. 1993;21:1024–1029. [DOI] [PubMed] [Google Scholar]
- 31.Kishimoto Y, Tani M, Uto-Kondo H, Saita E, Iizuka M, Sone H, Yokota K, Kondo K. Effects of magnesium on postprandial serum lipid responses in healthy human subjects. The British journal of nutrition. 2010;103:469–472. doi: 10.1017/S0007114509992716 [DOI] [PubMed] [Google Scholar]
- 32.Conen K, Scanni R, Gombert MT, Hulter HN, Krapf R. Effects of potassium citrate or potassium chloride in patients with combined glucose intolerance: A placebo-controlled pilot study. J Diabetes Complications. 2016;30:1158–1161. doi: 10.1016/j.jdiacomp.2016.03.017 [DOI] [PubMed] [Google Scholar]
- 33.Akter S, Eguchi M, Kurotani K, Kochi T, Pham NM, Ito R, Kuwahara K, Tsuruoka H, Mizoue T, Kabe I, et al. High dietary acid load is associated with increased prevalence of hypertension: The Furukawa Nutrition and Health Study. Nutrition. 2015;31:298–303. doi: 10.1016/j.nut.2014.07.007 [DOI] [PubMed] [Google Scholar]
- 34.Farwell WR, Taylor EN. Serum bicarbonate, anion gap and insulin resistance in the National Health and Nutrition Examination Survey. Diabetic Med. 2008;25:798–804. doi: 10.1111/j.1464-5491.2008.02471.x [DOI] [PubMed] [Google Scholar]
- 35.Hummel SL, Seymour EM, Brook RD, Kolias TJ, Sheth SS, Rosenblum HR, Wells JM, Weder AB. Low-sodium dietary approaches to stop hypertension diet reduces blood pressure, arterial stiffness, and oxidative stress in hypertensive heart failure with preserved ejection fraction. Hypertension. 2012;60:1200–1206. doi: 10.1161/HYPERTENSIONAHA.112.202705 [DOI] [PMC free article] [PubMed] [Google Scholar]
- 36.Rodriguez-Moran M, Guerrero-Romero F. Oral magnesium supplementation improves insulin sensitivity and metabolic control in type 2 diabetic subjects: a randomized double-blind controlled trial. Diabetes Care. 2003;26:1147–1152. doi: 10.2337/diacare.26.4.1147 [DOI] [PubMed] [Google Scholar]
- 37.Guerrero-Romero F, Tamez-Perez HE, Gonzalez-Gonzalez G, Salinas-Martinez AM, Montes-Villarreal J, Trevino-Ortiz JH, Rodriguez-Moran M. Oral magnesium supplementation improves insulin sensitivity in non-diabetic subjects with insulin resistance. A double-blind placebo-controlled randomized trial. Diabetes Metab. 2004;30:253–258. doi: 10.1016/s1262-3636(07)70116-7 [DOI] [PubMed] [Google Scholar]
- 38.Rodriguez-Moran M, Guerrero-Romero F. Oral magnesium supplementation improves the metabolic profile of metabolically obese, normal-weight individuals: a randomized double-blind placebo-controlled trial. Arch Med Res. 2014;45:388–393. doi: 10.1016/j.arcmed.2014.05.003 [DOI] [PubMed] [Google Scholar]
- 39.Navarrete-Cortes A, Ble-Castillo JL, Guerrero-Romero F, Cordova-Uscanga R, Juarez-Rojop IE, Aguilar-Mariscal H, Tovilla-Zarate CA, Lopez-Guevara Mdel R. No effect of magnesium supplementation on metabolic control and insulin sensitivity in type 2 diabetic patients with normomagnesemia. Magnes Res. 2014;27:48–56. doi: 10.1684/mrh.2014.0361 [DOI] [PubMed] [Google Scholar]
- 40.Lee S, Park HK, Son SP, Lee CW, Kim IJ, Kim HJ. Effects of oral magnesium supplementation on insulin sensitivity and blood pressure in normo-magnesemic nondiabetic overweight Korean adults. Nutr Metab Cardiovasc Dis. 2009;19:781–788. doi: 10.1016/j.numecd.2009.01.002 [DOI] [PubMed] [Google Scholar]
- 41.Cosaro E, Bonafini S, Montagnana M, Danese E, Trettene MS, Minuz P, Delva P, Fava C. Effects of magnesium supplements on blood pressure, endothelial function and metabolic parameters in healthy young men with a family history of metabolic syndrome. Nutr Metab Cardiovasc Dis. 2014;24:1213–1220. doi: 10.1016/j.numecd.2014.05.010 [DOI] [PubMed] [Google Scholar]
- 42.Santos D, Dhamoon MS. Trends in Antihypertensive Medication Use Among Individuals With a History of Stroke and Hypertension, 2005 to 2016. JAMA Neurol. 2020;77:1382–1389. doi: 10.1001/jamaneurol.2020.2499 [DOI] [PMC free article] [PubMed] [Google Scholar]
- 43.Tonnies T, Brinks R, Isom S, Dabelea D, Divers J, Mayer-Davis EJ, Lawrence JM, Pihoker C, Dolan L, Liese AD, et al. Projections of Type 1 and Type 2 Diabetes Burden in the U.S. Population Aged <20 Years Through 2060: The SEARCH for Diabetes in Youth Study. Diabetes Care. 2023;46:313–320. doi: 10.2337/dc22-0945 [DOI] [PMC free article] [PubMed] [Google Scholar]
- 44.Aggarwal R, Yeh RW, Joynt Maddox KE, Wadhera RK. Cardiovascular Risk Factor Prevalence, Treatment, and Control in US Adults Aged 20 to 44 Years, 2009 to March 2020. JAMA. 2023;329:899–909. doi: 10.1001/jama.2023.2307 [DOI] [PMC free article] [PubMed] [Google Scholar]
Associated Data
This section collects any data citations, data availability statements, or supplementary materials included in this article.