

Abstract
Purpose:
To develop a 3D phase modulated ultrashort echo time adiabatic T1ρ (PM-UTE-AdiabT1ρ) sequence for whole knee joint mapping on a clinical 3T scanner.
Methods:
This new sequence includes six major features: 1) a magnetization reset module, 2) a train of adiabatic full passage pulses for spin locking, 3) a phase modulation scheme (i.e., RF cycling pair), 4) a fat saturation module, 5) a variable flip angle scheme, and 6) a 3D UTE Cones sequence for data acquisition. A simple exponential fitting was used for T1ρ quantification. Phantom studies were performed to investigate PM-UTE-AdiabT1ρ’s sensitivity to compositional changes and reproducibility as well as its correlation with continuous-wave T1ρ (CW-T1ρ) measurement. The PM-UTE-AdiabT1ρ technique was then applied to five ex vivo and five in vivo normal knees to measure T1ρ values of femoral cartilage, meniscus, posterior cruciate ligament (PCL), anterior cruciate ligament (ACL), patellar tendon, and muscle.
Results:
The phantom study demonstrated PM-UTE-AdiabT1ρ’s high sensitivity to compositional changes, its high reproducibility, and its strong linear correlation with CW-T1ρ measurement. The ex vivo and in vivo knee studies demonstrated average T1ρ values of 105.6±8.4 and 77.9±3.9ms for the femoral cartilage, 39.2±5.1 and 30.1±2.2ms for the meniscus, 51.6±5.3 and 29.2±2.4ms for the PCL, 79.0±9.3 and 52.0±3.1ms for the ACL, 19.8±4.5 and 17.0±1.8ms for the patellar tendon, and 91.1±8.8 and 57.6±2.8ms for the muscle, respectively.
Conclusion:
The 3D PM-UTE-AdiabT1ρ sequence allows volumetric T1ρ assessment for both short and long T2 tissues in the knee joint on a clinical 3T scanner.
Keywords: T1ρ, AdiabT1ρ, ultrashort echo time, whole knee imaging
Introduction
Spin lattice relaxation in the rotating frame (T1ρ) has been proposed as an MR imaging biomarker of tissue degeneration in the musculoskeletal (MSK) system 1. Many studies have shown that T1ρ is sensitive to compositional changes in cartilage, e.g., loss of proteoglycans (PGs), which can be potentially useful for early diagnosis of osteoarthritis (OA) 2–4.
However, the commonly used continuous wave type T1ρ (CW-T1ρ) imaging on clinical MRI is subject to the magic angle effect which may affect the quantification of highly anisotropic tissues such as the articular cartilage, menisci, ligaments, and tendons 5–10. The CW-T1ρ values may increase more than 100% when the tissue fibers reorientate from 0º to 55º relative to the B0 field 6–8. These magic angle-induced CW-T1ρ changes may be much greater than those induced by tissue degeneration, making the clinical assessment of tissue pathological changes complicated.
Recently, a new strategy using a train of adiabatic full passage (AFP) pulses for spin locking was proposed to produce T1ρ contrast (i.e., AdiabT1ρ) 10–12. AdiabT1ρ is able to detect degenerative and biomechanical changes in cartilage and tendons 13–17. These new AdiabT1ρ sequences have two major advantages over the conventional CW-T1ρ sequences. The first advantage is that the measured T1ρ from the AdiabT1ρ sequence is much less sensitive to the magic angle effect than that measured from the CW-T1ρ sequence at 500 Hz on a clinical MRI scanner, as shown in both cartilage and tendon studies 8,9. The second advantage is that the AdiabT1ρ imaging is insensitive to B1 inhomogeneity because of the use of adiabatic pulses for spin locking 11. In contrast, the conventional CW-T1ρ imaging suffers banding artifacts related to B1 inhomogeneity 18–20.
Most recently, we have combined a 3D ultrashort echo time sequence with the AdiabT1ρ preparation (UTE-AdiabT1ρ) for volumetric T1ρ imaging 17,21. This UTE-AdiabT1ρ sequence allows a comprehensive assessment of all the major tissue components in the knee joint, including both short (e.g., the deep radial and calcified cartilage, menisci, ligaments, and tendons) and long T2 (e.g., the middle and superficial cartilage, and muscles) tissues and tissue components 21,22. However, the tissue T1 value should be estimated for accurate T1ρ quantification in this sequence, as can be seen in Eq. [1] in Ref. 21. This T1 measurement increases the total scan time, and errors in T1 quantification lead to inaccurate T1ρ quantification.
In this study, inspired by the widely used 3D magnetization‐prepared angle‐modulated partitioned k‐space spoiled gradient echo snapshots (MAPSS) sequence 23, we developed a new UTE-AdiabT1ρ framework, i.e., a phase-modulated UTE adiabatic T1ρ (PM-UTE-AdiabT1ρ) sequence, for quantitative T1ρ imaging of all major tissue components in the knee joint. With this new PM-UTE-AdiabT1ρ sequence, T1ρ is estimated using a simple exponential fitting model, and T1 information is no longer needed for accurate T1ρ quantification. To investigate the accuracy of this new PM-UTE-AdiabT1rho sequence, phantoms with different agarose concentrations were made and scanned on a 3T clinical MRI scanner. Phantoms with different agarose concentrations and MnCl2 concentrations (i.e., with different T1 relaxation times) were also scanned to investigate potential T1 contamination caused by the usage of AFP pulses with relatively long durations for spin locking, a concern raised by Pang Y in a recent letter article 24. Finally, the new sequence was applied to five ex vivo human knee joint specimens and five in vivo knee joints of healthy volunteers for T1ρ measurements for the femoral cartilage, meniscus, posterior cruciate ligament (PCL), anterior cruciate ligament (ACL), patellar tendon, and muscle.
Methods
Sequence and Signal Model
Figure 1 shows the diagram of the proposed PM-UTE-AdiabT1ρ sequence. This new sequence includes six major features: 1) a magnetization reset module to produce a consistent magnetization recovery 23, 2) a train of AFP pulses to produce T1ρ contrast 21, 3) a phase modulation scheme (i.e., RF cycling scheme using a 90° pulse pair) to mitigate the influence of T1 dependence during the signal evolution within the data acquisition period 23, 4) a fat saturation module between the T1ρ preparation and acquisition blocks for fat suppression, 5) a variable flip angle (VFA) scheme to reduce signal variation along the multiple data acquisition spokes 23, and 6) a 3D UTE sequence for data acquisition with an efficient Cones encoding trajectory and a minimal nominal echo time (TE) of 32 μs (pulse duration is not included in the nominal TE calculation) 25.
Figure 1.
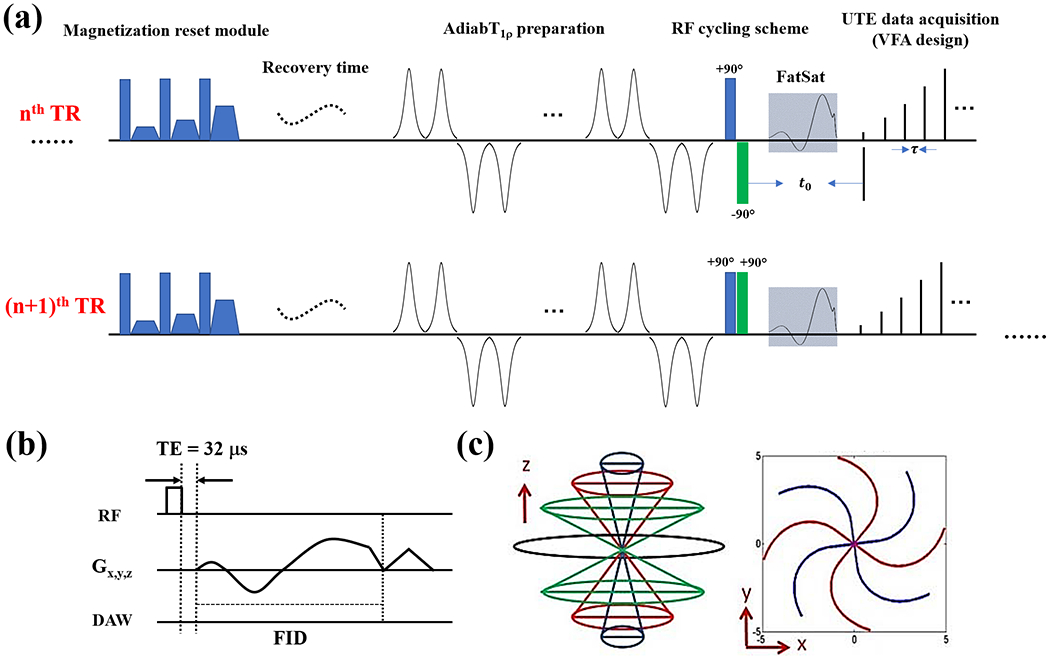
Diagram of the PM-UTE-AdiabT1ρ sequence. This new sequence includes six major features: 1) a magnetization reset module (a), 2) an AdiabT1ρ preparation using a train of AFP pulses for spin locking (a), 3) a phase modulation scheme (i.e., RF cycling scheme using a 90° pulse pair) (a), 4) a fat saturation module (a), 5) a VFA excitation scheme (a), and 6) a 3D UTE sequence for data acquisition (b). The adjacent two acquisitions (e.g., for nth and (n+1)th TRs) have identical parameters except for the RF cycling module (a). During the second acquisition, the phase of the second 90° pulse in the RF cycling pair alternates 180°. A rectangular pulse (i.e., 270 μs) is used for signal excitation and the minimal nominal TE (defined as the gap between the excitation pulse and data acquisition window) of this sequence is 32 μs (b). An efficient 3D Cones trajectory is utilized for k-space encoding (c).
The RF cycling strategy (i.e., the third feature) is applied to adjacent acquisitions with the same gradient encodings 23. During the second acquisition, the phase of the second 90° pulse in the RF cycling pair alternates 180°. The two acquisitions are interleaved. The final image is reconstructed from the subtracted data between these adjacent acquisitions with opposite cycling phases. The magnetization reset, phase modulation, and VFA design features have been successfully applied to the 3D MAPSS sequence 23.
The transverse signal after the ith (i = 1, 2, 3, …, Nsp, Nsp is the total number of excitations or spokes in each TR) excitation in the nth TR is expressed as follows:
| [1] |
where
is the flip angle (FA) of ith excitation. represents the longitudinal signal at the end of the RF cycling pair, and is the time gap between the RF cycling pair and the signal acquisition segment. is the time interval between adjacent excitations or spokes. and are terms related to tissue T1.
In the next TR (i.e., (n+1)th TR), the phase of the second 90° pulse in the RF cycling pair alternates by 180°. Thus, the longitudinal signal at the end of the RF cycling pair becomes . The transverse signal after the ith excitation in the (n+1)th TR is expressed as follows:
| [2] |
After subtraction between signals acquired from the above two adjacent TRs (i.e., Eq. [1] – Eq. [2]), the signal equation becomes:
| [3] |
The T1ρ independent term is canceled. Since is proportional to the term of and is independent of tissue T1ρ, the subtracted signal is proportional to . TSL is the spin locking time, determined by the multiplication of the total number of AFP pulses (NAFP) and the AFP pulse duration.
As seen in Eq. [3], the signal intensities in different spokes are modulated by , which can produce signal variations and lead to image artifacts. To mitigate this signal variation, the VFA scheme is incorporated into the sequence, and the FA of th excitation (i.e., ) is determined according to the following equation:
| [4] |
which requires
| [5] |
Once the last FA (i.e., ) is determined, the FAs of the rest excitations in a TR can be easily calculated by Eq. [5]. Then the signals acquired among different spokes have identical intensities for a tissue.
To estimate T1ρ, multiple data are acquired by the PM-UTE-AdiabT1ρ sequence with different TSLs (i.e., different numbers of AFP pulses) and fitted with a single exponential function 23:
| [6] |
where A is a constant term that is independent of T1ρ.
Phantom Study
The PM-UTE-AdiabT1ρ sequence was implemented on a 3T clinical MRI scanner (GE Healthcare Technologies, Milwaukee, WI) and scanned with an 8-channel transmit/receive knee coil. An AFP pulse (hyperbolic secant type I pulse) with a duration of 6.048 ms, a bandwidth of 1.643 kHz, and a maximum B1 amplitude of 17μT was used to generate T1ρ contrast in the PM-UTE-AdiabT1ρ sequence 26,27. A rectangular pulse with a duration of 270 μs was used for UTE signal excitation.
To validate the accuracy of the developed PM-UTE-AdiabT1ρ sequence in T1ρ measurement, four phantoms were prepared with different agarose concentrations (1%, 2%, 3%, and 4%, weight/volume (w/v)) and scanned together with the following parameters: field of view (FOV) = 16×16 mm2, matrix = 192×192, slice number = 30, slice thickness = 4 mm, spoke interval ()/TE = 4.2/0.032 ms, magnetization recovery time (Trec) = 330 ms, TSL = 0, 12.1, 24.2, 36.3, 48.4, 72.6, and 96.9 ms, number of TRs = 182, duration of each TR = ~650 ms, total number of spokes = 11758, Nsp = 65, , bandwidth = 125 kHz, acquisition window stretch factor = 1, and total scan time = ~14 min. Reproducibility of the PM-UTE-AdiabT1ρ sequence was investigated using these agarose phantoms by repeating the protocol two times and the MRI system was reset before each PM-UTE-AdiabT1ρ scan.
The phase modulation strategy employed in the proposed PM-UTE-AdiabT1ρ sequence was expected to minimize T1 dependence during signal evolution in the data acquisition period. To investigate this issue, a PM-UTE-CW-T1ρ sequence was also implemented with an identical sequence structure as the proposed PM-UTE-AdiabT1ρ except the utilization of the CW-T1ρ preparation. The CW-T1ρ scheme in the PM-UTE-CW-T1ρ sequence was similar to that used in the MAPSS CW-T1ρ sequence 23. Four series of phantoms with different agarose concentrations (1%, 2%, 3% and 4% w/v) were prepared to compare the T1ρ quantification between PM-UTE-CW-T1ρ and MAPSS CW-T1ρ. In each series, four different phantoms were prepared with different MnCl2 concentrations to change their T1 relaxation times. Supplemental Information Table S1 shows more detailed information of these phantoms in terms of the agarose and MnCl2 concentrations as well as their T1 values as measured by a VFA technique with B1 correction 28. These phantoms were then scanned with 3D PM-UTE-CW-T1ρ and MAPSS CW-T1ρ sequences for comparison with following parameters: 1) PM-UTE-CW-T1ρ: FOV = 14×14 mm2, matrix = 192×192, slice number = 36, slice thickness = 4 mm, /TE = 4.2/0.032 ms, Trec = 800 ms, spin lock frequency = 500 Hz, TSL = 0, 10, 30, and 60 ms, Nsp = 64, , bandwidth = 125 kHz, and total scan time = ~17 min; 2) MAPSS CW-T1ρ: FOV = 14×14 mm2, matrix = 192×192, slice number = 36, slice thickness = 4 mm, /TE = 4.9/2.2 ms, Trec = 800 ms, spin lock frequency = 500 Hz, TSL = 0, 10, 30, and 60 ms, Nsp = 64, , bandwidth = 125 kHz, and total scan time = ~11 min.
Furthermore, to investigate the relationship of the T1ρ measurements between AdiabT1ρ and CW-T1ρ, three series of phantoms with different agarose concentrations (1%, 2%, and 3% w/v) were prepared and scanned with both 3D PM-UTE-AdiabT1ρ and MAPSS CW-T1ρ sequences. In each series, four different phantoms were prepared with different MnCl2 concentrations to change their T1 relaxation times. Detailed information of these phantoms can be seen in Table 1. The sequence parameters of the PM-UTE-AdiabT1ρ were identical to those used in the first phantom study above except for the following parameters: FOV = 14×14 mm2, slice number = 36 and slice thickness = 4 mm. The MAPSS CW-T1ρ sequence was scanned with identical sequence parameters used in the second phantom study.
Table 1.
Agarose and MnCl2 concentrations as well as quantitative T1 values for twelve phantoms (see Figure 3a).
| Phantom ID | #1 | #2 | #3 | #4 | #5 | #6 | #7 | #8 | #9 | #10 | #11 | #12 |
|---|---|---|---|---|---|---|---|---|---|---|---|---|
| Agarose concentration (w/v) | 1% | 1% | 1% | 1% | 2% | 2% | 2% | 2% | 3% | 3% | 3% | 3% |
| MnCl2 concentration (mM) | 0.019 | 0.039 | 0.071 | 0.136 | 0.017 | 0.034 | 0.062 | 0.118 | 0.015 | 0.030 | 0.056 | 0.106 |
| T1 (ms) | 1503±7.7 | 1334±7.3 | 882±3.1 | 596±1.3 | 1507±6.2 | 1196±3.9 | 890±1.9 | 595±0.8 | 1494±6.0 | 1205±3.9 | 913±2.6 | 606±1.3 |
Ex Vivo Knee Study
Five normal cadaveric knee joints from five donors (aged 38–87 years, mean age 55.6 years; 2 male, 3 females) were scanned by the PM-UTE-AdiabT1ρ sequence at room temperature using the following parameters: FOV = 15×15 mm2, matrix = 256×256, slice number = 40, slice thickness = 2 mm, /TE = 6/0.032 ms, Trec = 330 ms, TSL = 0, 12.1, 24.2, 36.3, 48.4, 72.6, and 96.9 ms, number of TRs = 316, duration of each TR = ~700 ms, total number of spokes = 20530, Nsp = 65, , bandwidth = 125 kHz, acquisition window stretch factor = 1, and total scan time = ~25 min.
In Vivo Knee Study
Five normal knee joints from five volunteers (aged 34-40 years, mean age 37.5 years; 4 males, 1 female) were also scanned. Informed consent was obtained from all subjects in accordance with the guidelines of the institutional review board. The PM-UTE-AdiabT1ρ sequence was used to scan these knee joints with the following parameters: FOV = 15×15 mm2, matrix = 256×256, slice number = 32, slice thickness = 3 mm, /TE = 5.5/0.032 ms, Trec = 330 ms, TSL = 0, 12.1, 24.2, 36.3, 48.4, 72.6 and 96.9 ms, number of TRs = 150, duration of each TR = ~900 ms, total number of spokes = 11186, Nsp = 75, , bandwidth = 125 kHz, acquisition window stretch factor = 1.5, and total scan time = ~16 min.
Data Analysis
Single exponential fitting was performed on the magnitude data, and the image background noise was estimated and incorporated as a constant term in the fitting process. The mean value of the background noise was calculated from a carefully selected 8×8 object-free region (avoiding regions with artifacts) on the PM-UTE-AdiabT1ρ image with the longest TSL. The data processing code was written in Matlab (The MathWorks Inc., Natick, MA, USA), and the Levenberg-Marquardt algorithm was used to solve the non-linear least-squares optimization problem 29,30. The Intraclass Correlation Coefficient (ICC) analysis was used to evaluate the reproducibility of T1ρ measurement for the phantom study. Pearson correlation was used to investigate the correlations between PM-UTE-AdiabT1ρ, MAPSS CW-T1ρ and T1, and between PM-UTE-CW-T1ρ and MAPSS CW-T1ρ as well as between PM-UTE-AdiabT1ρ and MAPSS CW-T1ρ. A P-value less than 0.05 is considered statistically significant. Regions of interest (ROIs) were manually drawn for various tissues, including the articular cartilage, meniscus, PCL, ACL, patellar tendon, and muscle in all knee joints. Mean T1ρ and standard deviation (STD) values for all the major tissue components in both ex vivo and in vivo knee joints were calculated.
Results
Figure 2 shows the results from the first phantom study. As can be seen in the T1ρ map in Figure 2b, the T1ρ values decrease with the higher agarose concentrations in the phantoms. Excellent linear correlation is achieved between R1ρ (=1/T1ρ) values and agarose concentrations with an R2 of 0.9999. The T1ρ map of the second scan (Figure 2d) shows similar T1ρ distributions to that of the first scan (Figure 2b). Two repeated scans show an excellent ICC (R2 = 0.9996), demonstrating great reproducibility of the PM-UTE-AdiabT1ρ technique.
Figure 2.

Phantom imaging results for the studies of tissue compositional sensitivity and scan reproducibility using the PM-UTE-AdiabT1ρ sequence. Phantoms with four different agarose concentrations (i.e., 1, 2, 3, and 4%, w/v) (a) are imaged twice and the corresponding T1ρ maps are seen in (b) and (d). The R1ρ values show excellent linear correlation with agarose concentration with an R2 of 0.9999 (c). Excellent reproducibility of the R1ρ measurement is achieved between the 1st and 2nd scans with an R2 of 0.9996 (e).
Supplemental Information Figure S1 shows the correlation curve between PM-UTE-CW-T1ρ MAPSS CW-T1ρ measurements for the twelve phantoms. T1 values of these phantoms ranged from ~600 to ~1700 ms (see Supplemental Information Table S1), which cover the spectrum of T1 values for all major tissues in the knee joint 28. A very strong correlation was found between PM-UTE-AdiabT1ρ and MAPSS CW-T1ρ measures (R2 = 0.9971, P < 0.0001). The obtained linear regression equation demonstrated a similar range of T1ρ measurements (i.e., [20, 100] ms) between these two techniques.
Figure 3 shows the T1, PM-UTE-AdiabT1ρ, and MAPSS CW-T1ρ mapping results from the second phantom study. This T1 map displays a wide range of T1 relaxation times from ~600 to ~1500 ms (T1 values are shown in Table 1). The T1ρ values in the PM-UTE-AdiabT1ρ maps are generally higher than the corresponding MAPSS CW-T1ρ measurements. Notably, the T1ρ values of these phantoms demonstrate a similar visual trend for the two kinds of T1ρ measurement techniques. Figure 4 shows the correlation curves between MAPSS CW-T1ρ, PM-UTE-AdiabT1ρ and T1, and between PM-UTE-AdiabT1ρ and MAPSS CW-T1ρ for the twelve phantoms. A similar moderate correlation was found between MAPSS CW-T1ρ measures and T1 values (R2 = 0.3846, P = 0.031) and between PM-UTE-AdiabT1ρ measures and T1 values (R2 = 0.3633, P = 0.038), while a very strong correlation was found between PM-UTE-AdiabT1ρ and MAPSS CW-T1ρ measures (R2 = 0.9985, P < 0.0001).
Figure 3.

Phantom imaging results using T1, PM-UTE-AdiabT1ρ, and MAPSS CW-T1ρ mapping techniques. The agarose concentrations are 1%, 2%, and 3% w/v for the twelve phantoms listed in the first (1-4), second (5-8), and third (9-12) rows, respectively (a). The quantitative T1, PM-UTE-AdiabT1ρ, and MAPSS CW-T1ρ maps are shown in panels (b), (c), and (d), respectively.
Figure 4.

Correlation curves for the measurements between MAPSS CW-T1ρ, PM-UTE-AdiabT1ρ , and T1, and between PM-UTE-AdiabT1ρ and MAPSS CW-T1ρ for the twelve phantoms. A similar moderate correlation is found between MAPSS CW-T1ρ measures and T1 values (R2 = 0.3846, P = 0.031) (a) and between PM-UTE-AdiabT1ρ measures and T1 values (R2 = 0.3633, P = 0.038) (b), while a very strong correlation is found between PM-UTE-AdiabT1ρ and MAPSS CW-T1ρ measures (R2 = 0.9985, P < 0.0001) (c).
Figure 5 shows representative PM-UTE-AdiabT1ρ images acquired from a knee joint specimen (45-year-old male donor). Both long T2 (e.g., the cartilage and muscle) and short T2 tissue (e.g., the meniscus, quadriceps tendon, patellar tendon, ACL and PCL) signals are detected by the PM-UTE-AdiabT1ρ sequence. Fat signals are efficiently suppressed in all images at different TSLs. As can be seen in Figure 6, excellent single exponential fitting is achieved for the major knee tissue components including the femoral cartilage, meniscus, PCL, ACL, patellar tendon, and muscle, where the T1ρ values of these tissues are 90.3±10.1, 37.7±1.6, 46.8±1.1, 76.7±9.5, 13.4±0.6, and 74.8±5.8 ms, respectively.
Figure 5.

Representative PM-UTE-AdiabT1ρ images of two different slices (a and b) from a normal knee specimen (45-year-old male donor) with TSLs ranging from 0 to 96.87 ms. Both short and long T2 tissue signals are detected by this new sequence. Short T2 tissue signals decrease faster with increased TSLs. Fat is efficiently suppressed in all images.
Figure 6.

The PM-UTE-AdiabT1ρ imaging results of the normal knee specimen from the 45-year-old male donor. The fitting curves and corresponding T1ρ values of the femoral cartilage (a), meniscus (b), PCL (c), ACL (g), patellar tendon (h), and muscle (i) (tissue ROIs shown inside of the red closed curves) are 90.3±10.1 ms (d), 37.7±1.6 ms (e), 46.8±1.1 ms (f), 76.7±9.5 ms (j), 13.4±0.6 (k), and 74.8±5.8 ms (l), respectively.
Figure 7 shows representative PM-UTE-AdiabT1ρ images acquired from an in vivo knee joint (36-year-old female volunteer). Similar to the ex vivo knee study, both short and long T2 tissue signals in the knee joint are well detected by this new sequence, while fat signals are efficiently suppressed. As can be seen in Figure 8, excellent single exponential fitting is achieved for all the major knee tissue components. The T1ρvalues of the femoral cartilage, meniscus, PCL, ACL, patellar tendon, and muscle are 73.2±2.6, 34.6±1.2, 30.0±0.8, 47.6±2.0, 15.6±0.3, and 61.2±3.2 ms, respectively.
Figure 7.

Representative PM-UTE-AdiabT1ρ images of two different slices (a and b) from a normal knee joint (36-year-old female volunteer). Both short and long T2 tissue signals are detected by this new sequence. Signals for short T2 tissues (e.g., the meniscus and patellar tendon) decrease faster with longer TSLs. Fat is efficiently suppressed in all images.
Figure 8.

The PM-UTE-AdiabT1ρ imaging results of the normal knee joint from the 36-year-old female volunteer. The fitting curves and corresponding T1ρ values of the femoral cartilage (a), meniscus (b), PCL (c), ACL (g), patellar tendon (h), and muscle (i) (tissue ROIs shown inside of the red closed curves) are 73.2±2.6 ms (d), 34.6±1.2 ms (e), 30.0±0.8 ms (f), 47.6±2.0 ms (j), 15.6±0.3 ms (k), and 61.2±3.2 ms (l), respectively.
Table 2 summarizes the T1ρ measurements for both ex vivo and in vivo knee joints. The average T1ρ values of femoral cartilage, meniscus, PCL, ACL, patellar tendon, and muscle for the five normal knee joint specimens are 105.6±8.4, 39.2±5.1, 51.6±5.3, 79.0±9.3, 19.8±4.5, and 91.1±8.8 ms, respectively. The average T1ρ values of the femoral cartilage, meniscus, PCL, ACL, patellar tendon, and muscle for the five normal in vivo knee joints are 77.9±3.9, 30.1±2.2, 29.2±2.4, 52.0±3.1, 17.0±1.8, and 57.6±2.8 ms, respectively. The ex vivo T1ρ measures are generally higher than the in vivo measurements because of the lower tissue temperature (room temperature vs. body temperature) and potential degeneration of knee joint specimens.
Table 2.
T1ρ and its fitting standard errors of cartilage, meniscus, PCL, ACL, patellar tendon and muscle in five ex vivo and five in vivo normal knee joints as well as the summarized mean and STD values for each tissue.
| T1ρ (ms) | Cartilage | Meniscus | PCL | ACL | Patellar tendon | Muscle | |
|---|---|---|---|---|---|---|---|
| Ex vivo | #1 | 90.3±10.1 | 37.7±1.6 | 46.8±1.1 | 76.7±9.5 | 13.4±0.6 | 74.8±5.8 |
|
| |||||||
| #2 | 112.7±11.3 | 46.1±0.3 | 59.4±0.8 | 87.4±5.3 | 21.5±2.3 | 95.3±1.1 | |
|
| |||||||
| #3 | 105.4±8.4 | 31.8±0.8 | 44.5±0.4 | 92.0±4.6 | 17.2±0.9 | 97.3±1.2 | |
|
| |||||||
| #4 | 113.9±8.8 | 36.7±1.5 | 52.9±1.6 | 71.8±1.8 | 26.9±0.5 | 89.1±4.2 | |
|
| |||||||
| #5 | 105.5±11.6 | 43.5±2.0 | 54.2±2.4 | 67.2±7.9 | 19.9±2.5 | 99.2±12.7 | |
|
| |||||||
| mean±STD | 105.6±8.4 | 39.2±5.1 | 51.6±5.3 | 79.0±9.3 | 19.8±4.5 | 91.1±8.8 | |
|
| |||||||
| In vivo | #1 | 73.2±2.6 | 34.6±1.2 | 30.0±0.8 | 47.6±2.0 | 15.6±0.3 | 61.2±3.2 |
| #2 | 76.2±1.9 | 30.7±0.9 | 33.1±1.0 | 56.5±3.9 | 16.4±0.5 | 58.7±1.7 | |
| #3 | 76.3±2.6 | 29.5±0.4 | 28.8±0.4 | 54.1±2.4 | 17.1±0.5 | 52.8±0.7 | |
| #4 | 79.0±3.6 | 28.3±0.7 | 25.6±1.7 | 50.0±3.8 | 15.7±0.3 | 57.2±2.9 | |
| #5 | 84.8±2.9 | 31.8±1.0 | 28.3±0.3 | 52.0±1.4 | 20.4±0.8 | 58.3±1.8 | |
| mean±STD | 77.9±3.9 | 30.1±2.2 | 29.2±2.4 | 52.0±3.1 | 17.0±1.8 | 57.6±2.8 | |
Discussion
We have demonstrated that the PM-UTE-AdiabT1ρ sequence allows volumetric T1ρ mapping of both short and long T2 tissues in the whole knee joint on a clinical 3T scanner. Phantom studies suggest that T1ρ measures provided by the PM-UTE-AdiabT1ρ technique are sensitive to compositional changes and these measurements are reproducible. The ex vivo and in vivo knee studies demonstrate the feasibility of quantifying T1ρ for all the major tissue components in the knee joint including the articular cartilage, meniscus, PCL, ACL, patellar tendon, and muscle.
The 3D MAPSS CW-T1ρ sequence has been widely used to evaluate tissue degeneration and monitor compositional changes longitudinally in the musculoskeletal system 31–36. Some of the sequence features in 3D MAPSS, such as magnetization reset, phase modulation, and VFA scheme 23, have been successfully incorporated in the PM-UTE-AdiabT1ρ sequence. The successful implementation of these features was validated by the second phantom study, which demonstrated a strong linear correlation (R2 = 0.9971) and a similar value range (i.e., [20, 100] ms) between PM-UTE-CW-T1ρ and MAPSS CW-T1ρ measurements. With these features implemented in PM-UTE-AdiabT1ρ, T1 measurement is no longer needed, and a simple exponential fitting is sufficient for accurate UTE-AdiabT1ρ quantification. In addition, the first phantom study further demonstrates the excellent reproducibility of this framework used in the PM-UTE-AdiabT1ρ sequence.
We have demonstrated in this study that the PM-UTE-AdiabT1ρ sequence is able to quantify all the major tissue components in the knee joint, including both short (e.g., the deep cartilage, menisci, ligaments, and tendons) and long T2 (e.g., the superficial cartilage, and muscle) tissues. This is because the PM-UTE-AdiabT1ρ sequence uses a very short TE (e.g., 0.032 ms) for data acquisition 25. Thus the collagen-rich short T2 tissues can also be imaged and quantified. This allows more comprehensive assessment of musculoskeletal diseases, such as knee OA. Knee OA has been recognized as a whole organ disease 37. Any tissue deterioration or misalignment in the knee joint can accelerate the progression of OA 38. Studies also show that meniscal positioning or collateral ligament damage can lead to cartilage loss 39,40. As such, the developed PM-UTE-AdiabT1ρ sequence provides great potential in studying knee OA comprehensively.
A 3T cartilage study has shown that the 3D MAPSS-T1ρ sequence with a CW type spin-lock scheme is sensitive to the magic angle effect 6. The CW-T1ρ values are more than doubled when the tissue fibers reorientate from 0° to 55° relative to the B0 field 6–8. Most recently, both ex vivo enzymatic degradation studies and in vivo OA studies have shown that AdiabT1ρ is sensitive to biochemical changes in articular cartilage 13,15,17. More importantly, AdiabT1ρ is much less sensitive to the magic angle effect than CW-T1ρ as demonstrated in previous cartilage and tendon studies on a clinical 3T MRI 8,9.
In addition to the reduced sensitivity to the magic angle effect, the AdiabT1ρ preparation typically has a lower total RF power deposition than the CW-T1ρ preparation. This is because the AFP pulse employs both amplitude and frequency modulation rather than amplitude only, which is used in CW type preparation for spin locking 11. The specific absorption rate (SAR) is directly related to the amplitude of the spin locking pulse 41. Moreover, the PM-UTE-AdiabT1ρ imaging is insensitive to B1 inhomogeneity because of the adiabatic pulse character 11. In contrast, the conventional CW-T1ρ imaging suffers from B1 inhomogeneity related banding artifacts 18–20. These advantages of AdiabT1ρ preparation will be even more favorable in high field MRI (e.g., 7T) where the SAR issue and B1 inhomogeneity become more significant.
The contrast mechanism of AdiabT1ρ is still not very well-understood. The spin-lock direction of AdiabT1ρ varies from the z-axis to the x-y plane and then back to the z-axis. In comparison, the spins are only locked in the x-y plane during CW-T1ρ preparation. Dipole-dipole interaction may affect apparent T1ρ more in the x-y plane than in the z-axis, as demonstrated in the orientation sensitivity of T2 and T1 relaxation times, respectively 42,43. This could lead to a shorter T1ρ measured by CW-T1ρ in comparison to AdiabT1ρ when the tissue fiber orientation is parallel to the B0 field, which means that CW-T1ρ is more sensitive to the magic angle effect 44. If the spin-lock frequency of CW-T1ρ is sufficiently high (e.g., ≥1 kHz), the effect of dipole-dipole interaction for T1ρ measurement may be negligible compared with the slow-motion interactions between motion-restricted water molecules and their local macromolecular environment 10. Due to the relatively higher spin-lock frequency of the AdiabT1ρ preparation (from 724 to 860 Hz in this study, calculated by the square root of the real and imaginary parts of the AFP pulses), the measured T1ρ values from the AdiabT1ρ type sequences are generally higher than those measured from the typical CW-T1ρ type sequences (≤500 Hz) on a clinical scanner 10,13,23. Our measured in vivo cartilage T1ρ value (77.9±3.9 ms) is similar to the reported values (from 69.0 to 79.9 ms) from a recent AdiabT1ρ study 13.
A recent letter article from Pang Y explained how a T1ρ relaxation time measured using AdiabT1ρ preparation was relatively longer than when using a CW-T1ρ preparation 24. The article claimed that the AdiabT1ρ quantification was subject to T1 contamination during each relatively long AFP pulse (even for a 2 ms pulse), but there was no validated theory or dedicated experimental data provided in the letter article to support the T1 contamination assumption. Though our phantom study showed a moderate correlation between PM-UTE-AdiabT1ρ and T1 measurements (R2 = 0.3633, P = 0.038), this does not necessarily mean there is T1 contamination in the AdiabT1ρ measurement given that a similar moderate correlation was also found between MAPSS CW-T1ρ and T1 measurements (R2 = 0.3846, P = 0.031), and the MAPSS CW-T1ρ measurement is T1-independent in theory. More interestingly, the T1ρ values measured by the proposed PM-UTE-AdiabT1ρ linearly correlated with the MAPSS CW-T1ρ measurements (R2 = 0.9985, P < 0.0001). This strong correlation demonstrates that the PM-UTE-AdiabT1ρ measurements may be also unaffected by T1 contamination, considering that the MAPSS CW-T1ρ measurement is theoretically T1-independent. Moreover, the strong linear correlation also demonstrates the comparable sensitivity between PM-UTE-AdiabT1ρ and MAPSS CW-T1ρ techniques in detecting compositional changes. We believe that one of the major contributing factors for the higher AdiabT1ρ values is the higher spin-lock frequencies used in the AdiabT1ρ preparation compared to the CW-T1ρ preparation on a clinical scanner, which was not mentioned in Pang Y’s letter article. Indeed, more research is needed to better understand the mechanism of AdiabT1ρ relaxation.
To further investigate the contrast mechanism of both AdiabT1ρ and CW-T1ρ, we plan to perform a comparison study (i.e., PM-UTE-AdiabT1ρ vs. PM-UTE-CWT1ρ) on a newly installed small-bore Bruker 3T scanner. In addition to the state-of-art preparation scheme for CW-T1ρ, a few new CW-T1ρ developments will also be incorporated with the PM-UTE sequence structure in this comparison study 45. Typically, the maximum spin-lock frequency of CW-T1ρ is limited by the peak power of the RF amplifier and SAR restriction on a clinical 3T scanner. The Bruker scanner offers more flexibility in adjusting the spin-lock frequencies than the clinical 3T scanner used in this study, thus providing more useful information in studying the mechanisms of CW-T1ρ and AdiabT1ρ. Magic angle effects will also be investigated on different spin-lock frequencies as well.
This study has several limitations. First, the total number of ex vivo and in vivo knee joints is relatively small, which is justified for this technical evaluation study. Second, we have only demonstrated the technical feasibility of the 3D PM-UTE-AdiabT1ρ sequence for volumetric T1ρ mapping of both short and long T2 tissues in normal knee joints of healthy volunteers. Patients with knee OA are not recruited for this study. The ex vivo knee joints also have relatively normal morphology. Histology was not performed to confirm the degeneration status in each knee joint specimen. Third, although the new sequence eliminates the need for T1 measurement, it comes at the cost of prolonged scan time since two acquisitions with the same gradient encodings must be scanned. The scan time can be reduced with a smaller number of TSLs, longer spiral interleaves for data acquisition, and more spokes (i.e., a higher Nsp value) in each TR 46,47. Moreover, fast imaging techniques such as compressed sensing or deep learning can be incorporated to further accelerate data acquisition 48–51. Fourth, the image signal-to-noise ratio increases when a longer Trec is used, leading to a longer total scan time. Longer Trecs will be investigated when fast imaging techniques are available to accelerate the PM-UTE-AdiabT1ρ scan.
Conclusion
The newly proposed PM-UTE-AdiabT1ρ sequence allows comprehensive quantification of all the major tissue components in the knee joint, demonstrating its potential in future clinical studies of knee OA.
Supplementary Material
Supplemental Information Table S1. Agarose and MnCl2 concentrations as well as quantitative T1 values for sixteen phantoms (see Supplemental Information Figure S1a).
Supplemental Information Figure S1. Correlation curve of the measurements between PM-UTE-CW-T1ρ and MAPSS CW-T1ρ for the sixteen phantoms. The agarose concentrations are 1%, 2%, 3% and 4% w/v for the sixteen phantoms listed in the first (1–4), second (5–8), third (9–12) and fourth (13–16) rows, respectively (a). The T1 values of all these phantoms can be found in Supplemental Information Table S1. A very strong correlation is found between PM-UTE-CW-T1ρ and MAPSS CW-T1ρ measures (R2 = 0.9971, P < 0.0001) (b). The obtained linear regression equation also demonstrates a similar range of T1ρ measurements (i.e., [20, 100] ms) between these two techniques.
Acknowledgments
The authors acknowledge grant support from the National Institutes of Health (R01AR062581, R01AR068987, R01AR075825, R01AR078877, R01AR079484, P30AR073761, and R21AR075851), the VA Clinical Science Research & Development Service (I01CX001388, and I01CX000625), and GE Healthcare.
References
- 1.Wang L, Regatte RR. T1ρ MR Imaging of Human Musculoskeletal System. J Magn Reson Imaging. 2015;41(3):586–600. doi: 10.1002/jmri.24677 [DOI] [PMC free article] [PubMed] [Google Scholar]
- 2.Duvvuri U, Reddy R, Patel SD, Kaufman JH, Kneeland JB, Leigh JS. T1rho-relaxation in articular cartilage: effects of enzymatic degradation. Magn Reson Med. 1997;38:863–867. [DOI] [PubMed] [Google Scholar]
- 3.Regatte RR, Akella SVS, Lonner JH, Kneeland JB, Reddy R. T1rho relaxation mapping in human osteoarthritis (OA) cartilage: comparison of T1rho with T2. J Magn Reson Imaging. 2006;23:547–553. [DOI] [PubMed] [Google Scholar]
- 4.Li X, Han ET, Ma CB, Link TM, Newitt DC, Majumdar S. In vivo 3T spiral imaging based multi-slice T1ρ mapping of knee cartilage in osteoarthritis. Magnetic Resonance in Medicine: An Official Journal of the International Society for Magnetic Resonance in Medicine. 2005;54(4):929–936. [DOI] [PubMed] [Google Scholar]
- 5.Wang N, Xia Y. Dependencies of multi-component T2 and T1ρ relaxation on the anisotropy of collagen fibrils in bovine nasal cartilage. Journal of magnetic Resonance. 2011;212(1):124–132. [DOI] [PMC free article] [PubMed] [Google Scholar]
- 6.Shao H, Pauli C, Li S, et al. Magic angle effect plays a major role in both T1rho and T2 relaxation in articular cartilage. Osteoarthritis Cartilage. 2017;25:2022–2030. [DOI] [PMC free article] [PubMed] [Google Scholar]
- 7.Du J, Statum S, Znamirowski R, Bydder GM, Chung CB. Ultrashort TE T1ρ magic angle imaging. Magn Reson Med. 2013;69(3):682–687. doi: 10.1002/mrm.24296 [DOI] [PubMed] [Google Scholar]
- 8.Wu M, Ma Y, Wan L, et al. Magic angle effect on adiabatic T1rho imaging of the Achilles tendon using 3D ultrashort echo time cones trajectory. NMR Biomed. 2020;33:e4322. [DOI] [PMC free article] [PubMed] [Google Scholar]
- 9.Wu M, Ma Y, Kasibhatla A, et al. Convincing evidence for magic angle less-sensitive quantitative T1rho imaging of articular cartilage using the 3D ultrashort echo time cones adiabatic T1rho (3D UTE Cones-AdiabT1rho) sequence. Magn Reson Med. 2020;84:2551–2560. [DOI] [PMC free article] [PubMed] [Google Scholar]
- 10.Hänninen N, Rautiainen J, Rieppo L, Saarakkala S, Nissi MJ. Orientation anisotropy of quantitative MRI relaxation parameters in ordered tissue. Sci Rep. 2017;7:9606. [DOI] [PMC free article] [PubMed] [Google Scholar]
- 11.Garwood M, DelaBarre L. The return of the frequency sweep: designing adiabatic pulses for contemporary NMR. Journal of magnetic resonance. 2001;153(2):155–177. [DOI] [PubMed] [Google Scholar]
- 12.Michaeli S, Sorce DJ, Springer CS Jr, Ugurbil K, Garwood M. T1ρ MRI contrast in the human brain: modulation of the longitudinal rotating frame relaxation shutter-speed during an adiabatic RF pulse. Journal of magnetic resonance. 2006;181(1):135–147. [DOI] [PubMed] [Google Scholar]
- 13.Casula V, Autio J, Nissi MJ, et al. Validation and optimization of adiabatic T1ρ and T2ρ for quantitative imaging of articular cartilage at 3 T. Magnetic resonance in medicine. 2017;77(3):1265–1275. [DOI] [PubMed] [Google Scholar]
- 14.Zhang J, Nissi M j., Idiyatullin D, Michaeli S, Garwood M, Ellermann J. Capturing fast relaxing spins with SWIFT adiabatic rotating frame spin–lattice relaxation (T1ρ) mapping. NMR in Biomedicine. 2016;29(4):420–430. doi: 10.1002/nbm.3474 [DOI] [PMC free article] [PubMed] [Google Scholar]
- 15.Rautiainen J, Nissi MJ, Salo EN, et al. Multiparametric MRI assessment of human articular cartilage degeneration: Correlation with quantitative histology and mechanical properties. Magnetic Resonance in Medicine. 2015;74(1):249–259. doi: 10.1002/mrm.25401 [DOI] [PMC free article] [PubMed] [Google Scholar]
- 16.Jerban S, Ma Y, Kasibhatla A, et al. Ultrashort echo time adiabatic T1ρ (UTE-Adiab-T1ρ) is sensitive to human cadaveric knee joint deformation induced by mechanical loading and unloading. Magnetic Resonance Imaging. 2021;80:98–105. doi: 10.1016/j.mri.2021.04.014 [DOI] [PMC free article] [PubMed] [Google Scholar]
- 17.Wu M, Ma YJ, Liu M, et al. Quantitative assessment of articular cartilage degeneration using 3D ultrashort echo time cones adiabatic T1ρ (3D UTE-Cones-AdiabT1ρ) imaging. Eur Radiol. 2022;32(9):6178–6186. doi: 10.1007/s00330-022-08722-6 [DOI] [PMC free article] [PubMed] [Google Scholar]
- 18.Chen W Artifacts correction for T1rho imaging with constant amplitude spin-lock. J Magn Reson. 2017;274:13–23. doi: 10.1016/j.jmr.2016.11.002 [DOI] [PubMed] [Google Scholar]
- 19.Chen W Errors in quantitative T1rho imaging and the correction methods. Quantitative Imaging in Medicine and Surgery. 2015;5(4):58391–58591. doi: 10.3978/j.issn.2223-4292.2015.08.05 [DOI] [PMC free article] [PubMed] [Google Scholar]
- 20.Witschey WRT, Borthakur A, Elliott MA, et al. Artifacts in T1ρ-Weighted Imaging: Compensation for B1 and B0 Field Imperfections. J Magn Reson. 2007;186(1):75–85. doi: 10.1016/j.jmr.2007.01.015 [DOI] [PMC free article] [PubMed] [Google Scholar]
- 21.Ma Y, Carl M, Searleman A, Lu X, Chang EY, Du J. 3D Adiabatic T1rho prepared Ultrashort Echo Time Cones (3D AdiabT1rho UTE-Cones) sequence for whole knee imaging. Magn Reson Med. 2018;80:1429–1439. [DOI] [PMC free article] [PubMed] [Google Scholar]
- 22.Wu M, Zhao W, Wan L, et al. Quantitative three‐dimensional ultrashort echo time cones imaging of the knee joint with motion correction. NMR in Biomedicine. 2020;Jan;33(1):e4214. [DOI] [PMC free article] [PubMed] [Google Scholar]
- 23.Li X, Han ET, Busse RF, Majumdar S. In vivo T(1rho) mapping in cartilage using 3D magnetization-prepared angle-modulated partitioned k-space spoiled gradient echo snapshots (3D MAPSS). Magn Reson Med. 2008;59(2):298–307. doi: 10.1002/mrm.21414 [DOI] [PMC free article] [PubMed] [Google Scholar]
- 24.Pang Y An adiabatic RF pulse in spin-lock preparations: A double-edged sword for quantitative R1ρ imaging in clinical applications. NMR in Biomedicine. 2023:e4953. [Google Scholar]
- 25.Carl M, Bydder GM, Du J. UTE imaging with simultaneous water and fat signal suppression using a time-efficient multispoke inversion recovery pulse sequence. Magnetic Resonance in Medicine. 2016;76(2):577–582. doi: 10.1002/mrm.25823 [DOI] [PMC free article] [PubMed] [Google Scholar]
- 26.Ma Y, Zhu Y, Lu X, Carl M, Chang EY, Du J. Short T2 Imaging Using a Three-Dimensional Double Adiabatic Inversion Recovery Prepared Ultrashort Echo Time Cones (3D DIR-UTE-Cones) Sequence. Magn Reson Med. 2018;79:2555–2563. [DOI] [PMC free article] [PubMed] [Google Scholar]
- 27.Ma YJ, Chen Y, Li L, et al. Trabecular bone imaging using a 3D adiabatic inversion recovery prepared ultrashort TE Cones sequence at 3T. Magnetic Resonance in Medicine. 2020;83(5):1640–1651. [DOI] [PMC free article] [PubMed] [Google Scholar]
- 28.Ma YJ, Zhao W, Wan L, et al. Whole knee joint T1 values measured in vivo at 3T by combined 3D ultrashort echo time cones actual flip angle and variable flip angle methods. Magnetic resonance in medicine. 2019;81(3):1634–1644. [DOI] [PMC free article] [PubMed] [Google Scholar]
- 29.Levenberg K A method for the solution of certain non-linear problems in least squares. Quarterly of applied mathematics. 1944;2(2):164–168. [Google Scholar]
- 30.Marquardt DW. An algorithm for least-squares estimation of nonlinear parameters. Journal of the society for Industrial and Applied Mathematics. 1963;11(2):431–441. [Google Scholar]
- 31.Chen E, Amano K, Pedoia V, Souza RB, Ma CB, Li X. Longitudinal analysis of tibiofemoral cartilage contact area and position in ACL reconstructed patients. Journal of Orthopaedic Research. 2018;36(10):2718–2727. doi: 10.1002/jor.24024 [DOI] [PMC free article] [PubMed] [Google Scholar]
- 32.Mamoto K, Xu K, Shimizu T, et al. T1ρ and T2 of articular cartilage after acl injury predict patient-reported outcomes at 3 years after acl reconstruction. Osteoarthritis and Cartilage. 2018;26:S49–S50. doi: 10.1016/j.joca.2018.02.113 [DOI] [Google Scholar]
- 33.Blumenkrantz G, Zuo J, Li X, Kornak J, Link TM, Majumdar S. In vivo 3.0-tesla magnetic resonance T1rho and T2 relaxation mapping in subjects with intervertebral disc degeneration and clinical symptoms. Magn Reson Med. 2010;63(5):1193–1200. doi: 10.1002/mrm.22362 [DOI] [PMC free article] [PubMed] [Google Scholar]
- 34.Roach KE, Souza RB, Majumdar S, Pedoia V. Local Patterns in 2-Year T1ρ and T2 Changes of Hip Cartilage Are Related to Sex and Functional Data: A Prospective Evaluation on Hip Osteoarthritis Participants. J Magn Reson Imaging. July 2022. doi: 10.1002/jmri.28347 [DOI] [PMC free article] [PubMed] [Google Scholar]
- 35.Rauscher I, Stahl R, Cheng J, et al. Meniscal measurements of T1rho and T2 at MR imaging in healthy subjects and patients with osteoarthritis. Radiology. 2008;249(2):591–600. [DOI] [PMC free article] [PubMed] [Google Scholar]
- 36.Xie D, Murray J, Lartey R, et al. Multi-vendor multi-site quantitative MRI analysis of cartilage degeneration 10 Years after anterior cruciate ligament reconstruction: MOON-MRI protocol and preliminary results. Osteoarthritis and Cartilage. 2022;30(12):1647–1657. [DOI] [PMC free article] [PubMed] [Google Scholar]
- 37.Brandt KD, Radin EL, Dieppe PA, Van De Putte L. Yet more evidence that osteoarthritis is not a cartilage disease. Annals of the rheumatic diseases. 2006;65(10):1261–1264. [DOI] [PMC free article] [PubMed] [Google Scholar]
- 38.Hunter DJ, Zhang Y, Niu J, et al. Structural factors associated with malalignment in knee osteoarthritis: the Boston osteoarthritis knee study. The Journal of rheumatology. 2005;32(11):2192–2199. [PubMed] [Google Scholar]
- 39.Hunter DJ, Zhang YQ, Niu JB, et al. The association of meniscal pathologic changes with cartilage loss in symptomatic knee osteoarthritis. Arthritis & Rheumatism. 2006;54(3):795–801. [DOI] [PubMed] [Google Scholar]
- 40.Tan AL, Toumi H, Benjamin M, et al. Combined high-resolution magnetic resonance imaging and histological examination to explore the role of ligaments and tendons in the phenotypic expression of early hand osteoarthritis. Annals of the rheumatic diseases. 2006;65(10):1267–1272. [DOI] [PMC free article] [PubMed] [Google Scholar]
- 41.Wheaton AJ, Borthakur A, Corbo M, Charagundla SR, Reddy R. Method for reduced SAR T1ρ-weighted MRI. Magnetic Resonance in Medicine. 2004;51(6):1096–1102. doi: 10.1002/mrm.20141 [DOI] [PubMed] [Google Scholar]
- 42.Xia Y Relaxation anisotropy in cartilage by NMR microscopy (muMRI) at 14-microm resolution. Magn Reson Med. 1998;39(6):941–949. doi: 10.1002/mrm.1910390612 [DOI] [PubMed] [Google Scholar]
- 43.Xia Y, Moody JB, Alhadlaq H. Orientational dependence of T2 relaxation in articular cartilage: A microscopic MRI (microMRI) study. Magn Reson Med. 2002;48(3):460–469. [DOI] [PubMed] [Google Scholar]
- 44.Mlynárik V, Szomolányi P, Toffanin R, Vittur F, Trattnig S. Transverse relaxation mechanisms in articular cartilage. J Magn Reson. 2004;169(2):300–307. [DOI] [PubMed] [Google Scholar]
- 45.Pala S, Hänninen NE, Nykänen O, Liimatainen T, Nissi MJ. New methods for robust continuous wave T1ρ relaxation preparation. NMR Biomed. 2023;36(2):e4834. [DOI] [PMC free article] [PubMed] [Google Scholar]
- 46.Wan L, Zhao W, Ma Y, et al. Fast quantitative 3D ultrashort echo time MRI of cortical bone using extended cones sampling. Magnetic Resonance in Medicine. 2019;82(1):225–236. [DOI] [PMC free article] [PubMed] [Google Scholar]
- 47.Wan L, Ma Y, Yang J, et al. Fast quantitative three-dimensional ultrashort echo time (UTE) Cones magnetic resonance imaging of major tissues in the knee joint using extended sprial sampling. NMR in Biomedicine. 2020;33(10):e4376. doi: 10.1002/nbm.4376 [DOI] [PMC free article] [PubMed] [Google Scholar]
- 48.Athertya JS, Ma Y, Masoud Afsahi A, et al. Accelerated Quantitative 3D UTE-Cones Imaging Using Compressed Sensing. Sensors. 2022;22(19):7459. doi: 10.3390/s22197459 [DOI] [PMC free article] [PubMed] [Google Scholar]
- 49.Ma YJ, Searleman AC, Jang H, et al. Whole-Brain Myelin Imaging Using 3D Double-Echo Sliding Inversion Recovery Ultrashort Echo Time (DESIRE-UTE) MRI. Radiology. 2020;294(2):362–374. [DOI] [PMC free article] [PubMed] [Google Scholar]
- 50.Wu Y, Ma Y, Liu J, Du J, Xing L. Self-attention convolutional neural network for improved MR image reconstruction. Information Sciences. 2019;490:317–328. [DOI] [PMC free article] [PubMed] [Google Scholar]
- 51.Wu Y, Ma Y, Capaldi DP, et al. Incorporating prior knowledge via volumetric deep residual network to optimize the reconstruction of sparsely sampled MRI. Magnetic Resonance Imaging. 2020;66:93–103. doi: 10.1016/j.mri.2019.03.012 [DOI] [PMC free article] [PubMed] [Google Scholar]
Associated Data
This section collects any data citations, data availability statements, or supplementary materials included in this article.
Supplementary Materials
Supplemental Information Table S1. Agarose and MnCl2 concentrations as well as quantitative T1 values for sixteen phantoms (see Supplemental Information Figure S1a).
Supplemental Information Figure S1. Correlation curve of the measurements between PM-UTE-CW-T1ρ and MAPSS CW-T1ρ for the sixteen phantoms. The agarose concentrations are 1%, 2%, 3% and 4% w/v for the sixteen phantoms listed in the first (1–4), second (5–8), third (9–12) and fourth (13–16) rows, respectively (a). The T1 values of all these phantoms can be found in Supplemental Information Table S1. A very strong correlation is found between PM-UTE-CW-T1ρ and MAPSS CW-T1ρ measures (R2 = 0.9971, P < 0.0001) (b). The obtained linear regression equation also demonstrates a similar range of T1ρ measurements (i.e., [20, 100] ms) between these two techniques.