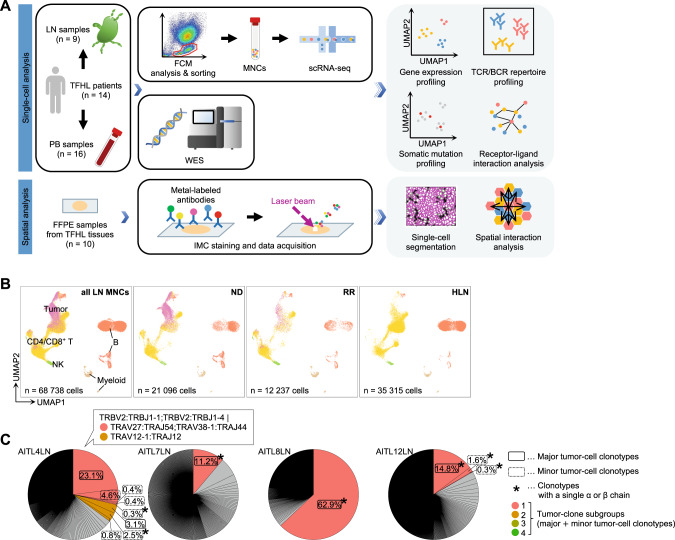
Fig. 1. Transcriptomic profile of T follicular helper cell lymphoma (TFHL) samples.
A Study overview and workflow of analysis. BCR B cell receptor, scRNA-seq, single-cell RNA sequencing, FCM flow cytometry, FFPE formalin-fixed paraffin-embedded, IMC imaging mass cytometry, LN lymph node, MNC mononuclear cell, PB peripheral blood, TCR T-cell receptor, UMAP Uniform Manifold Approximation and Projection for Dimension Reduction, WES whole-exome sequencing, B UMAP plots of all MNCs from nine TFHL LNs and seven homeostatic lymph nodes (HLNs), colored by cell type (left). Cells are shown separately for each clinical status (middle two and right). B, B cell; CD4/CD8+ T, CD4+ and CD8+ T cell; Myeloid, myeloid cell; NK, natural killer cell; ND newly diagnosed, TFHL; RR relapsed or refractory TFHL, Tumor, tumor cell. C Representative pie charts of TCR clonotypes for each sample. Tumor clones are colored.

