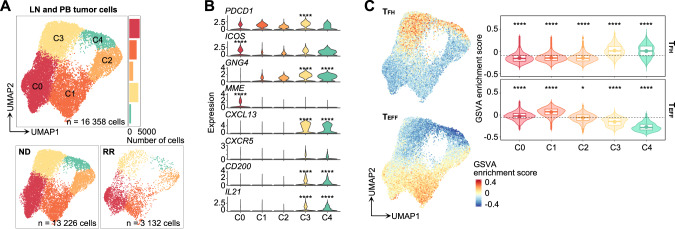
Fig. 2. Single-cell analysis of tumor cells from TFHL LN and PB samples.
A UMAP plots of LN and PB tumor cell subclusters (top). Cells are shown separately for each clinical status (bottom). B The expression levels of known T follicular helper (TFH) cell markers for each cluster. Adjusted P values are calculated by the Wilcoxon rank-sum test with Bonferroni correction across all genes expressed by tumor cells and shown only when there is a significant difference. C Feature (left panel) and violin (right panel) plots of gene set variation analysis (GSVA) enrichment score for TFH (top) or CD4+ effector T cell (TEFF, bottom) signatures in tumor cells. In the violin plots, the dotted lines represent mean enrichment scores across all clusters. The boxplots show the median (center line), mean (center dot), interquartile range (box limits), and minimum to max values (whiskers) for each group. Adjusted P values are calculated by the pairwise Wilcoxon rank-sum test for each cluster against the mean value of all clusters. *P < 5.0 × 10⁻², ****P < 1.0 × 10⁻⁴.

