Abstract
Background:
Long QT syndrome (LQTS) is characterized by QT prolongation and increased risk for syncope, seizures, and sudden cardiac death. The majority of LQTS stems from pathogenic mutations in KCNQ1, KCNH2, or SCN5A. However, ~10% of patients with LQTS remain genetically elusive. We utilized genome sequencing (GS) to identify a novel LQTS genetic substrate in a multigenerational “genotype-negative” LQTS pedigree.
Methods:
GS was performed on 5 affected family members. Only rare non-synonymous variants present in all affected family members were considered. The candidate variant was characterized functionally in patient-derived induced pluripotent stem cell (iPSC) and gene-edited, variant corrected, isogenic control iPSC derived cardiomyocytes (CMs).
Results:
A missense variant (p.G6S) was identified in ALG10B-encoded alpha-1,2-glucosyltransferase B. ALG10B is a known interacting protein of KCNH2-encoded Kv11.1 (HERG). Compared with isogenic control, ALG10B-p.G6S iPSC-CMs showed 1) decreased protein expression of ALG10B (p.G6S: 0.7±0.18, n=8 vs. control: 1.25±0.16, n=9, p<0.05); 2) significant retention of HERG in the endoplasmic reticulum (p<0.0005); and 3) a significantly prolonged action potential duration (APD) confirmed by both patch clamp (p.G6S: 531.1±38.3 ms, n=15 vs. control: 324.1±21.8 ms, n=13, p<0.001) and MEA (p<0.0001). Lumacaftor, a compound known to rescue HERG trafficking, shortened the pathologically prolonged APD of ALG10B-p.G6S iPSC-CMs by 10.6% (n=31 electrodes, p<0.001).
Conclusions:
Here, we demonstrate that ALG10B-p.G6S down-regulates ALG10B resulting in defective HERG trafficking and APD prolongation. Therefore, ALG10B is a novel LQTS-susceptibility gene underlying the LQTS phenotype observed in a multigenerational pedigree. ALG10B mutation analysis may be warranted, especially in genotype-negative patients with an LQT2-like phenotype.
Keywords: Arrhythmia, Genetics, Heart Arrest, Long-QT Syndrome, Pediatrics, Arrhythmia and Electrophysiology, Induced Pluripotent Stem Cells
INTRODUCTION
Sudden cardiac death (SCD) accounts for approximately 3.7 million deaths worldwide and has an estimated annual incidence ranging from 180,000 to 450,000 in the United States (US).1, 2 Annually, 2000 to 5000 young people under the age of 35 die suddenly in the US.1 Potentially lethal cardiac channelopathies such as long QT syndrome (LQTS) underlie a significant portion of SCD in the young.3
LQTS is typically an autosomal dominant disorder characterized by delayed repolarization of the myocardium associated with a prolonged QT interval on an electrocardiogram (ECG).4 Patients with LQTS have an increased risk for syncope, seizures, and sudden cardiac arrest (SCA) usually following a precipitating event such as exercise, extreme emotion, or auditory trigger.4 The prevalence of LQTS is ~1 in 2000 people and if left untreated, there is an estimated 50% 10-year mortality in the highest risk subset.5
About 75% of patients with LQTS host either loss-of-function (LOF) or gain-of-function (GOF) mutations in one of 3 major LQTS genes: KCNQ1-encoded IKs (Kv7.1) potassium channel (LQT1, ~35%, LOF), KCNH2-encoded IKr (Kv11.1, human Ether-à-go-go-Related Gene [HERG]) potassium channel (LQT2, ~30%, LOF), and SCN5A-encoded INa (Nav1.5) sodium channel (LQT3, ~10%, GOF) that are responsible for the cardiac action potential duration (APD).6, 7 Although the minor LQTS-associated genes contribute ~5% of overall cases, the remaining ~10–20% of patients diagnosed with LQTS clinically have a genetically elusive cause underlying their pathology and are thus classified as “genotype-negative”.8
In this study, we performed genome sequencing (GS) on a multigenerational “genotype-negative” LQTS pedigree to identify a novel genetic substrate explaining their autosomal dominant LQT2-like phenotype. Patient-specific inducible pluripotent cell derived cardiomyocyte (iPSC-CM) disease modeling with candidate gene variant corrected isogenic control iPSC-CMs were used to demonstrate the necessity of the candidate variant in causing APD prolongation and provide mechanistic insights into the cellular pathogenicity of the variant.
METHODS
A Caucasian family with autosomal dominant LQTS was referred to the Mayo Clinic Windland Smith Rice Sudden Death Genomics Laboratory for further research-based genetic testing following negative commercially available genetic testing for LQTS. To prevent the re-identification of patients included in this study, individual patient data will not be made available to other researchers. The authors declare that all supporting data are available within the article and its online supplementary files. This study was approved by the Mayo Clinic Institutional Review Board (1216–97 and 09–006465). Patient samples were collected following written informed patient consent. The detailed methods are included in the supplemental material.
RESULTS
A multigenerational pedigree diagnosed with autosomal dominant long QT syndrome
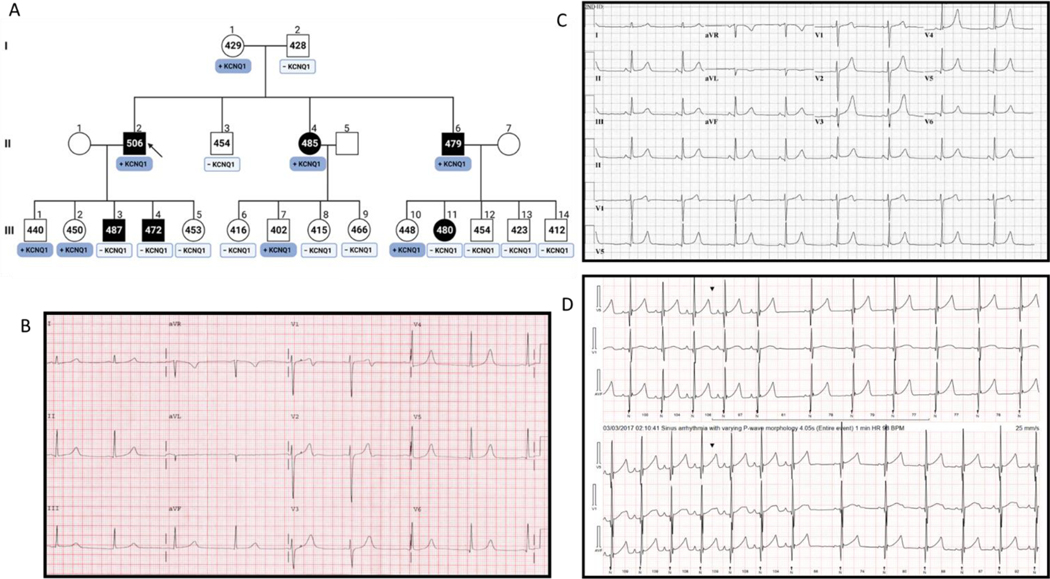
The index case is a male who was originally diagnosed clinically at age 10-years-old following a near syncopal event after jumping into a cold swimming pool (Figure 1A). Figure 1B shows a representative ECG tracing for the index case. Two of his siblings have experienced exertion-related syncope during childhood and an abnormal ECG. Research-based genetic testing was performed initially on the index case in the era prior to clinical laboratory improvement amendments (CLIA) approved commercial laboratory based genetic testing for LQTS. A KCNQ1-pG292D (c.806 G>A) variant was identified and reported as a “probable pathogenic mutation” based on its absence in 1,488 reference alleles from four ethnic groups.9 Cascade genetic testing identified KCNQ1-p.G292D in the index case’s affected siblings. However, several affected family members have since been shown to be negative for KCNQ1-p.G292D including two of the index case’s male children and niece (III3, III4, and III10, Figure 1A). The ECG of index cases’ brother (II6) demonstrated very tall T waves in the precordial leads (Figure 1C). In limb lead III and aVF there was a subtle flattening of the top of the T wave. This combined with the T waves in the Holter traces from the brother’s daughter that looked notched throughout the Holter recording raised the possibility of missed LQT2 (Figure 1D). Given the genotype-negative/phenotype-positive discordance in several affected family members, we performed GS on five affected family members to elucidate the underlying elusive QT substrate (Figure 2A).
Figure 1 |. A multi-generational pedigree diagnosed with autosomal dominant long QT syndrome.
Shown in panel A is a multi-generation pedigree diagnosed with LQTS. The arrow points to the family index case. Squares represent males, Circles represent females. The black symbols represent family members diagnosed with LQTS based on a prolonged QTc interval. The numbers within the symbols represent the QTc measurements in milliseconds. The boxes under the symbols represent the genotype for family members identified as genotype-positive (dark blue) or genotype-negative (light blue) for the KCNQ1-p.G292D variant identified originally in the index case. Panel B shows a representative ECG tracing for the index case. Panel C is a representative ECG tracing of a family member (1A, II6) demonstrating very tall T waves in the precordial leads and a subtle flattening of the top of the T wave in limb lead III and aVF. Panel D represents Holter traces from a family member (1A, III11) where T waves appear notched and reminiscent of LQT2 like ECG.
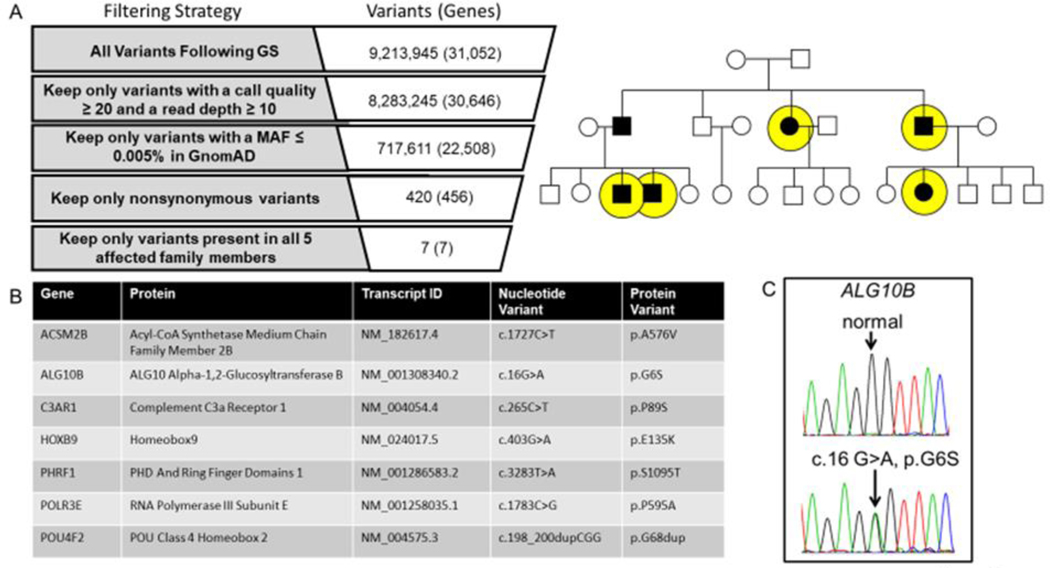
Figure 2 |. Genome sequencing for the identification of a novel pathogenic substrate in an autosomal dominant LQTS pedigree.
Shown in panel A is the genome sequencing variant filtering strategy used to identify ultra-rare non-synonymous candidate variants present in all affected individuals who underwent genome sequencing (yellow circles). Panel B lists the candidate genes/variants that were considered for further analysis. Of the 7 ultra-rare variants, the ALG10B-p.G6S variant represented the top candidate disease causing gene/variant based on biological plausibility. In panel C is the Sanger sequencing chromatogram confirming the c.16G>A (ALG10B-p.G6S) variant.
Genome sequencing for the identification of a novel pathogenic substrate in an autosomal dominant LQTS pedigree
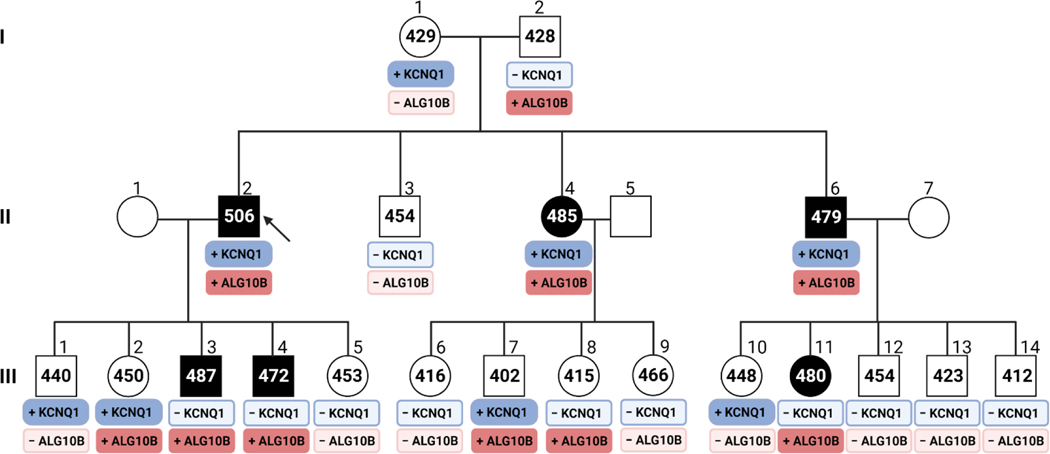
Following GS and ultra-rare (minor allele frequency<0.0005, gnomAD) non-synonymous variant filtering using an autosomal dominant inheritance pattern, we identified 7 ultra-rare non-synonymous variants in 7 genes present in all affected family members (Figure 2A and 2B). Only one variant (ALG10B-c.16G>A, p.G6S) occurs in a gene whose protein product is a known ion channel interacting protein expressed in the heart.10, 11 The ALG10B-c.16G>A variant was confirmed by Sanger sequencing (Figure 2C). Cascade genetic testing identified 5 additional family members who tested positive for ALG10B-p.G6S (Figure 3).
Figure 3 |. Genome sequencing for the identification of a novel pathogenic substrate in an autosomal dominant LQTS pedigree.
Shown is a multi-generation pedigree diagnosed with LQTS. The arrow points to the family index case. Squares represent males, Circles represent females. The black symbols represent family members diagnosed with LQTS based on a prolonged QTc interval. The numbers within the symbols represent the QTc measurements in milliseconds. The boxes under the symbols represent the genotype data for both the KCNQ1-p.G292D and ALG10B-p.G6S variants. The dark blue boxes represent those family members who are genotype-positive for KCNQ1-p.G292D. The dark red boxes represent those family members who are genotype positive for ALG10B-p.G6S. Family members who are genotype-negative for either the KCNQ1 or ALG10B variants are illustrated by the light blue or light red boxes, respectively. Figure created using Biorender.com.
Generation of patient-specific iPSC-CMs
To determine if ALG10B-pG6S is the pathogenic substrate responsible for the LQTS phenotype observed in the pedigree, patient-specific iPSCs (2 clones) were created from one of the ALG10B-p.G6S positive family members (II6). This family member also has the KCNQ1-p.G292D variant. ALG10B-p.G6S variant corrected isogenic control iPSCs lines (2 clones) were created using CRISPR/Cas9 technology. All clones were confirmed to contain predicted (mutant or wild type) sequences by Sanger sequencing (Figure 4A), cardiomyocyte differentiation markers after differentiation (Figure 4B), a normal female karyotype (Figure 4C), and pluripotent markers (Figure 4D).
Figure 4 |. Generation of patient-specific iPSC-CMs.
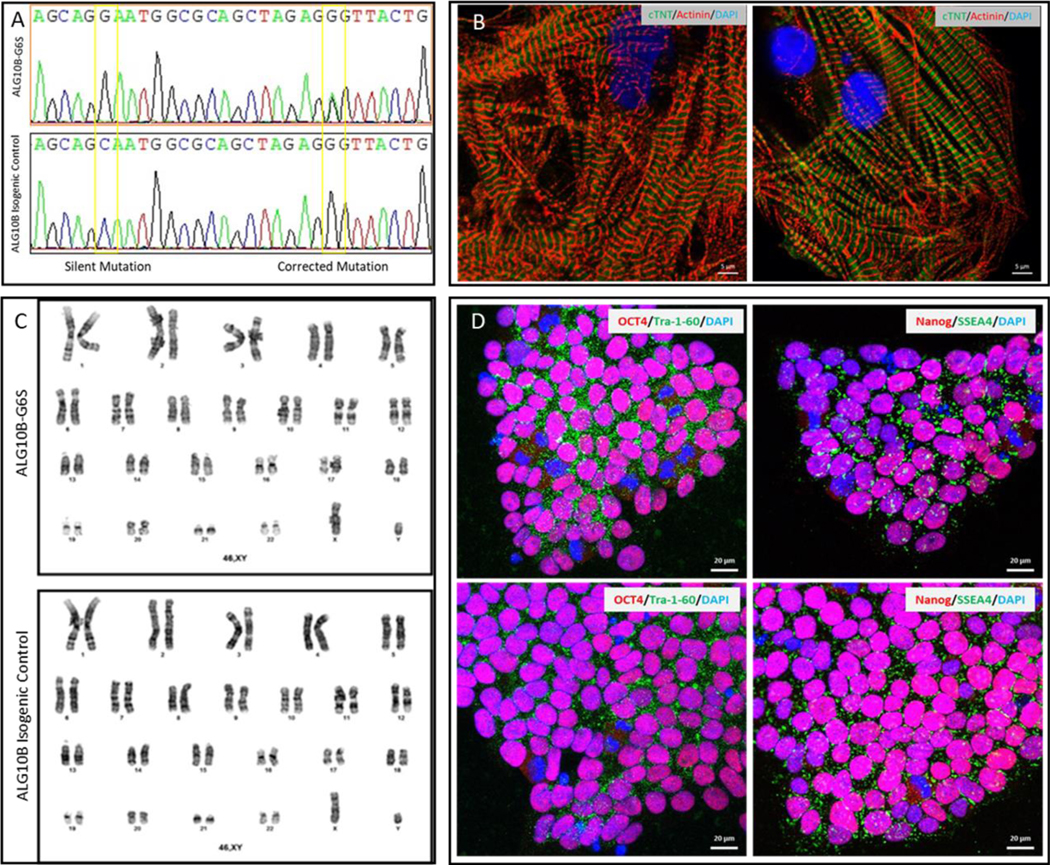
Shown in panel A is sanger sequencing of isogenic control and ALG10B-G6S iPSCs, shown in panel C are normal male karyotype of isogenic control and ALG10B-G6S iPSCs. Shown in panel D are representative confocal images of undifferentiated patient-specific mutant and isogenic control iPSCs demonstrating four pluripotent markers (Tra-1–60, NANOG, SSEA4, and OCT4). Scale bars equal 20μm. Following cardiac differentiation, iPSC-derived cardiomyocyte was confirmed with differentiation markers (α-actinin and cTnT) as shown in panel B.
The novel ALG10B-p.G6S variant is necessary for action potential prolongation in the patient’s iPSC-CMs
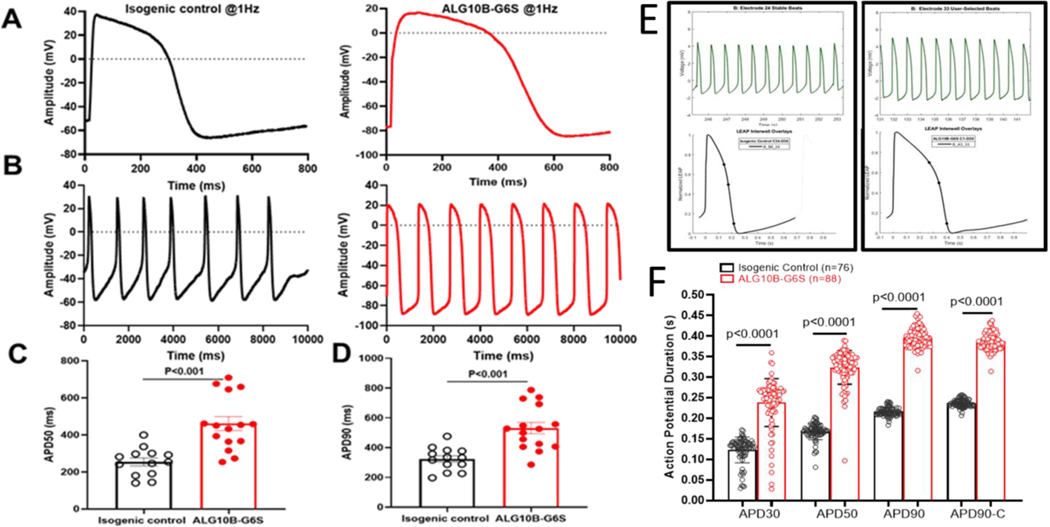
To examine whether ALG10B-p.G6S-derived iPSC-CMs could demonstrate APD prolongation, action potential (AP) measurements were performed in both isogenic control and ALG10B-p.G6S-derived iPSC-CMs using the standard whole-cell patch clamp current clamp mode at a constant paced rate of 1 Hz or gap free configuration. Not surprisingly, ALG10B-p.G6S-derived iPSC-CMs revealed APD prolongation in both paced (Figure 5A) and spontaneous mode (Figure 5B). APD50 was significantly prolonged from 254.1±21.0 ms (isogenic control, n=13) to 460.9±38.1 ms (ALG10B-p.G6S, n=15, p<0.001 vs. isogenic control) (Figure 5C). APD90 was also significantly prolonged from 324.1±21.8 ms (isogenic control, n=13) to 531.1±38.3 ms (ALG10B-p.G6S, n=15, p<0.001 vs. isogenic control) (Figure 5D).
Figure 5 |. The novel ALG10B-p.G6S variant is necessary for action potential prolongation in the patient’s iPSC-CMs.
A. Representative patch-clamp AP traces from isogenic control (black) and ALG10B-G6S-derived iPSC-CMs (red) paced at 1Hz. B. Representative patch-clamp AP traces from isogenic control (black) and ALG10B-G6S-derived iPSC-CMs (red) in gap free configuration. C. Bar graph showing APD50 from isogenic control (n= 13) and ALG10B-G6S (n=15) iPSC-CMs paced at 1 Hz. D. Bar graph showing APD90 from isogenic control (n= 13) and ALG10B-G6S (n=15) iPSC-CMs paced at 1 Hz. E. Representative multielectrode assay (MEA) plus local extracellular action potential (LEAP) based stable beatings (on top) and APD (on bottom) traces of isogenic control (left panel) and ALG10B-G6S (right panel)-derived iPSC-CMs. F. Bar graph showing APD30, APD50, APD90 and corrected APD90 (APD90c) from isogenic control (n=76 electrodes in 12 wells and ALG10B-G6S (n=88 electrodes in 12 wells). All values in panel C, D, and F represent mean±SEM.
Recently, local extracellular action potential (LEAP), a high throughput assay used for AP measurements in iPSC-CMs, has been established as a powerful tool for iPSC-CM electrophysiology.12 In addition to patch clamp recordings, we performed electrophysiology studies in isogenic control and ALG10B-p.G6S-derived iPSC-CMs using multielectrode assay (MEA) plus LEAP. The AP morphology of normalized LEAP (Figure 5E) from both isogenic control and ALG10B-p.G6S iPSC-CMs was very similar to that derived from patch clamp. The APD30, 50, 90 and corrected APD90 (APD90c) in ALG10B-p.G6S iPSC-CMs were significantly prolonged compared to isogenic control iPSC-CMs (APD30: 238.1±6.2 ms vs.123±3.6 ms; APD50: 323.7±4.3 ms vs. 167.3±2.3 ms; APD90: 395.9±2.5 ms vs. 215.8±1.2 ms; APC90c: 387.9±2.2 ms vs. 236.4±1.2 ms; ALG10B-p.G6S, n=88 vs. isogenic control, n=76; p<0.0001) (Figure 5F). The APD data were consistent between MEA plus LEAP and patch clamp.
The novel ALG10B-p.G6S variant is associated with impaired trafficking of HERG potassium channels
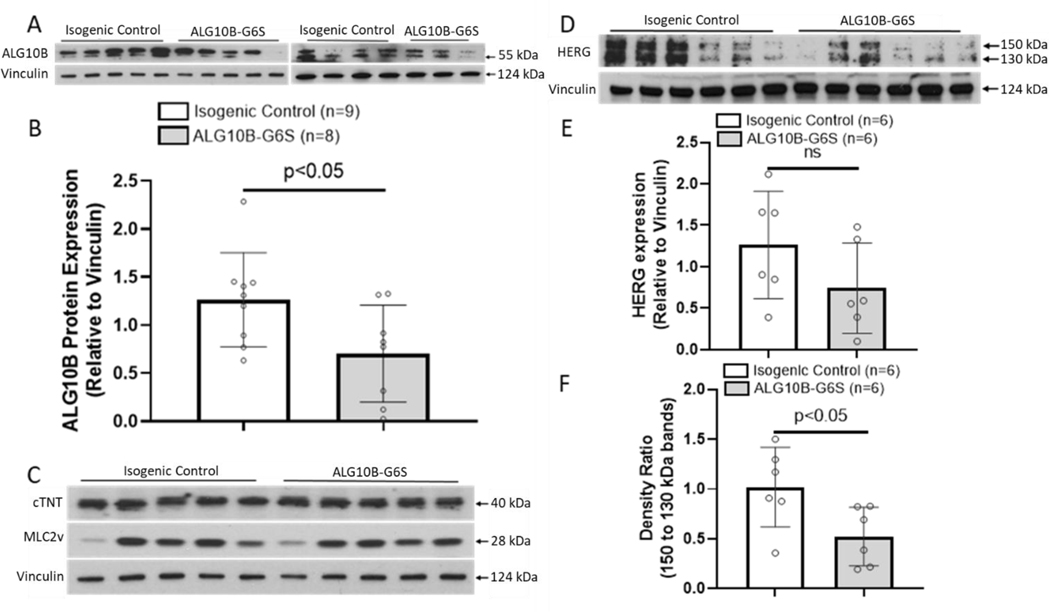
Using western blot, we showed that ALG10B expression was significantly decreased in ALG10B-p.G6S iPSC-CMs compared to isogenic control iPSC-CMs (0.7±0.18 vs. 1.25±0.16, ALG10B-p.G6S, n=8 vs. isogenic control, n=9, p<0.05, Figures 6A–B). There was no significant difference in protein expression of cTNT and MLC2v between isogenic control and ALG10B-p.G6S iPSC-CMs (Figure 6C). Because ALG10B is a known to interact with HERG, we compared the expression profile of HERG in isogenic control and ALG10B-p.G6S iPSC-CMs. While there was no significant difference in HERG expression between isogenic control and ALG10B-p.G6S iPSC-CMs (1.26±0.27 vs. 0.74±0.22, isogenic control, n=6 vs. ALG10B-p.G6S, n=6, p>0.05, Figure 6D–E), the density ratio of 150 kDa (mature HERG) to 130 kDa (immature HERG) was significantly decreased in ALG10B-p.G6S iPSC-CMs compared to isogenic control iPSC-CMs (1.02±0.16 vs. 0.52±0.12, isogenic control, n=6 vs. ALG10B-p.G6S, n=6, p<0.05, Figure 6F) thus suggesting the ALG10B-p.G6S results in a HERG trafficking defect.
Figure 6 |. ALG10B expression was significantly decreased in ALG10B-G6S iPSC-CMs.
A. Western blot demonstrating ALG10B expression (relative to Vinculin) in isogenic control and ALG10B-G6S iPSC-CMs. B. Bar graph showing ALG10B expression in isogenic control (n=9) and ALG10B-G6S iPSC-CMs (n=8) by western blot data analysis. C. Western blot demonstrating cTNT, MLC2v expression (relative to Vinculin) in isogenic control and ALG10B-G6S iPSC-CMs. D. Western blot demonstrating HERG expression (relative to Vinculin) in isogenic control and ALG10B-G6S iPSC-CMs. E. Bar graph showing HERG expression in isogenic control (n=6) and ALG10B-G6S iPSC-CMs (n=6). F. Bar graph showing density ratio of 2 bands of HERG isogenic control (n=6) and ALG10B-G6S iPSC-CMs (n=6). All values represent mean ± SEM.
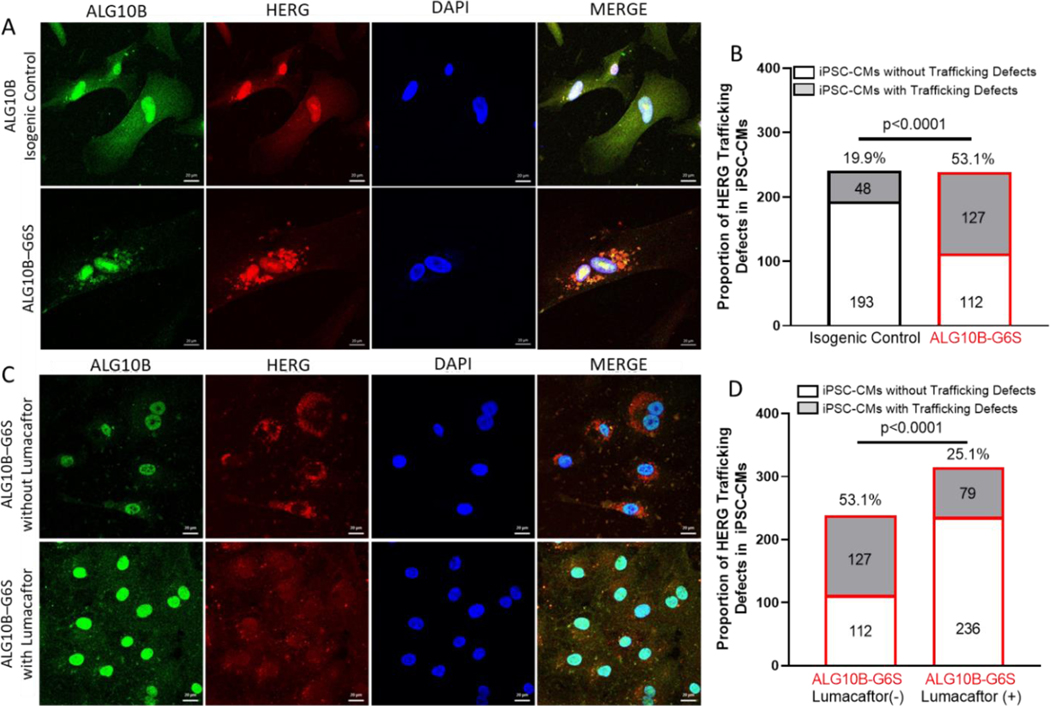
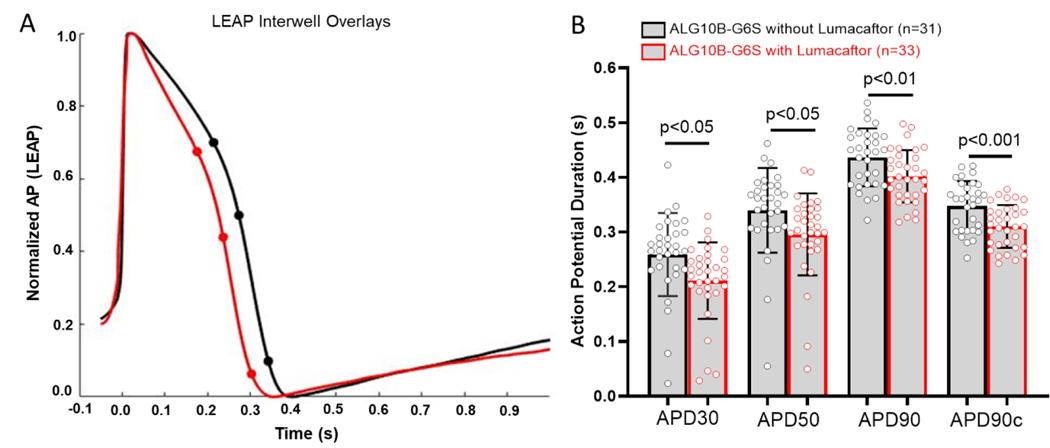
Confocal imaging showed that ALG10B was expressed in the nucleus, endoplasmic reticulum (ER), cytoplasm, and plasma membrane. However, HERG protein was significantly retained in the ER in 53.1% (127/239 cells) of ALG10B-p.G6S iPSC-CMs compared to 19.9% (48/241 cells, p<0.0005, Figure 7A–B) of isogenic control iPSC-CMs. Recently, Lumacaftor has been demonstrated to rescue HERG potassium channel trafficking defects in iPSC-CM models of LQT2. 13–15 ALG10B-p.G6S iPSC-CMs from the same batch of differentiation were treated with or without 10 μM of Lumacaftor for 10 days. Significant ER retention of HERG was seen in ALG10B-p.G6S iPSC-CMs without Lumacaftor (53.1%, 127/239 cells) compared to ALG10B-p.G6S iPSC-CMs treated with Lumacaftor (25.1%, 79/315 cells, p<0.0005, Figure 7C–D). After ALG10B-p.G6S iPSC-CMs (n=33 electrodes) were treated with 10 μM of Lumacaftor for 8 days, APD30 (0.25±0.01 s vs 0.21±0.01 s, p<0.05), APD50 (0.34±0.01 s vs 0.3±0.01 s, p<0.05), APD90 (0.44±0.01 s vs 0.4 ±0.01 s, p<0.01), and APD90c (0.35±0.01 s vs 0.31±0.01 s, p<0.001) were shortened significantly compared to untreated ALG10B-p.G6S iPSC-CMs (n=31 electrodes, Figure 8A–B).
Figure 7 |. Defective trafficking of hERG was restored by Lumacaftor in ALG10B-G6S iPSC-CMs.
A. Representative immunofluorescence images from isogenic control (on top) and ALG10B-G6S (on bottom) showing for ALG10B (green), HERG (red), nucleus (blue). B. Bar graph showing proportion of iPSC-CMs with HERG retaining in endoplasmic reticulum (ER) from isogenic control (48 out of 241 cells, 19.9%) and ALG10B-G6S (127 out of 239, 53.1%). C. Representative immunofluorescence images from ALG10B-G6S without Lumacaftor (on top) and ALG10B-G6S with Lumacaftor (on bottom) showing for ALG10B (green), HERG (red), nucleus (blue). B. Bar graph showing proportion of iPSC-CMs with HERG retaining in ER from ALG10B-G6S without Lumacaftor (127 out of 239, 53.1%) and ALG10B-G6S with Lumacaftor (79 out of 315, 25.1%).
Figure 8 |. Prolonged APD in ALG10B-G6S iPSC-CMs was shortened by Lumacaftor treatment.
A. Representative APD traces from ALG10B-G6S iPSC-CMs without Lumacaftor (black) and with Lumacaftor (red). B. Bar graph showing APD30, APD 50, APD90 and corrected APD90 from ALG1-B-G6S iPSC-CMs without Lumacaftor (black, n=31 electrodes in 11 wells) and with Lumacaftor (red, n=33 electrodes in 11 wells).
KCNQ1-G292D missense variant did not change IKs current in heterologous TSA 201 cells
Since some family members also carried KCNQ1-G292D variant, in order to address whether KCNQ1-G292D plays a role in patients’ phenotype, we performed patch clamp studies in TSA201 cells transfected with KCNQ1-WT /KCNE1 or KCNQ1-G292D/KCNE1. Typical IKs traces of voltage-dependent activation from KCNQ1+KCNE1, KCNQ1-G292D +KCNE1 are shown in Supplemental Figure IA with holding potential at −80 mV to various depolarization potentials (see figure legend). Analysis of the peak current-voltage relationship revealed that IKs peak current densities were unchanged by KCNQ1-G292D +KCNE1 across the voltage from −40 mV to +80 mV compared with KCNQ1-WT+KCNE1 (p>0.05) (Supplemental Figure IB). At +80 mV, the IKs peak current density was 790.6±81.5 pA/pF (KCNQ1-WT+KCNE1, n=10) and 719.5±86.3 pA/pF (KCNQ1-G292D +KCNE1, n=10, p=0.56 vs. KCNQ1-WT). Analysis of the tail current-voltage relationship revealed that IKs tail current densities were also unchanged by KCNQ1-G292D +KCNE1 across the voltage from −40 mV to +80 mV compared with KCNQ1-WT+KCNE1 (p>0.05) (Supplemental Figure IC). At +80 mV, the IKs tail current density was 159.3±16.7 pA/pF (KCNQ1-WT+KCNE1, n=8) and 153.4±14.6 pA/pF (KCNQ1-G292D +KCNE1, n=8, p=0.79 vs. KCNQ1-WT). Not surprisingly, Activation curves (Supplemental Figure ID) and deactivation curves (Supplemental Figure IE) remain unchanged as well across the voltage from −40 mV to +80 mV between KCNQ1-WT+KCNE1 and KCNQ1-G292D +KCNE1 (p>0.05).
DISCUSSION
Although a vast majority of LQTS has been established to have a genetic cause, about 10–20% of LQTS cases remain genetically elusive.8 Herein, we identified a novel genetic cause for a multigenerational family’s autosomal dominant “LQT2-like” phenotype.
LQT2 is caused by LOF pathogenic variants in the KCNH2-encoded (Kv11.1) potassium channel, commonly known as the HERG potassium channel, which is responsible for the repolarizing IKr current critically important in phase 3 of the ventricular action potential.16 To date, nearly 500 LQT2-associated heterozygous, pathogenic variants have been identified with 40% representing nonsense, frame-shift, or splice-site variants that inhibit HERG protein synthesis (class 1). The remaining 60% are missense variants which cause HERG channel LOF by either disrupting channel trafficking to the membrane (class 2), disrupting channel gating (class 3), and/or negatively affecting channel conductance (class 4). Of the nearly 200 unique missense variants studied to date using in vitro heterologous expression systems (i.e. HEK293 cells), ~90% (~50% of all LQT2 pathogenic variants) represent HERG channel trafficking defective mutations.16
Akin to the KCNQ1-encoded (Kv7.1) potassium, CACNA1C-encoded L-type calcium, and the SCN5A-encoded (Nav1.5) sodium channels that are responsible for the cardiac APD and associated with the pathobiology of LQTS, the HERG potassium channel is a highly regulated macromolecular complex, with associated partner proteins that work in concert with the pore-forming alpha-subunit of the channel.17 In fact, essentially all of the so called “minor” LQTS-susceptibility genes (AKAP9, ANK2, CALM1, CALM2, CALM3, CAV3, KCNE1, KCNE2, SCN4B, and SNTA1) that have been implicated previously as a monogenic cause for LQTS are channel interacting proteins to these various ion channel pore-forming subunits; most of which were identified as a result of hypothesis driven candidate gene analysis.17
Here, using genome sequencing followed by familial triangulation in a multigenerational genotype-negative pedigree, we identified ALG10B-p.G6S variant as novel monogenic cause for LQTS. The ALG10B-encoded alpha-1,2-glucosyltransferase B protein has sequence equivalence and is a functional homologue of potassium channel regulator 1 (KCR1) and is a known HERG channel interacting protein. It has been demonstrated previously to modulate the effect of drug blockade on Kv11.1 (HERG potassium channel) through the cellular glycosylation pathway.10, 11
When coexpressed in heterologous systems, KCR1 (ALG10B), a 12 transmembrane domain protein, has been demonstrated to associate with HERG at the plasma membrane and render it less sensitive to classic HERG potassium channel blockers including dofetilide, quinidine, and sotalol. 11 In 2007, Nakajima and colleagues demonstrated that KCR1 modulates drug block of HERG through enhancing cellular glycosylation by acting as an α−1,2-glucosyltransferase.11 This step is thought to be vital in the transfer of oligosaccharides to nascent polypeptides and their subsequent membrane trafficking. Although HERG itself is not a target of KCR1-mediated glycosylation, it has been shown that N-glycosylation of HERG is required for KCR1 to influence HERG pharmacology.11 This is not surprising as HERG is known to assemble into tetramers in the ER before being exported to the Golgi for complex glycosylation prior to being trafficked to the plasma membrane.18
Interestingly, in 2004, Petersen and colleagues showed that a GOF polymorphism (p.I447V, more accurately annotated as p.I446V) in KCR1 enhanced its protective role against drug blockade of HERG leading to a reduced risk of drug-induced QT prolongation.19 Among 92 patients exhibiting severe repolarization abnormalities when exposed to HERG blocking drugs, only two (2.2%) hosted the p.I447V polymorphism compared to 10 out of 71 (14%) controls. In heterologous co-expression studies performed in Chinese hamster ovary cells, wild-type KCR1 decreased the rate of dofetilide drug blockage of HERG and the p.I447V variant decreased this rate even further. Thus, suggesting the p.I447V allele may exert a protective effect against drug-induced QT prolongation. 19
Conversely, a LOF variant (E33D) in KCR1 was linked to an increased risk of drug-induced QT prolongation when identified in a 70 year-old man who experienced a sudden collapse and was found to be in ventricular fibrillation by the emergency response team.20 The patient, who had been on manidipine, kallidinogenase, and bezafibrate for hypertension and hyperlipidemia, had an emergency room ECG that recorded a QTc of 502 ms on admission and subsequently normalized to 431 ms while on metoprolol and mexiletine.
Here, using genome sequencing pedigree analysis and iPSC-CM based disease modeling we demonstrate for the first time that ALG10B LOF variants may represent a monogenic cause for LQTS. With the use of ALG10B-p.G6S patient-specific and CRISPR/Cas9 variant corrected isogenic control iPSC-CMs, we have demonstrated that the ALG10B-p.G6S variant that cosegregates with the LQTS phenotype with reduced penetrance in the multigenerational pedigree was necessary for action potential prolongation in the patient’s iPSC-CMs due to impaired trafficking of HERG potassium channels. Recently, the FDA-approved cystic fibrosis protein trafficking chaperone, lumacaftor, has been proposed as a potential therapeutic for patients with LQT2.13–15 Interestingly, lumacaftor was able to partially restore the HERG trafficking defect and shorten the action potential duration in the ALG10B-p.G6S patient-specific iPSC-CMs.
Although some family members also carried KCNQ1-G292D variant, we have demonstrated that this variant revealed normal function and might not contribute to patients’ phenotype. We also noticed that the family members who carried ALG10B variant had variable penetrance most likely due to their variable genetic background.
CONCLUSIONS
Here, we have demonstrated that ALG10B is a novel LQTS-susceptibility gene that serves as the pathogenic substrate for the LQT2-like phenotype observed in a multigenerational, genotype-negative pedigree. ALG10B mutation analysis may be warranted, especially in genotype-negative patients with an LQT2-like phenotype.
Supplementary Material
ACKNOWLEDGEMENTS
SB would like to thank the Mayo Clinic Medical Scientist Training Program for fostering an outstanding environment for physician-scientist training.
SOURCES OF FUNDING
This publication was supported by the Mayo Clinic Windland Smith Rice Comprehensive Sudden Cardiac Death Program (MJA) and the Dr. Scholl Foundation (MJA). This publication was supported in part by R01 HL163987 (LLE) and R01 HL139738 (LLE).
Non-standard Abbreviations and Acronyms:
- ALG10B
alpha-1,2-glucosyltransferase B protein
- APD
action potential duration
- ECG
electrocardiogram
- ER
endoplasmic reticulum
- GOF
gain-of-function
- GS
genome sequencing
- HERG
Ether-à-go-go-Related Gene
- iPSC-CM
Patient-specific inducible pluripotent cell derived cardiomyocyte
- KCR1
potassium channel regulator 1
- LEAP
local extracellular action potential
- LQTS
long QT syndrome
- LOF
loss-of-function
- MEA
multielectrode assay
- SCA
sudden cardiac arrest
- SCD
Sudden cardiac death
Footnotes
DISCLOSURES
Dr. Ackerman is a consultant for Abbott, ARMGO Pharma, Boston Scientific, Bristol Myers Squibb, Daichii Sankyo, Invitae, LQT Therapeutics, Medtronic, and UpToDate. MJA and Mayo Clinic are involved in an equity/royalty relationship with AliveCor, Anumana, and Pfizer. However, none of these entities were involved in this study. Other authors declare no conflicts.
REFERENCES
- 1.Mehra R. Global public health problem of sudden cardiac death. J Electrocardiol. 2007;40:S118–S122. [DOI] [PubMed] [Google Scholar]
- 2.Kong MH, Fonarow GC, Peterson ED, Curtis AB, Hernandez AF, Sanders GD, Tomas KL, Hayes DL, and Al-Khatib SM. Systematic Review of the Incidence of Sudden Cardiac Death in the United States. J Am Coll Cardiol. 2011;57:794–801. [DOI] [PMC free article] [PubMed] [Google Scholar]
- 3.Tester D, Medeiros-Domingo A, Will M, Haglund C and Ackerman M. Cardiac Channel Molecular Autopsy: Insights From 173 Consecutive Cases of Autopsy-Negative Sudden Unexplained Death Referred for Postmortem Genetic Testing. Mayo Clin Proc. 2012;87:524–539. [DOI] [PMC free article] [PubMed] [Google Scholar]
- 4.Moss AJ and Kass RS. Long QT syndrome: from channels to cardiac arrhythmias. J Clin Invest. 2005:2018–24. [DOI] [PMC free article] [PubMed] [Google Scholar]
- 5.Anson BD, Ackerman MJ, Tester DJ, Will ML, Delisle BP, Anderson CL, January CT. Molecular and functional characterization of common polymorphisms in HERG (KCNH2) potassium channels. Am J Physiol Heart Circ Physiol. 2004;286:H2434–H2441. [DOI] [PubMed] [Google Scholar]
- 6.Tester DJ, Will ML, Haglund CM and Ackerman MJ. Compendium of cardiac channel mutations in 541 consecutive unrelated patients referred for long QT syndrome genetic testing. Heart Rhythm. 2005;2:507–17. [DOI] [PubMed] [Google Scholar]
- 7.Napolitano C, Priori SG, Schwartz PJ, Bloise R, Ronchetti E, Nastoli J, Bottelli G, Cerrone M, Leonardi S . Genetic testing in the long QT syndrome: development and validation of an efficient approach to genotyping in clinical practice.[see comment]. JAMA. 2005;294:2975–80. [DOI] [PubMed] [Google Scholar]
- 8.Ackerman M, Priori S, Willems S, Berul C, Brugada R, Calkins H, Camm AJ, Ellinor PT, Gollob M, Hamilton R, et al. HRS/EHRA Expert Consensus Statement on the State of Genetic Testing for the Channelopathies and Cardiomyopathies: This document was developed as a partnership between the Heart Rhythm Society (HRS) and the European Heart Rhythm Association (EHRA). Heart Rhythm. 2011;8:1308–1339. [DOI] [PubMed] [Google Scholar]
- 9.Tester DJ, Will ML, Haglund CM and Ackerman MJ. Compendium of Cardiac Channel Mutations in 541 Consecutive Unrelated Patients Referred for Long QT Syndrome Genetic Testing. Heart Rhythm. 2005;2:507–517. [DOI] [PubMed] [Google Scholar]
- 10.Kupershmidt S, Yang IC, Hayashi K, Wei J, Chanthaphaychith S, Petersen CI, Johns DC, George AL, Roden DM, and Blaser JR. The IKr drug response is modulated by KCR1 in transfected cardiac and noncardiac cell lines. FASEB J. 2003;17:2263–5. [DOI] [PubMed] [Google Scholar]
- 11.Nakajima T, Hayashi K, Viswanathan PC, Kim MY, Anghelescu M, Barksdale KA, Shuai W, Blaser JR, and Kupershmidt S. HERG is protected from pharmacological block by alpha-1,2-glucosyltransferase function. J Biol Chem. 2007;282:5506–13. [DOI] [PubMed] [Google Scholar]
- 12.Hayes HB, Nicolini AM, Arrowood CA, Chvatal SA, Wolfson DW, Cho HC, sullivan DD, Chal J, Fermini B, Clements M, et al. Novel method for action potential measurements from intact cardiac monolayers with multiwell microelectrode array technology. Sci Rep. 2019;9:11893. [DOI] [PMC free article] [PubMed] [Google Scholar]
- 13.Mehta A, Ramachandra CJA, Singh P, Chitre A, Lua CH, Mura M, Crotti L, Wong P, Schwartz PJ, Gnecchi M, et al. Identification of a targeted and testable antiarrhythmic therapy for long-QT syndrome type 2 using a patient-specific cellular model. Eur Heart J. 2017;39:1446–1455. [DOI] [PubMed] [Google Scholar]
- 14.O’Hare BJ, Kim CSJ, Hamrick SK, Ye D, Tester DJ and Ackerman MJ. Promise and Potential Peril With Lumacaftor for the Trafficking Defective Type 2 Long-QT Syndrome-Causative Variants, p.G604S, p.N633S, and p.R685P, Using Patient-Specific Re-Engineered Cardiomyocytes. Circ Genom Precis Med. 2020;13:466–475. [DOI] [PubMed] [Google Scholar]
- 15.Schwartz PJ, Gnecchi M, Dagradi F, Castelletti S, Parati G, Spazzolini C, Sala L, and Crotti L. From patient-specific induced pluripotent stem cells to clinical translation in long QT syndrome Type 2. Eur Heart J. 2019;40:1832–1836. [DOI] [PubMed] [Google Scholar]
- 16.Anderson CL, Kuzmicki CE, Childs RR, Hintz CJ, Delisle BP and January CT. Large-scale mutational analysis of Kv11.1 reveals molecular insights into type 2 long QT syndrome. Nature Commun. 2014;5:5535–5535. [DOI] [PMC free article] [PubMed] [Google Scholar]
- 17.Giudicessi JR, Wilde AAM and Ackerman MJ. The genetic architecture of long QT syndrome: A critical reappraisal. Trends Cardiovasc Med. 2018;28:453–464. [DOI] [PMC free article] [PubMed] [Google Scholar]
- 18.Vandenberg JI, Perry MD, Perrin MJ, Mann SA, Ke Y and Hill AP. hERG K(+) channels: structure, function, and clinical significance. Physiol Rev. 2012;92:1393–478. [DOI] [PubMed] [Google Scholar]
- 19.Petersen CI, McFarland TR, Stepanovic SZ, Yang P, Reiner DJ, Hayashi K, George AL, Roden DM, Thomas JH, and Blaser JR. In vivo identification of genes that modify ether-a-go-go-related gene activity in Caenorhabditis elegans may also affect human cardiac arrhythmia. Proc Natl Acad Sci U S A. 2004;101:11773–8. [DOI] [PMC free article] [PubMed] [Google Scholar]
- 20.Hayashi K, Fujino N, Ino H, Uchiyama K, Sakata K, Konno T, Masuta E, Funada A, Skamoto Y, Tsubokawa T, et al. A KCR1 variant implicated in susceptibility to the long QT syndrome. J Mol Cell Cardiol. 2011;50:50–7. [DOI] [PubMed] [Google Scholar]
- 21.Loporcaro CG, Tester DJ, Maleszewski JJ, Kruisselbrink T and Ackerman MJ. Confirmation of cause and manner of death via a comprehensive cardiac autopsy including whole exome next-generation sequencing. Arch Pathol Lab Med. 2014;138:1083–1089. [DOI] [PubMed] [Google Scholar]
- 22.Shehab O, Tester DJ, Ackerman NC, Cowchock FS and Ackerman MJ. Whole genome sequencing identifies etiology of recurrent male intrauterine fetal death. Prenatal Diag. 2017;37:1040–1045. [DOI] [PubMed] [Google Scholar]
- 23.Bagnall RD, Ingles J, Dinger ME, Cowley MJ, Ross SB, Minoche AE, Lal S, Turner C, Colley A, Rajaopalan S, et al. Whole genome sequencing improves outcomes of genetic testing in patients with hypertrophic cardiomyopathy. J Am Coll Cardiol. 2018;72:419–429. [DOI] [PubMed] [Google Scholar]
- 24.Whiffin N, Minikel E, Walsh R, O’Donnell-Luria AH, Karczewski K, Ing AY, Barton PJR, Funke B, Cook SA, MacArthur D, et al. Using high-resolution variant frequencies to empower clinical genome interpretation. Genet Med. 2017;19:1151–1158. [DOI] [PMC free article] [PubMed] [Google Scholar]
Associated Data
This section collects any data citations, data availability statements, or supplementary materials included in this article.


