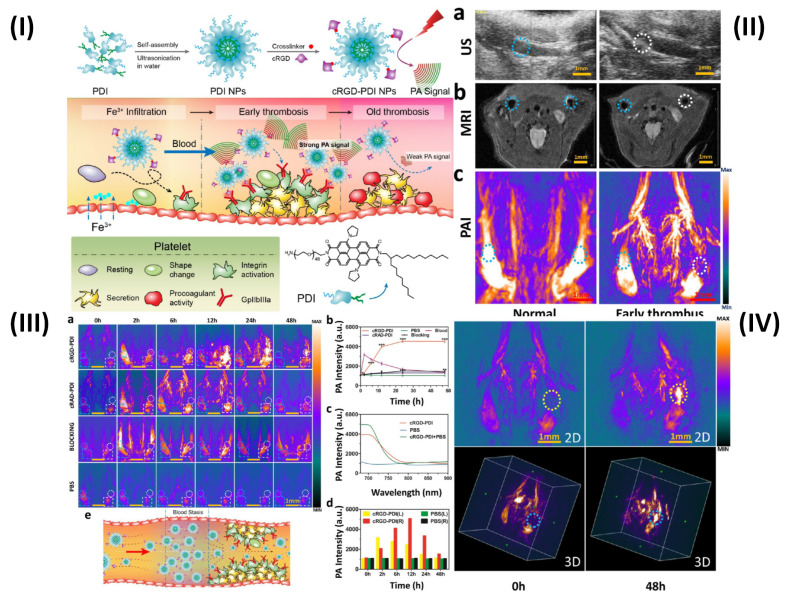
Figure 5.
(I) Schematic illustration of the preparation of cRGD-PDI NPs and process for reducing early thrombus explicitly through PAI; (II) US, MRI, and PAI showing in vivo identification of early thrombus; (III) In vivo PA detection of early thrombus; (IV) Early thrombus PAI (area encircled by the yellow and blue dotted lines in the 2D image and 3D image, respectively) 0 hours and 48 hours following the injection of cRGD-PDI NPs. Reproduced with permission from ref. 73. Fig. 1, Fig. 5, Fig. 6 and Fig. 7 (ACS Publications).

