Abstract
Objective: Amnestic mild cognitive impairment (MCI) is highly predictive of Alzheimer’s disease but the pace of deterioration varies across patients. We hypothesize that magnetic resonance spectroscopy (MRS) could be a useful surrogate marker to monitor progression of cognitive impairment in patients with amnestic MCI. Methods. A cohort of patients with amnestic MCI underwent single-voxel 1H-MRS at baseline and at 2-year follow-up. We included 16 patients who converted to dementia of Alzheimer type and other 16 who did not. Changes in cognitive function were compared with the changes in the metabolite levels assessed in vivo. Results. At baseline the converters had lower mean N-acetyl-aspartate (NAA)/creatine (Cr) ratios in the posteromedial parietal cortex (1.41) than nonconverters (1.47). Most patients tended to lose points in the Mini-Mental test after 2-year follow-up in parallel with decreases in NAA levels (r = .53; P = .002) in the posteromedial parietal cortex as well. The converters showed significant decreases in NAA levels and Cr ratios, whereas the nonconverters did not (P = .001 and .02, respectively) in this area. Conclusion. We conclude that MRS is a technique sensitive enough to monitor cognitive changes and progression to dementia in patients with amnestic MCI.
Keywords: mild cognitive impairment, magnetic resonance spectroscopy
Introduction
Amnestic mild cognitive impairment (MCI) is a common condition in the elderly individuals mainly characterized by memory loss. Although there may be other subtle decline in other functions, however the general cognitive function and daily living activities are preserved. 1 The annual rate of conversion to dementia is around 12%, in general to Alzheimer type dementia.
Magnetic resonance spectroscopy (MRS) makes it possible to analyze the chemical composition of living tissues. Hydrogen is the element most frequently studied, and N-acetyl-aspartate (NAA), creatine (Cr), choline compounds (Ch), and myo-inositol (mI) are the metabolites most frequently explored. 2 Several cross-sectional studies with MRS found decreased NAA/Cr ratios and increased mI/Cr ratios in patients with Alzheimer’s disease (AD) in comparison with controls 3 -8 but also decreased NAA/Cr ratios in MCI. 3 -5
Longitudinal studies with MRS are scarce. There are studies aimed at predicting conversion to dementia on the basis of the metabolite levels found at baseline, with positive results. 9 -13 However, longitudinal studies with repeated measurements are still more scarce. A longitudinal study suggests that metabolite ratios obtained with MRS may be useful markers of disease progression in AD as the NAA/Cr ratios tend to decline across the time. 14 In a small cohort of MCI (15) patients and controls (12), the ratios of NAA/Cr in the parietal lobe decreased longitudinally more in patients who converted to dementia than in nonconverters. 15
The purpose of this study is to investigate whether the changes in metabolite levels and ratios to creatine are consistent with cognitive decline and the development of dementia in amnestic-MCI patients over time. We hypothesize that MRS could be a good marker of cognitive deterioration in amnestic-MCI patients.
Patients and Methods
A consecutive sample of 32 patients with amnestic MCI from a published cohort of 71 patients with MCI 11 who underwent a MRS and clinical examination at baseline were included in a longitudinal study for a second MRS. The design was prospective cohort. The sample was balanced with regard to the number of patients who converted to dementia of probable Alzheimer type (n = 16; 11 were female) and those who did not (n = 16; 10 were female) within that period of time. We carried out the second scan in only 32 patients because it was not possible in the whole cohort. The patients were recruited for the second scan in a consecutive manner in each group to complete a number of 16 in the same order that were recruited at baseline. Conversion to dementia of probable Alzheimer type was based on the criteria of the NINCDS-ADRDA group. 16
At baseline, the patients underwent neuropsychological analysis encompassing Mini-Mental test (Spanish version with a maximum possible score of 35 points), Blessed Dementia Rating scale, clock drawing test, Geriatric Depression scale (GDS), Memory Impairment Screen test, and the Rey Auditory Verbal Learning test (RAVLT) delayed recall.
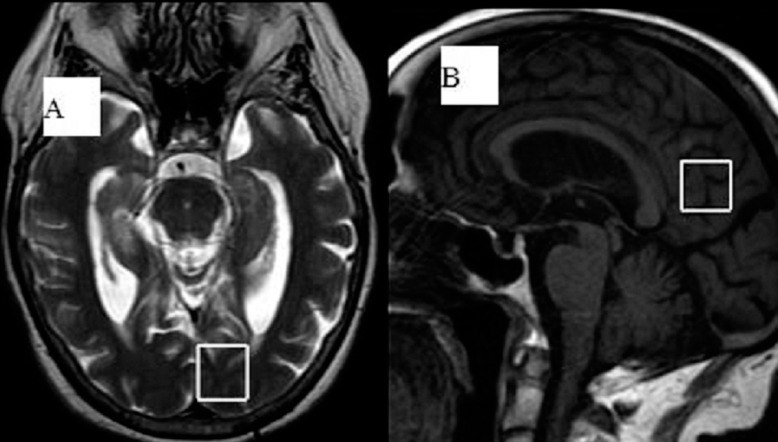
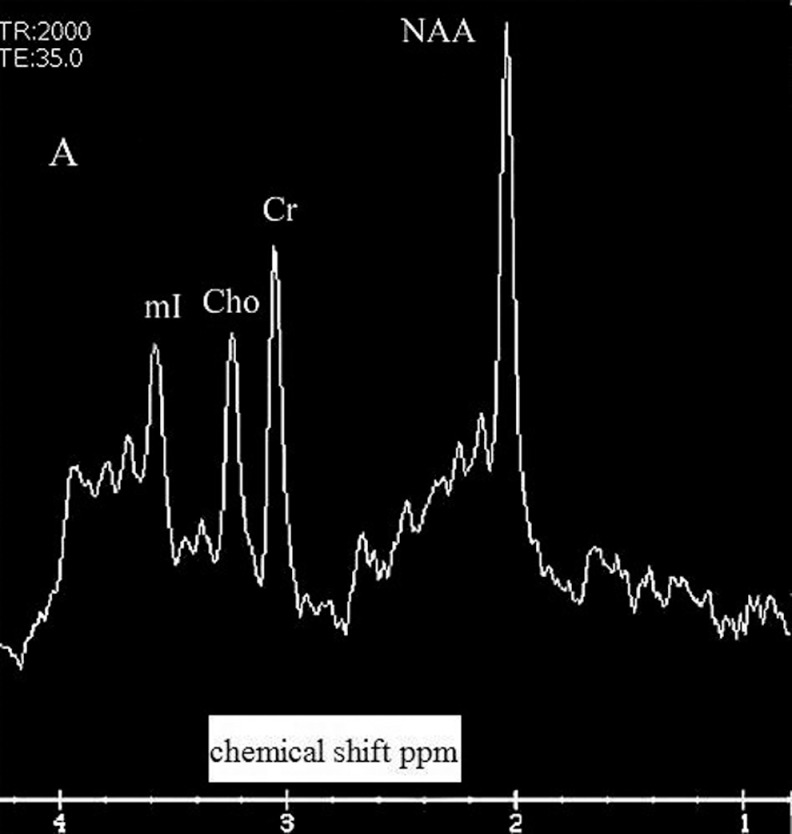
All of them underwent 1 H-MRS in the posterior areas of the brain (posteromedial parietal cortex and medial occipital cortex) at baseline and after a mean follow-up of 2 years. Data were acquired using a 1.5 T Signa HD clinical scanner (GE Healthcare Diagnostic Imaging, Milwaukee, Wisconsin). All images were acquired using an 8-channel phased-array head coil (NVHEAD A). Magnetic resonance imaging (MRI) was carried out as follows. A midsagital T1-weighted image (repetition time [TR] = 560 ms, echo time [TE] = 12 ms, 90° flip angle, number of excitations = 1, matrix size = 256 × 160, field of view = 24 cm × 24 cm, slice thickness/gap = 5/0 mm) was obtained to locate a 2 × 2 × 2 cm voxel in the posteromedial parietal cortex (including the right and left posterior cingulate cortex and inferior precuneus). To locate the medial occipital lobe, we used an axial T2-weighted image (Figure 1 ). 1H-MRS was carried out by means of a short TE of 35 ms and a TR of 2000 ms and 128 accumulations using a single-voxel with a spin echo technique that uses selective excitation with gradient spoiling for water suppression. The mode of spectral acquisition was PROBE-PRESS technique (Proton Brain Spectroscopy-Point Resolved Spectroscopy). For the quantification of absolute concentrations of brain metabolites we used the user-independent frequency domain–fitting program (Signa HD, GE software release 12.x) by applying an eddy current correction and using internal water signal reference to calculate absolute metabolite concentrations. Absolute metabolite values were only considered when the Cramer-Rao lower bound was below 20%, thus indicating that these metabolites could be reliably estimated. Levels of NAA are not corrected for contributions by cerebrospinal fluid (CSF) and a small reduction in the numerical values by residual T1 and T2 relaxation effects. We also obtained the ratios of the peak amplitude of the metabolites relative to creatine. Figure 2 shows an example of spectrum with the metabolite peaks.
Figure 1.
T2-weighted axial image in the left medial occipital lobe (A), and Sagittal T1-weighted MRI with the voxel placed in the bilateral posteromedial parietal cortex (posterior cingulate gyrus and inferior precuneus) (B).
Figure 2.
Example of spectrum with the following peaks: NAA indicates N-acetyl-aspartate; Cr, creatine; Ch, choline compounds; mI, myo-inositol; Ppm, parts per million.
The neuropsychological examination was performed prior to obtaining the MRS scans at baseline and after follow-up.
Statistical Analysis
T test for paired data was used to analyze the differences between baseline and after follow-up metabolite values in the whole cohort of patients, and separately for converters and nonconverters. T test for independent samples was used to see whether the variations in metabolite levels (baseline/after follow-up) were different for converters and nonconverters. Pearson coefficient correlation was used to assess the relationship between changes in metabolite levels and ratios and changes in cognitive function.
Written consent was obtained from both patients and caregivers at the beginning of the study and at the moment of the second scan. This project was approved by our regional ethical committee.
Results
The cohort was composed of 32 patients with amnestic MCI who were followed for a mean period of 2 years (standard deviation [SD]: 6.7 months). The mean age of the cohort was 74.6 years (SD: 5.92), and 21 were female. The mean age for converters (75.75; SD: 6.55) and nonconverters (74; SD: 5.29) was similar. There were 11 women in the group of converters and 10 in the group of nonconverters. The mean baseline score for Mini-Mental test was 28.8 points (SD: 2.6); for converters it was 27.7 (SD: 2.4) and 29.9 (SD: 2.4) for nonconverters. The mean score in the RAVLT delayed recall was 3.5 (SD: 1.3) for nonconverters in comparison with 2.3 (SD: 1.2) for converters, which was significant in the t test (P = .01).
After 2-year follow-up, we observed a mean decline in the Mini-Mental test of 4.6 points in the converters in comparison with 0.68 points in nonconverters (t = −6.94; P = .001).
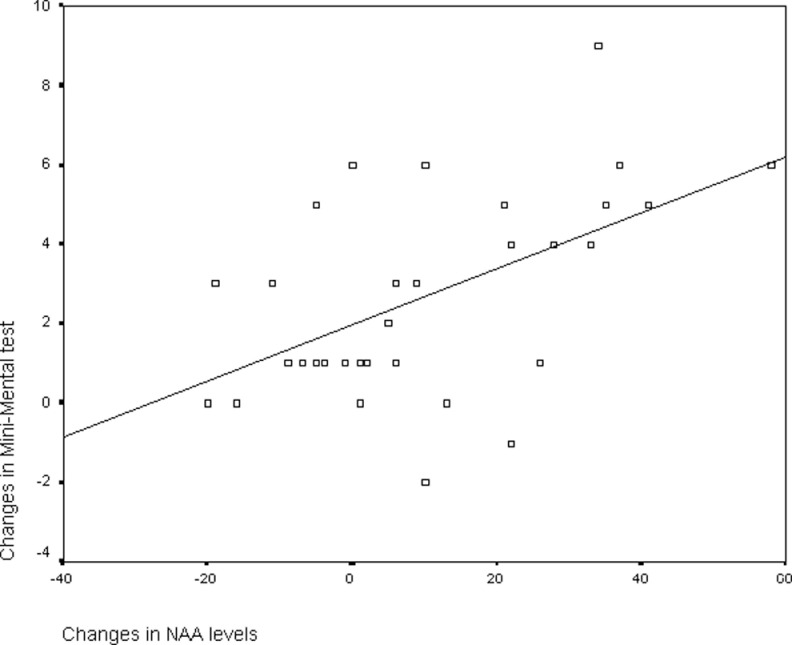
We evaluated the relationship between changes in the global cognitive function measured with the Mini-Mental test and changes in metabolite levels in the entire sample of 32 patients. We found a significant correlation between the changes in the absolute NAA levels in the posteromedial parietal cortex (r = .53; P = .002), and in the NAA/Cr ratios as well (r = .35; P = .05). Figure 3 depicts the scatter plot for correlation between changes in Mini-Mental test and changes in NAA levels in the posteromedial cortex. However, we did not see such a correlation in the occipital lobe.
Figure 3.
Scatter plot representing the correlation between changes in NAA levels and changes in Mini-Mental test in the posteromedial parietal cortex. Negative numbers mean improvement.
In the global cohort, there was significant decrease in the absolute NAA levels in both areas with small changes in the creatine ratios. With regard to Ch and mI levels, the changes were not significant but the trend was toward increases in these metabolites (see Table 1 ). We found significant differences in the baseline NAA/Cr ratios between converters and nonconverters in the posteromedial parietal cortex (see Table 2 ). In the second scan, we also found significant between-group differences in the NAA levels and NAA/Cr ratios in the posteromedial parietal cortex.
Table 1.
Means and SD of Paired Data for the Whole Cohort of Patients With MCI (n = 32) in the Baseline Scan and in the Second Scan
| Variable | Baseline Scan | 2-Year Scan |
|---|---|---|
| NAA occipital | 140.74 (23.58) | 128.13 (26.16) P = .007 |
| NAA/Cr occipital | 1.539 (0.01) | 1.532 (0.01) NS |
| Ch/Cr occipital | 0.58 (0.04) | 0.6 (0.02) NS |
| mI/Cr occipital | 0.59 (0.02) | 0.61 (0.02) NS |
| NAA parietal | 124.58 (19.83) | 114.15 (15.92) P = .05 |
| NAA/Cr parietal | 1.438 (0.01) | 1.42 (0.13) NS |
| Ch/Cr parietal | 0.62 (0.02) | 0.63 (0.02) NS |
| mI/Cr parietal | 0.61 (0.02) | 0.62 (0.01) NS |
Abbreviations: NAA, N-acetyl-aspartate; Cr, creatine; Ch, choline compounds; mI, myo-inositol; NS, not significant.
Table 2.
Metabolite Values (Means and SD) in the First and Second Scan for Converters and Nonconverters Separately
| Non-Converters (n = 16) | Converters (n = 16) | |||
|---|---|---|---|---|
| Variable | Baseline Scan | 2-Year Scan | Baseline Scan | 2-Year Scan |
| NAA occipital | 147.2 (14.88) | 129.75 (22.53) | 136.94 (25.83) | 126.4 (30.27) |
| NAA/Cr occipit | 1.55 (0.01) | 1.55 (0.02) | 1.52 (0.02) | 1.51 8 (0.01) |
| NAA parietal | 121.38 (15.97) | 122.44 (13.51) a | 122 (23.35) | 105.33 (13.64) |
| NAA/Cr parietal | 1.47 (0.02)* | 1.49 (0.1)a | 1.41 (0.1) | 1.35 (0.11) |
Abbreviations: NAA, N-acetyl-aspartate; Cr, creatine; SD, standard deviation.
a There are significant differences between converters and nonconverters in the baseline scan, and in the second scan values separately.
We did not see significant differences in metabolite decline for converters and nonconverters in the occipital lobe although there was a trend for greater decreases in metabolite levels in converters. However, the levels of converters declined markedly in the posteromedial parietal cortex (see Table 3 ). The NAA did not decrease in nonconverters, whereas it occurred in the converters (21 point mean decrease vs no decrease in nonconverters; t = −4.27; P < .001). The same occurred in the NAA/Cr ratios which decreased 0.06 in the converters versus no decrease in nonconverters (t = −2.44; P = .02.
Table 3.
Differences Between the Baseline and Second Scan for Converters and Nonconverters
| Mean Changes (First–Second Scan Values) | ||
|---|---|---|
| Variable | Nonconverters | Converters |
| NAA occipital | 13.56 (27.5) | 12.5 (20.99) NS |
| NAA/Cr occipital | 0.001 (0.002) | 0.14 (0.1) NS |
| NAA parietal | −1.06 (11.68) | 21.25 (18.88) P < .001 |
| NAA/Cr parietal | −0.023 (0.01) | 0.06 (0.11) P = .02 |
Abbreviations: NAA, N-acetyl-aspartate; Cr, creatine; NS, not significant.
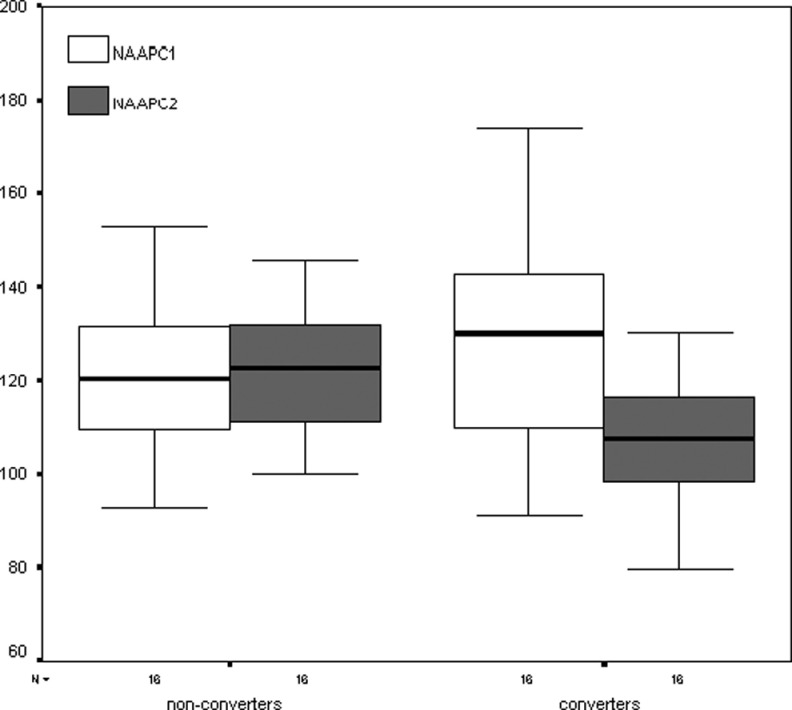
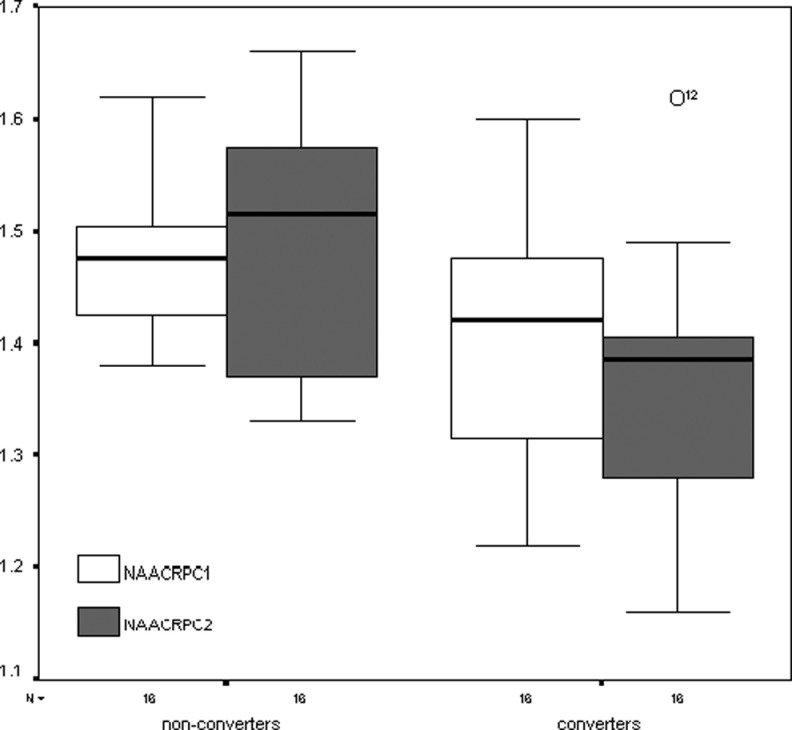
In Figures 4 and 5 are presented the box plots representing the ordinal values of the metabolites and ratios (medians, 50% central intervals and 95% intervals) in the posteromedial parietal cortex. It is evident from the figures that the values declined only in converters.
Figure 4.
Box plots representing the ordinal values of the NAA levels for converters and nonconverters in the posteromedial parietal cortex at baseline and after 2 years. First scan values are represented in white; second scan values are depicted in gray. The numbers on the ordinate represent the absolute NAA levels. NAA indicates N-acetyl-aspartate.
Figure 5.
Box plots of the NAA/Cr ratios for converters and nonconverters in the posteromedial parietal cortex at baseline and after 2 years. The numbers on the ordinate indicate the ratios to creatine. NAA indicates N-acetyl-aspartate; Cr, creatine.
Discussion
In our study, we have found that baseline NAA levels and Cr ratios are lower in amnestic MCI at high risk of early conversion to AD, and that converters showed greater decline in cognitive function and NAA levels in comparison with nonconverters. These findings are consistent with previous longitudinal reports in MCI in which the NAA levels are lower at baseline in converters and decrease over time in a greater pace than in nonconverters. 9 -15 However, in another cohort a high proportion of MCI patients showed NAA decreases after 1-year follow-up but the MRS changes and cognitive changes did not differ from those found in normal aging. 17 The lack of significant changes may be due to the short period of follow-up.
There are several reasons to use MRS as biomarker. Magnetic resonance spectroscopy has been demonstrated to be sensitive to changes in brain pathology of AD as the NAA levels correlated inversely with the number of neuritic plaques. 18 The NAA/Cr ratios correlated with the pathological stages of AD19 in a sample of 54 patients. So it has been used as a marker of disease progression. There are several published trials including patients treated with cholinesterase inhibitors or mematine in which MRS was carried out before and after treatment. 20 -26 In general, the lack of significant changes in metabolite levels was consistent with the modest effects of the drugs in the trials. A more recent longitudinal study including 42 patients with AD and 22 controls that underwent 6 MRS studies within an elapse of time of 2 years showed that there is a progressive decline in the NAA/Cr ratios regardless of treatment with cholinesterase inhibitors, which reflects the lack of efficacy of these drugs. 27
The use of biomarkers in MCI is not only of help for detecting early conversion to AD but also to monitor progression of cognitive impairment because of 2 reasons: (a) the sample needed to see the effect of a drug may be smaller than that needed when no biomarker is used 23 , 26 ; (b) the biomarkers may correlate with brain pathology before the clinical symptoms are present, and this is the case of MRS which showed alterations in familial AD years before the onset of symptoms. 28 , 29
In this study the NAA/Cr ratios at baseline are predictive of early conversion to dementia in the posteromedial parietal cortex, and decline in this ratio is associated with cognitive deterioration and conversion to dementia as well. Although our cohort is not large enough to draw definitive conclusions, the NAA/Cr ratio has proven to be a valid marker of brain pathology in AD on the basis of previous reports 18 , 19 and test–retest reliability studies. 26 , 30 In addition, MRS is a noninvasive technique more widely available and cheaper than other biomarkers such as positron emission tomography (PET).
The voxel positioned in the posteromedial parietal cortex included the posterior cingulate gyrus, an area involved in early phases of AD according to PET studies. 31–33 This area is frequently explored in MRS studies and plays a pivotal role in memory as it is a part of the default mode network. The medial temporal lobe and prefrontal subsystems tend to converge in the posterior cingulate gyrus. 34 Glutamate levels have been studied on fewer occasions in MCI and AD. We previously demonstrated that glutamate levels are lower in AD and MCI than in healthy controls in the posterior cingulate gyrus. 35
Of course, there are also some caveats that can influence the metabolite measurements like inhomogeneity of the magnetic field, contamination by CSF and artifacts. 2 Unfortunately we do not have the appropriate software to adjust metabolite concentration for atrophy and the presence of CSF, but the systematic errors may be lessened with the comparison with a control group (the group of nonconverters) and with the use of the Cr ratios.
In conclusion, MRS is a reliable marker of cognitive decline and transition from MCI to AD, and but the potential applications need to be better underlined with larger cohorts.
Footnotes
The authors declared no potential conflicts of interest with respect to the research, authorship, and/or publication of this article.
The authors disclosed the receipt of the following financial support for the research, authorship, and/or publication of this article: This work was supported by a grant from the Instituto Aragones de Ciencias de la Salud. The Grant number is P08/100.
References
- 1. Petersen RC, Smith GE, Waring SC, Ivnik RJ, Tangalos EG, Kokmen E. Mild cognitive impairment. Clinical characterization and outcome. Arch Neurol. 1999;56(3):303–308. [DOI] [PubMed] [Google Scholar]
- 2. Fayed N, Olmos S, Morales H, Modrego PJ. Physical basis of magnetic resonance spectroscopy and its application to central nervous system diseases. Am J Appl Sci. 2006;3:1836–1845. [Google Scholar]
- 3. Kantarci K, Petersen RC, Boeve BF, et al. 1H MR spectroscopy in common dementias. Neurology. 2004;63(8):1393–1398. [DOI] [PMC free article] [PubMed] [Google Scholar]
- 4. Kantarci K, Jack CR, Xu YC, et al. Regional metabolic patterns in mild cognitive impairment and Alzheimer’s disease. Neurology. 2000;55(2):210–217. [DOI] [PMC free article] [PubMed] [Google Scholar]
- 5. Kantarci K, Xu YC, Shiung MM, et al. Comparative diagnostic utility of different MR modalities in mild cognitive impairment and Alzheimer’s disease. Dement Geriatr Cogn Disord. 2002;14(4):198–207. [DOI] [PMC free article] [PubMed] [Google Scholar]
- 6. Hancu I, Zimmerman EA, Sailasuta N, Hurd RE. H MR spectroscopy using TE averaged PRESS: a more sensitive technique to detect neurodegeneration associated with Alzheimer’s disease. Magn Reson Med. 2005;53(4):777–782. [DOI] [PubMed] [Google Scholar]
- 7. Miller BL, Moats RA, Shonk T, Earnst E, Wooley S, Ross BD. Alzheimer’s disease: depiction of increased cerebral myoinositol with proton MR spectroscopy. Radiology. 1993;187(2):433–437. [DOI] [PubMed] [Google Scholar]
- 8. Shonk TK, Moats RA, Gifford P, et al. Probable Alzheimer disease: diagnosis with proton MR spectroscopy. Radiology. 1995;195(1):65–72. [DOI] [PubMed] [Google Scholar]
- 9. Modrego PJ, Fayed N, Pina MA. Conversión from mild cognitive impairment to probable Alzheimer’s disease predicted by brain magnetic resonance spectroscopy. Am J Psychiatry. 2005;162(4):667–675. [DOI] [PubMed] [Google Scholar]
- 10. Fayed N, Davila J, Oliveros A, castillo J, Medrano JJ. Utility of different MR modalities in mild cognitive impairment and its use as a predictor of conversión to probable dementia. Acad Radiol. 2008;15(9):1089–1098. [DOI] [PubMed] [Google Scholar]
- 11. Modrego PJ, Fayed N, Sarasa M. Magnetic resonance spectroscopy in the prediction of early conversion from amnestic Mild Cognitive Impairment to dementia. BMJ Open. 2011;1(1):e000007. doi:10.1136/bmjopen-2010-000007 [DOI] [PMC free article] [PubMed] [Google Scholar]
- 12. Metastasio A, Rinaldi P, Tarducci R, et al. Conversión of MCI to dementia: role of proton magnetic resonance spectroscopy. Neurobiol Aging. 2006;27(7):926–932. [DOI] [PubMed] [Google Scholar]
- 13. Kantarci K, Weigand SD, Przybelski SA, et al. Risk of dementia in MCI. Combined effect of cerebrovascular disease, volumetric MRI, and H MRS. Neurology. 2009;72(17):1519–1525. [DOI] [PMC free article] [PubMed] [Google Scholar]
- 14. Kantarci K, Weigand SD, Petersen RC, et al. Longitudinal H MRS changes in mild cognitive impairment and Alzheimer’s disease. Neurobiol Aging. 2007;28(9):1330–1339. [DOI] [PMC free article] [PubMed] [Google Scholar]
- 15. Pilatus U, Lais C, Rochmont Adu M, et al. Conversion to dementia in mild cognitive impairment is associated with decline of N-acetylaspartate and creatine as revealed by magnetic resonance spectroscopy. Psychiatry Res. 2009;173(1):1–7. [DOI] [PubMed] [Google Scholar]
- 16. McKhan G, Drachman D, Folstein M, Katzman R, Price D, Stadlan EM. Clinical diagnosis of Alzheimer’s disease: report of the NINCDS-ADRDA work group. Neurology. 1984;34(7):939–944. [DOI] [PubMed] [Google Scholar]
- 17. Barnik Olson B, Holshouser B, Britt W, et al. Longitudinal metabolic and cognitive changes in mild cognitive impairment patients. Alzheimers Dis Assoc Disord. 2008;22(3):269–277. [DOI] [PubMed] [Google Scholar]
- 18. Klunk WE, Panchalingam K, Moossy J, McClure RJ, Pettegrew JW. N-acetyl-L-aspartate and other amino acid metabolites in Alzheime’s disease brain: a preliminary proton nuclear magnetic resonance study. Neurology. 1992;42(8):1578–1585. [DOI] [PubMed] [Google Scholar]
- 19. Kantarci K, Knopman DS, Dickson DW, et al. Alzheimer disease: postmortem neuropathologic correlates of antemortem 1-H MR spectroscopy metabolite measurements. Radiology. 2008;248(1):210–220. [DOI] [PMC free article] [PubMed] [Google Scholar]
- 20. Satlin A, Bodick N, Offen WW, Renshaw PF. Brain proton magnetic resonance spectroscopy (1H-MRS) in Alzheimer’s disease: changes after treatment with xanomeline, an M1 selective cholinergic agonist. Am J Psychiatry. 1997;154(10):1459–1461. [DOI] [PubMed] [Google Scholar]
- 21. Frederick B, Satlin A, Wald LL, Hennen J, Bodick N, Renshaw PF. Brain proton magnetic resonance spectroscopy in Alzheimer disease: changes after treatment with xanomeline. Am J Geriatr Psychiatry. 2002;10(1):81–88. [PubMed] [Google Scholar]
- 22. Krishnan RR, Charles HC, Doraiswamy PM, et al. Randomized, placebo-controlled trial of the effects of donepezil on neuronal markers and hippocampal volumes in Alzheimer disease. Am J Psychiatry. 2003;160(11):2003–2011. [DOI] [PubMed] [Google Scholar]
- 23. Modrego PJ, Pina MA, Fayed N, Díaz M. Changes in metabolite ratios after treatment with rivastigmine in Alzheimer’s disease: a nonrandomized controlled trial with magnetic resonance spectroscopy. CNS Drugs. 2006;20(10):867–877. [DOI] [PubMed] [Google Scholar]
- 24. Jessen F, Traeber F, Freymann K, Maier W, Schild HH, Block W. Treatment monitoring and response prediction with proton MR spectroscopy in AD. Neurology. 2006;67(3):528–530. [DOI] [PubMed] [Google Scholar]
- 25. Bartha R, Smith M, Rupsingh R, Rylett J, Wells JL, Borrie MJ. High field H MRS of the hippocampus after donepezil treatment in Alzheimer disease. Prog Neuropsychopharmacol Biol Psychiatry. 2008;32(3);786–793. [DOI] [PubMed] [Google Scholar]
- 26. Modrego PJ, Fayed N, Errea JM, Rios C, Pina MA, Sarasa M. Memantine versus donepezil in mild to moderate Alzheimer’s disease: a randomized trial with magnetic resonance spectroscopy. Eur J Neurol. 2010;17(3):405–412. [DOI] [PubMed] [Google Scholar]
- 27. Schott JM, Frost C, Macmanus DG, Ibrahim F, Waldman AD, Fox ND. Short echo time proton magnetic resonance spectroscopy in Alzheimer’s disease: a longitudinal multiple time point study. Brain. 2010;133(11):3315–3322. [DOI] [PMC free article] [PubMed] [Google Scholar]
- 28. Godbolt AK, Waldman AD, MacManus DG, Schott JM, Frost C, Cipolotti L. MRS shows abnormalities before symptoms in familial Alzheimer disease. Neurology. 2006;66(5):718–722. [DOI] [PubMed] [Google Scholar]
- 29. Kantarci K, Boeve BF, Wszolek Z, et al. MRS in presymptomatic MAPT mutation carriers. Neurology. 2010:75(9):771–778. [DOI] [PMC free article] [PubMed] [Google Scholar]
- 30. Fayed N, Modrego PJ, Medrano J. Comparative test-retest reliability of metabolite values assessed with Magnetic Resonance Spectroscopy of the brain. The LCModel versus the manufacturer software. Neurol Res. 2009;31(5):472–477. [DOI] [PubMed] [Google Scholar]
- 31. Alexander GE, Chen K, Pietrini P, Rapoport SI, Reiman EM. Longitudinal PET evaluation of cerebral metabolic decline in dementia: a potential outcome measure in Alzheimer’s disease treatment studies. Am J Psychiatry. 2002;159(5):738–745. [DOI] [PubMed] [Google Scholar]
- 32. Small GW, Kepe V, Ercoli LM, et al. PET of brain amyloid and tau in mild cognitive impairment. New Engl J Med. 2006;355(25):2652–2663. [DOI] [PubMed] [Google Scholar]
- 33. Hunt A, Schonknecht P, Henze M, Seidl U, Haberkorn U, Schröder J. Reduced cerebral glucose metabolism in patients at risk for Alzheimer’s disease. Psychiatry Res. 2007;155(2):147–154. [DOI] [PubMed] [Google Scholar]
- 34. Buckner RL, Andrews-Hanna JR, Schacter DL. The brain’s default network: anatomy, function, and relevance to disease. Ann N Y Acad Sci. 2008;1124:1–38. [DOI] [PubMed] [Google Scholar]
- 35. Fayed N, Modrego PJ, Rojas-salinas G, Aguilar K. Brain glutamate leves are decreased in Alzheimer’s disease. A Magnetic Resonance Spectroscopy study. Am J Alzheimers Dis Other Demen. 2011;26:450-456. [DOI] [PMC free article] [PubMed] [Google Scholar]


