

ABSTRACT
A wide range of animal species show variable susceptibility to SARS-CoV-2; however, host factors associated with varied susceptibility remain to be defined. Here, we examined whether susceptibility to SARS-CoV-2 and virus tropism in different animal species are dependent on the expression and distribution of the virus receptor angiotensin-converting enzyme 2 (ACE2) and the host cell factor transmembrane serine protease 2 (TMPRSS2). We cataloged the upper and lower respiratory tract of multiple animal species and humans in a tissue-specific manner and quantitatively evaluated the distribution and abundance of ACE2 and TMPRSS2 mRNA in situ. Our results show that: (i) ACE2 and TMPRSS2 mRNA are abundant in the conduction portion of the respiratory tract, (ii) ACE2 mRNA occurs at a lower abundance compared to TMPRSS2 mRNA, (iii) co-expression of ACE2-TMPRSS2 mRNAs is highest in those species with the highest susceptibility to SARS-CoV-2 infection (i.e., cats, Syrian hamsters, and white-tailed deer), and (iv) expression of ACE2 and TMPRSS2 mRNA was not altered following SARS-CoV-2 infection. Our results demonstrate that while specific regions of the respiratory tract are enriched in ACE2 and TMPRSS2 mRNAs in different animal species, this is only a partial determinant of susceptibility to SARS-CoV-2 infection.
IMPORTANCE
SARS-CoV-2 infects a wide array of domestic and wild animals, raising concerns regarding its evolutionary dynamics in animals and potential for spillback transmission of emerging variants to humans. Hence, SARS-CoV-2 infection in animals has significant public health relevance. Host factors determining animal susceptibility to SARS-CoV-2 are vastly unknown, and their characterization is critical to further understand susceptibility and viral dynamics in animal populations and anticipate potential spillback transmission. Here, we quantitatively assessed the distribution and abundance of the two most important host factors, angiotensin-converting enzyme 2 and transmembrane serine protease 2, in the respiratory tract of various animal species and humans. Our results demonstrate that while specific regions of the respiratory tract are enriched in these two host factors, they are only partial determinants of susceptibility. Detailed analysis of additional host factors is critical for our understanding of the underlying mechanisms governing viral susceptibility and reservoir hosts.
KEYWORDS: SARS-CoV-2, domestic animal species, ACE2, TMPRSS2, viral pathogenesis, tropism, respiratory tract, airway, in situ hybridization
INTRODUCTION
Coronavirus Disease 2019 (COVID-19) is a highly contagious viral respiratory disease of humans caused by the newly emerged betacoronavirus Severe Acute Respiratory Syndrome Coronavirus-2 (SARS-CoV-2) (1–3). Since its first identification in December 2019, the virus has rapidly spread and genetically evolved resulting in the emergence of multiple variants and variants of interest or concern (VOIs/VOCs) (4–7). SARS-CoV-2 continues to significantly impact public health and the world economy and as of June 2023 has infected more than 767 million people with over 7 million fatalities (~1% death rate) as of June 2023 (8). SARS-CoV-2 is an example of a zoonotic pathogen with a wide range of susceptible animal species that may serve to perpetuate viral evolution with subsequent emergence of novel viral variants with altered host susceptibility (9–12). As of 31 December 2022, the World Organisation for Animal Health (WOAH [OIE]) reported 699 outbreaks in companion animals (dogs and cats), various zoo animals, and farmed or wild wildlife (e.g., mink and white-tailed deer) in 36 countries around the world (13). Experimental infections have demonstrated that non-human primates, hamsters, ferrets, mink, cats, deer mice, and white-tailed deer are highly susceptible animal species, while dogs, sheep, and cattle appear to have limited susceptibility, and pigs and avian species (such as chickens and ducks) are resistant to experimental SARS-CoV-2 infection (14–25). Rabbits, raccoon dogs, fruit bats, and skunks have been shown to be susceptible to experimental infection (26–29). In contrast, wild-type mice [i.e., mice that do not express the human angiotensin-converting enzyme 2 (ACE2)] and rats are not naturally permissive to natural or experimental infection by ancestral, Wuhan-like SARS-CoV-2 strains (30–32). However, SARS-CoV-2 strains, including mouse-adapted strains (e.g., MA10) and various VOCs that carry the N501Y mutation in the viral spike protein are able to infect wild-type mice and rats (32–34). Further research of SARS-CoV-2 infection in various animal species is still needed to refine current animal model systems, identify additional susceptible hosts, and better understand infection dynamics, viral ecology, virulence, pathogenesis, and transmissibility in susceptible animal species. This knowledge is important for assessing risk, implementing mitigation strategies, addressing animal welfare issues, and developing preclinical animal models for evaluating drug and vaccine candidates for COVID-19.
We and others have previously described the susceptibility to experimental infection and transmission dynamics of SARS-CoV-2 in cats (Felis domesticus), pigs (Sus scrofa), white-tailed deer (Odocoileus virginianus), sheep (Ovis aries), and Syrian hamsters (Mesocricetus auratus) (14, 17, 22–24, 35–40). These animal models demonstrated a wide spectrum in terms of disease outcome after infection, ranging from mild to severe disease with efficient transmission and subsequent recovery (e.g., Syrian hamsters), high susceptibility and efficient transmission but with no overt disease (e.g., cats and white-tailed deer), low susceptibility (e.g., sheep), and non-susceptible to experimental infection (e.g., pigs) (17, 22–24, 35, 37). Among the above-listed species and under our experimental conditions, viral tropism is typically restricted to the conductive portion of the respiratory tract with a moderate lesion profile, with occurrence of apparent bronchointerstitial pneumonia only in Syrian hamsters.
SARS-CoV-2 infection is initiated by binding of the receptor binding domain (RBD) of the viral spike (S) protein to the cellular ACE2 receptor, which largely determines viral tropism (41). Viral infection further requires proteolytic cleavage of the S protein for subsequent fusion with cellular membranes, mediated by cellular proteases, the most common of which is transmembrane serine protease 2 (TMPRSS2) and is expressed in epithelial cells of the respiratory tract. Previous in silico studies have evaluated the likelihood of the RBD-ACE2 interaction and predicted susceptibility of different species to SARS-CoV-2 (42). While differences in susceptibility are governed by the ability of the RBD to bind to ACE2, differences in viral tropism and distribution within the respiratory tract of different species are likely determined by the distribution and abundance of ACE2 and TMPRSS2 and possibly other cellular proteases; this remains to be explored in susceptible animal species. Single-cell analysis from the human upper and lower respiratory tract has identified a gradual reduction in the expression of ACE2 from the upper (nasal cavity with the highest level of ACE2 expression) to the lower respiratory tract (lungs with the lowest level of ACE2 expression) (43–47). These studies also determined that FOXJ1+ ciliated cells, followed by MUC5B+ club cells within the airways, and alveolar type 2 (AT2) cells lining the alveoli, are among the cell types with the highest level of ACE2 and TMPRSS2 expression in the respiratory tract (43–47). In the transgenic K18-hACE2 mouse model, distribution analysis of human ACE2 (hACE2) expression determined its localization within the olfactory neuroepithelium, bronchiolar epithelium, scattered alveolar type 2 (AT2) cells, and neurons (48). Tmprss2 mRNA is enriched throughout the airway epithelia and sporadically in alveolar type 1 (AT1) and AT2 cells (31). A recent study performed in our laboratory comparing the ancestral, Wuhan-like strain USA-WA1/2020 and its derivative mouse-adapted MA10 strain in K18-hACE2, C57BL/6J, and BALB/c mice, demonstrated a decline in mouse Ace2 rather than hACE2 mRNA transcript abundance following infection (31). In the latter study, a transient downregulation of Tmprss2 was also noted. An additional study in rats has shown a similar distribution of the rat ACE2 and TMPRSS2 proteins within the nasal cavity, trachea, bronchioles, and alveoli (49). Recently, the tissue distribution of the ACE2 receptor has been evaluated via immunohistochemistry (IHC) in the lung and intestine of various animal species including dogs, cats, pigs, rats, several artiodactyls, mustelids, other zoo species and primates, as well as phocids (49–52). These studies have made use of cross-reactive ACE2 antibodies and showed ACE2 expression in bronchiolar epithelia and occasionally AT1 cells, blood vessels, and enterocytes in some but not all species examined. In our experience, the use of cross-reactive antibodies specific for ACE2 has proven to be suboptimal due to the occurrence of high levels of non-specific binding in tissues of different species (Carossino, unpublished). To our knowledge, there is no study to date that has evaluated the distribution of both the ACE2 and TMPRSS2 proteins simultaneously in different animal species or one that quantitatively evaluates the species-specific expression of ACE2 and TMPRSS2 at the tissue level. The identification of specific cell types that can be infected by SARS-CoV-2 due to the expression of specific virus host entry factors is critical for further understanding of SARS-CoV-2 tropism, pathogenesis, and variation in animal susceptibility. Thus, we hypothesized that differences in susceptibility to SARS-CoV-2 and viral tropism could be dependent on the distribution and abundance of ACE2 and TMPRSS2 in the respiratory tract of different animal species and humans. We therefore analyzed the distribution, abundance, and cellular expression of species-specific ACE2 and TMPRSS2 mRNA within the respiratory tract of various animal species via duplex in situ hybridization and compared these to viral antigen distribution following experimental infection. This is the first study to comprehensively characterize the distribution and abundance of these two critical host factors associated with SARS-CoV-2 infection in different animal species. The results obtained here are of significance for our understanding of SARS-CoV-2 pathogenesis and infection dynamics in various animal species, some of which are important preclinical animal models for testing vaccines and antivirals and/or may play a role in viral evolution.
RESULTS
SARS-CoV-2 tropism differs between animal species
We comparatively evaluated tissue and cellular tropism of SARS-CoV-2 in cats, pigs, sheep, white-tailed deer, and hamsters using IHC for the SARS-CoV-2 nucleocapsid protein (Fig. 1). In cats, viral nucleocapsid antigen was solely restricted to tracheal and bronchial glands as well as individualized or segmental regions of the nasal epithelium (NE) and olfactory neuroepithelium (ONE) within the nasal passages; it was most abundant at 4 days post-infection (dpi; Fig. 1A through C) with antigen located within the cytoplasm. Hamsters were the most permissive species to SARS-CoV-2 infection, with widespread detection of viral intracytoplasmic antigen at 3 dpi including the NE, ONE, bronchiolar epithelium, and pneumocytes in the lungs (Fig. 1D through F). In white-tailed deer, SARS-CoV-2 antigen was restricted to segmental regions of the respiratory epithelium along the trachea and bronchi at 4 dpi (Fig. 1G and H) and rarely within the tonsillar epithelium. In contrast, viral antigen in sheep was limited to the cytoplasm of antigen-presenting cells along tracheal proprial lymphocytic aggregates (Fig. 1I) and small amounts in antigen-presenting cells located within regional lymph nodes, with no viral antigen detected in upper or lower respiratory epithelia. Finally, there was no viral antigen detected in respiratory tissues of the experimentally SARS-CoV-2-infected pigs examined; therefore, they are considered not to be susceptible to experimental SARS-CoV-2 infection (data not shown) (24).
Fig 1.

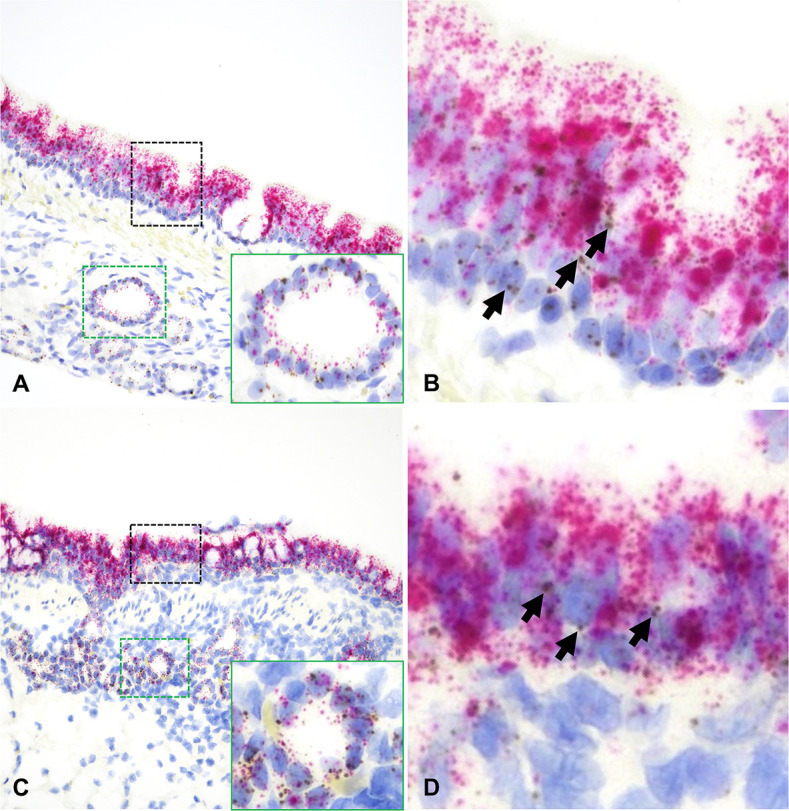
Comparative SARS-CoV-2 antigen distribution in the respiratory tract of animal species susceptible to experimental intranasal infection. In cats (A–C), SARS-CoV-2 has a specific tropism for nasal and olfactory epithelium (A and inset), tracheal (B, arrows), and bronchial glands (C). Virus tropism is widespread in hamsters (D-F), and SARS-CoV-2 readily infects nasal (D) and olfactory epithelia (E) as well as bronchiolar epithelium and alveolar pneumocytes (F) in association with necrotizing bronchointerstitial pneumonia. In white-tailed deer (G-H), SARS-CoV-2 infects the tracheal and bronchial respiratory epithelium (G and H), while in sheep (I) viral antigen is limited to antigen-presenting cells within lymphoid clusters in the tracheal lamina propria (I). Immunohistochemistry for SARS-CoV-2 nucleocapsid, Fast Red, 200× magnification.
Distribution and abundance of ACE2 and TMPRSS2 mRNA in the respiratory tract of different animal species and humans
The distribution and abundance of both ACE2 and TMPRSS2 mRNAs were assessed by dual RNAscope in situ hybridization (ISH) and quantitative analysis from whole slide images using specific digital pathology software. For this purpose, tissues of interest within the respiratory tract were compartmentalized in NE, ONE, tracheal, bronchial, and bronchiolar epithelium; alveoli; tracheal glands (cats and sheep); and bronchial glands (cats and sheep) and analyzed separately. Overall, ACE2 and TMPRSS2 mRNAs were expressed in all compartments evaluated, with TMPRSS2 being more abundant than ACE2. Differences in the abundance based on location were statistically evaluated in each species (Table S1). Results are summarized in Table 1.
TABLE 1.
Distribution and abundance of ACE2 and TMPRRS2 mRNAs in the species examined in this studye
| Species | Anatomic location |
ACE2+TMPRSS2+ distributiona |
ACE2/TMPRSS2 abundanceb |
SARS-CoV-2 N antigenc |
|
|---|---|---|---|---|---|
| Cat | Upper airways | NE | Yes | ++/++ | Positive |
| ONE | Yes | +/+ | Positive | ||
| Lower airways | Trachea | Yes | ++/++ | Negative | |
| Tracheal gl. | Yes | +++/++ | Positive | ||
| Bronchi | Yes | +++/+++ | Negative | ||
| Bronchial gl. | Yes | ++/++ | Positive | ||
| Bronchioles | Yes | ++/++ | Negative | ||
| Alveoli | Yes | +/+ | Negative | ||
| Hamster | Upper airways | ONE | Negligible | +/+ | Positive |
| Lower airways | Bronchi | Yes | ++/++ | Positive | |
| Bronchioles | Yes | ++/++ | Positive | ||
| Alveoli | Negligible | +/+ | Positive | ||
| White-tailed deer | Upper airways | NE | Yes | +/++ | Negative |
| ONE | Negligible | +/+ | Negative | ||
| Lower airways | Trachea | Yes | +/++ | Positive | |
| Bronchi | Yes | ++/+++ | Positive | ||
| Bronchioles | Yes | +/+++ | Negative | ||
| Alveoli | Negligible | +/+ | Negative | ||
| Sheep | Upper airways | NE | Negligible | Negligible/++ | Negative |
| ONE | Negligible | Negligible/++ | Negative | ||
| Lower airways | Trachea | Negligible | Negligible/++ | Negatived | |
| Tracheal gl. | Negligible | Negligible/++ | Negative | ||
| Bronchi | Negligible | Negligible/++ | Negative | ||
| Bronchial gl. | Negligible | Negligible/++ | Negative | ||
| Bronchioles | Negligible | Negligible/++ | Negative | ||
| Alveoli | Negligible | Negligible/+ | Negative | ||
| Pig | Lower airways | Trachea | Negligible | Negligible/++ | Negative |
| Tracheal gl. | Negligible | Negligible/++ | Negative | ||
| Bronchi | Negligible | Negligible/++ | Negative | ||
| Bronchioles | Negligible | Negligible/++ | Negative | ||
| Alveoli | Negligible | Negligible/+ | Negative | ||
| Human | Upper airways | NE | Yes | ++/+++ | NA |
| Nasal gl. | Yes | +/++ | NA | ||
| Lower airways | Trachea | Yes | +/++ | NA | |
| Bronchioles | Yes | ++/++ | NA | ||
| Alveoli | Negligible | +/+ | NA | ||
Yes, presence of ACE2+TMPRSS2+ cells is greater than 1%. Negligible: presence of ACE2+TMPRSS2+ cells is <1%.
Relative abundance of ACE2 and TMPRSS2-expression. +, low; ++, moderate; +++, abundant.
Presence or absence of viral antigen is indicated positive or negative, respectively.
Viral antigen only limited to sporadic antigen presenting cells within submucosal lymphoid aggregates.
NE: nasal epithelium; ONE: olfactory neuroepithelium; gl: glands; NA: samples from SARS-CoV-2-infected patients were not available for viral antigen analysis.
Cats
Among all the species examined in this study, cats showed the highest expression of both ACE2 and TMPRSS2 mRNA throughout the respiratory tract tissues examined. Albeit overall low, expression of ACE2 was most abundant in the tracheal glands, followed by the bronchi, tracheal epithelium, NE, and bronchial glands (Fig. 2A and B; Table S1). In contrast, the ONE and the alveoli showed the lowest level of ACE2 expression (Fig. 2B). TMPRSS2 expression was highest within the tracheal and bronchial epithelium, followed by bronchioles and NE, tracheal and bronchial glands, and ONE (Fig. 2C; Table S1). The alveoli showed the lowest level of detection (Fig. 2). Remarkably, ACE2-TMPRSS2 co-expression rates were the highest in cats among the species evaluated, with roughly 30%–42.5% of nasal, tracheal, bronchial, and submucosal glandular epithelial cells being ACE2+ and TMPRSS2+ (Fig. 2A). Distribution of ACE2 and TMPRSS2 throughout the feline respiratory tract is shown in Fig. 3 to 5. Interestingly, the density of expression of both ACE2 and TMPRSS2 mRNA in the trachea was segmental, with interspersed segments of tracheal epithelium characterized by heavy expression (Fig. 4A).
Fig 2.
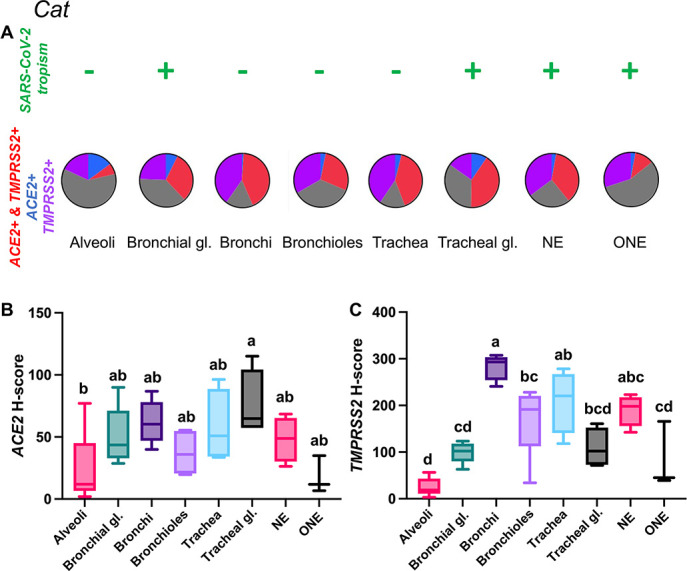
Expression of host cell factors ACE2 and TMPRSS2 mRNAs in the respiratory tract of cats. SARS-CoV-2 tropism (A), ACE2-TMPRSS2 mRNA co-expression (A), and distribution and abundance of ACE2 (B) and TMPRSS2 mRNAs (C) in the respiratory tract of cats. Pie charts illustrate co-expression rates (red), which were highest within the NE, tracheal glands, tracheal and bronchial epithelium (proportion of only ACE2-expressing, TMPRSS2-expressing, and negative cells are indicated in blue, purple, and gray, respectively). SARS-CoV-2 tropism is indicated with a + sign for each respective tissue compartment. Levels not connected by the same letter are significantly different (P < 0.05). NE, nasal epithelium; ONE, olfactory neuroepithelium; gl., glands. H-scores range from 0 to 400.
Fig 3.

ACE2 and TMPRSS2 mRNA distribution in the nasal cavity of cats. In the NE [A and B (magnified area depicted in the black dashed box in A)], TMPRSS2 mRNA (red dots and clusters) is abundantly expressed in the surface epithelium with lower level of expression within nasal submucosal glands (A, inset). ACE2 mRNA (brown dots and clusters) is overall less abundant but co-expressed with TMPRSS2 within the surface (B, arrows) and glandular epithelium (A, inset). Co-expression of ACE2 and TMPRSS2 was also noted throughout the ONE (C and D [magnified area depicted in the black dashed box in C]), albeit at a lower abundance than in NE. Arrows indicate ACE2-specific dots (D). Dual RNAscope ISH, ACE2 [3′,3′ diaminobenzidine (DAB), brown] and TMPRSS2 (Fast Red, red)-specific probes, 400× magnification.
Fig 5.

ACE2 and TMPRSS2 mRNA distribution in the bronchiolar epithelium (A and B) and alveoli (C and D) of cats. While ACE2 (brown dots and clusters, arrows) and TMPRSS2 (red dots and clusters) are abundant in the bronchiolar epithelium, they were expressed less frequently in scattered pneumocytes in alveoli. B and D are magnified views of the black dashed boxed areas in A and C, respectively. Dual RNAscope ISH, ACE2 [3′,3′ diaminobenzidine (DAB), brown] and TMPRSS2 (Fast Red, red)-specific probes, 400× magnification.
Fig 4.
ACE2 and TMPRSS2 mRNA distribution in the trachea (A and B) and bronchi (C and D) of cats. In both instances, ACE2 mRNA (brown dots and clusters, arrows) and TMPRSS2 mRNA (red dots and clusters) are abundantly expressed along surface epithelial and submucosal glandular epithelial cells (A and C, insets). B and D are magnified views of the black dashed boxed areas in A and C, respectively. Dual RNAscope ISH, ACE2 [3′,3′ diaminobenzidine (DAB), brown] and TMPRSS2 (Fast Red, red)-specific probes, 400× magnification.
Hamsters
In this species, tissues examined were limited to the ONE, bronchial and bronchiolar epithelium, and pulmonary parenchyma (alveoli). ACE2 expression remained low throughout the examined areas but significantly higher in the bronchi and bronchioles (Fig. 6A and B; Table S1; P < 0.01). TMPRSS2 was more widely expressed, with its highest levels within bronchial and bronchiolar epithelium followed by the ONE (Fig. 6A and C; Table S1; P < 0.01). The highest level of ACE2+ TMPRSS2+ double positive cells was detected within the bronchi (8%) and bronchioles (4%) (Fig. 6A) and negligible amounts elsewhere (<0.5%). Distribution of ACE2 and TMPRSS2 mRNA throughout the hamster respiratory tract is shown in Fig. 7 and 8.
Fig 6.

Expression of host cell factors ACE2 and TMPRSS2 mRNAs in the respiratory tract of hamsters. SARS-CoV-2 tropism (A), ACE2-TMPRSS2 mRNA co-expression (A), and distribution and abundance of ACE2 (B) and TMPRSS2 mRNA (C) in the respiratory tract of hamsters. Pie charts illustrate co-expression rates (red), which were highest within the bronchial and bronchiolar epithelium (proportion of only ACE2-expressing, TMPRSS2-expressing, and negative cells are indicated in blue, purple, and gray, respectively). SARS-CoV-2 tropism is indicated with a + sign for each respective tissue compartment. Levels not connected by the same letter are significantly different (P < 0.05). H-scores range from 0 to 400.
Fig 7.

ACE2 and TMPRSS2 mRNA distribution in the ONE and bronchi of hamsters. In the ONE [A and B (magnified area depicted in the black dashed box in A)], ACE2 (brown dots and clusters) is rare (B, arrow). In the bronchial epithelium (C and D), ACE2 was significantly more abundant (D, arrows). TMPRSS2 is stained as red dots and clusters. Dual RNAscope ISH, ACE2 [3′,3′ diaminobenzidine (DAB), brown] and TMPRSS2 (Fast Red, red)-specific probes, 400× magnification.
Fig 8.

ACE2 and TMPRSS2 mRNA distribution in the bronchioles (A and B) and alveoli (C and D) of hamsters. ACE2 mRNA (brown dots and clusters, arrows) and TMPRSS2 mRNA (red dots and clusters) are frequently co-expressed in the bronchiolar epithelium (A and B). Sporadic alveolar pneumocytes co-express ACE2 and TMPRSS2 (C and D). B and D are magnified views of the black dashed boxed areas in A and C, respectively. Dual RNAscope ISH, ACE2 [3′,3′ diaminobenzidine (DAB), brown] and TMPRSS2 (Fast Red, red)-specific probes, 400× magnification.
White-tailed deer
ACE2 mRNA transcript expression was low across tissue compartments analyzed, being most abundant in the bronchial epithelium (Fig. 9A and B; Table S1). In contrast, TMPRSS2 mRNA expression was highest within bronchial and bronchiolar epithelial cells, followed by the tracheal and NE (Fig. 9C; Table S1). Significantly lower expression of TMPRSS2 mRNA was detected in the ONE and alveoli compared to other sites analyzed (P < 0.01, Fig. 9C). Co-expression of ACE2-TMPRSS2 was highest in the bronchi (10%) and bronchioles (7%) and lowest in the ONE (0.55%) and alveoli (0.05%) (Fig. 9A). Distribution of ACE2 and TMPRSS2 mRNA throughout the respiratory tract of white-tailed deer is shown in Fig. 10 and 11; and Fig. S1.
Fig 9.

Expression of host cell factors ACE2 and TMPRSS2 mRNAs in the respiratory tract of white-tailed deer. SARS-CoV-2 tropism (A), ACE2-TMPRSS2 mRNA co-expression (A), and distribution and abundance of ACE2 mRNA (B) and TMPRSS2 mRNA (C) in the respiratory tract of white-tailed deer. Pie charts illustrate co-expression rates (red), which were highest within the bronchi and bronchioles (proportion of only ACE2-expressing, TMPRSS2-expressing, and negative cells are indicated in blue, purple, and gray, respectively). SARS-CoV-2 tropism is indicated with a + sign for each respective tissue compartment. Levels not connected by the same letter are significantly different (P < 0.05). H-scores range from 0 to 400.
Fig 10.

ACE2 and TMPRSS2 mRNA distribution in the NE (A and B) and ONE (C and D) of white-tailed deer. ACE2 was rarely expressed in the NE [B, arrow (magnified area depicted in the black dashed box in A)] and nearly not detectable in the ONE (D, magnified area depicted in the black dashed box in C). TMPRSS2 (red dots and clusters) was less abundant at these locations compared to other species. Dual RNAscope ISH, ACE2 [3′,3′ diaminobenzidine (DAB), brown] and TMPRSS2 (Fast Red, red)-specific probes, 400× magnification.
Fig 11.

ACE2 and TMPRSS2 mRNA distribution in the trachea (A and B) and bronchi (C and D) of white-tailed deer. While expression of TMPRSS2 mRNA (red dots and clusters) was abundant, ACE2 mRNA (brown dots and clusters, B and D, arrow) was rare. B and D are magnified views of the black dashed boxed areas in A and C, respectively. Dual RNAscope ISH, ACE2 [3′,3′ diaminobenzidine (DAB), brown] and TMPRSS2 (Fast Red, red)-specific probes, 400× magnification.
Sheep
ACE2 mRNA expression was overall very low in every tissue location examined (median H-score values ranging from 0.06 to 1.49; Figure 12). TMPRSS2 mRNA had a higher level of expression and was most abundant in the bronchiolar epithelium, tracheal epithelium, ONE, bronchial epithelium, and bronchial glands in decreasing order of abundance; however, these differences were not statistically significant (Fig. 12A and C; Table S1). Co-expression analysis of ACE2-TMPRSS2 double positive cells revealed that a very low percentage of the cells analyzed expressed both transcripts (<1% in all locations, Fig. 12A). Distribution of ACE2 and TMPRSS2 mRNA throughout the respiratory tract of sheep are shown in Fig. S2 through S4.
Fig 12.

Expression of host cell factors ACE2 and TMPRSS2 mRNAs in the respiratory tract of sheep. SARS-CoV-2 tropism (A), ACE2-TMPRSS2 mRNA co-expression (A), and distribution and abundance of ACE2 mRNA (B), and TMPRSS2 mRNA (C) in the respiratory tract of sheep. Pie charts illustrate co-expression rates (red), which is negligible in the different tissue compartments (proportion of only ACE2-expressing, TMPRSS2-expressing, and negative cells are indicated in blue, purple, and gray, respectively). Only rare SARS-CoV-2-infected antigen-presenting cells were detected within submucosal lymphoid aggregates in the trachea [shown as (−)] via immunohistochemistry for SARS-CoV-2 nucleocapsid. Levels not connected by the same letter are significantly different (P < 0.05). H-scores range from 0 to 400.
Fig 13.

Expression of host cell factors ACE2 and TMPRSS2 mRNAs in the respiratory tract of pigs. SARS-CoV-2 tropism (A), ACE2-TMPRSS2 mRNA co-expression (A), and distribution and abundance of ACE2 mRNA (B), and TMPRSS2 mRNA (C) in the respiratory tract of pigs. Pie charts illustrate co-expression rates (red), which are minimal (proportion of only ACE2-expressing, TMPRSS2-expressing, and negative cells is indicated in blue, purple, and gray, respectively). Pigs are not susceptible to SARS-CoV-2 infection. Levels not connected by the same letter are significantly different (P < 0.05). H-scores range from 0 to 400.
Pigs
ACE2 mRNA expression was low in the tissue compartments analyzed (Fig. 13A and B), with no statistically significant differences in expression levels between compartments (Fig. 13B; Table S1). The tracheal glands were the tissue compartment with the most frequent detection of ACE2 mRNA transcripts (Fig. 13B). For TMPRSS2, expression was significantly higher within the tracheal epithelium, small airways (bronchioles), and bronchi (Fig. 13A and C) compared to the alveoli (Table S1; P < 0.01). As demonstrated for other species above, the alveoli showed the lowest level of expression. Roughly 1% of the cells analyzed within the trachea and tracheal glands co-expressed ACE2-TMPRSS2 mRNAs (Fig. 13A). Distribution of ACE2 and TMPRSS2 mRNA throughout the respiratory tract of pigs is shown in Fig. S5.
Humans
TMPRSS2 mRNA was more abundant in the human respiratory tree compared to ACE2. Albeit low, ACE2 mRNA was expressed throughout the different segments of the respiratory tract, being most abundant in the nasal epithelium and lowest in the alveoli (Fig. 14A and B; Table S1). TMPRSS2 showed a similar tissue distribution (Fig. 14A and C). Overall, 8.2%, 6.2%, 5.8%, and 5.5% of the cells analyzed within the NE, bronchiolar and tracheal epithelium, and nasal glands co-expressed ACE2-TMPRSS2 mRNAs, while the level of co-expression in the alveoli was very low (<1%) (Fig. 14A; Fig. S6C and D). Distribution of ACE2 and TMPRSS2 mRNA throughout the respiratory tract of humans is depicted in Fig. 15 and Fig. S6.
Fig 14.

Expression of host cell factors ACE2 and TMPRSS2 mRNAs in the respiratory tract of humans. SARS-CoV-2 tropism (A), ACE2-TMPRSS2 mRNA co-expression (A), and distribution and abundance of ACE2 mRNA (B), and TMPRSS2 mRNA (C) in the respiratory tract of humans. Pie charts illustrate co-expression rates (red), which were highest within the NE, tracheal and bronchiolar epithelium, and nasal glands (proportion of only ACE2-expressing, TMPRSS2-expressing, and negative cells are indicated in blue, purple, and gray, respectively). SARS-CoV-2 tropism is indicated with a + sign for each respective tissue compartment (based on existing literature). Levels not connected by the same letter are significantly different (P < 0.05). H-scores range from 0 to 400.
Fig 15.

ACE2 and TMPRSS2 mRNA distribution in the NE (A and B) and trachea (C and D) of humans. ACE2 mRNA was detected in both the NE [B, arrows (magnified area depicted in the black dashed box in A)] and trachea [D, arrow (magnified area depicted in the black dashed box in C)]. TMPRSS2 mRNA (red dots and clusters) was abundant throughout. Expression of TMPRSS2 was also detected within nasal glands (A, inset). Dual RNAscope ISH, ACE2 [3′,3′ diaminobenzidine (DAB), brown], and TMPRSS2 (Fast Red, red)-specific probes, 400× magnification.
Influence of SARS-CoV-2 challenge/infection on the abundance of ACE2 and TMPRSS2 transcripts in the respiratory tract
Since viral infections have a strong influence on the transcriptional changes within infected cells, we wanted to investigate whether SARS-CoV-2 infection could influence the level of expression of ACE2 and TMPRSS2 mRNAs in the respiratory tract. For this purpose, the abundance of ACE2 and TMPRSS2 mRNAs was compared between mock-infected controls and SARS-CoV-2-challenged pigs, white-tailed deer, cats, and hamsters. Since no mock-infected sheep were available for this study, this species was excluded from the analysis. In all species evaluated, no significant differences in the level of expression of ACE2 and TMPRSS2 mRNAs were identified following SARS-CoV-2 challenge (P > 0.05, data not shown).
DISCUSSION
Susceptibility to SARS-CoV-2 has been demonstrated via experimentall and natural infection in numerous animal species; these studies highlight the potential for viral maintenance in and spillback transmission of SARS-CoV-2 from susceptible animals into the human population as well as the potential for the emergence of novel viral variants, as exemplified by the occurrence of SARS-CoV-2 in mink, hamsters, and white-tailed deer (10, 11, 53–55). The COVID-19 pandemic, therefore, exemplifies the significance of the human-animal interaction as a driver for the emergence of zoonotic diseases in humans that can have a high impact on both humans and animals, emphasizing the importance of the One Health concept.
The main determinant of susceptibility to SARS-CoV-2 is based on the binding affinity between the viral RBD of the S protein and the host ACE2 receptor, which serves as the main, but not sole, cellular receptor (56–60). Early in silico studies evaluating a possible interaction of the RBD of the S protein with the ACE2 receptor protein of numerous animal species (42) have been confirmed by either experimental or natural infections. It has been shown that numerous animal species are susceptible to SARS-CoV-2 infection resulting in mild to severe disease, including domestic cats, large felids, ruminants (white-tailed deer and sheep), laboratory animals (ferrets and hamsters), deer mice, and wild-type mice (naturally susceptible to SARS-CoV-2 variants carrying the N501Y spike mutation), among others (14–22). In addition to the RBD-ACE2 binding, proteolytic cleavage of the S protein into S1 and S2 via cellular proteases (among which TMPRSS2 is the most important) is required for viral entry into cells (41). Therefore, ACE2 and TMPRSS2 have been identified as important determinants of susceptibility and viral tropism. While the expression of these factors has been evaluated in the respiratory tract of humans and certain laboratory animal models, their distribution and abundance in other animal species have not been widely explored. Such information is critical to further understand SARS-CoV-2 pathogenesis and virulence, refine preclinical animal models, understand the potential role of different animal species in maintenance/viral replication and transmission, and determine the efficacy of intervention strategies (antivirals and vaccines). Hence, our study provides this critical comparative information, contributing to further understanding SARS-CoV-2 pathogenesis and informing on the suitability of these different animal species as models of COVID-19 disease. While recent studies evaluated the distribution of ACE2 in the lung, intestine, and other organs of various animal species including dogs, cats, artiodactyls, mustelids, other zoo species, primates, and phocids (49–52), to our knowledge, no study to date has quantitatively evaluated the expression of both ACE2 and TMPRSS2 comparatively in different species to characterize their distribution throughout the different segments of the respiratory tract. In addition, these previous studies have used cross-reactive anti-human ACE2 antibodies for staining tissues from different animal species; such antibodies have been suboptimal in their performance for tissue immunostaining in non-human mammalian species, often yielding non-specific binding and high levels of background in the author’s experience. Therefore, in this study, we sought to comprehensively characterize the landscape of ACE2 and TMPRSS2 mRNA transcript distribution and abundance in the respiratory tract tissues of various animal models which have been previously shown to exhibit a wide range of susceptibility to SARS-CoV-2 infection. Since ACE2 and TMPRSS2-specific antibodies for different animal species are not available and cross-reactive antibodies are also limited, we have developed species-specific riboprobes to assess the distribution of ACE2 and TMPRSS2 mRNA in the respiratory tract via duplex RNAscope ISH.
From the present study, we determined that both ACE2 mRNA and to a greater extent TMPRSS2 mRNA are richly expressed throughout the respiratory tract, predominantly within the conductive portion, from the nasal epithelium (NE) to the bronchioles, with lower levels of expression in the alveoli and olfactory neuroepithelium (ONE). Also, we demonstrated inter-species variations in their abundance and co-expression rates. Remarkably, cats, Syrian hamsters, and white-tailed deer are among those with the highest rate of ACE2-TMPRSS2 co-expression in the respiratory tract and are among the animal species with the highest susceptibility to SARS-CoV-2. While the cellular expression of ACE2-TMPRSS2 mRNAs in white-tailed deer and Syrian hamsters equates viral antigen detection (i.e. virus host tissue tropism) as determined by IHC, this relationship is variable in other species. For example, in cats, viral tropism is restricted to the NE, ONE, and tracheal and bronchial glandular epithelia, all of which show high levels of ACE2-TMPRSS2 co-expression, with no detectable viral antigen or viral RNA within the respiratory epithelium of trachea, bronchi, and smaller airways despite the high rate of ACE2-TMPRSS2 co-expression. This observation likely indicates that other host factors besides ACE2 and TMPRSS2 are required for cellular permissiveness to SARS-CoV-2 or inhibit SARS-CoV-2 replication despite the expression of ACE2 and TMPRSS2. Recent studies have demonstrated a vast array of additional receptors despite ACE2 e.g., asialoglycoprotein receptor-1 (ASGR1) and Kringle Containing Transmembrane Protein 1 (KREMEN1) (60), and various putative receptors [ e.g., neuropilin 1 (NRP-1), CD147, tysorine protein kinase receptor UFO (Axl) (56, 57, 59, 61)] as well as several cofactors (e.g., GRP78, scavenger receptor class B member 1 (SRB1), Basigin, low-density lipoprotein receptor class A domain-containing protein 3 (LDLRAD3), C-type lectin domain family 4 member G (CLEC4G), CD209 (DC-SIGN), L-SIGN, heparan sulfate proteoglycans, and sialic acid-containing glycolipid, among others (58, 62–65)] that support and/or enhance viral entry. Similarly, several other cellular proteases besides TMPRSS2 can induce proteolytic cleavage of the S protein and trigger envelope fusion such as furin, TMPRSS4, trypsin-like proteases, and cathepsins (e.g., cathepsin L) (66, 67). The role of these additional factors and their distribution has not been investigated in susceptible animal species thus far and could explain differences in cellular permissiveness to SARS-CoV-2 infection. Another important observation of the latter studies is the fact that despite co-expression of ACE2 and TMPRSS2 within small bronchioles and sporadic alveolar pneumocytes in the majority of the species evaluated, aside from Syrian hamsters, SARS-CoV-2 infection did not result in the development of pneumonia in the experimental infections undertaken by our laboratory in the above-described species. In summary, co-expression of ACE2-TMPRSS2 mRNAs was highest in those species with the highest susceptibility to SARS-CoV-2 infection (i.e., cats, Syrian hamsters, and white-tailed deer), while cells co-expressing these critical virus host entry factors were minimal in the respiratory tract of sheep and pigs, low or non-susceptible animal species, respectively.
Overall, ACE2 transcripts occurred at a lower abundance compared to TMPRSS2 transcripts in respiratory tissue compartments in all animal species evaluated, including humans. However, this observation does not necessarily translate into lower ACE2 protein expression; interestingly, the evaluation of the respiratory tract tissues from other species (e.g., transgenic K18-humanized ACE2 mice) reveals high apical staining for ACE2 within the nasal cavity and smaller airways despite the relatively low abundance of hACE2 transcripts (31, 48). Therefore, the lower levels of ACE2 transcripts detected in the susceptible animal species evaluated in this study are likely sufficient for adequate cellular protein expression and efficient docking of SARS-CoV-2. The lowest levels of ACE2 mRNA expression were identified in sheep and pigs, and such low abundance could be, at least in part, responsible for their lack of or low susceptibility to SARS-CoV-2 infection.
To determine whether SARS-CoV-2 infection modulates temporal ACE2 and TMPRSS2 mRNA expression levels, we compared transcript abundance between SARS-CoV-2- and mock-infected animals (excluding sheep). No significant differences in expression levels between SARS-CoV-2-challenged/infected and mock-infected animals were identified in this study. These results contrast our previous observations in transgenic and wild-type murine models, where we observed a downregulation of murine Ace2 following experimental SARS-CoV-2 infection (31).
An important aspect to note regarding our study is that the animal models evaluated have been experimentally infected with the Wuhan-like USA-WA1/2020 isolate or an Alpha VOC B.1.1.7 strain of SARS-CoV-2. The susceptibility of many of the animal species evaluated here to other VOCs (e.g., Delta and Omicron) has been either experimentally or naturally confirmed. It was shown that white-tailed deer are naturally susceptible to Delta and Omicron VOC (68–71), cats are naturally susceptible to Delta and experimentally to Omicron VOC (38, 72, 73), and hamsters are susceptible to numerous if not all VOCs (74–76). An important question that remains to be answered is whether differences in ACE2 and TMPRSS2 expression and distribution or mutations within the RBD of the viral S glycoprotein would create a change in susceptibility to more recent VOCs such as Omicron. Several studies have examined the effect of Omicron’s S protein mutations on its interaction with the host factors ACE2 and TMPRSS2 and demonstrated that (i) mutations in the Omicron RBD have led to new S-ACE2 interacting domains, resulting in more robust binding of the Omicron S protein to ACE2 when compared to the original Wuhan-like strains (77, 78), and (ii) the Omicron S protein is cleaved less efficiently by TMPRSS2, leading to reduced viral entry into cells expressing high levels of this host protease and consequently, there is an anticipated shift in tropism away from TMPRSS2-expressing cell types (79). Based on this information, it could be hypothesized that the enhanced Omicron S-ACE2 binding may facilitate infection of animal hosts with lower levels of susceptibility due to overall low expression of ACE2 in their respiratory tracts or allows for an expanded tropism to cell types with otherwise low ACE2 expression.
In conclusion, this study is the first to comprehensively and comparatively characterize the distribution and abundance of the two most important host factors associated with SARS-CoV-2 susceptibility, namely ACE2 and TMPRSS2 in multiple animal species with different susceptibility to SARS-CoV-2 infection. The differences in abundance and distribution of ACE2 and TMPRSS2 mRNAs in addition to the variation in cellular SARS-CoV-2 tropism between animal species identified in this study highlight the fact that, while the level of expression of ACE2 (and affinity between S protein RBD-ACE2, as previously shown by others) may be a determining factor in species susceptibility, cellular permissiveness to SARS-CoV-2 infection is often not solely associated with ACE2 expression but likely also governed by other host factors. This study was aimed at further refining our knowledge on animal models for COVID-19; future studies to investigate the importance of other host factors and their relationship to SARS-CoV-2 susceptibility are warranted. Differences in viral tropism and the fact that ACE2 and TMPRSS2 expression do not necessarily govern animal susceptibility as determined in this study necessitate future studies to identify additional host factors that either determine host susceptibility or restrict SARS-CoV-2 infection, which may, in turn, play a role in spillover transmission and reservoir establishment in nature.
MATERIALS AND METHODS
Experimental infection of cats, pigs, sheep, white-tailed deer and hamsters
Animal infection experiments were performed under ABSL-3 or BSL-3Ag conditions at the Biosecurity Research Institute (BRI) at KSU. The design and outcome of these experimental infections have been described previously in greater detail (22–24, 35–37).
Cats
A total of seven 4.5- to 5-month-old intact male domestic shorthair cats were obtained from Marshall BioResources (North Rose, New York, USA) and included in this study. Two of the cats were mock controls while five were infected with the ancestral, Wuhan-like SARS-CoV-2 as previously described (22). Cats were euthanized at 4 days post-challenge (DPC) (n = 2), 7 DPC (n = 2) and 21 DPC (n = 1).
Pigs
A total of six 5-week-old Yorkshire pigs were included in this study and were derived from a previous study (24). Three pigs were mock controls and three were infected with the ancestral, Wuhan-like SARS-CoV-2 as previously described (24). Challenged pigs were euthanized at 4 DPC.
Sheep
A total of four 6-month-old male Suffolk sheep were obtained from from Frisco Farms (Ewing, IL) and included in this study. These animals were co-infected with the ancestral, Wuhan-like SARS-CoV-2 and the Alpha VOC B.1.1.7 as previously described (23). Sheep were euthanized at 4 DPC (n = 2) and 8 DPC (n = 2). Mock-infected animals were not available for this study.
White-tailed deer
A total of six 2-year-old female white-tailed deer were acquired from a Kansas deer farm (Muddy Creek Whitetails, KS) and included in this study. Two out of six served as mock controls, while four animals were co-infected with the ancestral, Wuhan-like SARS-CoV-2 and the Alpha VOC B.1.1.7 as previously described (35). Deer were euthanized at 4 DPC (n = 2) and 8 DPC (n = 2).
Hamsters
A total of 4, three-month-old Golden Syrian hamsters were acquired from Charles River Laboratories (Wilmington, MA) and included in this study. One animal served as a negative control, while the others were infected with the ancestral, Wuhan-like SARS-CoV-2 as previously described (37). Hamsters were euthanized at 3 DPC (n = 2) and 5 DPC (n = 2).
Sample collection
A full postmortem examination was performed for each animal depending on the experimental design, as previously described for each species. Respiratory tract tissues (nasal turbinates, trachea, and lung) were fixed in 10% neutral-buffered formalin. Nasal turbinates were decalcified for 72–96h following fixation and before being processed and embedded using a commercial decalcifying solution at a 1:2 dilution in distilled water (Immunocal Decalcifier, StatLab, McKinney, TX, USA).
Histopathology
Tissues from the experimental animals and humans were paraffin-embedded, and four-micron sections were obtained and stained with hematoxylin and eosin following standard procedures. Tissue sections were evaluated microscopically by an experimental (JDT) and board-certified veterinary pathologist (MC).
Human tissues
Biopsy or surgical specimens of the lung (n = 5), trachea (n = 6), and nasal contents (n = 5) from healthy young adult male and female patients ages 16–29 years were selected from the archives of the Department of Pathology, Molecular, and Cell-Based Medicine, Icahn School of Medicine at Mount Sinai, New York, NY, and de-identified. Formalin-fixed paraffin-embedded blocks of these tissues were serial sectioned (5 µm) for RNA-based studies and stained with hematoxylin and eosin for histological evaluation. Fifteen patients were non-smokers, and the status of one patient (nasal contents) was not known.
Species-specific ACE2 and TMPRSS2 RNAscope in situ hybridization (RNAscope ISH)
For RNAscope ISH, species-specific anti-sense probes targeting ACE2 and TMPRSS2 mRNA of Sus scrofa (865318, 568308-C2), Felis catus (859968, 871678-C2), Odocoileus virginianus (1047228-C1, 1047248-C2), Ovis aries (1047238-C1, 1047258-C2), Mesocricetus auratus (872898, 1047268-C2), and Homo sapiens (848158-C1, 470348-C2) were designed [Advanced Cell Diagnostics (ACD), Newark, CA, USA] in channels 1 and 2, respectively (C1 and C2). For animal samples, four-micron sections of formalin-fixed paraffin-embedded tissues were mounted on positively charged Superfrost Plus Slides (VWR, Radnor, PA). For human samples, five-micron sections of formalin-fixed paraffin-embedded tissues were mounted on positively charged ColorView Adhesive Charged slides (StatLab, Columbia, MD). The RNAscope ISH assay was performed using the RNAscope 2.5 LS Duplex Reagent Kit (Advanced Cell Diagnostics, Newark, CA) on the automated BOND RXm platform (Leica Biosystems, Buffalo Grove, IL). Briefly, four- or five-micron sections of formalin-fixed paraffin-embedded tissue were subjected to automated baking and deparaffinization followed by heat-induced epitope retrieval (HIER) using a ready-to-use EDTA-based solution (pH 9.0; Leica Biosystems) at 95°C for 15 min. Subsequently, tissue sections were treated with a ready-to-use protease (RNAscope 2.5 LS Protease) for 15 min at 40°C followed by a ready-to-use hydrogen peroxide solution for 10 min at room temperature. Slides were then incubated with a probe mixture containing species-specific ACE2 and TMPRSS2 probes at the concentration recommended by the manufacturer for 2 h at 40°C. The signal from the C2 probe (TMPRSS2) was amplified using amplifiers 1 through 7 (AMP1 through AMP7) as recommended by the manufacturer and the signal subsequently detected using a Fast-Red solution for 10 min at room temperature. The signal from the C1 probe (ACE2) was amplified following sequential incubation with amplifiers 8 through 10 (AMP8 through AMP10) per manufacturer’s recommendations. The signal was finally detected by incubating 3,3′-diaminobenzidine (DAB) for 20 min and the BOND DAB Enhancer (Leica Biosystems) for an additional 20 min at room temperature. Slides were counterstained with a ready-to-use hematoxylin for 5 min, followed by five washes with 1× BOND Wash Solution (Leica Biosystems) for bluing. Slides were finally rinsed in deionized water, dried in a 60°C oven for 30 min, and mounted with Ecomount (Biocare, Concord, CA, USA). A negative control probe mixture was used as negative control, and a species-specific probe mixture targeting ubiquitin C (UBC) and peptidylprolyl isomerase B (PPIB) mRNA was used as a positive control to assess RNA integrity (Fig. S7). Sections from the lung (cat, sheep, white-tailed deer, and human) and kidney (for pigs and hamsters) were used as positive assay controls.
SARS-CoV-2-specific immunohistochemistry (IHC)
For IHC, four-micron sections of formalin-fixed paraffin-embedded tissue were mounted on positively charged Superfrost Plus slides and subjected to IHC using anti-nucleocapsid rabbit polyclonal antibody (3A, developed by our laboratory) with the method previously described (80). IHC was performed using the automated BOND-RXm platform and the Polymer Refine Red Detection kit (Leica Biosystems). Following automated deparaffinization, heat-induced epitope retrieval (HIER) was performed using a ready-to-use citrate-based solution (pH 6.0; Leica Biosystems) at 100°C for 20 min. Sections were then incubated with the primary antibody [anti-SARS-CoV-2 nucleocapsid rabbit polyclonal antibody diluted at 1:5,000 in primary antibody diluent (Leica Biosystems)] for 30 min at room temperature, followed by a polymer-labeled goat anti-rabbit IgG coupled with alkaline phosphatase (30 min). Fast Red was used as the chromogen (15 min), and counterstaining was performed with hematoxylin for 5 min. Slides were dried in a 60°C oven for 30 min and mounted with a permanent mounting medium (Micromount, Leica Biosystems). Lung sections from a SARS-CoV-2-infected hamster were used as positive assay controls.
Whole slide scanning and quantitative image analysis
Duplex RNAscope ISH slides for ACE2 and TMPRSS2 were scanned at 40× magnification using a NanoZoomer HT whole slide scanner (Hamamatsu, Japan). Quantitative analysis was performed in QuPath 0.3.1 digital pathology image analysis software (81). Guidelines established by ACD were followed with some modifications (Fig. S8). Briefly, stain vectors were adjusted for each slide respectively before pursuing further analysis. Subsequently, 3–4 regions of each tissue compartment were selected to collect a minimum of 1,000 cells (NE, ONE, tracheal epithelium, tracheal glands, bronchial epithelium, bronchial glands, bronchioles, alveoli). Subsequently, the cell detection algorithm was performed with default values. After cell segmentation was performed, the subcellular detection algorithm was applied for the detection of DAB (ACE2) and Fast Red (TMPRSS2) spots using default values except for a minimum spot size of 0.1 and a DAB threshold between 0.4 and 0.8 based on the accuracy of the spot detection. Threshold for DAB and Residual (Fast Red) was assessed for each specific image to avoid erroneous detections. The estimated number of spots (ACE2 and TMPRSS2) was determined per cell per region and exported into an Excel file. Spots/cell for each tissue compartment were used to compute an H-score (range of 0–400) by binning cells with different levels of expression into separate bins [Bin 0 (0 dots/cell), Bin 1 (1–3 dots/cell), Bin 2 (4–9 dots/cell), Bin 3 (10–15 dots/cell), and Bin 4 (greater than or equal to 15 dots/cell)]. The H-score was computed using the weighted formula: H-score = ∑ (bin number × % cells per bin). H-scores were subsequently used for statistical analysis.
Statistical analysis
Data distribution (H-scores for ACE2 and TMPRSS2 expression per tissue area) was evaluated using JMP16 Pro (Cary, NC). Data were log-transformed, and analysis was performed via two-way analysis of variance (ANOVA) with Tukey’s post-hoc test for multiple comparisons using JMP16 Pro. Graphics were subsequently generated using either JMP16Pro or GraphPad Prism 9 (GraphPad Software, San Diego, CA). The level of significance was set at P < 0.05 for all tests.
Supplementary Material
ACKNOWLEDGMENTS
We acknowledge the Histology and Immunohistochemistry section at the Louisiana Animal Disease Diagnostic Laboratory and the Kansas State Veterinary Diagnostic Laboratory for their technical assistance. The following reagent was deposited by the Centers for Disease Control and Prevention and obtained through BEI Resources, NIAID, NIH: SARS-Related Coronavirus 2, Isolate USA-WA1/2020, NR-52281.
Sudeh Izadmehr is supported by the Loan Repayment Program, NCATS, NIH, and T32 Training Program in Cancer Biology T32CA078207, NCI, NIH. The study was also partially supported by an Institutional Development Award (IDeA) from the National Institute of General Medical Sciences of the National Institutes of Health under grant number P20GM130555, by the American Rescue Plan Act through USDA APHIS (USDA-NIFA award 2023-70432-39465) and start-up funds from the School of Veterinary Medicine, Louisiana State University (PG009641) to Mariano Carossino. Funding for this study was also provided through grants from the National Bio and Agro-Defense Facility (NBAF) Transition Fund from the State of Kansas, the MCB and AMP Cores of the Center on Emerging and Zoonotic Infectious Diseases (CEZID) of the National Institutes of General Medical Sciences under award number P20GM130448, the NIAID Centers of Excellence for Influenza Research and Surveillance (CEIRS) under contract number HHSN 272201400006C, and the NIAID supported Center of Excellence for Influenza Research and Response (CEIRR) under contract number 75N93021C00016. Additional funding was self-generated by Mariano Carossino and Udeni Balasuriya at Louisiana State University School of Veterinary Medicine under PG008671.
The findings and conclusions in this publication are those of the author(s) and should not be construed to represent any official USDA or U.S. Government determination or policy.
M.C. conceived the idea, obtained funding, designed the study, performed the experiments, curated and analyzed the data, and wrote the manuscript. S.I. collected and provided human tissue specimens, assisted with data analysis, and reviewed the manuscript. N.N.G. performed experimental infection studies and reviewed the manuscript. J.D.T. performed experimental infection studies, collection and processing of tissues, pathological evaluations, and reviewed the manuscript. W.D. curated quantitative data and reviewed the manuscript. I.M. performed experimental infection studies and reviewed the manuscript. U.B.R.B. conceived the idea, participated in study design, edited the manuscript, and provided extramural and self-generated funding to maintain equipment and personnel in the LADDL Histology and Immunohistochemistry section. C.C-C. collected and provided human tissue specimens, assisted with data analysis, and reviewed the manuscript. A.G.S. assisted in data analysis and reviewed the manuscript. J.A.R. conceived the idea, obtained funding, designed the study, assisted in data interpretation, and reviewed the manuscript.
Contributor Information
Mariano Carossino, Email: mcarossino1@lsu.edu.
Juergen A. Richt, Email: jricht@vet.k-state.edu.
Ujjwal Neogi, Karolinska Institutet, Stockholm, Sweden.
Vanessa Monteil, Karolinska Institutet, Stockholm, Sweden.
Shaharyar Mughal, Shifa College of Medicine, Islamabad, Pakistan.
ETHICS APPROVAL
All animal studies and experiments were approved and performed under the Kansas State University (KSU) Institutional Biosafety Committee (IBC, Protocol #1460) and the Institutional Animal Care and Use Committee (IACUC, Protocols #4390, 4508.2, 4468) in compliance with the Animal Welfare Act. All animal and laboratory work was performed in biosafety level-3 (BSL3) and -3Ag laboratory and facilities in the Biosecurity Research Institute at Kansas State University (KSU) in Manhattan, KS, USA. De-identified patient biopsy or surgical specimens were obtained through the Icahn School of Medicine at Mount Sinai Biorepository and Pathology CoRE Shared Research Facility under IRB protocol #12-00145.
DATA AVAILABILITY
Data from this study are available from the corresponding authors upon request.
SUPPLEMENTAL MATERIAL
The following material is available online at https://doi.org/10.1128/spectrum.03270-23.
ACE2 and TMPRSS2 mRNA distribution in bronchioles and alveoli of white-tailed deer.
ACE2 and TMPRSS2 mRNA distribution in the NE and ONE of sheep.
ACE2 and TMPRSS2 mRNA distribution in the trachea and bronchi of sheep.
ACE2 and TMPRSS2 mRNA distribution in bronchioles and alveoli of sheep.
ACE2 and TMPRSS2 mRNA distribution in bronchi, bronchioles, and alveoli of pigs.
ACE2 and TMPRSS2 mRNA distribution in bronchioles and alveoli of humans.
Species-specific peptidylprolyl isomerase B (PPIB) and ubiquitin C (UBC) mRNA expression.
Cell detection and subcellular detection algorithms performed for quantitative analysis.
P-values corresponding to the multiple comparisons performed to determine differences in ACE2 and TMPRSS2 mRNA abundance between tissues.
An accounting of the reviewer comments and feedback.
ASM does not own the copyrights to Supplemental Material that may be linked to, or accessed through, an article. The authors have granted ASM a non-exclusive, world-wide license to publish the Supplemental Material files. Please contact the corresponding author directly for reuse.
REFERENCES
- 1. Andersen KG, Rambaut A, Lipkin WI, Holmes EC, Garry RF. 2020. The proximal origin of SARS-CoV-2. Nat Med 26:450–452. doi: 10.1038/s41591-020-0820-9 [DOI] [PMC free article] [PubMed] [Google Scholar]
- 2. Coronaviridae study group of the international committee on taxonomy of V. 2020. Nat Microbiol 5:536–544. doi: 10.1038/s41564-020-0695-z [DOI] [PMC free article] [PubMed] [Google Scholar]
- 3. Wang C, Horby PW, Hayden FG, Gao GF. 2020. A novel coronavirus outbreak of global health concern. Lancet 395:470–473. doi: 10.1016/S0140-6736(20)30185-9 [DOI] [PMC free article] [PubMed] [Google Scholar]
- 4. Centers for Disease Control and Prevention (CDC). 2022. SARS-CoV-2 variant classifications and definitions. Available from: https://www.cdc.gov/coronavirus/2019-ncov/variants/variant-classifications.html
- 5. Escalera A, Gonzalez-Reiche AS, Aslam S, Mena I, Laporte M, Pearl RL, Fossati A, Rathnasinghe R, Alshammary H, van de Guchte A, et al. 2022. Mutations in SARS-CoV-2 variants of concern link to increased spike cleavage and virus transmission. Cell Host Microbe 30:373–387. doi: 10.1016/j.chom.2022.01.006 [DOI] [PMC free article] [PubMed] [Google Scholar]
- 6. Souza PFN, Mesquita FP, Amaral JL, Landim PGC, Lima KRP, Costa MB, Farias IR, Belém MO, Pinto YO, Moreira HHT, Magalhaes ICL, Castelo-Branco D, Montenegro RC, de Andrade CR. 2022. The spike glycoprotein of SARS-CoV-2: a review of how mutations of spike glycoproteins have driven the emergence of variants with high transmissibility and immune escape. Int J Biol Macromol 208:105–125. doi: 10.1016/j.ijbiomac.2022.03.058 [DOI] [PMC free article] [PubMed] [Google Scholar]
- 7. Zhou B, Thao TTN, Hoffmann D, Taddeo A, Ebert N, Labroussaa F, Pohlmann A, King J, Steiner S, Kelly JN, et al. 2021. SARS-CoV-2 spike D614G change enhances replication and transmission. Nature 592:122–127. doi: 10.1038/s41586-021-03361-1 [DOI] [PubMed] [Google Scholar]
- 8. Johns Hopkins University & Medicine . 2020. Coronavirus resource center. Available from: https://coronavirus.jhu.edu
- 9. Banerjee A, Mossman K, Baker ML. 2021. Zooanthroponotic potential of SARS-CoV-2 and implications of reintroduction into human populations. Cell Host Microbe 29:160–164. doi: 10.1016/j.chom.2021.01.004 [DOI] [PMC free article] [PubMed] [Google Scholar]
- 10. Bashor L, Gagne RB, Bosco-Lauth AM, Bowen RA, Stenglein M, VandeWoude S. 2021. SARS-CoV-2 evolution in animals suggests mechanisms for rapid variant selection. Proc Natl Acad Sci U S A 118:e2105253118. doi: 10.1073/pnas.2105253118 [DOI] [PMC free article] [PubMed] [Google Scholar]
- 11. Pickering B, Lung O, Maguire F, Kruczkiewicz P, Kotwa JD, Buchanan T, Gagnier M, Guthrie JL, Jardine CM, Marchand-Austin A, et al. 2022. Divergent SARS-CoV-2 variant emerges in white-tailed deer with deer-to-human transmission. Nat Microbiol 7:2011–2024. doi: 10.1038/s41564-022-01268-9 [DOI] [PMC free article] [PubMed] [Google Scholar]
- 12. Ren W, Lan J, Ju X, Gong M, Long Q, Zhu Z, Yu Y, Wu J, Zhong J, Zhang R, Fan S, Zhong G, Huang A, Wang X, Ding Q, Perlman S. 2021. Mutation Y453F in the spike protein of SARS-CoV-2 enhances interaction with the mink ACE2 receptor for host adaption. PLoS Pathog 17:e1010053. doi: 10.1371/journal.ppat.1010053 [DOI] [PMC free article] [PubMed] [Google Scholar]
- 13. World Organisation for animal health . 2023. Sars-CoV-2 in animals – situation. 20.
- 14. Shi J, Wen Z, Zhong G, Yang H, Wang C, Huang B, Liu R, He X, Shuai L, Sun Z, Zhao Y, Liu P, Liang L, Cui P, Wang J, Zhang X, Guan Y, Tan W, Wu G, Chen H, Bu Z. 2020. Susceptibility of ferrets, cats, dogs, and other domesticated animals to SARS-coronavirus 2. Science 368:1016–1020. doi: 10.1126/science.abb7015 [DOI] [PMC free article] [PubMed] [Google Scholar]
- 15. Halfmann PJ, Hatta M, Chiba S, Maemura T, Fan S, Takeda M, Kinoshita N, Hattori S-I, Sakai-Tagawa Y, Iwatsuki-Horimoto K, Imai M, Kawaoka Y. 2020. Transmission of SARS-CoV-2 in domestic cats. N Engl J Med 383:592–594. doi: 10.1056/NEJMc2013400 [DOI] [PMC free article] [PubMed] [Google Scholar]
- 16. Kim Y-I, Kim S-G, Kim S-M, Kim E-H, Park S-J, Yu K-M, Chang J-H, Kim EJ, Lee S, Casel MAB, et al. 2020. Infection and rapid transmission of SARS-CoV-2 in ferrets. Cell Host Microbe 27:704–709. doi: 10.1016/j.chom.2020.03.023 [DOI] [PMC free article] [PubMed] [Google Scholar]
- 17. Imai M, Iwatsuki-Horimoto K, Hatta M, Loeber S, Halfmann PJ, Nakajima N, Watanabe T, Ujie M, Takahashi K, Ito M, et al. 2020. Syrian hamsters as a small animal model for SARS-CoV-2 infection and countermeasure development. Proc Natl Acad Sci U S A 117:16587–16595. doi: 10.1073/pnas.2009799117 [DOI] [PMC free article] [PubMed] [Google Scholar]
- 18. Singh DK, Singh B, Ganatra SR, Gazi M, Cole J, Thippeshappa R, Alfson KJ, Clemmons E, Gonzalez O, Escobedo R, et al. 2021. Responses to acute infection with SARS-CoV-2 in the lungs of rhesus macaques, baboons and marmosets. Nat Microbiol 6:413. doi: 10.1038/s41564-021-00867-2 [DOI] [PMC free article] [PubMed] [Google Scholar]
- 19. Griffin BD, Warner BM, Chan M, Valcourt E, Tailor N, Banadyga L, Leung A, He S, Boese AS, Audet J, et al. 2021. SARS-CoV-2 infection and transmission in the North American deer mouse. Nat Commun 12:3612. doi: 10.1038/s41467-021-23848-9 [DOI] [PMC free article] [PubMed] [Google Scholar]
- 20. Shuai L, Zhong G, Yuan Q, Wen Z, Wang C, He X, Liu R, Wang J, Zhao Q, Liu Y, Huo N, Deng J, Bai J, Wu H, Guan Y, Shi J, Tian K, Xia N, Chen H, Bu Z. 2021. Replication, pathogenicity, and transmission of SARS-CoV-2 in minks. Natl Sci Rev 8:nwaa291. doi: 10.1093/nsr/nwaa291 [DOI] [PMC free article] [PubMed] [Google Scholar]
- 21. Zhao Y, Wang J, Kuang D, Xu J, Yang M, Ma C, Zhao S, Li J, Long H, Ding K, et al. 2020. Susceptibility of tree shrew to SARS-CoV-2 infection. Sci Rep 10:16007. doi: 10.1038/s41598-020-72563-w [DOI] [PMC free article] [PubMed] [Google Scholar]
- 22. Gaudreault NN, Trujillo JD, Carossino M, Meekins DA, Morozov I, Madden DW, Indran SV, Bold D, Balaraman V, Kwon T, et al. 2020. SARS-CoV-2 infection, disease and transmission in domestic cats. Emerg Microbes Infect 9:2322–2332. doi: 10.1080/22221751.2020.1833687 [DOI] [PMC free article] [PubMed] [Google Scholar]
- 23. Gaudreault NN, Cool K, Trujillo JD, Morozov I, Meekins DA, McDowell C, Bold D, Carossino M, Balaraman V, Mitzel D, Kwon T, et al. 2022. Susceptibility of sheep to experimental co-infection with the ancestral lineage of SARS-CoV-2 and its alpha variant. Emerg Microbes Infect 11:662–675. doi: 10.1080/22221751.2022.2037397 [DOI] [PMC free article] [PubMed] [Google Scholar]
- 24. Meekins DA, Morozov I, Trujillo JD, Gaudreault NN, Bold D, Carossino M, Artiaga BL, Indran SV, Kwon T, Balaraman V, Madden DW, Feldmann H, Henningson J, Ma W, Balasuriya UBR, Richt JA. 2020. Susceptibility of swine cells and domestic pigs to SARS-CoV-2. Emerg Microbes Infect 9:2278–2288. doi: 10.1080/22221751.2020.1831405 [DOI] [PMC free article] [PubMed] [Google Scholar]
- 25. Ulrich L, Wernike K, Hoffmann D, Mettenleiter TC, Beer M. 2020. Experimental infection of cattle with SARS-CoV-2. Emerg Infect Dis 26:2979–2981. doi: 10.3201/eid2612.203799 [DOI] [PMC free article] [PubMed] [Google Scholar]
- 26. Schlottau K, Rissmann M, Graaf A, Schön J, Sehl J, Wylezich C, Höper D, Mettenleiter TC, Balkema-Buschmann A, Harder T, Grund C, Hoffmann D, Breithaupt A, Beer M. 2020. SARS-CoV-2 in fruit bats, ferrets, pigs, and chickens: an experimental transmission study. Lancet Microbe 1:e218–e225. doi: 10.1016/S2666-5247(20)30089-6 [DOI] [PMC free article] [PubMed] [Google Scholar]
- 27. Mykytyn AZ, Lamers MM, Okba NMA, Breugem TI, Schipper D, van den Doel PB, van Run P, van Amerongen G, de Waal L, Koopmans MPG, Stittelaar KJ, van den Brand JMA, Haagmans BL. 2021. Susceptibility of rabbits to SARS-CoV-2. Emerg Microbes Infect 10:1–7. doi: 10.1080/22221751.2020.1868951 [DOI] [PMC free article] [PubMed] [Google Scholar]
- 28. Freuling CM, Breithaupt A, Müller T, Sehl J, Balkema-Buschmann A, Rissmann M, Klein A, Wylezich C, Höper D, Wernike K, et al. 2020. Susceptibility of raccoon dogs for experimental SARS-CoV-2 infection. Emerg Infect Dis 26:2982–2985. doi: 10.3201/eid2612.203733 [DOI] [PMC free article] [PubMed] [Google Scholar]
- 29. Bosco-Lauth AM, Root JJ, Porter SM, Walker AE, Guilbert L, Hawvermale D, Pepper A, Maison RM, Hartwig AE, Gordy P, Bielefeldt-Ohmann H, Bowen RA. 2021. Peridomestic mammal susceptibility to severe acute respiratory syndrome coronavirus 2 infection. Emerg Infect Dis 27:2073–2080. doi: 10.3201/eid2708.210180 [DOI] [PMC free article] [PubMed] [Google Scholar]
- 30. Dinnon KH, Leist SR, Schäfer A, Edwards CE, Martinez DR, Montgomery SA, West A, Yount BL, Hou YJ, Adams LE, Gully KL, et al. 2020. A mouse-adapted model of SARS-CoV-2 to test COVID-19 countermeasures. Nature 586:560–566. doi: 10.1038/s41586-020-2708-8 [DOI] [PMC free article] [PubMed] [Google Scholar]
- 31. Thieulent CJ, Dittmar W, Balasuriya UBR, Crossland NA, Wen X, Richt JA, Carossino M. 2023. Mouse-adapted SARS-CoV-2 MA10 strain displays differential pulmonary tropism and accelerated viral replication. mSphere 8:e0055822. doi: 10.1128/msphere.00558-22 [DOI] [PMC free article] [PubMed] [Google Scholar]
- 32. Shuai H, Chan JF-W, Yuen TT-T, Yoon C, Hu J-C, Wen L, Hu B, Yang D, Wang Y, Hou Y, et al. 2021. Emerging SARS-CoV-2 variants expand species tropism to murines. EBioMedicine 73:103643. doi: 10.1016/j.ebiom.2021.103643 [DOI] [PMC free article] [PubMed] [Google Scholar]
- 33. Thakur N, Gallo G, Newman J, Peacock TP, Biasetti L, Hall CN, Wright E, Barclay W, Bailey D. 2022. SARS-CoV-2 variants of concern alpha, beta, gamma and delta have extended ACE2 receptor host ranges. J Gen Virol 103. doi: 10.1099/jgv.0.001735 [DOI] [PubMed] [Google Scholar]
- 34. Wang Y, Lenoch J, Kohler D, DeLiberto TJ, Tang CY, Li T, Tao YJ, Guan M, Compton S, Zeiss C, Hang J, Wan X-F, Lednicky JA. 2023. SARS-CoV-2 exposure in norway rats (rattus norvegicus) from New York City. mBio 14:e0362122. doi: 10.1128/mbio.03621-22 [DOI] [PMC free article] [PubMed] [Google Scholar]
- 35. Cool K, Gaudreault NN, Morozov I, Trujillo JD, Meekins DA, McDowell C, Carossino M, Bold D, Mitzel D, Kwon T, et al. 2021. Infection and transmission of ancestral SARS-CoV-2 and its alpha variant in pregnant white-tailed deer. Emerg Microbes Infect 11:95–112. doi: 10.1080/22221751.2021.2012528 [DOI] [PMC free article] [PubMed] [Google Scholar]
- 36. Gaudreault NN, Carossino M, Morozov I, Trujillo JD, Meekins DA, Madden DW, Cool K, Artiaga BL, McDowell C, Bold D, et al. 2021. Experimental re-infected cats do not transmit SARS-CoV-2. Emerg Microbes Infect 10:638–650. doi: 10.1080/22221751.2021.1902753 [DOI] [PMC free article] [PubMed] [Google Scholar]
- 37. Ho JSY, Mok B-Y, Campisi L, Jordan T, Yildiz S, Parameswaran S, Wayman JA, Gaudreault NN, Meekins DA, Indran SV, et al. 2021. Top1 inhibition therapy protects against SARS-CoV-2-induced lethal inflammation. Cell 184:2618–2632. doi: 10.1016/j.cell.2021.03.051 [DOI] [PMC free article] [PubMed] [Google Scholar]
- 38. Tamil Selvan M, Gunasekara S, Xiao P, Griffin K, Cowan SR, Narayanan S, Ramachandran A, Hagen DE, Ritchey JW, Rudd JM, Miller CA. 2022. SARS CoV-2 (delta variant) infection kinetics and immunopathogenesis in domestic cats. Viruses 14:1207. doi: 10.3390/v14061207 [DOI] [PMC free article] [PubMed] [Google Scholar]
- 39. Pickering BS, Smith G, Pinette MM, Embury-Hyatt C, Moffat E, Marszal P, Lewis CE. 2021. Susceptibility of domestic swine to experimental infection with severe acute respiratory syndrome coronavirus 2. Emerg Infect Dis 27:104–112. doi: 10.3201/eid2701.203399 [DOI] [PMC free article] [PubMed] [Google Scholar]
- 40. Martins M, Boggiatto PM, Buckley A, Cassmann ED, Falkenberg S, Caserta LC, Fernandes MHV, Kanipe C, Lager K, Palmer MV, Diel DG, Munster V. 2022. From deer-to-deer: SARS-CoV-2 is efficiently transmitted and presents broad tissue tropism and replication sites in white-tailed deer. PLoS Pathog 18:e1010197. doi: 10.1371/journal.ppat.1010197 [DOI] [PMC free article] [PubMed] [Google Scholar]
- 41. Hoffmann M, Kleine-Weber H, Schroeder S, Krüger N, Herrler T, Erichsen S, Schiergens TS, Herrler G, Wu NH, Nitsche A, Müller MA, Drosten C, Pöhlmann S. 2020. SARS-CoV-2 cell entry depends on ACE2 and TMPRSS2 and is blocked by a clinically proven protease inhibitor. Cell 181:271–280. doi: 10.1016/j.cell.2020.02.052 [DOI] [PMC free article] [PubMed] [Google Scholar]
- 42. Damas J, Hughes GM, Keough KC, Painter CA, Persky NS, Corbo M, Hiller M, Koepfli K-P, Pfenning AR, Zhao H, et al. 2020. Broad host range of SARS-CoV-2 predicted by comparative and structural analysis of ACE2 in vertebrates. Proc Natl Acad Sci U S A 117:22311–22322. doi: 10.1073/pnas.2010146117 [DOI] [PMC free article] [PubMed] [Google Scholar]
- 43. Hou YJ, Okuda K, Edwards CE, Martinez DR, Asakura T, Dinnon KH, Kato T, Lee RE, Yount BL, Mascenik TM, et al. 2020. SARS-CoV-2 reverse genetics reveals a variable infection gradient in the respiratory tract. Cell 182:429–446. doi: 10.1016/j.cell.2020.05.042 [DOI] [PMC free article] [PubMed] [Google Scholar]
- 44. Lukassen S, Chua RL, Trefzer T, Kahn NC, Schneider MA, Muley T, Winter H, Meister M, Veith C, Boots AW, Hennig BP, Kreuter M, Conrad C, Eils R. 2020. SARS-CoV-2 receptor ACE2 and TMPRSS2 are primarily expressed in bronchial transient secretory cells. EMBO J 39:e105114. doi: 10.15252/embj.20105114 [DOI] [PMC free article] [PubMed] [Google Scholar]
- 45. Muus C, Luecken MD, Eraslan G, Sikkema L, Waghray A, Heimberg G, Kobayashi Y, Vaishnav ED, Subramanian A, Smillie C, et al. 2021. Single-cell meta-analysis of SARS-CoV-2 entry genes across tissues and demographics. Nat Med 27:546–559. doi: 10.1038/s41591-020-01227-z [DOI] [PMC free article] [PubMed] [Google Scholar]
- 46. Sungnak W, Huang N, Bécavin C, Berg M, Queen R, Litvinukova M, Talavera-López C, Maatz H, Reichart D, Sampaziotis F, Worlock KB, Yoshida M, Barnes JL, Network HCALB . 2020. SARS-CoV-2 entry factors are highly expressed in nasal epithelial cells together with innate immune genes. Nat Med 26:681–687. doi: 10.1038/s41591-020-0868-6 [DOI] [PMC free article] [PubMed] [Google Scholar]
- 47. Ortiz ME, Thurman A, Pezzulo AA, Leidinger MR, Klesney-Tait JA, Karp PH, Tan P, Wohlford-Lenane C, McCray PB, Meyerholz DK. 2020. Heterogeneous expression of the SARS-coronavirus-2 receptor ACE2 in the human respiratory tract. EBioMedicine 60:102976. doi: 10.1016/j.ebiom.2020.102976 [DOI] [PMC free article] [PubMed] [Google Scholar]
- 48. Carossino M. 2022. Fatal neurodissemination and SARS-CoV-2 tropism in K18-hACE2 mice is only partially dependent on hACE2 expression. Viruses 14. doi: 10.3390/v14030535 [DOI] [PMC free article] [PubMed] [Google Scholar]
- 49. Sato T, Ueha R, Goto T, Yamauchi A, Kondo K, Yamasoba T. 2021. Expression of ACE2 and TMPRSS2 proteins in the upper and lower aerodigestive tracts of rats: implications on COVID 19 infections. Laryngoscope 131:E932–E939. doi: 10.1002/lary.29132 [DOI] [PubMed] [Google Scholar]
- 50. Lean FZX, Cox R, Madslien K, Spiro S, Nymo IH, Bröjer C, Neimanis A, Lawson B, Holmes P, Man C, Folkow LP, Gough J, Ackroyd S, Evans L, Wrigglesworth E, Grimholt U, McElhinney L, Brookes SM, Delahay RJ, Núñez A. 2023. Tissue distribution of angiotensin-converting enzyme 2 (ACE2) receptor in wild animals with a focus on artiodactyls, mustelids and phocids. One Health 16:100492. doi: 10.1016/j.onehlt.2023.100492 [DOI] [PMC free article] [PubMed] [Google Scholar]
- 51. Lean FZX, Núñez A, Spiro S, Priestnall SL, Vreman S, Bailey D, James J, Wrigglesworth E, Suarez-Bonnet A, Conceicao C, Thakur N, Byrne AMP, Ackroyd S, Delahay RJ, van der Poel WHM, Brown IH, Fooks AR, Brookes SM. 2022. Differential susceptibility of SARS-CoV-2 in animals: evidence of ACE2 host receptor distribution in companion animals, livestock and wildlife by immunohistochemical characterisation. Transbound Emerg Dis 69:2275–2286. doi: 10.1111/tbed.14232 [DOI] [PMC free article] [PubMed] [Google Scholar]
- 52. Nelli RK, Roth JA, Gimenez-Lirola LG. 2022. Distribution of coronavirus receptors in the swine respiratory and intestinal tract. Vet Sci 9:500. doi: 10.3390/vetsci9090500 [DOI] [PMC free article] [PubMed] [Google Scholar]
- 53. Lu L, Sikkema RS, Velkers FC, Nieuwenhuijse DF, Fischer EAJ, Meijer PA, Bouwmeester-Vincken N, Rietveld A, Wegdam-Blans MCA, Tolsma P, et al. 2021. Adaptation, spread and transmission of SARS-CoV-2 in farmed minks and associated humans in the Netherlands. Nat Commun 12:6802. doi: 10.1038/s41467-021-27096-9 [DOI] [PMC free article] [PubMed] [Google Scholar]
- 54. Oude Munnink BB, Sikkema RS, Nieuwenhuijse DF, Molenaar RJ, Munger E, Molenkamp R, van der Spek A, Tolsma P, Rietveld A, Brouwer M, et al. 2021. Transmission of SARS-CoV-2 on mink farms between humans and mink and back to humans. Science 371:172–177. doi: 10.1126/science.abe5901 [DOI] [PMC free article] [PubMed] [Google Scholar]
- 55. Yen H-L, Sit THC, Brackman CJ, Chuk SSY, Gu H, Tam KWS, Law PYT, Leung GM, Peiris M, Poon LLM, HKU-SPH study team . 2022. Transmission of SARS-CoV-2 delta variant (AY.127) from pet hamsters to humans, leading to onward human-to-human transmission: a case study. Lancet 399:1070–1078. doi: 10.1016/S0140-6736(22)00326-9 [DOI] [PMC free article] [PubMed] [Google Scholar]
- 56. Cantuti-Castelvetri L, Ojha R, Pedro LD, Djannatian M, Franz J, Kuivanen S, van der Meer F, Kallio K, Kaya T, Anastasina M, et al. 2020. Neuropilin-1 facilitates SARS-CoV-2 cell entry and infectivity. Science 370:856–860. doi: 10.1126/science.abd2985 [DOI] [PMC free article] [PubMed] [Google Scholar]
- 57. Daly JL, Simonetti B, Klein K, Chen K-E, Williamson MK, Antón-Plágaro C, Shoemark DK, Simón-Gracia L, Bauer M, Hollandi R, et al. 2020. Neuropilin-1 is a host factor for SARS-CoV-2 infection. Science 370:861–865. doi: 10.1126/science.abd3072 [DOI] [PMC free article] [PubMed] [Google Scholar]
- 58. Jackson CB, Farzan M, Chen B, Choe H. 2022. Mechanisms of SARS-CoV-2 entry into cells. Nat Rev Mol Cell Biol 23:3–20. doi: 10.1038/s41580-021-00418-x [DOI] [PMC free article] [PubMed] [Google Scholar]
- 59. Wang K, Chen W, Zhang Z, Deng Y, Lian J-Q, Du P, Wei D, Zhang Y, Sun X-X, Gong L, et al. 2020. CD147-spike protein is a novel route for SARS-CoV-2 infection to host cells. Signal Transduct Target Ther 5:283. doi: 10.1038/s41392-020-00426-x [DOI] [PMC free article] [PubMed] [Google Scholar]
- 60. Hoffmann M, Pöhlmann S. 2022. Novel SARS-CoV-2 receptors: ASGR1 and KREMEN1. Cell Res 32:1–2. doi: 10.1038/s41422-021-00603-9 [DOI] [PMC free article] [PubMed] [Google Scholar]
- 61. Wang S, Qiu Z, Hou Y, Deng X, Xu W, Zheng T, Wu P, Xie S, Bian W, Zhang C, Sun Z, Liu K, Shan C, Lin A, Jiang S, Xie Y, Zhou Q, Lu L, Huang J, Li X. 2021. AXL is a candidate receptor for SARS-CoV-2 that promotes infection of pulmonary and bronchial epithelial cells. Cell Res 31:126–140. doi: 10.1038/s41422-020-00460-y [DOI] [PMC free article] [PubMed] [Google Scholar]
- 62. Carlos AJ, Ha DP, Yeh D-W, Van Krieken R, Tseng C-C, Zhang P, Gill P, Machida K, Lee AS. 2021. The chaperone GRP78 is a host auxiliary factor for SARS-CoV-2 and GRP78 depleting antibody blocks viral entry and infection. J Biol Chem 296:100759. doi: 10.1016/j.jbc.2021.100759 [DOI] [PMC free article] [PubMed] [Google Scholar]
- 63. Thépaut M, Luczkowiak J, Vivès C, Labiod N, Bally I, Lasala F, Grimoire Y, Fenel D, Sattin S, Thielens N, Schoehn G, Bernardi A, Delgado R, Fieschi F. 2021. DC/L-SIGN recognition of spike glycoprotein promotes SARS-CoV-2 trans-infection and can be inhibited by a glycomimetic antagonist. PLoS Pathog 17:e1009576. doi: 10.1371/journal.ppat.1009576 [DOI] [PMC free article] [PubMed] [Google Scholar]
- 64. Liu L, Chopra P, Li X, Bouwman KM, Tompkins SM, Wolfert MA, de Vries RP, Boons G-J. 2021. Heparan sulfate proteoglycans as attachment factor for SARS-CoV-2. ACS Cent Sci 7:1009–1018. doi: 10.1021/acscentsci.1c00010 [DOI] [PMC free article] [PubMed] [Google Scholar]
- 65. Nguyen L, McCord KA, Bui DT, Bouwman KM, Kitova EN, Elaish M, Kumawat D, Daskhan GC, Tomris I, Han L, et al. 2022. Sialic acid-containing glycolipids mediate binding and viral entry of SARS-CoV-2. Nat Chem Biol 18:81–90. doi: 10.1038/s41589-021-00924-1 [DOI] [PMC free article] [PubMed] [Google Scholar]
- 66. Zang R, Gomez Castro MF, McCune BT, Zeng Q, Rothlauf PW, Sonnek NM, Liu Z, Brulois KF, Wang X, Greenberg HB, Diamond MS, Ciorba MA, Whelan SPJ, Ding S. 2020. TMPRSS2 and TMPRSS4 promote SARS-CoV-2 infection of human small intestinal enterocytes. Sci Immunol 5:eabc3582. doi: 10.1126/sciimmunol.abc3582 [DOI] [PMC free article] [PubMed] [Google Scholar]
- 67. Zhao M-M, Yang W-L, Yang F-Y, Zhang L, Huang W-J, Hou W, Fan C-F, Jin R-H, Feng Y-M, Wang Y-C, Yang J-K. 2021. Cathepsin L plays a key role in SARS-CoV-2 infection in humans and humanized mice and is a promising target for new drug development. Signal Transduct Target Ther 6:134. doi: 10.1038/s41392-021-00558-8 [DOI] [PMC free article] [PubMed] [Google Scholar]
- 68. Feng A, Bevins S, Chandler J, DeLiberto TJ, Ghai R, Lantz K, Lenoch J, Retchless A, Shriner S, Tang CY, Tong SS, Torchetti M, Uehara A, Wan XF. 2023. Transmission of SARS-CoV-2 in free-ranging white-tailed deer in the United States. Nat Commun 14:4078. doi: 10.1038/s41467-023-39782-x [DOI] [PMC free article] [PubMed] [Google Scholar]
- 69. Caserta LC, Martins M, Butt SL, Hollingshead NA, Covaleda LM, Ahmed S, Everts MRR, Schuler KL, Diel DG. 2023. White-tailed deer Odocoileus Virginianus may serve as a wildlife reservoir for nearly extinct SARS-Cov-2 variants of concern. Proc Natl Acad Sci U S A 120:e2215067120. doi: 10.1073/pnas.2215067120 [DOI] [PMC free article] [PubMed] [Google Scholar]
- 70. Marques AD, Sherrill-Mix S, Everett JK, Adhikari H, Reddy S, Ellis JC, Zeliff H, Greening SS, Cannuscio CC, Strelau KM, Collman RG, Kelly BJ, Rodino KG, Bushman FD, Gagne RB, Anis E. 2022. Multiple introductions of SARS-CoV-2 alpha and delta variants into white-tailed deer in Pennsylvania. mBio 13:e0210122. doi: 10.1128/mbio.02101-22 [DOI] [PMC free article] [PubMed] [Google Scholar]
- 71. Vandegrift DF, Yon M, Surendran Nair M, Gontu A, Ramasamy S, Amirthalingam S, Neerukonda S, Nissly RH, Chothe SK, et al. 2022. SARS-CoV-2 omicron (B.1.1.529) infection of wild white-tailed deer in New York City. Viruses. doi: 10.3390/v14122770 [DOI] [PMC free article] [PubMed] [Google Scholar]
- 72. Martins M, do Nascimento GM, Nooruzzaman M, Yuan F, Chen C, Caserta LC, Miller AD, Whittaker GR, Fang Y, Diel DG. 2022. The omicron variant BA.1.1 presents a lower pathogenicity than B.1 D614G and delta variants in a feline model of SARS-CoV -2 infection. J Virol 96:e0096122. doi: 10.1128/jvi.00961-22 [DOI] [PMC free article] [PubMed] [Google Scholar]
- 73. Jairak W, Chamsai E, Udom K, Charoenkul K, Chaiyawong S, Techakriengkrai N, Tangwangvivat R, Suwannakarn K, Amonsin A. 2022. SARS-CoV-2 delta variant infection in domestic dogs and cats, Thailand. Sci Rep 12:8403. doi: 10.1038/s41598-022-12468-y [DOI] [PMC free article] [PubMed] [Google Scholar]
- 74. Halfmann PJ, Iida S, Iwatsuki-Horimoto K, Maemura T, Kiso M, Scheaffer SM, Darling TL, Joshi A, Loeber S, Singh G, et al. 2022. SARS-CoV-2 omicron virus causes attenuated disease in mice and hamsters. Nature 603:687–692. doi: 10.1038/s41586-022-04441-6 [DOI] [PMC free article] [PubMed] [Google Scholar]
- 75. Cochin M, Luciani L, Touret F, Driouich J-S, Petit P-R, Moureau G, Baronti C, Laprie C, Thirion L, Maes P, Boudewijns R, Neyts J, de Lamballerie X, Nougairède A. 2022. The SARS-CoV-2 alpha variant exhibits comparable fitness to the D614G strain in a syrian hamster model. Commun Biol 5:225. doi: 10.1038/s42003-022-03171-9 [DOI] [PMC free article] [PubMed] [Google Scholar]
- 76. Mohandas S, Yadav PD, Shete A, Nyayanit D, Sapkal G, Lole K, Gupta N. 2021. SARS-CoV-2 delta variant pathogenesis and host response in Syrian Hamsters. Viruses 13:1773. doi: 10.3390/v13091773 [DOI] [PMC free article] [PubMed] [Google Scholar]
- 77. Hoffmann M, Zhang L, Pöhlmann S. 2022. Omicron: master of immune evasion maintains robust ACE2 binding. Signal Transduct Target Ther 7:118. doi: 10.1038/s41392-022-00965-5 [DOI] [PMC free article] [PubMed] [Google Scholar]
- 78. Geng Q, Shi K, Ye G, Zhang W, Aihara H, Li F. 2022. Structural basis for human receptor recognition by SARS-CoV-2 omicron variant BA.1. J Virol 96:e0024922. doi: 10.1128/jvi.00249-22 [DOI] [PMC free article] [PubMed] [Google Scholar]
- 79. Meng B, Abdullahi A, Ferreira IATM, Goonawardane N, Saito A, Kimura I, Yamasoba D, Gerber PP, Fatihi S, Rathore S, et al. 2022. Altered TMPRSS2 usage by SARS-CoV-2 omicron impacts infectivity and fusogenicity. Nature 603:706–714. doi: 10.1038/s41586-022-04474-x [DOI] [PMC free article] [PubMed] [Google Scholar]
- 80. Carossino M, Ip HS, Richt JA, Shultz K, Harper K, Loynachan AT, Del Piero F, Balasuriya UBR. 2020. Detection of SARS-CoV-2 by RNAscope(®) in situ hybridization and immunohistochemistry techniques. Arch Virol 165:2373–2377. doi: 10.1007/s00705-020-04737-w [DOI] [PMC free article] [PubMed] [Google Scholar]
- 81. Bankhead P, Loughrey MB, Fernández JA, Dombrowski Y, McArt DG, Dunne PD, McQuaid S, Gray RT, Murray LJ, Coleman HG, James JA, Salto-Tellez M, Hamilton PW. 2017. Qupath: open source software for digital pathology image analysis. Sci Rep 7:16878. doi: 10.1038/s41598-017-17204-5 [DOI] [PMC free article] [PubMed] [Google Scholar]
Associated Data
This section collects any data citations, data availability statements, or supplementary materials included in this article.
Supplementary Materials
ACE2 and TMPRSS2 mRNA distribution in bronchioles and alveoli of white-tailed deer.
ACE2 and TMPRSS2 mRNA distribution in the NE and ONE of sheep.
ACE2 and TMPRSS2 mRNA distribution in the trachea and bronchi of sheep.
ACE2 and TMPRSS2 mRNA distribution in bronchioles and alveoli of sheep.
ACE2 and TMPRSS2 mRNA distribution in bronchi, bronchioles, and alveoli of pigs.
ACE2 and TMPRSS2 mRNA distribution in bronchioles and alveoli of humans.
Species-specific peptidylprolyl isomerase B (PPIB) and ubiquitin C (UBC) mRNA expression.
Cell detection and subcellular detection algorithms performed for quantitative analysis.
P-values corresponding to the multiple comparisons performed to determine differences in ACE2 and TMPRSS2 mRNA abundance between tissues.
An accounting of the reviewer comments and feedback.
Data Availability Statement
Data from this study are available from the corresponding authors upon request.