

Highlights
-
•
MALDI-ToF profiling after depleting amylase by affinity adsorption.
-
•
Low-abundance proteins observed in the MALDI-ToF spectrum after depleting amylase.
-
•
Improved detection of COVID-19 in saliva after depleting amylase.
Keywords: Saliva, MALDI-ToF MS, Amylase, High-abundance, Low-abundance, COVID-19
Abstract
Introduction
Human saliva contains a wealth of proteins that can be monitored for disease diagnosis and progression. Saliva, which is easy to collect, has been extensively studied for the diagnosis of numerous systemic and infectious diseases. However, the presence of amylase, the most abundant protein in saliva, can obscure the detection of low-abundance proteins by matrix-assisted laser desorption/ionization-time of flight mass spectrometry (MALDI-ToF MS), thus reducing its diagnostic utility.
Objectives
In this study, we used a device to deplete salivary amylase from water-gargle samples by affinity adsorption. Following depletion, saliva proteome profiling was performed using MALDI-ToF MS on gargle samples from individuals confirmed to have COVID-19 based on nasopharyngeal (NP) swab reverse transcription quantitative polymerase chain reaction (RT-qPCR).
Results
The depletion of amylase led to increased signal intensities of various peaks and the detection of previously unobserved peaks in the MALDI-ToF MS spectra. The overall specificity and sensitivity after amylase depletion were 100% and 85.17%, respectively, for detecting COVID-19.
Conclusion
This simple, rapid, and inexpensive technique for depleting salivary amylase can reveal spectral diversity in saliva using MALDI-ToF MS, expose low-abundance proteins, and assist in establishing novel biomarkers for diseases.
Introduction
Saliva is a complex biological fluid consisting of a mixture of major and minor salivary gland secretions, nasal and bronchial secretions, plasma filtrates, host cells, and bacteria. The fluid is slightly acidic and comprises various organic components such as proteins, hormones, nucleic acids, and fatty acids, as well as inorganic constituents including sodium (Na+,), potassium (K+,), chloride (Cl–,), calcium (Ca2+,), bicarbonate (HCO3–), phosphate (H2PO4–), iodide (I–), magnesium (Mg2+), and ammonium (NH4+) [1], [2], [3], [4].
Often referred to as the “mirror of the body,” saliva reflects both the physiological and pathological states of the body. Saliva has been successfully utilized for screening [5], [6] diagnosis [7], [8] prognosis, and monitoring [9], [10] of various human diseases. Its collection is quick, non-invasive, and can be completed by the subjects themselves. Additionally, saliva doesn't require a transport medium and needs minimal processing before testing as compared to other specimen types [11], [12]. Significant advancements in salivary diagnostics include RNA-sequencing, point-of-care technologies, liquid biopsies, and protein profiling [13].
Proteomic analysis of saliva has led to discovering roughly 3,000 proteins, including mucins, proline-rich proteins, histatins, statherins, cystatins, interleukins, amylase, albumin, and immunoglobulins, among others [3], [14]. Many of these proteins are currently being explored as biomarkers for oral diseases [15], [16], various cancers [17], [18], Sjogren's syndrome [19], and even autism [20]. Saliva has been used to detect viruses like hepatitis B virus [21], human immunodeficiency virus [22], dengue [23], and, more recently, severe acute respiratory syndrome coronavirus type-2 (SARS-CoV-2) [1], [4], [24]. Numerous studies have shown a higher efficiency in detecting SARS-CoV-2 in saliva compared to nasopharyngeal swabs, primarily due to the abundant expression of the angiotensin-converting enzyme-2 (ACE-2) receptor, the entry point for the SARS-CoV-2 virus, in the oral epithelial cells [25], [26], [27]. Some research points to SARS-CoV-2 being detectable 1–5 days earlier in saliva samples than in nasopharyngeal swabs [28].
A significant challenge in the proteomic analysis of saliva is the presence of high-abundance proteins, which can obscure lower-level target proteins. Salivary α-amylases, albumin, and immunoglobulins alone comprise up to 75 % of the total saliva proteome. It is, therefore, crucial to either deplete high-abundance proteins or enrich low-abundance proteins to enhance detection sensitivity [1], [3], [29]. For instance, non-analyte, high-abundance proteins can cause significant ion suppression for low-abundance biomarkers in mass spectrometric techniques. Particularly in a complex biological matrix, ionization efficiencies are profoundly influenced by the proteins' abundance, molecular weight, and chemistry [30].
Salivary α-amylase, the most abundant protein in saliva, is an enzyme involved in breaking down starch and other polysaccharides. It exists in two proteoforms: non-glycosylated (∼56 kDa) and glycosylated (∼59 kDa) [31], [32], [33]. Various techniques are employed for α-amylase depletion, including the use of a syringe-based potato starch device [34], gel filtration [35], affinity chromatography with lectin ConA [31], co-precipitation and paper-based chips [36]. Deutsch et al. developed a patented device that utilizes affinity adsorption to potato starch [34] for the separation of salivary α-amylase from whole saliva. This device demonstrated a six-fold reduction in amylase levels compared to the total amylase in saliva, resulting in a 97 % reduction in amylase activity [34]. Validation studies by Xiao et al. and Crosara et al. confirmed the functionality and practicality of the device using SDS-PAGE and western blotting. Notably, after amylase removal, several potential biomarkers including desmoplakin, short palate lung and nasal epithelium carcinoma-associated protein 2, mucin-7, and several immunoglobulin isoforms were clearly detected [37], [2].
In our previous study, we demonstrated the effectiveness of using matrix-assisted laser desorption-ionization time of flight mass spectrometry (MALDI-ToF MS) to distinguish between COVID-19 (coronavirus disease 2019) positive and negative individuals [38]. However, the presence of salivary amylase posed a challenge by dominating the protein profiles and suppressing the detection of other proteins. To address this, we hypothesized that depleting salivary α-amylase from gargle samples before MALDI-ToF MS analysis would improve the visualization and detection of low-abundance proteins. By combining the simple removal of amylase through affinity adsorption with potato starch and the sensitivity of MALDI-ToF MS, we sought to uncover new protein biomarkers in saliva-based diagnostics. In addition to amylase depletion, our secondary goal was to optimize the sample preparation process, specifically the viral disruption buffer. While we previously used LBSD-X buffer from MAPSciences (Bedford, UK) for viral disruption in our COVID-19 testing, its availability is limited and exact composition is unknown. Therefore, we adopted the viral disruption buffer reported by Dollman et al., which has been successfully used in detecting SARS-CoV-2 and other viruses such as H1N1 and H3N2 [39], [40], [41]. To evaluate the diagnostic usefulness of our method, we included analysis of five additional viruses, including H1N1 and four known coronaviruses, to ensure the ability to distinguish between these viruses and COVID-19. Our overall objective was to develop a simple, rapid, and cost-effective technique for depleting salivary amylase and detecting COVID-19 through MALDI-ToF MS protein profiling
Materials and method
Ethical and Biosafety statement
The study was approved by the Institutional Review Board and Institutional Biosafety Committee of Northern Illinois University (approved on August 12, 2020, and revised on July 12, 2021, and August 11, 2022). Informed consent was obtained from the volunteers who participated in the study. The collected information was strictly limited to demographics, COVID-19 vaccination status, symptoms, and RT-qPCR results. Sample handling and processing were conducted under a Class II Biosafety Cabinet. All methods were performed in accordance with the relevant guidelines and regulations.
Sample collection
During the period from June 2021 to July 2022, samples were collected at drive-thru testing sites conducted by the Illinois Department of Public Health (IDPH) in Aurora and Rockford, Illinois. NP swabs were collected from individuals and analyzed by RT-qPCR to detect the presence of SARS-CoV-2 at an IDPH laboratory. The results from RT-qPCR testing were categorized as Detected, Not detected, or Inconclusive. Participants who consented to participate in the research study were also asked to provide a water gargle sample at the same time as the NP swab collection. They were instructed to gargle with 10 mL of bottled spring water for 30 s, which was then collected in a 50 mL conical centrifuge tube. These gargle samples were stored at − 20 °C until further processing and analysis. To ensure an adequate representation of COVID-19 positive samples, a total of 107 gargle samples were collected. Among these samples, only 14 were reported as positive for COVID-19 by IDPH. In order to maintain a balanced distribution of samples from both COVID-19 positive and negative subjects, 14 gargle samples from COVID-19 positive individuals were included, along with 14 gargle samples from COVID-19 negative individuals, for further analysis. The protein profiles obtained from MALDI-ToF MS analysis of these 28 gargle samples are included in this study to illustrate the effects of the amylase depleting device.
Preparation of samples and controls
-
i.
Gargle samples:
The gargle samples were thawed and transferred to a 30 mL disposable polypropylene beaker (Fisher Scientific, Waltham, MA). Samples were filtered through a 0.45 µm polyethersulfone membrane filter (Celltreat Scientific Products, Pepperell, MA), divided equally and transferred into two 50 mL tubes (approximately 5 mL of gargle samples in each tube).
Amylase removal using potato starch
The filtered gargle sample from one tube was hand-pressed through an amylase depleting device, with modifications to a previously described apparatus [34]. The device comprised a 10 mL plastic syringe (Thermo scientific, Rockwood, TN) with a 0.45 µm syringe filter fixed at the tip (Fig. 1).
Fig. 1.

An illustration of salivary amylase depleting device loaded with a gargle sample (Created with BioRender.com).
To prepare the amylase depleting device, a syringe was filled with a slurry containing 2 g of potato starch (Sigma-Aldrich, St. Louis, MO) in 20 mL of LC-MS grade H2O (OmniSolv, Sigma-Aldrich, St. Louis, MO). The slurry was pressed through the setup by hand to ensure the substrate was adequately moistened and to remove any water-soluble residues. To determine the optimal amount of water required to wash off all water-soluble starch residues, 5 mL of LC-MS grade water was passed through the device, resulting in a total volume of 30 mL after collection. An iodine reagent (0.15 M I2 + 0.3 M KI; 10 μL) was then added to 1 mL of each collected filtrate, and absorbance was measured using a UV–Vis spectrometer (UV-2600, Shimadzu). Next, 5 mL of the filtered gargle sample was filtered by pressing it through the slurry filled syringe column. The eluent, totaling 5 mL, was collected in a new 50 mL tube (Fig. 1). For the aliquot that did not undergo amylase depletion, 5 mL of chilled acetone (Sigma-Aldrich, St. Louis, MO) was added to precipitate proteins. Acetone was added directly to the other aliquot that did not go through amylase depletion. The samples were centrifuged using a Beckman Coulter Avanti J-E series centrifuge with a JA-20 rotor at 16,000 × g for 30 min at 4 °C. The supernatant was discarded, the rim of the tube patted dry, and the pellet was resuspended in 50 μL of a viral disruption buffer reported by Dollman et al. This buffer consisted of 50 mM ammonium bicarbonate (Sigma-Aldrich, St. Louis, MO), 10 % acetonitrile (Oakwood Chemical, Estill, SC), 50 mM TCEP (Sigma-Aldrich, St. Louis, MO), and 5 mM octyl ß-D-glucopyranoside (Sigma-Aldrich, St. Louis, MO) at pH 7.5 [39]. The resuspended pellets were vortexed for 30 s and then incubated at room temperature for 15 min.
-
ii.
Standards and controls:
As a negative control, pooled human saliva (pre-COVID-19) collected before November 2019 (Lee Biosolutions, Maryland Heights, MO) was used. For the control, 500 µL of thawed stock was spiked into 10 mL of water. The control sample was filtered, processed as a gargle sample, and subjected to amylase depletion following the previously described method. To assess the efficacy of the amylase depleting device, protein standards were used. Two hundred picomoles (pmol) of human serum IgA, 200 pmol of human serum albumin (HSA), and 2000 pmol of human amylase (Sigma-Aldrich, St. Louis, MO) in LC-MS grade H2O were passed through the amylase depleting device. The protein standards and their respective eluents were then lyophilized overnight and reconstituted in 10 µL of the viral disruption buffer. For MALDI-ToF MS analysis, 20 pmol of IgA, 20 pmol of HSA, and 200 pmol of amylase were spotted as final concentrations.
Sample spotting
For spotting the samples onto the MALDI-ToF MS target plate (Shimadzu, Kyoto, Japan), the sandwich method was employed. This method involved spotting 1 µL of matrix, followed by 1 µL of the sample, and another 1 µL of matrix. In this case, sinapinic acid (Sigma-Aldrich, St. Louis, MO) was used as the matrix. The sinapinic acid was prepared at a concentration of 20 mg/mL in a solution consisting of LC-MS grade water and acetonitrile in a 1:1 ratio, along with 0.1 % trifluoroacetic acid (Sigma-Aldrich, St. Louis, MO). Sinapinic acid is a commonly used matrix for MALDI-ToF MS protein analysis. The matrix was freshly prepared every seven days and stored at 4 °C between analyses.
Instrument parameters
The Shimadzu AXIMA Performance MALDI-ToF MS (Shimadzu Kratos Analytical, Manchester, UK) was utilized for MS acquisition. The instrument was equipped with a nitrogen laser set at 337.1 nm, with a pulse width of 3 ns and a maximum repetition rate of 60 Hz. Operation of the AXIMA Performance mass spectrometer was controlled by Shimadzu Biotech Launchpad Software (version 2.9.4) and performed in positive-ion linear detection mode. During data acquisition, the laser power was set to 100 µJ/pulse, and the repetition rate was set to 50 Hz. Spectra were acquired in the mass range of 2,000–200,000 m/z by summing 5000 spectra (250 profiles by 20 shots). Pulse extraction was set to 50,000 m/z, and the ion gate was set to exclude values below 1500 m/z. Subsequently, post-acquisition baseline subtraction and smoothing, using a Gaussian function, were applied using Shimadzu Biotech Launchpad software.
Instrument calibration
The Shimadzu AXIMA Performance MALDI-ToF MS instrument was calibrated daily using the (M + H)+ and (M + 2H)2+ peaks of the ProteoMass Apomyoglobin MALDI-MS Standard (Sigma-Aldrich, St. Louis, MS). The standard was prepared at a concentration of 100 pmol/µL in LC-MS grade water. Throughout the analysis, the signal intensities of the calibrant were continuously monitored to assess the inter-day performance of the instrument. Calibration was considered successful if the mass deviation was within a range of less than 500 mDa.
Data analysis
Using Shimadzu Biotech Launchpad, a text file was exported for each gargle sample that underwent amylase depletion. These files contained the spectrum of mass-to-charge (m/z) values ranging from 2,000 m/z to 200,000 m/z, along with the corresponding ion count intensities. The area under the curve (AUC) was calculated as described in a previous study, where specific biomarker ranges (11,140–11,160 m/z, 23,550–23,800 m/z, 27,900–29,400 m/z, 55,500–59,000 m/z, 66,400–68,100 m/z, 78,600–80,500 m/z, 111,500–115,500 m/z) were identified as potentially indicative of host immune proteins or viral proteins. To determine the AUC, ion counts within each subrange were integrated using the composite Simpson's rule, resulting in features for each data sample. The AUC values were computed for each spectral range [38]. The 11,140–11,160 m/z peak served as an internal control to confirm successful sample collection and processing. The areas under the peaks at 11,140–11,160 m/z and 78,600–80,500 m/z (approximate theoretical m/z of the S1 fragment of the SARS-CoV-2 spike protein) were calculated for all the samples that underwent amylase depletion. For further analysis, receiver operating characteristic (ROC) curve analysis was performed using Medcalc software (Belgium). This analysis involved plotting the true positive rate (sensitivity) on the Y-axis against the false positive rate (100-specificity) on the X-axis for each observed AUC value for the peaks at 11,140–11,160 m/z and 78,600–80,500 m/z.
SDS-PAGE analysis
To assess the efficacy of the amylase depletion, the reconstituted pellets obtained after the depletion process were analyzed using 8 % Bis-Tris Plus acrylamide gels (Invitrogen, Waltham, MA). The gels were run for 35 min at 150 V using MES SDS running buffer (Novex, Waltham, MA). Gargle samples (20 µL) before and after passing through the amylase depleting device, as well as protein standards of amylase (14 µg), HSA (2.5 µg), and IgA (3.5 µg), were analyzed on the gels under reducing conditions. After the gel run, the gels were stained using a 0.1 % w/v PhastGel Blue R (Amersham Biosciences, Uppsala Sweden) for 20 min, followed by destaining with a solution containing 30 % v/v methanol (ACS grade) and 10 % v/v acetic acid (ACS grade) in Milli-Q water for 45 min. The protein bands were visualized to evaluate the efficiency of the amylase depletion process.
Results
The starch bed selectively binds amylase
To evaluate the impact of the amylase depleting device on the detection of other proteins in saliva, we conducted tests using individual protein standards that are present in high abundance in saliva. These standards included salivary amylase, HSA, and IgA. When the standard amylase was passed through the amylase depleting device, the eluent collected showed a negligible signal at the theoretical m/z value of the parent peak. This confirmed the efficient removal of amylase, as expected (Fig. 2). Moreover, when HSA and IgA were passed through the device, minimal to no binding or interaction was observed between the starch bed and these two proteins (Fig. 3, Fig. 4). These spectra indicated that the starch bed selectively binds amylase with minimal loss of other proteins. Subsequently, we tested the negative control, pre-COVID-19 saliva, by passing it through the amylase depleting device. The protein profiles of the negative control before and after passing through the device showed noticeable differences (Fig. 5). The intensity of the peak at approximately 56,216 m/z, which corresponds to the theoretical molecular weight of salivary amylase, was considerably reduced after passing through the device. Conversely, the peak around 66,000 m/z was enhanced, and a low-intensity peak between 56,000–58,000 m/z was retained in the eluent. Comparing Fig. 2, Fig. 4, this signal corresponded to the heavy chain of salivary IgA, which was not retained on the starch bed. These findings indicate that the amylase depleting device selectively binds amylase while preserving other proteins of interest, demonstrating its effectiveness in amylase removal without significant loss of other proteins.
Fig. 2.

Standard amylase before and after passing through amylase depleting device. MALDI-ToF MS spectra of standard amylase in (—blue) and an overlay of the same sample after passing through the amylase depleting device (—red). No peak was observed at 56,000 m/z after passing through the device, confirming the binding between the starch bed and salivary amylase. (For interpretation of the references to color in this figure legend, the reader is referred to the web version of this article.)
Fig. 3.

Standard HSA before and after passing through amylase depleting device. MALDI-ToF MS spectra of standard HSA in (—blue) and an overlay of the same sample after passing through the amylase depleting device (—red). The peaks at 66,995 m/z and 33,592 m/z which correspond to the single- and double-charged peaks of HSA, respectively, were observed with similar signal intensities before and after using the amylase depleting device. (For interpretation of the references to color in this figure legend, the reader is referred to the web version of this article.)
Fig. 4.

Standard IgA before and after passing through amylase depleting device. MALDI-ToF MS spectra of a standard human serum IgA in (—blue) and an overlay of the same sample after passing through the amylase depleting device (—red). The peaks at 23,397 and 57,197 m/z which correspond to the light chain and heavy chain peaks of IgA respectively, can be observed with similar signal intensities before and after using the amylase depleting device. The peak at 46,428 m/z is the dimer of the IgA light chains. (For interpretation of the references to color in this figure legend, the reader is referred to the web version of this article.)
Fig. 5.

COVID-19 negative control saliva before and after amylase depletion. MALDI-ToF MS spectra of pre-COVID-19 saliva in (—blue) and an overlay of the same sample after passing through the amylase depleting device(—red). The peak at 56,216 m/z which corresponds to the presence of amylase, was significantly reduced in the sample’s eluent. Interestingly, the peak at 66,867 m/z was significantly enhanced in the eluent. (For interpretation of the references to color in this figure legend, the reader is referred to the web version of this article.)
To further analyze the effects of passing gargle samples through the amylase depleting device, we conducted an SDS-PAGE analysis. Fig. 6 shows the positions of the bands for protein standards HSA, amylase, and IgA. In the case of IgA, there are two bands around ∼ 55 kDa and ∼ 25 kDa, representing the heavy and light chains, respectively (Lane 4). Comparing the positions of these standard proteins, it is evident that the band between 50 and 60 kDa in the gargle sample (Lane 5) decreased in intensity after passing through the amylase depleting device, as observed in Lane 6. Additionally, most of the other bands were still visible in Lane 6. This aligns with the MALDI-ToF MS spectra of the negative control, where the peak between 55,500–59,000 m/z substantially decreased in intensity after passing the gargle samples through the amylase depleting device (Fig. 5). As previously observed, selective binding of the starch bed occurs only with amylase, while other proteins show minimal loss in signal intensity on MALDI-ToF MS. Hence, we can conclude that the band observed to deplete between 50 and 60 kDa in the SDS-PAGE gel corresponds to amylase. Nonetheless, in Lane 6, we can still observe the light chains of immunoglobulins along with various other bands, indicating the preservation of the remaining proteome. There is some overall protein loss in the gargle samples due to the additional step of amylase depletion. However, when analyzing the eluents on a sensitive instrument like MALDI-ToF MS, we can still observe the presence of other proteins even after amylase depletion.
Fig. 6.
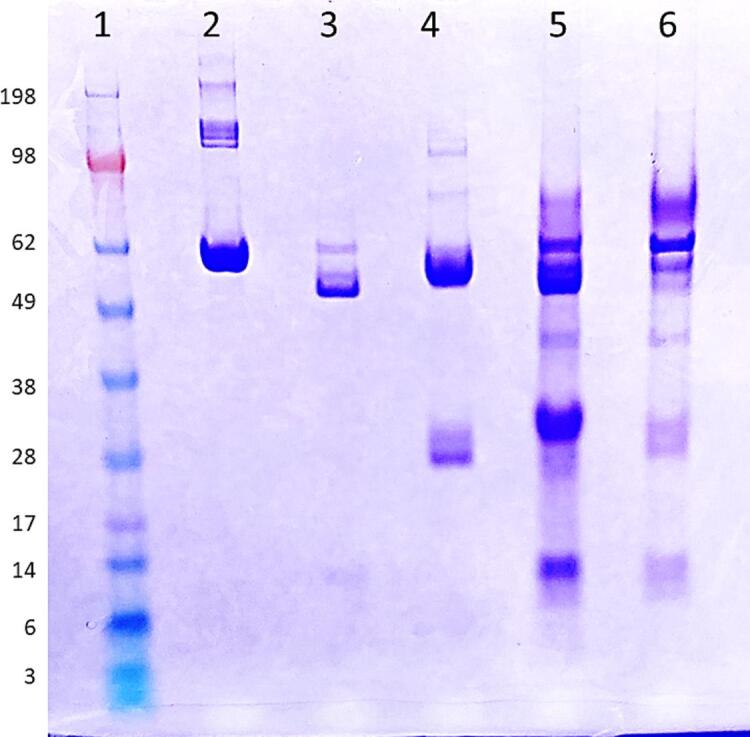
SDS-PAGE analysis of high-abundance proteins in human saliva and an example gargle sample stained with Coomassie-Brilliant-Blue under reducing conditions. Lane 1: Standard protein ladder. Lane 2: HSA (2.5 μg), Lane 3: salivary amylase (14 μg), Lane 4: IgA (3.5 μg). Lane 5: gargle sample before passing through amylase depleting device Lane 6: same gargle sample after passing through the device (eluent). (For interpretation of the references to color in this figure legend, the reader is referred to the web version of this article.)
The starch bed depletes amylase from saliva and unmasks other peaks
In the gargle samples obtained from subjects, we observed a significant reduction in signal intensity between 55,500 and 59,000 m/z in the MALDI-ToF MS profiles of COVID-19 positive samples after passing through the amylase depleting device (Fig. 7). This suggests that the ions contributing to this peak are attributed to amylase and are reduced in number when utilizing the amylase depleting device. Conversely, the peak around 66,000 m/z (alongside several other peaks) was notably enhanced in these eluents. These findings support the hypothesis that amylase depletion unmasks signals from multiple proteins in saliva.
Fig. 7.

COVID-19 positive gargle sample before and after amylase depletion. MALDI-ToF MS spectra of a representative gargle sample from a COVID-19 positive donor (—red) and an overlay of the same sample after passage through the amylase depleting device (—green). (For interpretation of the references to color in this figure legend, the reader is referred to the web version of this article.)
We further compared the eluents obtained from COVID-19 positive and negative gargle samples (Fig. 8). As anticipated, the profiles of COVID-19 positive samples exhibited more numerous and higher intensity peaks compared to the profiles of COVID-19 negative samples, even after amylase depletion. Specifically, the peaks corresponding to the presumed viral proteins in the established ranges of 66,400–68,100 and 78,600–80,500 m/z remained significantly higher in COVID-19 positive gargle samples compared to COVID-19 negative samples. This suggests that the ability to detect viral proteins in the spectra was not affected by amylase depletion. To support this observation, we performed SDS-PAGE analysis to compare clinically confirmed COVID-19 positive and negative samples (Fig. S1). The eluents from both COVID-19 positive and negative samples (Lane 3 and Lane 5) showed a reduction in band intensity around 60 kDa, which corresponds closely to the theoretical weight of salivary amylase. Moreover, the rest of the proteome remained preserved and visible using the Coomassie Brilliant Blue staining method.
Fig. 8.

COVID-19 positive and negative gargle sample after amylase depletion. Representative MALDI-ToF MS spectra of gargle samples from a COVID-19 positive donor eluent (—red) and COVID-19 negative donor eluent (—green). Panel A is the full-range mass spectra of the samples. Panels B and C show specific ranges where differences in mass spectra are observed between COVID-19 positive eluent and COVID-19 negative eluent samples after amylase depletion. (For interpretation of the references to color in this figure legend, the reader is referred to the web version of this article.)
Sensitivity and specificity of SARS-COV-2 detection after amylase depletion
The signal intensities of the sample files were normalized by dividing them by the peak intensity of the (M + H)+ peak of apomyoglobin, which was used for daily instrument calibration. The areas of the peaks in the 11,140–11,160 m/z (quality control peak present in saliva irrespective of COVID-19 status) and 78,600–80,500 m/z (S1 spike protein of SARS-CoV-2) ranges were calculated using Simpson's rule, as described in our previous study [38]. Simpson's rule is a numerical method for approximating the definite integral of a function which is based on approximating the AUC using quadratic polynomials. It involves dividing the interval of integration into an even number of subintervals and evaluating the function at the endpoints and midpoints of these subintervals. The approximate value of the integral is then obtained by summing the weighted values of these function values [42]. To determine the appropriate cut-off for classifying a sample as COVID-19 positive or negative, ROC curve analysis was performed. The disease prevalence assumed for generating the ROC plot was 10 %, based on data from the CDC’s COVID-19 data tracker. The analysis of peaks in the 11,140–11,160 m/z range indicated that they did not reliably discriminate between COVID-19 negative and positive samples (AUC 0.77, threshold of 4.44).
Peaks in the range of 78,600–80,500 m/z that represent the S1 spike protein of SARS-CoV-2 showed good discrimination between COVID-19 positive and negative specimens (AUC 0.893, threshold of 10.14) after amylase depletion. Using a threshold area of 10.14, the sensitivity and specificity of COVID-19 detection was 85.71 % and 100 %, respectively (Fig. 9).
Fig. 9.

ROC analysis of the biomarker ranges 11,140–11,160 m/z and 78,600–80,500 m/z after amylase depletion. In the plot, each point represents a MALDI-ToF MS specificity/sensitivity value at a cutoff AUC for each potential biomarker range, with the highest specificity/sensitivity and discriminating power having values near the top left of each plot.
The sensitivity of SARS-CoV-2 detection after amylase depletion was found to be slightly lower than expected when compared to RT-PCR. This discrepancy could be attributed to the possibility that some of the selected positive samples had low viral loads. The IDPH reports positive cases as “detected” but does not provide Ct values, which are typically used to assess the viral load level. To properly estimate the realistic sensitivity of the MALDI-ToF MS method for detecting SARS-CoV-2, further studies with a larger number of samples and the inclusion of Ct values from positive samples are necessary. This would allow for a better understanding of the sensitivity and performance of the MALDI-ToF MS method in detecting SARS-CoV-2.
To evaluate how the amylase depletion process impacted the sensitivity and specificity of our method, we analyzed the AUC values of the two peaks (11,140–11,160 m/z and 78,600–80,500 m/z) for the same set of samples before amylase depletion (Fig. 10). The results showed an improvement in the detection of COVID-19 after depleting amylase, as the specificity increased from 57.12 %, while the sensitivity remained at 85.71 %. This observation supports the hypothesis that the signal intensities of disease biomarkers (such as 78,600–80,500 m/z in this case) were being suppressed due to the high abundance of amylase in the gargle samples. The normalized AUC values for before and after amylase depletion can be found in the Supplementary table.
Fig. 10.

ROC analysis of the biomarker ranges 11,140–11,160 m/z and 78,600–80,500 m/z before amylase depletion. In the plot, each point represents a MALDI-ToF MS specificity/sensitivity value at a cutoff AUC for each potential biomarker range, with the highest specificity/sensitivity and discriminating power having values near the top left of each plot.
Discussion
The presence of high-abundance proteins in proteomic analysis using MALDI-ToF MS can hinder the detection of low-abundance proteins, which are potential candidates for disease diagnosis. This challenge also applies to saliva samples, where amylase is one of the high-abundance proteins. To address this issue, we developed a simple and cost-effective method to deplete salivary amylase in COVID-19 gargle samples before MALDI-ToF MS analysis. By removing amylase, we aimed to improve the detection of low-abundance proteins and facilitate biomarker discovery for disease diagnosis.
Deutsch et al. developed an amylase depleting device that incorporates a 0.45 μm paper filter at the tip of the syringe [34]. In our initial efforts in preparing and utilizing this apparatus, we experienced difficulty when removing the plunger between starch activation and sample loading. To address this, we replaced the paper filter with a 0.45 μm syringe filter (Fig. 1), which minimized disturbances to the potato starch bed during plunger release. To eliminate any potential interference or ion suppression caused by water-soluble residues within the potato starch, we passed larger volumes of water through the device before sample loading. This step was aimed at removing these residues, which may affect protein ionization or interfere with amylase adsorption (Fig. 11). The presence of starch was confirmed using an iodine reagent, which produces a deep blue color in the presence of starch. Panel A of Fig. 11 clearly shows the absence of starch after passing 20 mL of water, which was also confirmed using a UV–Vis spectrometer shown in Fig. 11, Panel B. Therefore, we passed 20 mL of water through the device before loading any gargle samples, standards, or controls to significantly decrease water-soluble residues in the starch. These additional washing steps were crucial to prevent ion suppression of proteins during MALDI-ToF MS analysis resulting from water-soluble starch residues. The influence of starch type and structure on its interaction with amylase is not well understood, and the Michaelis-Menten model cannot be directly applied to in-vitro studies of amylase action due to uncertainties in the substrate's (starch) structure, the possible presence of inhibitors, and the high enzymatic activity [43], [44].
Fig. 11.

Iodine test to determine the presence of starch after multiple water washes. The gradual color change in Panel A and the overall decrease in the absorbance in the UV–Vis spectra in Panel B confirmed the reduction in water-soluble starch residues present in starch.
In previous studies, we utilized LBSD-X buffer (MAPSciences, Bedford, UK) to effectively lyse viral particles in saliva. However, due to supply chain issues, this buffer has become less readily available. As a result, we turned to a previously reported buffer for viral reconstitution as an alternative [39]. To optimize this buffer, we made specific substitutions, replacing 2 mM dithiothreitol with 50 mM TCEP, and implementing a simpler method by substituting sonication with a simple vortex and reducing the incubation time to 15 min at room temperature. This modified buffer showed promising results, as we observed the expected peaks within the established ranges (11,140–11,160 m/z; 23,550–23,800 m/z; 27,900–29,400 m/z; 55,500–59,000 m/z; 66,400–68,100 m/z; 78,600–80,500 m/z; and 111,500–115,500 m/z; Fig. 12). Additionally, we were able to observe differences between COVID-19 positive and negative gargle samples (Fig. 8), further demonstrating the effectiveness of the modified buffer.
Fig. 12.

Comparison between the LBSD-X buffer and the newly optimized viral disruption buffer. MALDI-ToF MS spectra of a COVID-19 positive gargle treated with LBSD-X buffer (—red) and an overlay of the same sample treated with the new optimized buffer (—blue). Panel A is the full-range mass spectra of the same positive sample treated with both buffers. The optimized buffer showed peaks in the ranges that were established in our previous study. Panels B and C are specific ranges in mass spectra where the peaks obtained by both the buffers closely overlap with each other. (For interpretation of the references to color in this figure legend, the reader is referred to the web version of this article.)
By analyzing the peak areas in the eluents of COVID-19 positive and negative gargle samples, we found that the samples could be differentiated based on the 78,600–80,500 m/z range, which corresponds to the theoretical m/z value of the S1 fragment of the spike protein of SARS-CoV-2. Furthermore, we performed an ROC curve analysis to determine a cut-off threshold for the peak area, establishing its diagnostic utility. A threshold of > 10.14 units for the 78,600–80,500 m/z range resulted in a specificity of 100 % and a sensitivity of 85.17 % for COVID-19 positivity.
In our previous study, we established the presence of five biomarkers. However, for this study, we focused specifically on the m/z range of 78,600–80,500, which includes the S1 fragment of the spike protein of SARS-CoV-2. The peaks in the 55,500–59,000 m/z range and the 27,900–29,400 m/z range are attributed to the singly and doubly charged peaks of overlapping IgA heavy chain and amylase. We observed that these peaks were depleted after passing through the amylase depleting device, as the starch bed showed specific affinity towards amylase. This selective binding was confirmed when the standard IgA and amylase were passed individually through the amylase depleting device, with minimal difference in intensity observed for IgA (Fig. 2, Fig. 4). Therefore, it is important to consider the presence of two proteins in the ranges of 55,500–59,000 m/z and 27,900–29,400 m/z, of which only one protein (amylase) is affected by depletion. Among the other established biomarkers, the m/z range of 66,400–68,100 includes albumin and the S2 fragment of the spike protein. However, the S2 fragment overlaps with the peak of host saliva albumin (approximately 66,348 kDa). Therefore, in this study, we focused on evaluating the performance of the amylase depleting device using only the biomarker range corresponding to the S1 fragment (78,600–80,500 m/z) for COVID-19 diagnosis. Comparing the ROC curves in Fig. 9, Fig. 10, we observed that the viral protein within this range is effectively retained after amylase depletion and provides higher sensitivity for COVID-19 diagnosis.
In addition to the selection of biomarker ranges, we also examined the changes in AUC values before and after amylase depletion, which are provided in the Supplementary table. The normalized AUC values for the 78,600–80,500 m/z region showed variability among the 14 positive samples. This variability may be attributed to the different stages of the SARS-CoV-2 infection cycle at the time of gargle sample collection. The varying stages of infection, as well as the host’s immune response, can influence the abundance of the virus and, consequently, the signal intensities of viral proteins. Furthermore, the different levels of amylase abundance in each gargle sample could impact the extent of ion suppression of other peaks. Each MALDI-ToF MS spectrum of COVID-19 samples exhibited variability in peak signals, and the occasional presence of additional peaks, resulting in distinct profiles for each sample. However, despite this variability, ROC curve analysis allowed us to achieve high sensitivity and specificity. The variability in AUC values for the 11,140–11,160 m/z range, which serves as the quality control peak, did not significantly affect the study
The utilization of the amylase depleting device did result in some protein loss. However, we observed the effects of amylase depletion on the intensities of other proteins, as indicated by the presence of additional peaks in the eluents of amylase-depleted gargle samples. These peaks were previously suppressed in non-depleted samples due to the ions from amylase. Further investigations are necessary to characterize these peaks and determine their potential significance in disease and normal conditions. Discovery-based (untargeted) LC-MS/MS methods utilizing a bottom-up proteomics approach could be employed to map protein hits to the m/z values of these enhanced peaks observed in the MALDI-ToF MS profiles. Additionally, targeted LC-MS/MS methods could be implemented to detect proteotypic peptides for both host and viral proteins, including those identified within the five established biomarker ranges as well as the proteins associated with these newly enhanced signals.
Although it was challenging to obtain saliva or gargle samples infected with specific viruses, we demonstrated the effectiveness of protein profiling using MALDI-ToF MS in differentiating between viral infections. Figs. S2, S3, and S4 in the Supplementary Information showcase the differences in protein profiles of viruses such as H1N1, Middle Eastern Respiratory Syndrome Coronavirus (MERS-CoV), and common coronaviruses (HCoV-NL63, HCoV-OC43, and HCoV-229E) compared to SARS-CoV-2. These viral samples were obtained from BEI Resources (Manassas, VA) and consisted of irradiated cell lysates and supernatant from cells infected with each respective virus. Despite the challenges in acquiring saliva or gargle samples infected with these viruses, the data clearly demonstrate the effectiveness of protein profiling using MALDI-ToF MS. For instance, the H1N1 virus, a subtype of influenza A, was included in the analysis due to the overlapping symptoms observed in H1N1 and COVID-19 infections [45], [46]. The protein profiles of H1N1 influenza viruses were distinct from those of SARS-CoV-2, confirming the ability to differentiate SARS-CoV-2 from the H1N1 infections. Additionally, we examined the protein profiles of the human coronaviruses HCoV-OC43, HCoV-HKU1, HCoV-229E, and HCoV-NL63, which cause a mild range of symptoms and are self-limiting to upper respiratory tract infections [47], and compared them to SARS-CoV-2. The MALDI-ToF MS spectra clearly demonstrated unique protein profiles for each of these coronaviruses, highlighting their distinguishable features from SARS-CoV-2. These findings demonstrate the potential of MALDI-ToF MS for the differentiation of viral infections based on protein profiling.
This study demonstrates the potential application of the amylase depletion method using potato starch columns for the diagnosis of COVID-19. While previous studies have successfully depleted salivary amylase, this is the first report employing this method for clinical application. The removal of amylase enables the visualization of previously hidden peaks, making it an efficient and cost-effective approach for identifying novel biomarkers in saliva through MALDI-ToF MS analysis. This proof-of-concept study highlights the potential for depleting other high-abundance proteins in a similar manner to enhance the diagnostic utility of saliva. Overall, this sample processing technique can improve the sensitivity of protein analytes present in low abundance, opening up possibilities for the identification of biomarkers in various diseases.
Conclusion
This study utilized a cost-effective device to deplete salivary amylase from human gargle samples, aiming to improve the protein profiles of COVID-19 positive and negative samples in saliva. The starch bed of the device selectively captured salivary amylase while leaving the rest of the proteome largely unaffected. As a result, enhanced MALDI-ToF MS signals were observed for various peaks that had been suppressed by the presence of amylase. The analysis of 28 gargle samples (14 COVID-19 positives and 14 COVID-19 negatives) using ROC curve analysis achieved a sensitivity of 85 % and specificity of 100 %. This method has the potential to unmask and detect biomarkers that are typically present in low abundance.
Declaration of competing interest
The authors declare they have no known competing financial interests or personal relationships that could affect the work described in this article.
Acknowledgements
This work was supported by Northern Illinois University's Molecular Analysis Core which was established with support from Shimadzu Scientific Instruments. We would also like to thank Dr. Pratool Bharti (Intel Corporation, Oregon, USA) for helpful discussions on data analysis. The following reagents were obtained through BEI Resources, NIAID, NIH: Influenza A Virus, A/Wisconsin/629-D02452/2009 (H1N1)pdm09, NR-19810; Middle East Respiratory Syndrome Coronavirus (MERS CoV), EMC/2012, Irradiated Infected Cell Lysate, NR-50549; Human Coronavirus, 229E, NR-52726; Human Coronavirus, OC43 in HRT-18G Cells, NR-56241 and Human Coronavirus, NL63, NR-470.
IRB information
The protocol “Use of MALDI TOF mass spectrometry to analyze SARS CoV2 viral proteins” was approved on August 12, 2020, and revised on July 12, 2021, and August 11, 2022 by Northern Illinois University.
Footnotes
Supplementary data to this article can be found online at https://doi.org/10.1016/j.jmsacl.2024.01.003.
Appendix A. Supplementary data
The following are the Supplementary data to this article:
References
- 1.Kaczor-Urbanowicz K.E., Martin Carreras-Presas C., Aro K., Tu M., Garcia-Godoy F., Wong D.T.W. “Saliva diagnostics – current views and directions,”. Exp. Biol. Med. 2017;242(5):459–472. doi: 10.1177/1535370216681550. [DOI] [PMC free article] [PubMed] [Google Scholar]
- 2.Crosara K.T.B., Zuanazzi D., Moffa E.B., Xiao Y., MacHado M.A.D.A.M., Siqueira W.L. Revealing the amylase interactome in whole saliva using proteomic approaches. Biomed Res. Int. 2018;2018 doi: 10.1155/2018/6346954. [DOI] [PMC free article] [PubMed] [Google Scholar]
- 3.Krief G., Deutsch O., Zaks B., Wong D.T., Aframian D.J., Palmon A. Comparison of diverse affinity based high-abundance protein depletion strategies for improved bio-marker discovery in oral fluids. J. Proteomics. 2012;75(13):4165–4175. doi: 10.1016/j.jprot.2012.05.012. [DOI] [PubMed] [Google Scholar]
- 4.Zhang C.Z., et al. Saliva in the diagnosis of diseases. Int. J. Oral Sci. 2016;8:133–137. doi: 10.1038/ijos.2016.38. [DOI] [PMC free article] [PubMed] [Google Scholar]
- 5.Floriano P.N., et al. Use of saliva-based nano-biochip tests for acute myocardial infarction at the point of care: a feasibility study. Clin. Chem. 2009;55(8):1530–1538. doi: 10.1373/clinchem.2008.117713. [DOI] [PMC free article] [PubMed] [Google Scholar]
- 6.Bencharit S., et al. Salivary proteins associated with hyperglycemia in diabetes: A proteomic analysis. Mol. Biosyst. 2013;9(11):2785–2797. doi: 10.1039/c3mb70196d. [DOI] [PMC free article] [PubMed] [Google Scholar]
- 7.Wang Q., Gao P., Wang X., Duan Y. The early diagnosis and monitoring of squamous cell carcinoma via saliva metabolomics. Sci. Rep. 2014;4 doi: 10.1038/srep06802. [DOI] [PMC free article] [PubMed] [Google Scholar]
- 8.Wei F., et al. Noninvasive saliva-based EGFR gene mutation detection in patients with lung cancer. Am. J. Respir. Crit. Care Med. 2014;190(10):1117–1126. doi: 10.1164/rccm.201406-1003OC. [DOI] [PMC free article] [PubMed] [Google Scholar]
- 9.K. Gao et al., “Systemic disease-induced salivary biomarker profiles in mouse models of melanoma and non-small cell lung cancer,” PLoS One, vol. 4, no. 6, Jun. 2009, doi: 10.1371/journal.pone.0005875. [DOI] [PMC free article] [PubMed]
- 10.Rhodus N.L., Cheng B., Myers S., Miller L., Ho V., Ondrey F. The feasibility of monitoring NF-κB associated cytokines: TNF-α, IL-1α, IL-6, and IL-8 in whole saliva for the malignant transformation of oral lichen planus. Mol. Carcinog. 2005;44(2):77–82. doi: 10.1002/mc.20113. [DOI] [PubMed] [Google Scholar]
- 11.J. J. Ceron et al., “Use of saliva for diagnosis and monitoring the SARS-CoV-2: A general perspective,” Journal of Clinical Medicine, vol. 9, no. 5, May 2020. doi: 10.3390/jcm9051491. [DOI] [PMC free article] [PubMed]
- 12.T. Sri Santosh, R. Parmar, H. Anand, K. Srikanth, and M. Saritha, “A Review of Salivary Diagnostics and Its Potential Implication in Detection of Covid-19,” Cureus, Apr. 2020, doi: 10.7759/cureus.7708. [DOI] [PMC free article] [PubMed]
- 13.Elżbieta Kaczor-Urbanowicz K. “Salivary diagnostics”, in salivary glands - new approaches in diagnostics and treatment. IntechOpen. 2019 doi: 10.5772/intechopen.73372. [DOI] [Google Scholar]
- 14.J.-L. Capelo-Martinez Emerging Sample Treatments in Proteomics Springer doi:10.1007/978-3-030-12298-0.
- 15.O’Brien-Simpson N.M., Burgess K., Brammar G.C., Darby I.B., Reynolds E.C. Development and evaluation of a saliva-based chair-side diagnostic for the detection of Porphyromonas gingivalis. J. Oral Microbiol. 2015;7(1):29129. doi: 10.3402/jom.v7.29129. [DOI] [PMC free article] [PubMed] [Google Scholar]
- 16.J. L. Ebersole, R. Nagarajan, D. Akers, and C. S. Miller, “Targeted salivary biomarkers for discrimination of periodontal health and disease(s),” Frontiers Cellular and Infection Microbiology, vol. 5, no. Aug, 2015, doi: 10.3389/fcimb.2015.00062. [DOI] [PMC free article] [PubMed]
- 17.Streckfus C.F., Bigler L.R., Zwick M. The use of surface-enhanced laser desorption/ionization time-of-flight mass spectrometry to detect putative breast cancer markers in saliva: a feasibility study. J. Oral Pathol. Med. 2006;35:292–300. doi: 10.1111/j.1600-0714.2006.00427.x. [DOI] [PubMed] [Google Scholar]
- 18.Jou Y.J., et al. Salivary zinc finger protein 510 peptide as a novel biomarker for detection of oral squamous cell carcinoma in early stages. Clin. Chim. Acta. 2011;412(15–16):1357–1365. doi: 10.1016/j.cca.2011.04.004. [DOI] [PubMed] [Google Scholar]
- 19.Delaleu N., Mydel P., Kwee I., Brun J.G., Jonsson M.V., Jonsson R. High fidelity between saliva proteomics and the biologic state of salivary glands defines biomarker signatures for primary Sjögren’s syndrome. Arthritis and Rheumatology. 2015;67(4):1084–1095. doi: 10.1002/art.39015. [DOI] [PubMed] [Google Scholar]
- 20.Castagnola M., et al. Hypo-phosphorylation of salivary peptidome as a clue to the molecular pathogenesis of autism spectrum disorders. J. Proteome Res. Dec. 2008;7(12):5327–5332. doi: 10.1021/pr8004088. [DOI] [PubMed] [Google Scholar]
- 21.S. V. Khadse, G. Bajaj, P. Vibhakar, P. Nainani, R. Ahuja, and G. Deep, “Evaluation of specificity and sensitivity of oral fluid for diagnosis of hepatitis B,” Journal of Clinical and Diagnostic Research, vol. 10, no. 1, pp. BC12–BC14, Jan. 2016, doi: 10.7860/JCDR/2016/17319.7107. [DOI] [PMC free article] [PubMed]
- 22.Sweet S.P., Denbury A.N., Challacombe S.J. Salivary calprotectin levels are raised in patients with oral candidiasis or Sjogren’s syndrome but decreased by HIV infection. Oral Microbiol. Immunol. 2001;16:119–123. doi: 10.1034/j.1399-302x.2001.016002119.x. [DOI] [PubMed] [Google Scholar]
- 23.Andries A.C., et al. Value of Routine Dengue Diagnostic Tests in Urine and Saliva Specimens. PLoS Negl. Trop. Dis. 2015;9(9):Sep. doi: 10.1371/journal.pntd.0004100. [DOI] [PMC free article] [PubMed] [Google Scholar]
- 24.K. R. Katsani and D. Sakellari, “Saliva proteomics updates in biomedicine,” Journal of Biological Research (Thessaloniki), vol. 26, no. 1, Jan. 30, 2019. doi: 10.1186/s40709-019-0109-7. [DOI] [PMC free article] [PubMed]
- 25.Duś-Ilnicka I., Krala E., Cholewińska P., Radwan-Oczko M. “The use of saliva as a biosample in the light of COVID-19”. Diagnostics. 2021;11(10) doi: 10.3390/diagnostics11101769. [DOI] [PMC free article] [PubMed] [Google Scholar]
- 26.Caixeta D.C., et al. “One-Year Update on Salivary Diagnostic of COVID-19”, Frontiers in Public. Health. 2021;vol. 9:May. doi: 10.3389/fpubh.2021.589564. [DOI] [PMC free article] [PubMed] [Google Scholar]
- 27.Czumbel L.M., et al. Saliva as a candidate for COVID-19 diagnostic testing: A meta-analysis. Front. Med. 2020;7:Aug. doi: 10.3389/fmed.2020.00465. [DOI] [PMC free article] [PubMed] [Google Scholar]
- 28.Borghi E., Massa V., Zuccotti G., Wyllie A.L. Testing saliva to reveal the submerged cases of the COVID-19 iceberg. Frontiers Microbiology. 2021;12 doi: 10.3389/fmicb.2021.721635. [DOI] [PMC free article] [PubMed] [Google Scholar]
- 29.Krief G., Deutsch O., Gariba S., Zaks B., Aframian D.J., Palmon A. Improved visualization of low abundance oral fluid proteins after triple depletion of alpha amylase, albumin and IgG. Oral Dis. 2011;17(1):45–52. doi: 10.1111/j.1601-0825.2010.01700.x. [DOI] [PubMed] [Google Scholar]
- 30.Do T., Guran R., Adam V., Zitka O. Use of MALDI-TOF mass spectrometry for virus identification: a review. Analyst. 2022;147(14):3131–3154. doi: 10.1039/d2an00431c. [DOI] [PubMed] [Google Scholar]
- 31.Contreras-Aguilar M.D., Mateo S.V., Tecles F., Hirtz C., Escribano D., Cerón J.J. “Changes occurring on the activity of salivary alpha-amylase proteoforms in two naturalistic situations using a spectrophotometric assay,”. Biology (Basel) 2021;10(3) doi: 10.3390/biology10030227. [DOI] [PMC free article] [PubMed] [Google Scholar]
- 32.Hirtz C., et al. MS characterization of multiple forms of alpha-amylase in human saliva. Proteomics. 2005;5(17):4597–4607. doi: 10.1002/pmic.200401316. [DOI] [PubMed] [Google Scholar]
- 33.Peyrot C., des, Gachons, Breslin P.A.S. Salivary amylase: digestion and metabolic syndrome. Curr. Diab. Rep. 2016;16(10):Oct. doi: 10.1007/s11892-016-0794-7. [DOI] [PMC free article] [PubMed] [Google Scholar]
- 34.Deutsch O., Fleissig Y., Zaks B., Krief G., Aframian D.J., Palmon A. An approach to remove alpha amylase for proteomic analysis of low abundance biomarkers in human saliva. Electrophoresis. 2008;29(20):4150–4157. doi: 10.1002/elps.200800207. [DOI] [PubMed] [Google Scholar]
- 35.Bano S., Qader S.A.U., Aman A., Syed M.N., Azhar A. Purification and characterization of novel α-amylase from bacillus subtilis KIBGE HAS. Am. Assoc. Pharm. Sci. 2011;12(1):255–261. doi: 10.1208/s12249-011-9586-1. [DOI] [PMC free article] [PubMed] [Google Scholar]
- 36.Hyung S., Karima G., Shin K., Kim K.S., Hong J.W. A Simple Paper-Based α-Amylase Separating System for Potential Application in Biological Sciences. BioChip J. 2020;15(3):252–259. doi: 10.1007/s13206-021-00022-3. [DOI] [Google Scholar]
- 37.Xiao H., Wong D.T.W. Method development for proteome stabilization in human saliva. Anal. Chim. Acta. 2012;722:63–69. doi: 10.1016/j.aca.2012.02.017. [DOI] [PubMed] [Google Scholar]
- 38.Chivte P., et al. MALDI-ToF protein profiling as a potential rapid diagnostic platform for COVID-19. J. Mass Spectrometry Adv. Clinical Lab. 2021;21:31–41. doi: 10.1016/j.jmsacl.2021.09.001. [DOI] [PMC free article] [PubMed] [Google Scholar]
- 39.Dollman N.L., Griffin J.H., Downard K.M. Detection, mapping, and proteotyping of SARS-CoV-2 coronavirus with high resolution mass spectrometry. ACS Infect. Dis. 2020;6(12):3269–3276. doi: 10.1021/acsinfecdis.0c00664. [DOI] [PMC free article] [PubMed] [Google Scholar]
- 40.Schwahn A.B., Wong J.W.H., Downard K.M. Signature peptides of influenza nucleoprotein for the typing and subtyping of the virus by high resolution mass spectrometry. Analyst. 2009;134(11):2253–2261. doi: 10.1039/b912234f. [DOI] [PubMed] [Google Scholar]
- 41.Schwahn A.B., Wong J.W.H., Downard K.M. Typing of human and animal strains of influenza virus with conserved signature peptides of matrix M1 protein by high resolution mass spectrometry. J. Virol. Methods. 2010;165(2):178–185. doi: 10.1016/j.jviromet.2010.01.015. [DOI] [PubMed] [Google Scholar]
- 42.R. J. T. B. Murray, Area under a Curve: Trapezoidal and Simpson’s Rules. 1987. doi: https://doi.org/10.1007/978-1-4612-4974-0_26.
- 43.Warren F.J., Royall P.G., Gaisford S., Butterworth P.J., Ellis P.R. Binding interactions of α-amylase with starch granules: the influence of supramolecular structure and surface area. Carbohydr. Polym. 2011;86(2):1038–1047. doi: 10.1016/j.carbpol.2011.05.062. [DOI] [Google Scholar]
- 44.Butterworth P.J., Warren F.J., Ellis P.R. Human α-amylase and starch digestion: An interesting marriage. Starch/Staerke. Jan. 2011;63(7):395–405. doi: 10.1002/star.201000150. [DOI] [Google Scholar]
- 45.Moghadami M. A Narrative Review of Influenza: A Seasonal and Pandemic Disease. Iran J Med Sci. 2017;42 PMID: 28293045. [PMC free article] [PubMed] [Google Scholar]
- 46.T. N. Jilani, R. T. Jamil, & A. H. Siddiqui, “H1N1 Influenza Continuing Education Activity”. https://www.ncbi.nlm.nih.gov/books/NBK513241/?report=printable.
- 47.Liu D.X., Liang J.Q., Fung T.S. In Encyclopedia of Virology 428–440. 2021. Human Coronavirus-229E, -OC43, -NL63, and -HKU1 (Coronaviridae) [DOI] [Google Scholar]
Associated Data
This section collects any data citations, data availability statements, or supplementary materials included in this article.