

Summary
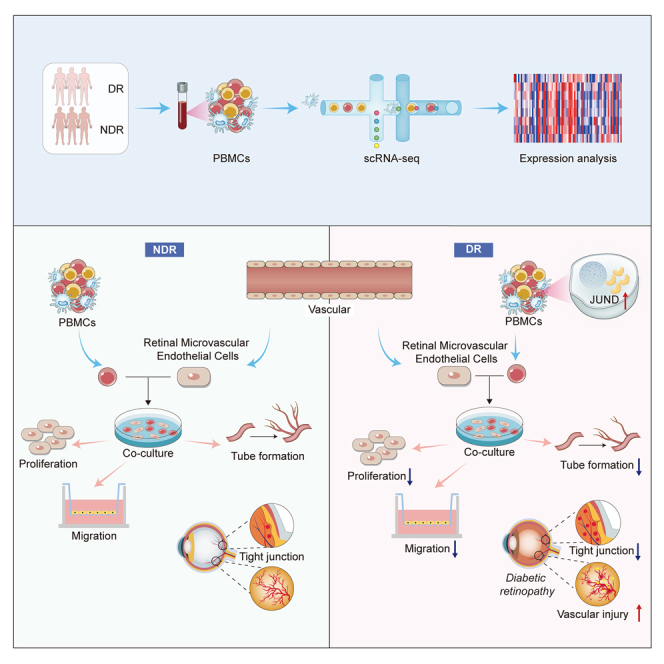
This study focused on examining the exact role of circulating immune cells in the development of diabetic retinopathy (DR). In vitro co-culture experiments showed that peripheral blood mononuclear cells (PBMCs) from patients with type 1 DR crucially modulated the biological functions of human retinal microvascular endothelial cells (HRMECs), consequently disrupting their normal functionality. Single-cell RNA sequencing (scRNA-seq) study revealed unique differentially expressed genes and pathways in circulating immune cells among healthy controls, non-diabetic retinopathy (NDR) patients, and DR patients. Of significance was the observed upregulation of JUND in each subset of PBMCs in patients with type 1 DR. Further studies showed that downregulating JUND in DR patient-derived PBMCs led to the amelioration of HRMEC dysfunction. These findings highlighted the notable alterations in the transcriptomic patterns of circulating immune cells in type 1 DR patients and underscored the significance of JUND as a key factor for PBMCs in participating in the pathogenesis of DR.
Subject areas: Gene network, Components of the immune system, Cell biology, Transcriptomics
Graphical abstract
Highlights
-
•
Circulating immune cells are involved in the pathogenesis of DR
-
•
Circulating immune cells show unique transcriptomic patterns in type 1 DR patients
-
•
JUND plays a significant role in the development of DR
Gene network; Components of the immune system; Cell biology; Transcriptomics
Introduction
Diabetic retinopathy (DR), as the most common vascular disease of the retina, poses a major threat to global health. According to published data, the prevalence of DR is approximately 28.5% in the United States1 and fluctuates 15.8%–35% in Asian countries.2,3 It is estimated that more than one-fifth of the diabetics worldwide have some degree of DR, and about 6.17% of diabetics suffer from vision-threatening DR, such as proliferative diabetic retinopathy (PDR) or diabetic macular edema (DME).4
The circulatory immune system is instrumental in the onset and progression of vascular damage in diabetes.5 Accumulating evidence indicates that circulating immune cells play pivotal roles in the pathophysiology of DR, with increased leukocyte adhesion being observed in the retinal vasculature during the early stages of DR.6,7 Retinal microvascular complication in diabetes, is characterized by recurrent incidents of capillary occlusion and progressive retinal ischemia instigated by persistent, low-level leukocyte activation.8 Furthermore, the detection of lymphocyte infiltration in the fibrovascular membranes of DR patients suggests a possible association with the disease’s activity.9 Prior research had underscored the significance of T cells in DR pathology, as their secretion of pro-inflammatory cytokines can instigate endothelial cell damage and apoptosis, thereby intensifying the pathological alterations in ocular vessels.10,11,12 Additionally, the release of inflammatory markers, such as IL-1β and tumor necrosis factor-α (TNF-α) by monocytes and macrophages, triggered endothelial cell dysregulation and disrupted the integrity of the blood-retinal barrier (BRB).6,13 These studies indicated that increased leukocyte adhesion and lymphocyte infiltration, in combination with the secretion of cytokines and inflammatory markers, were associated with retinal vasculopathy in diabetes.
Leukocyte activation, leukostasis, and inflammatory cytokines secretion contribute to the development of DR.14,15,16,17 However, the specific interactions, signaling pathways, and molecular mechanisms underlying the role of circulating immune cells in DR pathogenesis remain elusive. Unraveling these mechanisms holds immense potential for developing novel therapeutic strategies for DR and improving our understanding of other diabetic complications. Single-cell RNA sequencing (scRNA-seq) is an innovative technology that facilitates the identification of intricate and rare cell populations, as well as the elucidation of regulatory relationships between genes. Here, a scRNA-seq was implemented to obtain a comprehensive visualization of the transcriptomic profile and immunological responses in peripheral blood mononuclear cells (PBMCs) from type 1 diabetics with or without DR. Meanwhile, we demonstrated that JUND acts as a key regulator in PBMCs-mediated endothelial dysfunction in DR.
Results
PBMCs from patients with type 1 DR affect HRMECs’ functions in vitro
We established a co-culture system to explore the potential impact of primary PBMCs on the biological functions of human retinal microvascular endothelial cells (HRMECs) in vitro. The biological functions of endothelial cells, including migration, proliferation and tube formation, are important for the development of vascular network and maintaining its normal function.18,19 Compared with the healthy control (HC) group, PBMCs from both the non-diabetic retinopathy (NDR) group and the DR group significantly inhibited the proliferation, migration and tube formation abilities of HRMECs. Moreover, PBMCs from the DR group more markedly inhibited these HRMECs’ functions than those from the NDR group (Figures 1A–1C). Previous studies indicated that the integrity of BRB was disrupted in DR retinas.20 Therefore, we detected the expression of tight junction proteins, including claudin-5, ZO-1, and occludin in HRMECs after being co-cultured with PBMCs from different groups. We found that the expression of these proteins was significantly decreased in both the NDR and DR groups compared with the HC group, with this effect particularly pronounced in the DR group (Figure 1D). These results indicated that PBMCs from diabetic patients would damage the normal functions of endothelial cells and the effect of PBMCs isolated from DR patients was stronger.
Figure 1.

Effects of PBMCs on the function of HRMECs in vitro
(A) The proliferation of HRMECs tested by EdU (n = 8).
(B) The migration of HRMECs detected by cell migration test (n = 8).
(C) The tube forming ability of HRMECs detected by the tube formation test (n = 8).
(D) The expression of claudin-5, ZO-1, and occludin in HRMECs of each group tested by western blot (n = 6). HC, healthy control. NDR, non-diabetic retinopathy. DR, diabetic retinopathy. Bars: 50 μm in (B) and 100 μm in (A and C). ∗p < 0.05, ∗∗p < 0.01, ∗∗∗p < 0.001.
Single-cell transcriptional landscape of the peripheral immune cells from patients with type 1 DR
In order to examine the immunological features of patients with type 1 DR, we conducted a scRNA-seq on PBMCs obtained from three NDR patients and three DR patients, utilizing the 10X Genomics platform (Figure 2A). The clinical features of these six type 1 diabetics were listed in Table S1 and Figure S1. Additionally, five scRNA-seq datasets of healthy controls were downloaded from the Genome Sequence Archive of the Beijing Institute of Genomics (BIG) Data Center under accession code HRA000150. A total of 71,545 effective cells were obtained after strict quality control. Among these cells, 25,451 cells (35.57%) were from the NDR group, 20,453 cells (28.59%) were from the DR group, and 25,641 cells (35.84%) were from the healthy controls (Figures 2B, and 2E; Table S2). We identified nine cell clusters using graph-based clustering of UMAP (Figures 2C and 2D). These cells included T cells (CD3D), NK cells (KLRC1, KLRF1, NKG7, and KLRD1), classical monocytes (LYZ, CD14, FCN1, and VCAN), non-classical monocytes (LYZ, FCGR3A, and IFITM3), B cells (MS4A1 and CD79A), conventional type 2 dendritic cells (CD1C, CD1E, and FCER1A), basophils (LYZ, CLC, GATA2, MS4A3, and MS4A2), plasmacytoid dendritic cells (IL3RA, CLEC4C, LILRB4, and GZMB), and platelets (PPBP, PF4, TUBB1, and GP9) (Figure 2G).
Figure 2.

Study design and single-cell transcription map of PBMCs from HCs, NDR, and DR patients
(A) The schematic representation of experimental strategy in scRNA-seq.
(B) Display of cell numbers of each sample.
(C) The UMAP projection of 71,545 single cells colored by cell types, showing the formation of 9 clusters with the respective labels.
(D) UMAP colored by sample.
(E) Bar plot showing the overall cell composition of each sample, colored by cell types.
(F) Comparison of the proportion of cell subsets between different groups.
(G) Violin plot showing the relative expression of cell-type-specific markers in each cluster.
The proportion of cell populations in PBMCs varies among individuals. Generally, lymphocytes (T cells, B cells, and NK cells) account for 70–90%, monocytes account for 10–30%, and dendritic cells account for only 1–2%. Consistently, the scRNA-seq data of this study showed that the isolated PBMCs consisted largely of T and NK cells (62.76%), followed by monocytes (22.5%) and B cells (10.9%). The proportion of cell subsets was largely similar among the three groups except for non-classical monocytes (Figure 2F). No new cell subsets or missing subsets were found in the DR group. There were altered transcriptomic patterns for circulating immune cells in type 1 DR patients.
Characterization of T cells in the PBMCs from patients with type 1 DR
Considering the significance of T and NK cells in the immune system, their compositional and molecular alterations throughout the disease progression may be closely linked to the pathogenesis of type 1 DR. Thus, we further investigated their dynamic changes at a finer resolution by re-clustering T and NK cells. This analysis yielded nine distinct clusters, which were visualized through UMAP plot (Figures 3A, 3B, and 3C). NK cells highly expressed KLRC1, KLRF1, NKG7, and KLRD1. CD4+ naive T cells expressed high levels of CD3E, CD4, CCR7, LEF1, SELL, and TCF7. CD8+ naive T cells expressed high levels of CD3E, CD8A, CCR7, LEF1, and TCF7. NKT cells are a unique subpopulation of T cells characterized by the presence of both T cell receptors and NK cell receptors on their cell surface. NKT cells exhibited high levels of CD3E, KLRD1, and NKG7 expression. Helper T cells expressed high levels of CD4, TNFRSF4, CCR6, and GATA3. CD8+ mucosal-associated invariant T cells (CD8 MAIT) expressed high levels of CD8A, SLC4A10, ZBTB16, and NCR3. CD8+ effector T cells (CD8 Teff), highly expressed CD3D, CD8B, NKG7, GZMA, and GNLY, were generally considered to be a uniform population of cytotoxic cells that produce interferon-(IFN) γ. Gamma delta T cells (γδT) expressed high levels of CD3D/E/G, TRDC, TRGC1, and TRGC2. Regulatory T cells (Treg) were CD4+FOXP3+ cells (Figure 3E).
Figure 3.

Single-cell analysis of T cells
(A) UMAP of 9 clusters of T and NK cells, colored by cell types.
(B) UMAP colored by sample.
(C) Bar plot showing the composition of T and NK cells in each group.
(D) Top 10 up- and downregulated genes in T cells of DR patients compared to NDR patients.
(E) Violin plot showing the relative expression of cell-type-specific markers in each cluster.
(F) Enrichment analysis of up- and downregulated DEGs in T cells of DR patients compared to NDR patients, sorted by -log10 (P) value.
A set of differentially expressed genes (DEGs) were identified in T cells of the DR group (Figures 3D and S2). Interestingly, the expression levels of activator protein-1 (AP-1) family member genes, including JUN, JUND, JUNB, and FOS were significantly upregulated in patients of the DR group (Figure 3D). Compared with the NDR group, the significantly upregulated pathways in T cells of DR patients included the T cell receptor signaling pathway, Th17 cell differentiation, leukocyte transendothelial migration, Th1 and Th2 cell differentiation, Rap 1 signaling pathway, and so on (Figure 3F). Previous studies indicated that AP-1 played important roles in promoting Th1 and Th17 differentiation by activates the transcription of T-bet and RORγt respectively, and then aggravated inflammation by promoting IFN-γ and IL-17 secretion.21,22 These results suggested that T cells of DR patients were in a proinflammatory state and AP-1 transcription factor family may mediate gene expression to activate the inflammatory responses. The oxidative phosphorylation pathway is significantly downregulated in the T cells of DR patients compared to the NDR group (Figure 3F).
Immunological features of B cell subsets in patients with type 1 DR
Based on variations in the expression density of membrane surface molecules, B cells can be segregated into three distinct subsets (Figures 4A and 4B). Each subset exhibited a unique expression pattern and biological activity, suggesting the intricate involvement of B cells in immune regulation. Memory B cells (CD27, TNFRSF13B, IGHA1, and AIM2), naive B cells (TCL1A, FCER2, and IGHD), and plasma cells (JCHAIN, MZB1, and IGHG1) were present in the three distinct clusters. However, the proportions of the B cell subsets did not show a significant difference among the three groups (Figure 4C). We also identified the DEGs in B cells in the DR group. The top 10 upregulated expressed genes in B cells of DR patients were IGHG4, CD74, DUSP1, FXYD5, JUND, PFN1, ZFP36, TAGLN2, IGHG2, and HLA-DRB5 as compared with the NDR group (Figure 4D). B cell activation related genes, including CD74, IGHG4, IGHG2, and IGHG1 were highly expressed in B cells of the DR group. Moreover, comparison of B cells from DR patients and HCs revealed upregulation of genes enriched in B cell activation (Figure S3). The pathways including lymphocyte mediated immunity, immune response-activating cell surface receptor signaling pathway and B cells activation were upregulated in the B cells of DR patients. These results indicated that B cells were also activated in DR patients. Notably, the expression of AP-1 family members in B cell of DR patients were also upregulated and enriched in multiple proinflammatory pathways, including response to oxidative stress, Th17 cell differentiation, B cell receptor signaling pathway, apoptosis and so on (Figure 4E). Compared with the NDR group, oxidative phosphorylation is the most downregulated pathway in B cells of DR patients (Figure 4E).
Figure 4.

Single-cell analysis of B cells
(A) UMAP of 3 clusters of B cells, colored by cell types.
(B) UMAP colored by sample.
(C) Bar plot showing the composition of B cells in each group.
(D) Top10 up- and downregulated genes in B cells of DR patients compared to NDR patients.
(E) Enrichment analysis of up- and downregulated DEGs in B cells of DR patients compared to NDR patients, sorted by -log10 (P) value.
Immunological features of monocytes in patients with type 1 DR
The monocytes were obtained and sub-clustered into ten groups. Classical monocytes were subclustered into eight transcriptionally distinct subsets while non-classical monocytes were subclustered into two subpopulations (Figures 5A and 5B). There was no novel or missing cell subset in the DR group (Figure 5C). In patients with DR, multiple genes related to inflammation or activation are significantly upregulated in monocytes, including HLA-DRB5, CCL3, CCL3L3, CCL4, CCL4L2, and IL1B (Figure 5D). Among the significantly upregulated pathways in monocytes of DR patients, AP-1 family member genes involved in response to lipopolysaccharide, mononuclear cell differentiation, fluid shear stress and atherosclerosis, Toll-like receptor signaling pathway, mitogen-activated protein kinase (MAPK) signaling pathway and so on (Figure 5E). Compared with the NDR group, oxidative phosphorylation is the most downregulated pathway in the monocytes of DR patients (Figure 5E). When compared with the HC group, the top 10 upregulated genes in monocytes of DR patients were BRI3, RPL41, H1FX, CEBPB, KLF2, JUND, CDKN1C, TYMP, RPS2, and GPX1 (Figure S4). A comparison of monocytes from DR patients and HCs showed that Fc gamma R-mediated phagocytosis was upregulated in the DR group (Figure S4).
Figure 5.

Single-cell analysis of monocytes
(A) UMAP of 10 clusters of monocytes, colored by cell types.
(B) UMAP colored by sample.
(C) Bar plot showing the composition of monocytes in each group.
(D) Up- and downregulated genes in monocytes of DR patients compared to NDR patients.
(E) Enrichment analysis of up- and downregulated DEGs in monocytes of DR patients compared to NDR patients, sorted by -log10 (P) value.
JUND regulated PBMCs-mediated endothelial dysfunction
The aforementioned results indicated that the AP-1 family genes may play important roles in the pathological processes of DR. Especially, differential gene analysis showed that the expression of JUND was generally upregulated in each cell subset of PBMCs in patients with type 1 DR (Figure 6A). Using qPCR and western blotting assays, we confirmed that the expression of JUND was significantly upregulated in PBMCs of the DR group as compared with the HC and NDR group at both mRNA and protein levels (Figures 6B and 6C). Meanwhile, the immunofluorescence assays also showed that the expression of JUND was upregulated in the PBMCs of patients with type 1 DR (Figure S5). Then we inhibited the expression of JUND in PBMCs from type 1 DR patients using siRNAs and co-cultured these PBMCs with HRMECs (Figure 6D). We found that JUND knockdown alleviated the harmful effects of PBMCs from DR patients (Figures 6E, 6F, and 6G). The proliferation, migration and tube formation abilities of HRMECs were improved. Concurrently, the expressions of tight junction proteins were elevated in HRMECs co-cultured with JUND-knockdown PBMCs (Figure 6H). Collectively, these results indicated that JUND may play an essential role in PBMCs-mediated endothelial dysfunction in patients with type 1 DR.
Figure 6.

JUND regulated PBMCs-mediated endothelial dysfunction
(A) The expression of JUND was upregulated in each cell subset of PBMCs in DR patients via scRNA-seq.
(B) JUND expression in different groups at the mRNA level tested by real-time qPCR (n = 6).
(C) JUND expression in different groups at the protein level tested by western blot (n = 6).
(D) The expressions of JUND protein were inhibited by JUND siRNAs in PBMCs. NC represents the non-specific siRNA transfection group. siJUND-1, siJUND-2, and siJUND-3 represent the first, second, and third JUND siRNA transfection groups, respectively.
(E) The proliferation of HRMECs was enhanced after co-culture with transfected PBMCs (n = 6).
(F) The migration of HRMECs was enhanced after co-culture with transfected PBMCs (n = 6).
(G) The tube forming ability of HRMECs was enhanced after co-culture with transfected PBMCs (n = 6).
(H) The expression of claudin-5, ZO-1, and occludin in HRMECs increased after co-culture with transfected PBMCs (n = 6). Bars: 50 μm in (F) and 100 μm in (E and G). ∗p < 0.05, ∗∗p < 0.01, ∗∗∗p < 0.001.
Discussion
As one of the most common diabetic complications, DR is a leading cause of blindness worldwide.23 Circulating immune cells in diabetic conditions have been implicated in the development of DR, but the exact mechanisms remain obscure. In the current study, we characterized a single-cell atlas of circulating immune cells from type 1 diabetics with or without DR. Our results demonstrated the molecular features of circulating immune cells of patients with type 1 DR. Importantly, we found that the expression of JUND was generally upregulated in all subtypes of PBMCs of DR patients. It is well known that the dysfunction of vascular cells, including endothelial cells, is a contributing factor to the pathogenesis of DR.24,25 We found that PBMCs isolated from patients with type 1 DR damaged the normal function of endothelial cells and inhibiting JUND in PBMCs alleviated its destructive effect and protected endothelial cells.
DR progresses in two stages: the non-proliferative and the proliferative stages.26 In the early stages, DR is characterized by vascular leak and retinal edema due to progressive loss of vascular cells and slow dissolution of inter-vascular junctions. Vascular injury promotes inflammation and hypoxia in retinal microenvironment at later stages, resulting in tissue destruction and neovascularization.27 Vascular endothelial cells are the main target cells of vascular injury caused by diabetes.28 Our results indicated that the PBMCs derived from type 1 DR patients had a disruptive effect on the proliferation, migration, tube formation abilities of HRMECs, and also destroyed the tight junction of HRMECs. These findings were consistent with previous studies that leukocyte-mediated endothelial cell death was one of the earliest pathological manifestations of DR, leading to the formation of acellular-occluded capillaries, microaneurysms, and the thickening of vascular basement membranes.13,29 During diabetes, changes in circulating immune cells may damage retinal microvessels from the inside of blood vessels through leukocyte stasis.7,30 These immune cells are known to adhere to the retinal vasculature which underlies the breakdown of the BRB. When the BRB is destroyed, circulating immune cells can infiltrate the retina and gain access into the vitreous, causing retinal inflammation to escalate.5,31 PBMCs derived from type 1 DR patients inhibited the function of HRMECs, which might be related to the dyssecretosis of cytokines in peripheral blood immune cells, or because PBMCs could directly participate in the injury of vascular endothelial cells. Previous studies had reported that IFN-γ and TNF-α secreted by Th1 cells directly impair human angiogenesis.32 Increased levels of monocyte-associated cytokines such as IL-6, MCP-1 and TNF-α in diabetics subsequently lead to endothelial tissue damage.33 Moreover, it has been verified that CD8+ T cells or its supernatant can directly damage angiogenesis in vitro experiments.34
Previous studies established an initial immune profile for DME patients with type 2 diabetes, emphasizing an innate immune dysregulation in the peripheral blood.35 The study reported by Ma et al.35 demonstrated that one particular cell subset-the proinflammatory CD14+ monocytes may mediate the pathohenesis of DME. They found that multiple inflammatory genes (CCL3, CCL4, CCL4L2, IL1B, NFKBIA, and TNF) and HLA-related genes (including HLA-DPB1, HLA-DRA, and HLA-DQA1) were highly expressed in these proinflammatory CD14 monocytes. Meanwhile, the proportion of this subset was upregulated in DME patients compared to HC. Our findings also suggested that circulating immune cells display a unique transcriptomic pattern in type 1 DR patients. We observed that multiple genes related to inflammation or activation were highly expressed in the monocytes of DR patients, including HLA-DRB5, CCL3, CCL3L3, CCL4, CCL4L2, and IL1B. However, the monocytes were obtained and sub-clustered into ten groups in our study, but we found no alterations in the cell types in monocytes of DR group as compared with the NDR or HC group. Interestingly, according to the research conducted by Ma et al., it is worth noting that high expression levels of AP-1 family member genes (FOS, FOSB, and JUNB) were observed in proinflammatory monocytes. Furthermore, SCENIC analysis predicted FOS, JUN, JUNB, and JUND as key regulators directing inflammatory gene expression in proinflammatory monocytes. This is in partial agreement with the findings of our study. We found that the expression of JUND was generally upregulated in all subtypes of DR patients and further proved that inhibiting JUND in PBMCs alleviated its destructive effect and protected endothelial cells. We also found that multiple genes and pathways related to T cell activation were upregulated in T cells of DR patients. The genes JUND, JUN, JUNB, and FOS were significantly upregulated in the T cells of the DR group. It has been reported that AP-1 serves as the critical link between T cell activation and chromatin remodeling. Chromatin accessibility profiling has shown rapid opening of closed chromatin in naive T cells within 5 h of activation, with a strong enrichment of the AP-1 motif in these newly accessible regions.36 The significant upregulation of AP-1 related genes in T cells of DR patients suggested that T cells may be in an activated state. Moreover, in patients with type 1 DR, we observed upregulation of pathways including Th17 cell differentiation, leukocyte transendothelial migration, and Th1 and Th2 cell differentiation in T cells. Animal experiments had demonstrated that Th17 cell-mediated immune responses promoted morphological and functional changes in the retina of mice spontaneously developing diabetes.12 The imbalance of Th1/Th2 contributed to the occurrence and development of DR.10 Previous reports indicated the presence of T lymphocytes in the fibrovascular proliferative membranes of PDR patients, which showed significant correlation with the severity of retinal lesions and visual prognosis.37 The upregulation of leukocyte transendothelial migration pathway in T cells of type 1 DR patients may promote T cell migration through the BRB. This gives a better explanation for the presence and function of T lymphocytes in the fibrovascular proliferative membranes of PDR patients.
The AP-1 complex has emerged as a critical regulator of cell growth and metabolism.38 JUND is a subunit of AP-1 transcription factor and can regulate a variety of target genes involved in cell growth, proliferation and apoptosis.39,40,41 Previous research has indicated that JUND was activated in the islets of mice with type 2 diabetes mellitus. Furthermore, it was observed that the absence of JUND could afford protection against the harmful lipid accumulation in beta cells induced by palmitic acid. These findings collectively suggested that JUND plays a vital role in pancreatic beta-cell function and the pathogenesis of diabetes.40 JUND expression was upregulated in the kidneys of diabetic nephrotic mice and in high glucose-induced glomerular mesangial cells, suggesting that JUND may play a role in regulating cell proliferation and fibrosis in these contexts.42 In the current study, we observed significant upregulation of JUND in all subset of PBMCs in patients with type 1 DR. Further experiments evidenced that downregulating JUND in DR patient-derived PBMCs led to the amelioration of HRMEC dysfunction. The results of our study suggested that targeting JUND may represent an effective way to protect endothelial cells in DR.
In summary, we successfully created an atlas of circulating immune cells in patients with type 1 DR and found that JUND plays a significant role in the development of DR, which may contribute to expanding our knowledge of DR pathogenesis.
Limitations of the study
This study observed that each cell subset in PBMCs possessed significant genes and enriched pathways that could potentially contribute to the development of DR. And we found that inhibiting JUND in PBMCs of DR patients alleviated its damage to endothelial cells. However, this study only included patients with type 1 DR but not those with type 2 DR. Further investigation involving other types of DR patients, larger sample sizes for scRNA-seq analysis, and in vivo functional studies are needed for more comprehensive understanding of the development of DR. Additionally, a meta-analysis that integrates various samples is also essential, and further studies are needed to explore the potential roles of systemic agents targeting JUND.
STAR★Methods
Key resources table
| REAGENT or RESOURCE | SOURCE | IDENTIFIER |
|---|---|---|
| Antibodies | ||
| Anti-Claudin-5 | Proteintech | Cat#29767-1-AP; RRID:AB_2935477 |
| Anti-ZO-1 | Proteintech | Cat#21773-1-AP; RRID:AB_10733242 |
| Anti-Occludin | Proteintech | Cat#27260-1-AP; RRID:AB_2880820 |
| Anti-β-actin | Affinity | Cat#AF7018; RRID:AB_2839420 |
| JUND antibody | Cell Signaling Technology, CST | Cat#5000; RRID:AB_10949318 |
| Goat Anti-Rabbit IgG (H + L) HRP | Affinity | Cat#S0001; RRID:AB_2839429 |
| Cy3-labelled goat anti-rabbit IgG (H + L) | Beyotime | Cat#A0516; RRID:AB_2893015 |
| Biological samples | ||
| Venous blood samples | This paper (Table S1) | N/A |
| Chemicals, peptides, and recombinant proteins | ||
| EGM-2 “bullet kit” | Lonza, USA | Cat#CC-3162 |
| PMIS-1640 | Gibco, USA | Cat#11875119 |
| Fetal Bovine Serum | Gibco, USA | Cat#16140071 |
| Critical commercial assays | ||
| BeyoClick™ EdU Cell Proliferation Kit | Beyotime | Cat#C0071S |
| BCA kit | Beyotime | Cat#P0010S |
| Chromium Single Cell v3.1 reagent kit | 10X Genomics | Cat#PN-1000268 |
| SYBR Green qPCR Master Mix | MCE | Cat#HY-K0501 |
| Deposited data | ||
| ScRNA-seq data | This paper | GEO: GSE248284 |
| scRNA-seq data for PBMCs from healthy controls | Zhang et al.43 | HRA000150 |
| Experimental models: Cell lines | ||
| human retinal microvascular endothelial cells | CELL SYSTEM | Cat#ACBRI 181 |
| Oligonucleotides | ||
| Primer: JUND Forward: 5′- TCATCATCCAGTCCAACGGG-3’; |
This paper | N/A |
| Primer: JUND Reverse: 5′- TTCTGCTTGTGTAAATCCTCCAG-3′ |
This paper | N/A |
| Primer: β-actin Forward: 5′-CATGTACGTTGCTATCCAGGC-3′ |
This paper | N/A |
| Primer: β-actin Reverse: 5′-CTCCTTAATGTCACGCACGAT-3′ |
This paper | N/A |
| SiRNA targeting sequence for JUND, see Table S3 | This paper | N/A |
| Software and algorithms | ||
| ImageJ | National Institutes of Health | https://imagej.nih.gov/ij/ |
| SPSS Statistics 20.0 | IBM Corp. | https://www.ibm.com/cn-zh/spss |
| GraphPad Prism version 8.0 | GraphPad Software | https://www.graphpad.com/ |
| Cell Ranger v4.0.0. | 10x Genomics | https://www.10xgenomics.com/ |
| Seurat | The R package | https://satijalab.org/seurat/ |
Resource availability
Lead contact
Further information and requests for resources and reagents should be directed to and will be fulfilled by the lead contact, Shengping Hou (sphou828@163.com).
Materials availability
This study did not generate new unique reagents.
Data and code availability
Raw and processed scRNA-seq data are available from the NCBI Gene Expression Omnibus under accession number GEO: GSE248284. The scRNA-seq data for healthy controls were downloaded from the Genome Sequence Archive of the Beijing Institute of Genomics (BIG) Data Center, BIG, Chinese Academy of Sciences, under accession code HRA000150.
This paper does not report original code.
Any additional information required to reanalyze the data reported in this paper is available from the lead contact upon request.
Experimental model and study participant details
Institutional review board approvals
This study was granted approval by the Institutional Review Board and Ethics Committee of the First Affiliated Hospital of Chongqing Medical University (Permit Number: 2021–248). All experiments adhered to the principles outlined in the Declaration of Helsinki, and informed consent forms were obtained as part of the study. The final version of the full protocol is available upon request to the lead contact.
Subjects and clinical sample collection
Venous blood samples were collected from newly diagnosed type 1 diabetes patients who had not yet received any treatment, at both the First Affiliated Hospital of Chongqing Medical University and the Affiliated Hospital of North Sichuan Medical College. Participant demographics and clinical features are detailed in Table S1. We then divided these patients into two groups based on their fundus fluorescein angiography results: those with NDR and those with DR.
Cell culture
Primary HRMECs were purchased from CELL SYSTEM (Seattle, America) and cultured in endothelial growth medium EGM-2 “bullet kit”(Lonza, USA), and maintained at 37°C in a 5% CO2 atmosphere. The cells were authenticated using short tandem repeat assays and utilized for experiments between passages 4 and 8. PBMCs were isolated from fresh human peripheral blood and cultured in PMIS-1640 (Gibco, USA) culture-medium containing 10% Fetal Bovine Serum (FBS; Gibco, USA) and 1% penicillin-streptomycin in a 5% CO2 incubator at 37°C. We established a co-culture system of PBMCs and HRMECs, and conducted subsequent experiments after co-culture for 24 h.
Method details
Peripheral blood mononuclear cell isolation
Whole blood cells were diluted at a 1:1 ratio with 1× PBS before being layered onto lymphocyte separation medium and subjected to centrifugation at 500g for 20 min at 4°C. The PBMC-containing white-cloud layer was carefully isolated using capillaries and subsequently washed twice with PBS after removal of erythrocytes. For each sample, the cell viability exceeded 80%.
5′-ethynyl-2′-deoxyuridine
The proliferation of HRMECs was detected by 5’-Ethynyl-2’-deoxyuridine (EdU; Beyotime, China) test. After co-culturing with PBMCs for 24 h, HRMECs were exposed to EdU (final concentration of 10 μM) for 2 h at 37°C. Subsequently, the cells underwent fixation with a 4% paraformaldehyde solution for a period of 15 min, followed by permeabilization with 0.3% Triton X-100 (Beyotime, China) for an additional 15 min. Then, the cells were mixed with a click reaction mixture at room temperature while being protected from light for 30 min. Finally, the cells were treated with a fluorescent dye (Hoechst 33342, Sigma, USA) for a period of 10 min and imaged using a Leica fluorescence microscope.
Cell migration assay
The experiments to investigate cell migration were carried out in 24-well transwell chambers (Corning, USA), with an 8-μm pore size polycarbonate filter separating the two compartments. The upper chambers were seeded with HRMECs, while PBMCs were added to the lower chambers. Incubation took place at 37°C and 5% CO2 for a duration of 24 h. Following this, cells that had moved through the filter were fixed using 4% paraformaldehyde for a 10-min period and subsequently stained with a 1% crystal violet solution in methanol. The non-migrated cells present were cleared by a cotton swab. The migrated cells that settled on the underside of the membrane were then visualized and imaged by a Leica microscope. The acquired images were then analyzed and quantified utilizing the ImageJ software (National Institutes of Health, USA).
Tube formation assay
In the 24-well transwell plates (0.4 μm, Corning, USA), HRMECs were seeded into the lower chambers, while PBMCs were placed in the upper compartments. Following a 24-h co-culture period, HRMECs were seeded onto a BD Matrigel (BD Biosciences, USA) in 96-well plates. After 6 h of incubation, images were captured using an inverted microscope. The tube length was measured with ImageJ software and normalized against the control group.
Western blotting
Proteins were extracted from the mixture of lysate buffer (Beyotime, P0013B, China) and protease inhibitor (Abcam, ab141032, UK). The protein concentration was measured by a BCA kit (Beyotime, P0010S, China). The same amount of protein was taken for sodium dodecyl sulfate polyacrylamide gel electrophoresis, and the protein was separated and transferred to the nitrocellulose membrane. Then the membranes were sealed in TBST containing 10% skimmed milk at room temperature for 2 h and incubated with Claudin-5 (Proteintech, 29767-1-AP, diluted 1:1000), ZO-1 (Proteintech, 21773-1-AP, diluted 1:1000) and Occludin (Proteintech, 27260-1-AP, 1:1000) antibodies overnight at 4°C. To remove any unbound proteins, the membranes were washed three times with TBST for 10 min each. Membranes were incubated with secondary antibody, diluted 1:5000, at room temperature with gentle shaking for 1 h, followed by washing the membranes three times with TBST. The protein levels were quantified using ImageJ software and normalized to the amount of β-actin present.
Single-cell RNA sequencing
The cells were captured using a microfluidic chip and subjected to library construction with the Chromium Single Cell v3.1 reagent kit (10X Genomics). The constructed libraries were subsequently sequenced in high-throughput mode using Illumina’s paired-end sequencing platform. For comparison, five scRNA-seq datasets from healthy controls were obtained from National Genomics Data Center (https://ngdc.cncb.ac.cn/).43
Real-time quantitative PCR
Total RNA was extracted from PBMCs by utilizing the TRIzol reagent and subsequently subject to reverse transcription using the RT Master Mix for qPCR (MCE, HY-K0510). Real-time qPCR was performed with the SYBR Green qPCR Master Mix (MCE, HY-K0501), using an ABI Prism 7500 machine (Applied Biosystems, CA, USA).
Immunofluorescence
PBMCs were seeded at a density of 1 × 10⁵ cells per well in 24-well culture plates which were precoated with Poly-D-lysine (Sigma, P6407). The cells were fixed with 4% paraformaldehyde for 0.5 h and blocked with 0.4% Triton X-100 and 5% goat serum for an hour. Then the cells were incubated with JUND antibody (CST, 5000) at 4°C overnight. Following a meticulous washing, the cells were incubated with secondary antibody (Cy3-labelled goat anti-rabbit IgG (H + L), Beyotime, A0516) for 1 h at 37°C and the images were captured by microscopy (Leica, Germany).
Cell transfection
PBMCs were seeded in 24-well culture plates at a density of 1 × 10⁵ cells per well in 500μL antibiotic-free culture medium. PBMCs were transfected with small interfering RNA (siRNA; Sangon Biotech, China) for the inhibition of JUND expression, and a negative control siRNA (NC) was used as the negative control. The mixture of dilute Lipofectamin2000 (Thermo Fisher Scientific, USA) and siRNA was added to the culture plate according to the instruction. Plated PBMCs were transfected with JUND siRNA at a final concentration of 50 nM. Following this, the plates were then cultivated in a CO2 incubator at 37°C for 8 h. Post incubation, the transfected PBMCs were submitted to centrifugation to remove any culture medium that could contain residual siRNA, and then cultured in complete culture medium. Forty-eight hours post-transfection, the transfected PBMCs were used for co-culture with HRMECs. Verification of JUND knockdown was achieved via Western blotting.
Quantification and statistical analysis
ScRNA-seq data preprocessing and quality control
The demultiplexing, barcoded processing, gene counting and aggregation were made using the Cell Ranger software v4.0.0. Raw reads were demultiplexed and mapped to the reference genome with default parameters, while unique molecular identifiers (UMIs) were used to quantify gene expression. Further filtering by Seurat v3.2.3 required genes to be expressed in at least three cells and each cell to have at least 200 expressed genes. Data normalization was performed using the LogNormalize method. Mitochondrial gene expression, number of UMIs per cell, and cell cycle genes, which caused inherent variations, were regressed out.
Dimensionality reduction and clustering
After filtering, Seurat v3.2.3 functions were used for dimension reduction and clustering. The Normalize Data and Scale Data functions were employed to normalize and scale gene expression, while the top 2000 variable genes were selected using the FindVariable Features function for PCA analysis. With the top 20 principal components, cells were divided into multiple clusters using FindClusters. Harmony was used to remove batch effect between samples. Lastly, the uniform manifold approximation and projection (UMAP) algorithm was implemented to map the cells onto a two-dimensional space.
Differentially expressed genes analysis
To accurately identify DEGs, we used the Seurat FindMarkers function, utilizing the Wilcoxon likelihood-ratio test with default parameters. Genes present in over 10% of cells within a cluster and exhibiting an average log (Fold Change) value exceeding 0.25 were classified as DEGs.
Pathway enrichment analysis
To explore the potential functions of DEGs, we performed Gene Ontology and Kyoto Encyclopedia of Genes and Genomes analyses using the "clusterProfiler" R package. Pathways with an adjusted p value (p_adj) less than 0.05 were considered significantly enriched.
Statistical analysis
Statistical analyses were performed using the statistical package IBM SPSS Statistics software (SPSS) 20.0 (IBM Corp., Chicago, IL, USA) and Prism 8.0 (GraphPad, San Diego, CA, USA). The measurement data of normal distribution was shown as mean ± SD. The count data were expressed by the number of cases and percentage (%). Unpaired Student’s t-tests were employed to evaluate significance between two groups with normally distributed measurement data. One Way ANOVA was used to analyze three or more groups of variance. Mann-Whitney U test was used for measurement data of the two groups that did not confirm to normal distribution. A value of p < 0.05 was considered statistically significant.
Acknowledgments
This work was supported by Natural Science Foundation Project of China (82070951, 82271078, and 82371045), and Beijing Natural Science Foundation (7212016).
Author contributions
D.L. and W.F. recruited patients and performed the study. D.L., W.F., R.L., X.W., and J.L. analyzed the data and performed the statistical analysis. D.L., W.F., and S.H. planned the study. D.L. and W.F. wrote the manuscript with input from all authors. N.L., H.W., and S.H. reviewed and edited the manuscript. S.H. is the guarantor of this work and, as such, had full access to all the data in the study and takes responsibility for the integrity of the data and the accuracy of the data analysis.
Declaration of interests
The authors declare no competing interests.
Published: January 26, 2024
Footnotes
Supplemental information can be found online at https://doi.org/10.1016/j.isci.2024.109003.
Supplemental information
References
- 1.Zhang X., Saaddine J.B., Chou C.F., Cotch M.F., Cheng Y.J., Geiss L.S., Gregg E.W., Albright A.L., Klein B.E.K., Klein R. Prevalence of diabetic retinopathy in the United States, 2005-2008. JAMA. 2010;304:649–656. doi: 10.1001/jama.2010.1111. [DOI] [PMC free article] [PubMed] [Google Scholar]
- 2.Wong T.Y., Cheung N., Tay W.T., Wang J.J., Aung T., Saw S.M., Lim S.C., Tai E.S., Mitchell P. Prevalence and risk factors for diabetic retinopathy: the Singapore Malay Eye Study. Ophthalmology. 2008;115:1869–1875. doi: 10.1016/j.ophtha.2008.05.014. [DOI] [PubMed] [Google Scholar]
- 3.Jee D., Lee W.K., Kang S. Prevalence and risk factors for diabetic retinopathy: the Korea National Health and Nutrition Examination Survey 2008-2011. Invest. Ophthalmol. Vis. Sci. 2013;54:6827–6833. doi: 10.1167/iovs.13-12654. [DOI] [PubMed] [Google Scholar]
- 4.Teo Z.L., Tham Y.C., Yu M., Chee M.L., Rim T.H., Cheung N., Bikbov M.M., Wang Y.X., Tang Y., Lu Y., et al. Global Prevalence of Diabetic Retinopathy and Projection of Burden through 2045: Systematic Review and Meta-analysis. Ophthalmology. 2021;128:1580–1591. doi: 10.1016/j.ophtha.2021.04.027. [DOI] [PubMed] [Google Scholar]
- 5.Xu H., Chen M. Diabetic retinopathy and dysregulated innate immunity. Vision Res. 2017;139:39–46. doi: 10.1016/j.visres.2017.04.013. [DOI] [PubMed] [Google Scholar]
- 6.Tang L., Xu G.T., Zhang J.F. Inflammation in diabetic retinopathy: possible roles in pathogenesis and potential implications for therapy. Neural Regen. Res. 2023;18:976–982. doi: 10.4103/1673-5374.355743. [DOI] [PMC free article] [PubMed] [Google Scholar]
- 7.Chibber R., Ben-Mahmud B.M., Chibber S., Kohner E.M. Leukocytes in diabetic retinopathy. Curr. Diabetes Rev. 2007;3:3–14. doi: 10.2174/157339907779802139. [DOI] [PubMed] [Google Scholar]
- 8.Forrester J.V., Kuffova L., Delibegovic M. The Role of Inflammation in Diabetic Retinopathy. Front. Immunol. 2020;11 doi: 10.3389/fimmu.2020.583687. [DOI] [PMC free article] [PubMed] [Google Scholar]
- 9.Urbančič M., Štunf Š., Milutinović Živin A., Petrovič D., GlobočnikPetrovič M. Epiretinal membrane inflammatory cell density might reflect the activity of proliferative diabetic retinopathy. Invest. Ophthalmol. Vis. Sci. 2014;55:8576–8582. doi: 10.1167/iovs.13-13634. [DOI] [PubMed] [Google Scholar]
- 10.Cao Y.L., Zhang F.Q., Hao F.Q. Th1/Th2 cytokine expression in diabetic retinopathy. Genet. Mol. Res. 2016;15 doi: 10.4238/gmr.15037311. [DOI] [PubMed] [Google Scholar]
- 11.Sigurdardottir S., Zapadka T.E., Lindstrom S.I., Liu H., Taylor B.E., Lee C.A., Kern T.S., Taylor P.R. Diabetes-mediated IL-17A enhances retinal inflammation, oxidative stress, and vascular permeability. Cell. Immunol. 2019;341 doi: 10.1016/j.cellimm.2019.04.009. [DOI] [PMC free article] [PubMed] [Google Scholar]
- 12.Taguchi M., Someya H., Inada M., Nishio Y., Takayama K., Harimoto K., Karasawa Y., Ito M., Takeuchi M. Retinal changes in mice spontaneously developing diabetes by Th17-cell deviation. Exp. Eye Res. 2020;198 doi: 10.1016/j.exer.2020.108155. [DOI] [PubMed] [Google Scholar]
- 13.Joussen A.M., Doehmen S., Le M.L., Koizumi K., Radetzky S., Krohne T.U., Poulaki V., Semkova I., Kociok N. TNF-alpha mediated apoptosis plays an important role in the development of early diabetic retinopathy and long-term histopathological alterations. Mol. Vis. 2009;15:1418–1428. [PMC free article] [PubMed] [Google Scholar]
- 14.Mesquida M., Drawnel F., Fauser S. The role of inflammation in diabetic eye disease. Semin. Immunopathol. 2019;41:427–445. doi: 10.1007/s00281-019-00750-7. [DOI] [PubMed] [Google Scholar]
- 15.Noda K., Nakao S., Ishida S., Ishibashi T. Leukocyte adhesion molecules in diabetic retinopathy. J. Ophthalmol. 2012;2012 doi: 10.1155/2012/279037. [DOI] [PMC free article] [PubMed] [Google Scholar]
- 16.Chibber R., Ben-Mahmud B.M., Coppini D., Christ E., Kohner E.M. Activity of the glycosylating enzyme, core 2 GlcNAc (beta1,6) transferase, is higher in polymorphonuclear leukocytes from diabetic patients compared with age-matched control subjects: relevance to capillary occlusion in diabetic retinopathy. Diabetes. 2000;49:1724–1730. doi: 10.2337/diabetes.49.10.1724. [DOI] [PubMed] [Google Scholar]
- 17.Miyamoto K., Khosrof S., Bursell S.E., Rohan R., Murata T., Clermont A.C., Aiello L.P., Ogura Y., Adamis A.P. Prevention of leukostasis and vascular leakage in streptozotocin-induced diabetic retinopathy via intercellular adhesion molecule-1 inhibition. Proc. Natl. Acad. Sci. USA. 1999;96:10836–10841. doi: 10.1073/pnas.96.19.10836. [DOI] [PMC free article] [PubMed] [Google Scholar]
- 18.Kontos C.D., Annex B.H. Angiogenesis. Curr. Atheroscler. Rep. 1999;1:165–171. doi: 10.1007/s11883-999-0013-y. [DOI] [PubMed] [Google Scholar]
- 19.Rezzola S., Belleri M., Gariano G., Ribatti D., Costagliola C., Semeraro F., Presta M. In vitro and ex vivo retina angiogenesis assays. Angiogenesis. 2014;17:429–442. doi: 10.1007/s10456-013-9398-x. [DOI] [PubMed] [Google Scholar]
- 20.Rudraraju M., Narayanan S.P., Somanath P.R. Regulation of blood-retinal barrier cell-junctions in diabetic retinopathy. Pharmacol. Res. 2020;161 doi: 10.1016/j.phrs.2020.105115. [DOI] [PMC free article] [PubMed] [Google Scholar]
- 21.Xie L., Lv J., Saimaier K., Han S., Han M., Wang C., Liu G., Zhuang W., Jiang X., Du C. The novel small molecule TPN10518 alleviates EAE pathogenesis by inhibiting AP1 to depress Th1/Th17 cell differentiation. Int. Immunopharmacol. 2023;123 doi: 10.1016/j.intimp.2023.110787. [DOI] [PubMed] [Google Scholar]
- 22.Li P., Spolski R., Liao W., Wang L., Murphy T.L., Murphy K.M., Leonard W.J. BATF-JUN is critical for IRF4-mediated transcription in T cells. Nature. 2012;490:543–546. doi: 10.1038/nature11530. [DOI] [PMC free article] [PubMed] [Google Scholar]
- 23.Yang Z., Tan T.E., Shao Y., Wong T.Y., Li X. Classification of diabetic retinopathy: Past, present and future. Front. Endocrinol. 2022;13 doi: 10.3389/fendo.2022.1079217. [DOI] [PMC free article] [PubMed] [Google Scholar]
- 24.Zheng D., Liu J., Piao H., Zhu Z., Wei R., Liu K. ROS-triggered endothelial cell death mechanisms: Focus on pyroptosis, parthanatos, and ferroptosis. Front. Immunol. 2022;13 doi: 10.3389/fimmu.2022.1039241. [DOI] [PMC free article] [PubMed] [Google Scholar]
- 25.Bharadwaj A.S., Appukuttan B., Wilmarth P.A., Pan Y., Stempel A.J., Chipps T.J., Benedetti E.E., Zamora D.O., Choi D., David L.L., Smith J.R. Role of the retinal vascular endothelial cell in ocular disease. Prog. Retin. Eye Res. 2013;32:102–180. doi: 10.1016/j.preteyeres.2012.08.004. [DOI] [PMC free article] [PubMed] [Google Scholar]
- 26.Antonetti D.A., Klein R., Gardner T.W. Diabetic retinopathy. N. Engl. J. Med. 2012;366:1227–1239. doi: 10.1056/NEJMra1005073. [DOI] [PubMed] [Google Scholar]
- 27.Nentwich M.M., Ulbig M.W. Diabetic retinopathy - ocular complications of diabetes mellitus. World J. Diabetes. 2015;6:489–499. doi: 10.4239/wjd.v6.i3.489. [DOI] [PMC free article] [PubMed] [Google Scholar]
- 28.Kong H., Zhao H., Chen T., Song Y., Cui Y. Targeted P2X7/NLRP3 signaling pathway against inflammation, apoptosis, and pyroptosis of retinal endothelial cells in diabetic retinopathy. Cell Death Dis. 2022;13:336. doi: 10.1038/s41419-022-04786-w. [DOI] [PMC free article] [PubMed] [Google Scholar]
- 29.Joussen A.M., Poulaki V., Mitsiades N., Cai W.Y., Suzuma I., Pak J., Ju S.T., Rook S.L., Esser P., Mitsiades C.S., et al. Suppression of Fas-FasL-induced endothelial cell apoptosis prevents diabetic blood-retinal barrier breakdown in a model of streptozotocin-induced diabetes. FASEB J. 2003;17:76–78. doi: 10.1096/fj.02-0157fje. [DOI] [PubMed] [Google Scholar]
- 30.Obasanmi G., Lois N., Armstrong D., Lavery N.J., Hombrebueno J.R., Lynch A., Wright D.M., Chen M., Xu H. Circulating Leukocyte Alterations and the Development/Progression of Diabetic Retinopathy in Type 1 Diabetic Patients - A Pilot Study. Curr. Eye Res. 2020;45:1144–1154. doi: 10.1080/02713683.2020.1718165. [DOI] [PubMed] [Google Scholar]
- 31.Urbančič M., Kloboves Prevodnik V., Petrovič D., Globočnik Petrovič M. A flow cytometric analysis of vitreous inflammatory cells in patients with proliferative diabetic retinopathy. BioMed Res. Int. 2013;2013 doi: 10.1155/2013/251528. [DOI] [PMC free article] [PubMed] [Google Scholar]
- 32.Leung O.M., Li J., Li X., Chan V.W., Yang K.Y., Ku M., Ji L., Sun H., Waldmann H., Tian X.Y., et al. Regulatory T Cells Promote Apelin-Mediated Sprouting Angiogenesis in Type 2 Diabetes. Cell Rep. 2018;24:1610–1626. doi: 10.1016/j.celrep.2018.07.019. [DOI] [PubMed] [Google Scholar]
- 33.Ngcobo S.R., Nkambule B.B., Nyambuya T.M., Mokgalaboni K., Ntsethe A., Mxinwa V., Ziqubu K., Ntamo Y., Nyawo T.A., Dludla P.V. Activated monocytes as a therapeutic target to attenuate vascular inflammation and lower cardiovascular disease-risk in patients with type 2 diabetes: A systematic review of preclinical and clinical studies. Biomed. Pharmacother. 2022;146 doi: 10.1016/j.biopha.2021.112579. [DOI] [PubMed] [Google Scholar]
- 34.Liang C., Yang K.Y., Chan V.W., Li X., Fung T.H.W., Wu Y., Tian X.Y., Huang Y., Qin L., Lau J.Y.W., Lui K.O. CD8(+) T-cell plasticity regulates vascular regeneration in type-2 diabetes. Theranostics. 2020;10:4217–4232. doi: 10.7150/thno.40663. [DOI] [PMC free article] [PubMed] [Google Scholar]
- 35.Ma P., Zhang P., Chen S., Shi W., Ye J., Chen S., Ju R., Liu B., Zheng Y., Liu Y. Immune Cell Landscape of Patients With Diabetic Macular Edema by Single-Cell RNA Analysis. Front. Pharmacol. 2021;12 doi: 10.3389/fphar.2021.754933. [DOI] [PMC free article] [PubMed] [Google Scholar]
- 36.Yukawa M., Jagannathan S., Vallabh S., Kartashov A.V., Chen X., Weirauch M.T., Barski A. AP-1 activity induced by co-stimulation is required for chromatin opening during T cell activation. J. Exp. Med. 2020;217 doi: 10.1084/jem.20182009. [DOI] [PMC free article] [PubMed] [Google Scholar]
- 37.Kase S., Saito W., Ohno S., Ishida S. Proliferative diabetic retinopathy with lymphocyte-rich epiretinal membrane associated with poor visual prognosis. Invest. Ophthalmol. Vis. Sci. 2009;50:5909–5912. doi: 10.1167/iovs.09-3767. [DOI] [PubMed] [Google Scholar]
- 38.Shaulian E., Karin M. AP-1 as a regulator of cell life and death. Nat. Cell Biol. 2002;4:E131–E136. doi: 10.1038/ncb0502-e131. [DOI] [PubMed] [Google Scholar]
- 39.Hernandez J.M., Floyd D.H., Weilbaecher K.N., Green P.L., Boris-Lawrie K. Multiple facets of junD gene expression are atypical among AP-1 family members. Oncogene. 2008;27:4757–4767. doi: 10.1038/onc.2008.120. [DOI] [PMC free article] [PubMed] [Google Scholar]
- 40.Wang K., Cui Y., Lin P., Yao Z., Sun Y. JunD Regulates Pancreatic beta-Cells Function by Altering Lipid Accumulation. Front. Endocrinol. 2021;12 doi: 10.3389/fendo.2021.689845. [DOI] [PMC free article] [PubMed] [Google Scholar]
- 41.Weitzman J.B., Fiette L., Matsuo K., Yaniv M. JunD protects cells from p53-dependent senescence and apoptosis. Mol. Cell. 2000;6:1109–1119. doi: 10.1016/s1097-2765(00)00109-x. [DOI] [PubMed] [Google Scholar]
- 42.Yang H., Wang J., Zhang Z., Peng R., Lv D., Liu H., Sun Y. Sp1-Induced lncRNA Rmrp Promotes Mesangial Cell Proliferation and Fibrosis in Diabetic Nephropathy by Modulating the miR-1a-3p/JunD Pathway. Front. Endocrinol. 2021;12 doi: 10.3389/fendo.2021.690784. [DOI] [PMC free article] [PubMed] [Google Scholar]
- 43.Zhang J.Y., Wang X.M., Xing X., Xu Z., Zhang C., Song J.W., Fan X., Xia P., Fu J.L., Wang S.Y., et al. Single-cell landscape of immunological responses in patients with COVID-19. Nat. Immunol. 2020;21:1107–1118. doi: 10.1038/s41590-020-0762-x. [DOI] [PubMed] [Google Scholar]
Associated Data
This section collects any data citations, data availability statements, or supplementary materials included in this article.
Supplementary Materials
Data Availability Statement
Raw and processed scRNA-seq data are available from the NCBI Gene Expression Omnibus under accession number GEO: GSE248284. The scRNA-seq data for healthy controls were downloaded from the Genome Sequence Archive of the Beijing Institute of Genomics (BIG) Data Center, BIG, Chinese Academy of Sciences, under accession code HRA000150.
This paper does not report original code.
Any additional information required to reanalyze the data reported in this paper is available from the lead contact upon request.