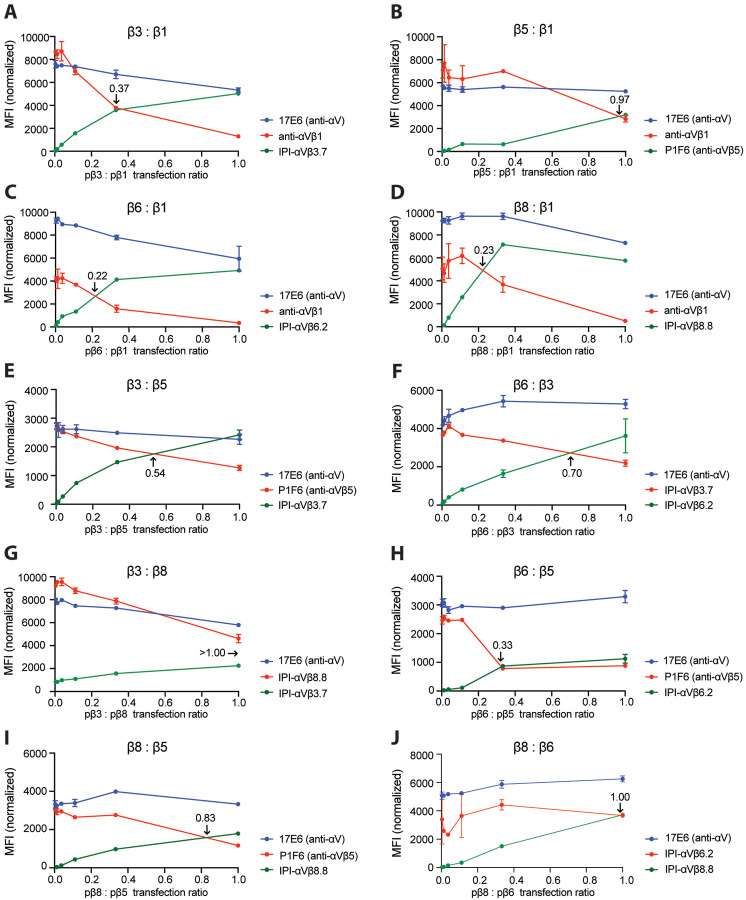
Figure 8.
Competition between integrin β-subunits for the αV-subunit. A–J. MFI of directly fluorophore-labeled integrin antibodies measured by flow cytometry. In each competitive titration, the concentration of the αV-subunit plasmid (pαV) and one β-subunit plasmid remained constant at 0.6 μg (red line) while the other β-subunit plasmid (green line) was titrated until reaching 0.6 μg. The αV-subunit plasmid was 0.2 μg in A–E and H–I and 0.6 μg in F–G and J. In all reactions, empty vector plasmid was added to make the total plasmid concentration 1.8 μg. The ratio of the two β subunit plasmids at the cross point is indicated in each panel. The MFI of each β-subunit antibody was normalized relative to the MFI of the 17E6 αV antibody (Fig. S7).

