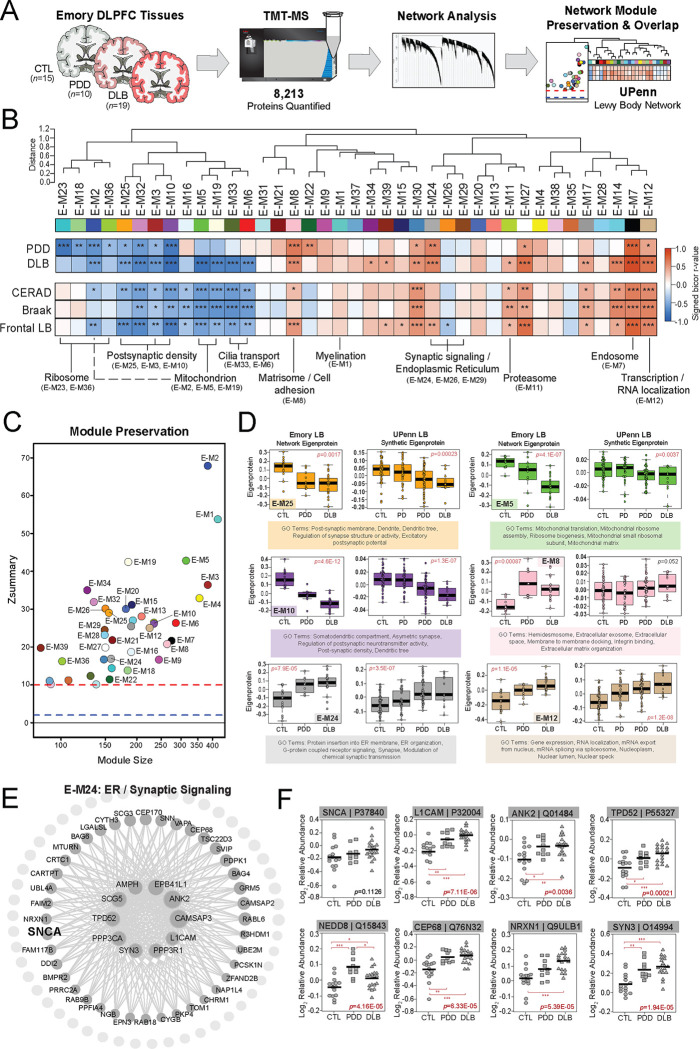
Figure 4. LBD-associated network alterations are replicated in an Emory tissue cohort.
(A) Study approach for analyzing co-expression across the Emory DLPFC tissues and comparing these network-level alterations to the UPenn dataset. TMT-MS resulted in the quantification of 8,213 proteins across all cases, which included 15 controls, 10 PDD, and 19 DLB tissues. The Emory and UPenn networks were compared using module preservation and overlap analyses. (B) Co-expression network generated by WGCNA across all Emory cases, consisting of 39 modules each labeled with a number and color. Module relatedness is shown in the dendrogram. As in the UPenn network, module abundances were correlated to each disease diagnosis and measures of pathological burden with positive correlations indicated in red and negative correlations in blue. Gene ontology analysis was used to identify the primary biology reflected by each module. Asterisks in each heat map indicate the statistical significance of the trait correlation (*, p<0.05; **, p<0.01; ***, p<0.001). (C) Module preservation analysis of Emory network into the UPenn network. Modules with a Zsummary score of greater than or equal to 1.96 (q=0.05, blue dotted line) were considered preserved, while modules with Zsummary scores of greater than or equal to 10 (q=1.0E-23, red dotted line) were considered highly preserved. (D) Select Emory network module eigenproteins with their corresponding synthetic eigenproteins in the UPenn network. The UPenn synthetic eigenproteins reflected the weighted module abundance of the top 20% of proteins by kME comprising each Emory module. All Emory module eigenproteins shown were significantly altered (p<0.05) across groups with synthetic eigenproteins that replicated in the UPenn network. ANOVA p values are provided for each eigenprotein plot. Box plots represent the median and 25th and 75th percentiles, while data points up to 1.5 times the interquartile range from the box hinge define the extent of error bar whiskers. (E) Graphical representation of individual proteins in the E-24 module arranged by kME with strong hubs at the center. SNCA is designated in bold. (F) Plots of individual protein abundances across groups for members of the E24 protein module. ANOVA p values are provided for each abundance plot (*, p<0.05; **, p<0.01; ***, p<0.001). Abbreviations: CTL, control; PDD, Parkinson’s disease dementia; DLB, Dementia with Lewy bodies; SNCA, α-synuclein; ER, endoplasmic reticulum.

