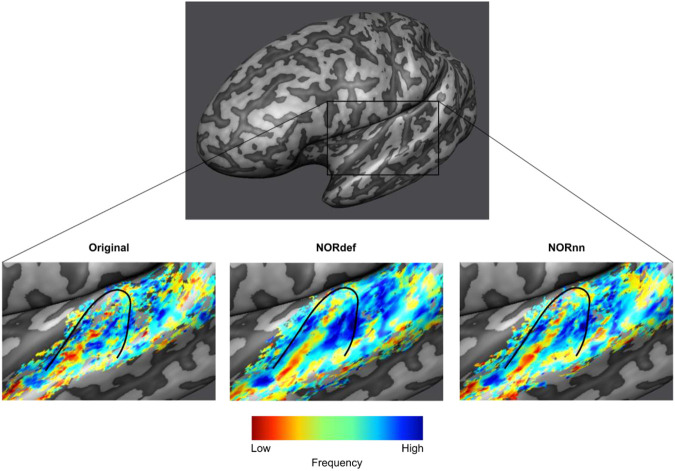
Figure 5. Tonotopic maps.
Frequency preference maps are computed for each dataset and for one example participant we display these maps on an inflated mid-GM surface. Denoising does not seem to alter the frequency preference as the high-low high gradient is visible in all three datasets. The maps computed from the denoised datasets are less noisy.

