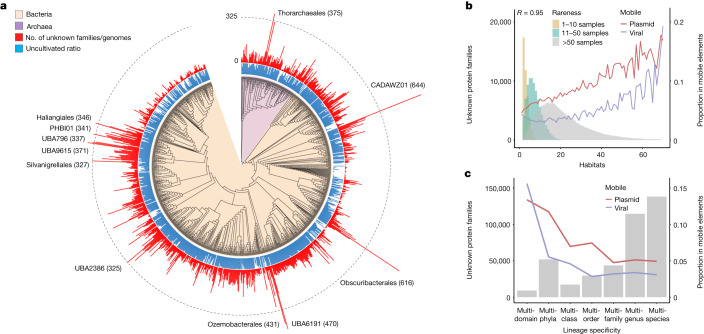
Fig. 3. FESNov gene families are spread across the entire microbial phylogeny, covering a variety of habitats.
a, Phylogenetic distribution of FESNov gene families across the GTDB5 bacterial and archaeal phylogeny, collapsed at the order level. Red bars indicate the number of unknown gene families per genome in each taxonomic order; blue bars represent the proportion of uncultivated species under each collapsed order. Branches with more than 325 unknown gene families are indicated. b, Ecological breadth (measured as number of habitats) of FESNov gene families binned into three levels of rareness (number of samples in which they are detected). Red and blue lines indicate the proportion of gene families predicted as mobile in plasmids and viral contigs, respectively. R indicates Spearman correlation coefficient between number of habitats and proportion of mobile (in plasmid or viral contigs) FESNov gene families. c, Number of FESNov gene families confined to each taxonomic rank attending to the last common ancestor of their family members. Lines indicate the proportion of gene families detected in plasmids (red) or viral (blue) contigs.

