

Summary
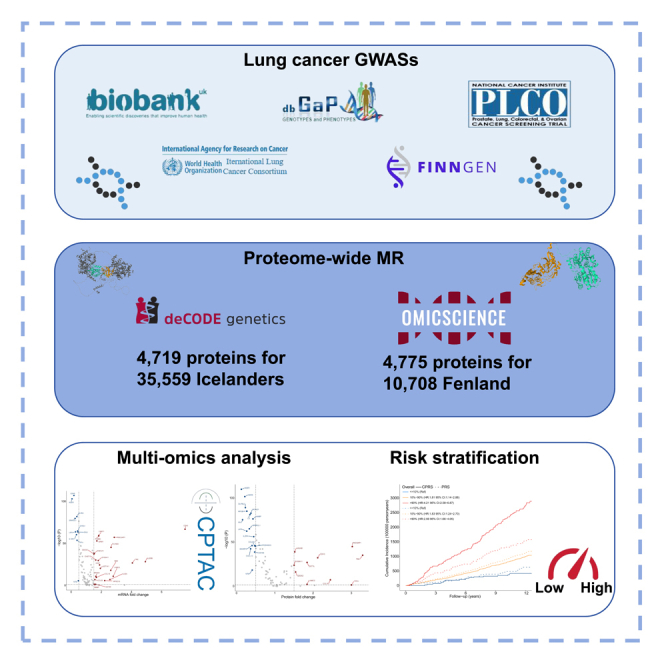
Plasma proteins are promising biomarkers and potential drug targets in lung cancer. To evaluate the causal association between plasma proteins and lung cancer, we performed proteome-wide Mendelian randomization meta-analysis (PW-MR-meta) based on lung cancer genome-wide association studies (GWASs), protein quantitative trait loci (pQTLs) of 4,719 plasma proteins in deCODE and 4,775 in Fenland. Further, causal-protein risk score (CPRS) was developed based on causal proteins and validated in the UK Biobank. 270 plasma proteins were identified using PW-MR meta-analysis, including 39 robust causal proteins (both FDR-q < 0.05) and 78 moderate causal proteins (FDR-q < 0.05 in one and p < 0.05 in another). The CPRS had satisfactory performance in risk stratification for lung cancer (top 10% CPRS:Hazard ratio (HR) (95%CI):4.33(2.65–7.06)). The CPRS [AUC (95%CI): 65.93 (62.91–68.78)] outperformed the traditional polygenic risk score (PRS) [AUC (95%CI): 55.71(52.67–58.59)]. Our findings offer further insight into the genetic architecture of plasma proteins for lung cancer susceptibility.
Subject areas: Bioinformatics, Cancer, Omics
Graphical abstract
Highlights
-
•
We evaluated the causal relationship between proteins and lung cancer in European
-
•
39 robust causal proteins were identified which represented potential drug targets
-
•
We developed a CPRS, a promising approach for lung cancer risk stratification
Bioinformatics; Cancer; Omics
Introduction
Lung cancer is the first leading cause of cancer death overall,1 and most lung cancer patients are diagnosed at late-stage where curative treatment is rarely possible.2 Lung cancer is a multifactorial malignant disease driven by environmental exposure,3 genetic factors,4 and multi-omics biomarkers.5 While the environmental and genetic polymorphisms have been widely recognized, it is crucial to explore the downstream biomarkers based on the genetic central dogma to uncover the complex disease.6,7 A variety of biomarkers have been shown to aid in the early diagnosis of lung cancer,8,9 but there are still unmet clinical needs and technical challenges. Proteins function as crucial hubs between genetics and phenotypes, and the complex protein-protein interactions that mediate signaling pathways and biological processes are essential causes of lung cancer etiology.10,11 Recently, proteomics-based risk model showed promise in predicting incident lung cancer.12,13 Naturally genetic variation, either in close physical proximity to the protein-encoding gene (cis-) or anywhere else in the genome (trans-), has wide-ranging effects on protein structure and function, with important implications for complex diseases.14 However, few studies have investigated the causal proteins in lung cancer based on large-scale population protein quantitative trait loci (pQTLs).15,16 Thus, leveraging data from human blood proteome in Mendelian randomization (MR) studies facilitates deeper characterization of circulating proteins causally associated with lung cancer,17,18 which identifying proteins causally related to lung cancer could improve our understanding of the lung cancer genetic structure, identifying drug targets, and high-risk screening evidence for low-dose computed tomography (LDCT) screening. Additionally, high-quality proteomic studies, such as the UK Biobank (UKB) Olink project, will provide additional scientific opportunities.19
To systematically identify causal proteins, we investigated large-scale genome-wide association studies (GWASs) with lung cancer in five databases,20 including UKB, the prostate, lung, colorectal, and ovarian (PLCO) cancer screening trial, the International Lung Cancer OncoArray Consortium (ILCCO-OncoArray), the transdisciplinary research in cancer of the lung (TRICL) research team, and FinnGen. Leveraging pQTL summary statistics from the deCODE Genetics and Fenland cohorts, we performed meta-analysis on proteome-wide MR (PW-MR) studies and identified blood proteins causally linked to lung cancer. Finally, we aim to develop an effective tool, causal-protein risk score, to predict lung cancer risk and improve eligibility criteria for lung cancer screening programs.
Results
Proteome-wide Mendelian randomization studies of lung cancer
Using pQTLs from 35,559 Icelanders in deCODE Genetics and 10,708 Europeans in Fenland, we investigated the causal association of 4,719 and 4,775 plasma proteins with lung cancer, separately. Genetic association statistics of lung cancer were obtained from five cohorts (30,312 LC cases and 652,902 controls from UKB, PLCO, ILCCO-OncoArray, TRICL, and FinnGen) (Table S1). We performed a meta-analysis of PW-MR (PW-MR-meta) based on the two pQTLs and lung cancer genetic associations (Table S2). The workflow chart for the study design was illustrated in Figure 1. The PW-MR-meta identified 270 unique causal plasma proteins significantly associated with lung cancer (FDR-q < 0.05), and 7 overlaps were found with 351 protein-coding genes of lung cancer GWAS catalog provided by NHGRI-EBI (www.ebi.ac.uk/gwas/) (Figure 2 and Table S3). Among them, 182 proteins were identified in deCODE, and 127 proteins were identified in Fenland (Figures 3A, 3B, and S1). What’s more, we found 39 robust causal proteins (FDR-q < 0.05 in both datasets, Figures 3C and 3D), 78 moderate causal proteins (FDR-q < 0.05 in one dataset and p < 0.05 in another) and 153 general causal proteins (FDR-q < 0.05 in any dataset). Bayesian colocalization showed that 3 causal proteins (PRSS27, TAPBPL, and PSG5) had a shared single causal signal (colocalization PP.H4 > 0.7) in deCODE. 2 causal proteins (SERPING1 and GAA) had a shared single causal signal (colocalization PP.H4 > 0.7), and 2 proteins (TLR3 and MICA) had medium moderate support of colocalization (0.5 < PP.H4 < 0.7) in Fenland (Table S4). We further analyzed the effect of the top 10 significantly robust casual proteins SNPs on lung cancer from different GWAS data, which showed consistent effect direction (Figure S2). In Mendelian randomization results from the Proteome PheWAS browser,21 12 of 39 proteins were available and examined in our study, and seven were significantly associated with lung cancer or lung adenocarcinoma or lung squamous cell carcinoma (p < 0.05) (Figure S3 and Table S5).
Figure 1.

Study workflow
Figure 2.

PhenoGram of PW-MR meta studies significant associations
The blue dots represent the general causal association proteins, the green dots represent the moderate causal association proteins, the red dots represent the robust casual association proteins. The dots represent PW-MR significance, and the diamonds represent both PW-MR and GWASs significance.
Figure 3.

PW-MR meta studies of lung cancer
Manhattan plot of lung cancer PW-MR meta study using (A) deCODE and (B) Fenland data (The most significant 20 were labeled). The red dashed line represents FDR-q <0.05.
(C) The dot plot of the odds ratios (ORs) and 95% confidence intervals (CIs) of robust causal proteins (FDR-q <0.05 both dataset).
(D) Veen diagram depicting proteins associated with lung cancer in deCODE only, in Fenland only, or in both.
Multi-omics analysis for the identified proteins
We performed a multi-omics analysis to integrate the identified robust and moderate causal proteins into transcriptomics and proteomics from CPTAC. 110 unique protein-coding genes and 81 proteins that passed quality control were included. We found that the expression level of 33 protein-coding genes were different (FDR-q < 0.05, FC > 1.5 or FC < 0.5). The well-known interleukin family and immune-related genes, CDH3, IL20RB, IL36A, CD27, CD109, and CCL19 were upregulated in tumor tissues, while IL3RA, IL18R1, and CDH5 were downregulated (Figure 4A and Table S6).
Figure 4.

Main results of the multi-omics analysis for the identified proteins
(A) Volcano plot for the FC values and -log(P) values for comparison of gene expression.
(B) Volcano plot for the FC values and -log(P) values for comparison of protein abundance.
(C) KEGG pathway network from the enrichment analysis of the robust and moderate causal proteins.
(D) Protein-protein interaction network of the robust and moderate causal proteins.
Differences in abundance was observed in 27 proteins in tumor and adjacent normal tissues (FDR-q < 0.05, FC > 1.5 or FC < 0.5). Interestingly, some proteins showed similar patterns with the corresponding gene expression, such as CCL19, CDH3, CDH5, and IL3RA. However, reverse trends were found in some proteins. For example, CD109 was downregulated in tumor tissues (Figures 4B and Table S7).
Further, we performed KEGG pathway enrichment analysis for the robust and moderate causal proteins. Inflammation- and immune-related pathways were identified, such as cytokine-cytokine receptor interaction (p = 7.05 × 10⁻⁸) and viral protein interaction with cytokine and cytokine receptor (p = 3.63 × 10⁻⁵), as well as the metabolic- and classical cancer-related pathways, including glycosphingolipid biosynthesis—globo and isoglobo series (p = 3.95 × 10⁻⁴), and PI3K-Akt signaling pathway (p = 1.78 × 10⁻²), (Figures 4C and Table S8).
Using the STRING database to integrate robust and moderate causal proteins-protein interactions, we identified two main clusters: the first cluster was related to the signal transduction (e.g., GZMB, CXCL12, and FASLG) and immune system (e.g., IL1B, CCL19, and CD27); the second cluster was related to metabolic pathways (e.g., C1GALT1C1 and ST3GAL1) (Figure 4D).
Causal proteins could identify high-risk population
For the CPRS and PRS development and validation, a total of 43,395 European with Olink proteomics data in UKB were included in the prediction study. Among 117 robust and moderate causal proteins (FDR-q < 0.05 in one dataset, FDR-q < 0.05 or p < 0.05 in another) in PW-MR-meta analysis, 41 significant proteins were available in the UKB individual-level data. Finally, 16 proteins, with consistent direction of observational effect and causal effect, were selected to construct CPRS to identify high-risk populations for lung cancer incidence (Tables S9 and S10, and Figure S4). These proteins were mainly enriched in inflammatory, metabolic, and neurological categories (Figure S5).
The CPRS could stratify the lung cancer absolute incidence risk significantly in overall (log rank p < 2.20 × 10⁻¹⁶) and ever-smokers (log rank p < 2.20 × 10⁻¹⁶) in the UKB cohort. Further, all subjects were categorized into 10 groups by the deciles of CPRS and PRS, respectively. Compared with low-risk group (in the lowest tenth of the CPRS), subjects at a high genetic risk group (in the top tenth of the CPRS) were at significantly higher risk of lung cancer with a hazard ratio (HR) of 4.33 (95%CI: 2.65–7.06, p < 4.32 × 10⁻⁹) for overall (Figure S6A) and 5.51 (95%CI: 3.24–9.38, p < 3.04 × 10⁻¹⁰) for ever-smokers (Figure S6B), which outperformed PRS [top 10% versus bottom 10%: HR = 2.59 (95%CI: 1.66–4.05) for overall; HR = 2.59 (95%CI: 1.62–4.17) for ever-smokers].
A cumulative effect of the CPRS and PRS was observed for incident lung cancer according to the results from UKB. Compared with low-risk population (in the lowest tenth of the CPRS), the high-risk persons (in the top tenth of the CPRS) had a hazard ratio (HR) of 4.21 (95% CI: 2.58–6.87) (Figure 5A). Similar prediction results were observed in smokers, for ever-smoking population, the HR of high-risk persons was 5,34 (95% CI: 3.14–9.08) (Figure 5B). Meanwhile, the HRs of PRS were 2.59 (95% CI: 1.66–4.05) and 2.59 (95% CI: 1.61–4.17), respectively. Thus, compared with PRS, the CPRS had a more satisfactory performance in lung cancer risk stratification. For CPRS, participants at low-risk had a lower rate (35.92 per 100,000 person-years) of lung cancer compared to that (232.24 per 100,000 person-years) of participants with high risk. For PRS, participants at low-risk had a lower rate (50.98 per 100,000 person-years) of lung cancer compared to that (127.08 per 100,000 person-years) of participants with high risk (Figure 5A). Besides, among CPRS group, a much higher cumulative lung cancer incident was observed among ever-smokers at high genetic risk compared with low-risk participants (336.20 vs. 50.18 per 100,000 person-years). Similar with CPRS group, top tenth of PRS group had much higher cumulative lung cancer incidents (189.15 vs. 75.11 per 100,000 person-years) (Figure 5B).
Figure 5.

Main results of discrimination evaluation for CPRS and PRS
(A) Cumulative lung cancer incidence plot for CPRS (solid line) and PRS (dotted line) in the overall UKB individual protein data.
(B) Cumulative lung cancer incidence plot for CPRS (solid line) and PRS (dotted line) in the smokers UKB individual protein data. The red line indicates the high-risk persons, the yellow line indicates the intermediate-risk population, and the blue line indicates the low-risk persons. Hazard ratios and the 95% confidence intervals derived from Cox regression model adjusting for age, sex, BMI, and smoking status are provided in legend.
(C) The C-index values of CPRS and PRS generated by the Cox regression model.
Further, we evaluated the discrimination abilities of CPRS and PRS using the C-index and time-dependent AUC for lung cancer incidence. The C-index of CPRS was 0.656 (95%CI: 0.631–0.681), outperforming the traditional polygenic risk score (PRS) [0.560 (95%CI: 0.535–0.585)] (p = 5.38 × 10⁻⁸) (Figure 5C). The time-dependent AUC of CPRS was 65.93 (95%CI: 62.91–68.78, ten-year follow-up), outperforming the PRS [55.71 (95%CI: 52.67–58.59)] (Figure S7). CPRS was found to have a better discrimination power. After adjusting for non-genetic confounders (age, gender, BMI, and smoking status), the discrimination of CPRS (C-index[95%CI]: 0.777[0.757–0.797]) was still better than PRS (C-index[95%CI]: 0.758[0.738–0.778]) (p = 5.87 × 10⁻⁷), all of which were outperformed than the model only containing the non-genetic predictors (C-index[95%CI]: 0.751[0.731–0.771]) (p = 4.93 × 10⁻¹³, p = 3.95 × 10⁻⁴). The CPRS model was generally well calibrated than PRS model (Figure S8). These results suggest that the CPRS has the ability to predict risk of lung cancer and that it potentially optimizes the definition of sub-populations at high-risk in individualized lung cancer prevention.
Discussion
In this study, we systematically evaluate causal relationship between plasma proteins and lung cancer. We used GWAS summary statistics data from the UKB, PLCO, ILCCO-OncoArray, TRICL, and FinnGen, and further performed PW-MR analyses based on two large-scale pQTL populations. Multi-omics analyses were performed to evaluate the functional evidence of identified robust and moderated causal proteins. Moreover, we constructed a causal protein risk score for lung cancer based on PW-MR meta-analysis and further validated it in UKB Olink proteomics data.
We identified plasma proteins that were causally related to lung cancer and may represent new therapeutic targets for the prevention or treatment of lung cancer. Leveraging significant pQTLs in deCODE and Fenland, 270 proteins were causally associated with lung cancer. Granzyme B (GZMB), the strongest causal proteins, had protective effects for lung cancer. GZMB is a serine protease most common in cytotoxic lymphocyte and natural killer cells, which can induce Gasdermin E (GSDME) dependent pyroptosis in tumor targets to activate anti-tumor immunity both directly by cleaving GSDME and indirectly by activating caspase 3.22 Ribonuclease T2 (RNASET2) is an RNase T2 enzyme that exists in the human body, which is the only extracellular nuclease of RNase T2 family.23 RNASET2 expression was reduced in primary ovarian tumors,24 melanoma,25 and non-Hodgkin’s lymphoma.26 However, increased risk of lung cancer was associated with increased expression of RNASET2,27 which is consistent with our study. Interleukins can nurture an environment enabling and favoring cancer growth while simultaneously being essential for a productive tumor-directed immune response.28 In our study, ten interleukin-proteins were found to be causally associated with lung cancer, three of which were robust causal proteins. Major histocompatibility complex (MHC) A/B stress proteins are upregulated in response to DNA damage in many types of human cancers but expressed at low or undetectable levels by healthy cells.29,30,31,32 MICA/B can induce tumor immunity of T cells and nature killer (NK) cells, which shows promise in cancer vaccine target as a cancer vaccine target.33
We observed strong functional evidence for the identified genes from KEGG network in lung cancer tissues and adjacent normal tissues and protein-protein interaction network. The signal transduction pathway is related to various body functions and involved in some important biological processes, including cell proliferation, differentiation, apoptosis, immune regulation, and hematopoiesis.34 The immune system is intrinsic to health. By broadly assessing human immune system variation and considering interdependencies between immune system components, we could provide evidence for cancer prevention or treatment by modulating the immune system.35 The metabolic pathway is closely related to tumor initiation and progression, tumor microenvironment (TME), which can be depleted of certain nutrients that force cancer cells to adapt by inducing nutrient scavenging mechanisms to sustain cancer cell proliferation.36
The causal proteins improve the ability for lung cancer high-risk population identification. It is widely recognized that early screening for lung cancer is most likely beneficial when target tumor type has relatively uniform biology and a slower rate of progression.37 Targeting high-risk populations with appropriate strategies for early detection could get remarkable benefits of mortality reduction.38 However, the selection of population to be screened is a complex procedure, with difficulty accurately identifying high-risk persons who are most likely to benefit from screening. Plasma proteomes provide insight into contributing biological factors, and we investigated their potential value for future lung cancer prediction. By evaluating C-index, time-dependent AUC, and risk stratification, we demonstrated that proteins had better predictive power than PRS.
It is possible to combine CPRS with lung cancer screening strategies to improve screening efficiency. People with high-risk should be screened frequently and regularly (e.g., once every three years), which is expected to further reduce the cancer mortality. Therefore, CPRS is expected to serve as an informative benchmark to incorporate the PRS and baseline information that have been used in cancer risk assessment.
Our work has several strengths. Firstly, through harmonizing multiple large-scale GWASs, we comprehensively evaluated causal relationships between plasma proteins and lung cancer. We identified blood proteins causally linked with lung cancer through PW-MR-meta. Secondly, we explored the relationship between identified proteins and lung cancer at multi-omics levels, including genomics, transcriptomics, and proteomics, which revealed the identified signals were functional. Thirdly, we focused on the high-risk population stratification based on proteins, while few studies developed risk scores using causal proteins. We demonstrated the stable performance of CPRS across lung cancer in the UKB Olink proteomics data, especially for its ability to identify high-risk persons. Therefore, the CPRS might be a complementary genetic risk assessment tool combined with the existing screening guidelines.
In conclusion, this large-scale GWASs and PW-MR meta-analyses study for lung cancer identified plasma proteins causally associated with lung cancer as well as pathways related to this disease, which may be further explored as possible therapeutic targets for lung cancer. Furthermore, this study provides novel insights into population risk stratification based on CPRS, which can be used as a valuable supplement to existing lung cancer screening strategies.
Limitations of the study
It is essential to acknowledge the limitations of our study. Firstly, although the proteins and CPRS weights were determined using the PW-MR-meta information, the observational proteomics replication was conducted in a subgroup of UKB Olink proteomics data only. External proteomics studies should be conducted to validate these findings. Secondly, we focused on European ancestry only. It is essential to evaluate the associations of proteins and performance of CPRS in non-European populations. Thirdly, we mainly investigated the causal protein effects on population risk stratification. However, the contribution of environmental factors should not be ignored. Well-established risk prediction models incorporated with environmental exposure factors, PRS, and CPRS should be developed for lung cancer.
STAR★Methods
Key resources table
Resource availability
Lead contact
Further information and requests for resources and reagents should be directed to and will be fulfilled by the lead contact, Sipeng Shen (sshen@njmu.edu.cn).
Materials availability
This study did not generate new unique reagents.
Data and code availability
-
•
This paper analyzes existing, publicly available data. These access URLs for the datasets are listed in the key resources table.
-
•
This paper does not report original code.
-
•
Any additional information required to reanalyze the data reported in this paper is available from the lead contact upon request.
Experimental model and study participant details
Our study is computational that does not use experimental models typical in the life sciences.
Method details
Study population and data collection
UKB
The UK Biobank (UKB) is a population-based prospective cohort of individuals aged 40–69 years, enrolled between 2006 and 2010.43 The work described herein was approved by the UK Biobank under applications 92675. All the phenotype data were accessed in March 2022. Health-related outcomes were ascertained via individual record linkage to national cancer and mortality registries and hospital in-patient encounters. Cancer diagnoses were coded by International Classification of Diseases version 10 (ICD-10) codes. Individuals with at least one recorded incident diagnosis of a borderline, in situ, or primary malignant cancer were defined as cases collected from data fields 41270 (Diagnoses - ICD10), 41202 (Diagnoses - main ICD10), 40006 (Type of cancer: ICD10), and 40001 (primary cause of death: ICD10). The data analyses were performed on DNAnexus Research Analysis Platform (RAP).
To minimize the possibility of including lung cancer metastasis, we excluded lung cancer that occurred within 5 years of different primary cancer. In addition, prevalent lung cancer cases diagnosed prior to baseline enrollment were excluded. Finally, we analyzed 338,726 participants of European ancestry with 4,083 primary lung cancer cases and 334,643 cancer-free controls.
PLCO
The Prostate, Lung, Colorectal and Ovarian (PLCO) Cancer Screening Trial is a large population-based randomized trial designed and sponsored by the National Cancer Institute (NCI) to determine the effects of screening on cancer-related mortality and secondary endpoints in over 150,000 men and women aged 55 to 74.44 Participants have been under follow-up for cancer incidence and mortality since the completion of screening procedure in 2006. In addition, PLCO included a large biological sample biorepository which has served as a unique resource for cancer research, particularly for etiologic and early-marker studies.
Lung cancer diagnoses were coded by I International Classification of Disease for Oncology version 2 (ICD-O-2). Only primary invasive lung cancer diagnosed during the trial were included. Finally, we analyzed 98,651 participants of European ancestry with 2,455 primary lung cancer cases and 96,196 controls.
ILCCO-OncoArray
OncoArray Consortium is a network created to increase understanding of the genetic architecture of common cancers. The OncoArray GWAS was originally designed to profiled genotype information of 57,775 participants, obtained from 29 studies across North America, Europe, and Asia.27 All participants signed the informed consent, and the studies were approved by the local internal review boards or ethics committees and administered by trained personnel.
Tumors from patients were classified as adenocarcinomas, squamous carcinomas, large-cell carcinomas, mixed adenosquamous carcinomas and other NSCLC histologies following either the International Classification of Diseases for Oncology (ICD-O) or World Health Organisation coding.
FinnGen
FinnGen (FG) is a public-private partnership project combining electronic health record and registry data from six regional and three Finnish biobanks.45,46 Participant data (with informed consent) include genomics and health records linked to disease endpoints. FinnGen participants provided informed consent for biobank research. The FinnGen study is approved by Finnish Institute for Health and Welfare.
We used summary-level data from FG participants with completed genetic measurements and imputation. Association results for lung cancer and cancer-free controls were downloaded (R6 data release).
deCODE genetics
The deCODE genetics database contains extensive genotype and phenotype information. 4,719 proteins for 35,559 Icelanders summary data were collected.47
Fenland cohort
The Fenland study is a population-based cohort of 12,435 participants of Caucasian-ancestry born between 1950 and 1975 who underwent detailed phenotyping at the baseline visit from 2005 to 2015. 4,775 proteins for 10,708 Caucasian summary data were collected.18
UKB Olink proteomics
Olink proteomics data was generated in UKB Pharma Proteomics Project.19 We analyzed the initial batch of data which was generated using the Olink Explore 1536 platform (1,463 proteins) on 43,395 European descent participants. Linkages to National disease and death registries were used to identify incident lung cancers according to ICD10 code of C34. Participants diagnosed with lung cancer prior to recruitment were excluded. Additionally, participants without Olink proteomics data from recruitment were excluded from all prediction model construction. Finally, 490 newly diagnosed lung cancer were recruited.
CPTAC
The National Cancer Institute’s Clinical Proteomic Tumor Analysis Consortium (CPTAC) is a national effort to accelerate the understanding of the molecular basis of cancer through the application of large-scale proteome and genome analysis.48 Fragments Per Kilobase per Million mapped reads (FPKM) values from lung tissue RNA sequencing data were logarithmically transformed. The Tandem Mass Tag (TMT) labeled global proteome was analyzed using ThermoFisher mass spectrometer (Thermo Scientific).49 After filtering, 195 pairs of genes expression and 200 pairs of proteins abundance of participants’ tumor and adjacent normal tissues were analyzed.
Quality control for the SNP array data
The genotype data of UKB were imputed into the dataset using computationally efficient methods combined with the Haplotype Reference Consortium (HRC) and UK10K haplotype resource. Details of the genotype data were described in data-fields 22418 and 22828.
The genotype data of PLCO were generated from the Illumina GSA (673,132 markers), Oncoarray (474,276 markers), and historical data including Illumina OmniExpress (OmniX) (715,823 markers), Omni2.5M (Omni25) (2,310,570 markers) and Human Quad 610 (580,912 markers) SNP arrays. The duplicated samples between different platforms were removed.
Genotyping of 533,631 SNPs in ILCCO-OncoArray was completed at the Center for Inherited Disease Research, the Beijing Genome Institute, the Helmholtz Zentrum München, Copenhagen University Hospital and the University of Cambridge in Illumina Infinium OncoArray platform.50 Before standard quality control, we removed the intentionally duplicated samples and samples from unrelated OncoArray studies and HapMap control individuals of European, African, Chinese and Japanese origins.
The genotype data of TRICL were generated from the Affymetrix Axiom Array containing 414,504 markers, which was a custom panel of key LC GWAS markers, and rare coding SNVs and indels.
Further excluded were those who lacked disease status, were second-degree relatives or closer having identity by descent (IBD) > 0.2 or had low-quality DNA (call rate < 95%), or sex inconsistency, or were non-European. SNPs were removed if meeting any of the following criteria: (1) sex chromosome, (2) minor allele frequency (MAF) < 0.05, (3) call rate < 95%, and (4) Hardy-Weinberg equilibrium (HWE) test P < 1.00×10⁻⁷ in controls or P < 1.00×10⁻¹² in cases.
The summary-level data of FinnGen cohort was based on the chip genotype data with Illumina and Affymetrix arrays, and then imputed by using the population-specific SISu v3 imputation reference panel.
Data processing of the deCODE Genetics and Fenland cohort
deCODE Genetics sequenced the whole genome of 49,708 Icelanders to a median of 32× using Illumina technology.47 In total, deCODE Genetics has genotyped 166,281 Icelanders with Illumina SNP chips, long-range phased and imputed based on the sequenced dataset, of which 35,559 had proteins measured by SomaScan version 4. Aptamers for non-human proteins and aptamers listed as deprecated by SomaScan as well as aptamers mapping to multiple genes were excluded, leaving 4,907 aptamers target a total of 4,719 unique proteins.
Fenland participants were genotyped using three genotyping arrays: Illumina Infinium Core Exome 24v1, Affymetrix SNP 5.0, and Affymetrix UK Biobank Axiom array for 12,435 participants of White British ancestry, which resulted in > 17 million genotyped or imputed variants with a minor allele frequency of > 0.1%. Relative protein abundances of 4,775 human protein targets were evaluated by 4,979 aptamers (SomaLogic V4), which only included human protein targets and SOMAmers deemed acceptable by SomaLogic and that had a value between 0.25 and 4 for all scaling factors.14 The 4775 proteins were used to perform the association study.
Imputation based on TOPMed imputation server
To estimate missing genotype information, we performed an imputation on the TOPMed online imputation server, which phased haplotypes with Eagle v2.451 using TOPMed data (Version r2) as a reference panel that included 97,256 reference samples and 308,107,085 genetic variants.52 The server performed imputations for PLCO, ILCCO-OncoArray, and TRICL using Minimac (version 4) software.
All genetic variants were lifted to GRCh38 coordinates to maintain consistency with the UKB WES project. Poorly imputed SNVs with imputation quality score R2 < 0.4 and SNVs on sex chromosomes were excluded from the analyses.
Association analyses of single-variant level
We performed single-variant association tests for common variants (MAF ≥ 0.01) using Scalable and Accurate Implementation of GEneralized mixed model SAIGE (v1.1.6).39 SAIGE is a toolkit developed for genome-wide association tests in biobank-level datasets that uses saddlepoint approximation to handle extreme case-control imbalances of binary traits and linear mixed models to account for sample relatedness.
Proteome-wide MR (PW-MR) analyses
We performed Proteome-Wide Mendelian Randomization (PW-MR) based on cis- and trans pQTL from deCODE and Fenland, and GWAS summary data from UKB, PLCO, ILCCO-OncoArray, and TRICL, and FinnGen. For instrument variable selection, we retained SNPs which were genome-wide significant (both cis-SNP and trans-SNP, P < 5.0 × 10⁻⁸) in each pQTL in our study. In order to minimize correlated horizontal pleiotropy, we retained SNPs independent of each other (LD windows 10000kb, R2 < 0.1 in 1000G) in pQTLs. To quantify the statistical power of the pQTLs, strength of SNPs was evaluated by F-statistics, where F-statistics threshold ≥ 10 of IV indicates sufficient statistical strength.53 If any IVs had F-statistics < 10, we considered those to have limited power (potentially causing weak instrument bias54 and removed these from the MR.
Bayesian colocalization analysis using COLOC
To further investigate whether association signals with robust causal proteins and lung cancer were derived by shared causal variant, we performed a Bayesian colocalization analysis of 270 causal proteins and lung cancer in deCODE and Fenland. Colocalization analysis relies on a single causal variant assumption, and the posterior probability (PP) for five hypotheses at each pleiotropic locus is provided: (i) H0: neither trait has a genetic association in the region; (ii) H1: only trait 1 has a genetic association in the region; (iii) only trait 2 has a genetic association in the region; (iv) both traits are associated, but with different causal variants; (v) both traits are associated and shar a single causal variant. The prior probabilities were set as p1=10-4, p2=10-4, p12=10-5. For each robust causal protein, regions were defined as area within 500kb of selected variants. The posterior probability for shared a causal variant (PP.H4) >0.7 was considered to have a strong support of colocalization. Medium colocalization indication was defined as 0.5< PP.H4 <0.7.
Comparison analyses for gene expression or protein abundance in tumor and adjacent normal tissues
In our study, on the tissue level, we integrating transcriptomic and proteomic measurements to validate whether MR-identified robust and moderate causal proteins and protein-coding genes were observably associated with lung cancer. The paired gene expression and protein abundance data tumor and adjacent normal tissues was collected from CPTAC. The protein abundances were further grouped by unique gene names using sum of all the protein abundances belonging to the identical gene name.
Pathway enrichment analysis
In our study, pathway enrichment analysis was performed to identifies specific biological pathways as being particularly abundant in a list of protein-coding genes of MR-identified robust and moderate causal proteins. We collected the pathway information with gene sets from the KEGG database, containing a total of 213 pathways. All enrichment analyses were performed using the R package clusterProfiler.42
Protein-protein interaction analysis
To further understand the protein-protein interactions, we used the STRING database, which considered both physical interactions as well as functional associations.55 The protein interaction network was clustered into different colors using Markov Clustering (MCL).
Development and validation of the risk score based on causal proteins
We developed a causal-protein risk score (CPRS) for population risk stratification based on lung cancer causal proteins. To perform independent validation phase, the PW-MR-meta causal effect defined as weights of selected proteins. The CPRS was constructed included robust and moderate causal proteins (FDR-q < 0.05 in one data set, FDR-q < 0.05 or P < 0.05 in another) in the PW-MR-meta analysis with consistent direction of observational (Cox proportional hazards model) effect and causal effect.
The CPRS was generated as: , where denoted the coefficient of the ith protein Pi calculated by PW-MR-meta ((BetadeCODE + BetaFenland)/2).
In the validation phase, the protein panel with previously determined weights was used to generate CPRS in the UKB Olink proteomics data.
We used person-year to describe the absolute lung cancer incidence risk, which was defined as the time gap from the data of cohort enrollment to lung cancer diagnosis or the last follow-up, whichever came first.
Polygenic risk score generation
Polygenic risk score (PRS) was constructed as the sum of the number of minor alleles of SNPs participants carries, weighted by their effect size as Iog-odds ratio. We used PRS-128 (128 SNPs) to generate PRS56,57 based on UKB Olink proteomics data using PLINK 1.9 (https://www.cog-genomics.org/plink/). These SNPs were collected from the known susceptibility loci of lung cancer and conditions related to lung cancer (such as lung function impairment) previously identified through literature curation and NHGRI-EBI GWAS Catalog (https://www.ebi.ac.uk/gwas/), and additional loci that passed the suggestive significance-level in GWAS studies. When correlation exists, variants representing independent loci with the strongest statistical significance were retained.
Qualification and statistical analysis
Statistics and software
The genome-wide association testing of 4,719 plasma protein were preformed using linear mixed model with 27.2 million imputed variants as genotypes after adjusting rank-inverse normal transformed levels for age, sex, and sample age for the deCODE Health study. The likelihood-ratio test to compute all P values.47
PW-MR analyses were performed using Wald ratio (proteins with only one available SNP) or inverse variance weighted (IVW) method58,59 for all other proteins by TwoSampleMR package40 to estimate the causal effect of blood proteins on lung cancer. MR Steiger test of causality directionality was performed using ‘directionality_test’ function in TwoSampleMR package.40 The presence of pleiotropy was further investigated using MR-PRESSO and MR-Egger method60 to estimate the potential effect of pleiotropy.61 For MR-Egger intercept P value<0.05, we considered these protein-disease signals as influenced by horizontal pleiotropy. We also applied Cochran’s Q test to estimate the potential heterogeneity of MR estimates (P value<0.05). Proteins with horizontal pleiotropy and heterogeneity were excluded from any of the follow-up analyses. The results of PW-MR were summarized by meta-analysis (PW-MR-meta). A 5% FDR correction threshold was applied to correct for multiple testing. Bayesian colocalization was performed using the “coloc” R package.41
Paired t-test (FDR-q < 0.05) and fold change (FC > 1.5 or FC < 0.5) were used to identify the differential gene expression or protein abundance.
Cox proportional hazards models Hazard ratios were used to evaluated the association between CPRS, PRS and lung cancer risk adjusting for age, sex, body mass index (BMI), and smoking status. (HRs) and 95% confidence interval (CI) were calculated. Participants were classified into ten equal parts according to the distribution of CPRS and PRS, respectively. And we compared hazard ratios (HR) for each part with those at the lowest tenth. Individuals within the top 10%, 10%-90%, and the bottom 10% of CPRS and PRS were considered as populations at high, intermediate, and low genetic risk respectively. We also used Cox regression to calculate and compared cumulative incidence of CPRS and PRS for lung cancer risk in each three subgroups, respectively. The discrimination performance of the risk scores were evaluated by Harrell’s C-index and the time-dependent area under receiver operating characteristic curve (AUC) using the R package timeROC. We used 10-fold internal cross-validation (repeat 500 times) that adjusted AUC for overfitting. Student t-test was performed to analysis the differences of Harrell’s C-index using the “cindex.comp” function of R package SurvComp.62 All data analyses were performed using R software (version 4.2.3, https://www.r-project.org/).
Acknowledgments
We want to acknowledge the participants and investigators of deCODE Genetics, Fenland cohort, UK Biobank, PLCO, ILCCO-OncoArray, TRICL, FinnGen, and CPTAC.
Funding: National Natural Science Foundation of China (82220108002 to F.C., 82103946 and 82373685 to S.S., 82173620 to Y.Z.), Natural Science Foundation of the Jiangsu Higher Education Institutions of China (21KJB330004 to S.S.), and US NIH (NCI) grant #U01CA209414 to DCC.
Author contributions
S.S. and F.C. contributed to the study design. S.S. and H.L. contributed to data collection. H.L. and S.D. performed statistical analyses and interpretation. H.L. and S.S. drafted the manuscript. J.D., Y.J., Z.L., Q.F., Y.Z., D.Y., R.Z., Y.Z., and D.C. revised the final manuscript. All authors approved the final version of the manuscript.
Declaration of interests
The authors declare no conflicts of interest.
Published: January 20, 2024
Footnotes
Supplemental information can be found online at https://doi.org/10.1016/j.isci.2024.108985.
Contributor Information
Sipeng Shen, Email: sshen@njmu.edu.cn.
Feng Chen, Email: fengchen@njmu.edu.cn.
Supplemental information
References
- 1.Siegel R.L., Miller K.D., Wagle N.S., Jemal A. Cancer statistics, 2023. CA A Cancer J. Clin. 2023;73:17–48. doi: 10.3322/caac.21763. [DOI] [PubMed] [Google Scholar]
- 2.Thai A.A., Solomon B.J., Sequist L.V., Gainor J.F., Heist R.S. Lung cancer. Lancet. 2021;398:535–554. doi: 10.1016/s0140-6736(21)00312-3. [DOI] [PubMed] [Google Scholar]
- 3.Wang F., Tan F., Shen S., Wu Z., Cao W., Yu Y., Dong X., Xia C., Tang W., Xu Y., et al. Risk-stratified Approach for Never- and Ever-Smokers in Lung Cancer Screening: A Prospective Cohort Study in China. Am. J. Respir. Crit. Care Med. 2023;207:77–88. doi: 10.1164/rccm.202204-0727OC. [DOI] [PubMed] [Google Scholar]
- 4.Byun J., Han Y., Li Y., Xia J., Long E., Choi J., Xiao X., Zhu M., Zhou W., Sun R., et al. Cross-ancestry genome-wide meta-analysis of 61,047 cases and 947,237 controls identifies new susceptibility loci contributing to lung cancer. Nat. Genet. 2022;54:1167–1177. doi: 10.1038/s41588-022-01115-x. [DOI] [PMC free article] [PubMed] [Google Scholar]
- 5.Malhotra J., Malvezzi M., Negri E., La Vecchia C., Boffetta P. Risk factors for lung cancer worldwide. Eur. Respir. J. 2016;48:889–902. doi: 10.1183/13993003.00359-2016. [DOI] [PubMed] [Google Scholar]
- 6.Wu Y., Qi T., Wray N.R., Visscher P.M., Zeng J., Yang J. Joint analysis of GWAS and multi-omics QTL summary statistics reveals a large fraction of GWAS signals shared with molecular phenotypes. Cell Genom. 2023;3:100344. doi: 10.1016/j.xgen.2023.100344. [DOI] [PMC free article] [PubMed] [Google Scholar]
- 7.Sadler M.C., Auwerx C., Deelen P., Kutalik Z. Multi-layered genetic approaches to identify approved drug targets. Cell Genom. 2023;3:100341. doi: 10.1016/j.xgen.2023.100341. [DOI] [PMC free article] [PubMed] [Google Scholar]
- 8.Seijo L.M., Peled N., Ajona D., Boeri M., Field J.K., Sozzi G., Pio R., Zulueta J.J., Spira A., Massion P.P., et al. Biomarkers in Lung Cancer Screening: Achievements, Promises, and Challenges. J. Thorac. Oncol. 2019;14:343–357. doi: 10.1016/j.jtho.2018.11.023. [DOI] [PMC free article] [PubMed] [Google Scholar]
- 9.Li N., Tan F., Chen W., Dai M., Wang F., Shen S., Tang W., Li J., Yu Y., Cao W., et al. One-off low-dose CT for lung cancer screening in China: a multicentre, population-based, prospective cohort study. Lancet Respir. Med. 2022;10:378–391. doi: 10.1016/S2213-2600(21)00560-9. [DOI] [PubMed] [Google Scholar]
- 10.Cheung C.H.Y., Juan H.F. Quantitative proteomics in lung cancer. J. Biomed. Sci. 2017;24:37. doi: 10.1186/s12929-017-0343-y. [DOI] [PMC free article] [PubMed] [Google Scholar]
- 11.Kar G., Gursoy A., Keskin O. Human cancer protein-protein interaction network: a structural perspective. PLoS Comput. Biol. 2009;5:e1000601. doi: 10.1371/journal.pcbi.1000601. [DOI] [PMC free article] [PubMed] [Google Scholar]
- 12.Feng X., Wu W.Y.Y., Onwuka J.U., Haider Z., Alcala K., Smith-Byrne K., Zahed H., Guida F., Wang R., Bassett J.K., et al. Lung cancer risk discrimination of prediagnostic proteomics measurements compared with existing prediction tools. J. Natl. Cancer Inst. 2023;115:1050–1059. doi: 10.1093/jnci/djad071. [DOI] [PMC free article] [PubMed] [Google Scholar]
- 13.Yang Y., Xu S., Jia G., Yuan F., Ping J., Guo X., Tao R., Shu X.O., Zheng W., Long J., Cai Q. Integrating genomics and proteomics data to identify candidate plasma biomarkers for lung cancer risk among European descendants. Br. J. Cancer. 2023;129:1510–1515. doi: 10.1038/s41416-023-02419-3. [DOI] [PMC free article] [PubMed] [Google Scholar]
- 14.Pietzner M., Wheeler E., Carrasco-Zanini J., Kerrison N.D., Oerton E., Koprulu M., Luan J., Hingorani A.D., Williams S.A., Wareham N.J., Langenberg C. Synergistic insights into human health from aptamer- and antibody-based proteomic profiling. Nat. Commun. 2021;12:6822. doi: 10.1038/s41467-021-27164-0. [DOI] [PMC free article] [PubMed] [Google Scholar]
- 15.Bouras E., Karhunen V., Gill D., Huang J., Haycock P.C., Gunter M.J., Johansson M., Brennan P., Key T., Lewis S.J., et al. Circulating inflammatory cytokines and risk of five cancers: a Mendelian randomization analysis. BMC Med. 2022;20:3. doi: 10.1186/s12916-021-02193-0. [DOI] [PMC free article] [PubMed] [Google Scholar]
- 16.Yang C., Fagan A.M., Perrin R.J., Rhinn H., Harari O., Cruchaga C. Mendelian randomization and genetic colocalization infer the effects of the multi-tissue proteome on 211 complex disease-related phenotypes. Genome Med. 2022;14:140. doi: 10.1186/s13073-022-01140-9. [DOI] [PMC free article] [PubMed] [Google Scholar]
- 17.Folkersen L., Gustafsson S., Wang Q., Hansen D.H., Hedman Å.K., Schork A., Page K., Zhernakova D.V., Wu Y., Peters J., et al. Genomic and drug target evaluation of 90 cardiovascular proteins in 30,931 individuals. Nat. Metab. 2020;2:1135–1148. doi: 10.1038/s42255-020-00287-2. [DOI] [PMC free article] [PubMed] [Google Scholar]
- 18.Pietzner M., Wheeler E., Carrasco-Zanini J., Cortes A., Koprulu M., Wörheide M.A., Oerton E., Cook J., Stewart I.D., Kerrison N.D., et al. Mapping the proteo-genomic convergence of human diseases. Science. 2021;374:eabj1541. doi: 10.1126/science.abj1541. [DOI] [PMC free article] [PubMed] [Google Scholar]
- 19.Sun B.B., Chiou J., Traylor M., Benner C., Hsu Y.-H., Richardson T.G., Surendran P., Mahajan A., Robins C., Vasquez-Grinnell S.G., et al. Genetic regulation of the human plasma proteome in 54,306 UK Biobank participants. bioRxiv. 2022 doi: 10.1101/2022.06.17.496443. Preprint at. [DOI] [Google Scholar]
- 20.Shen S., Li Z., Jiang Y., Duan W., Li H., Du S., Esteller M., Shen H., Hu Z., Zhao Y., et al. A Large-Scale Exome-Wide Association Study Identifies Novel Germline Mutations in Lung Cancer. Am. J. Respir. Crit. Care Med. 2023;208:280–289. doi: 10.1164/rccm.202212-2199OC. [DOI] [PMC free article] [PubMed] [Google Scholar]
- 21.Zheng J., Haberland V., Baird D., Walker V., Haycock P.C., Hurle M.R., Gutteridge A., Erola P., Liu Y., Luo S., et al. Phenome-wide Mendelian randomization mapping the influence of the plasma proteome on complex diseases. Nat. Genet. 2020;52:1122–1131. doi: 10.1038/s41588-020-0682-6. [DOI] [PMC free article] [PubMed] [Google Scholar]
- 22.Zhang Z., Zhang Y., Xia S., Kong Q., Li S., Liu X., Junqueira C., Meza-Sosa K.F., Mok T.M.Y., Ansara J., et al. Gasdermin E suppresses tumour growth by activating anti-tumour immunity. Nature. 2020;579:415–420. doi: 10.1038/s41586-020-2071-9. [DOI] [PMC free article] [PubMed] [Google Scholar]
- 23.Luhtala N., Parker R. T2 Family ribonucleases: ancient enzymes with diverse roles. Trends Biochem. Sci. 2010;35:253–259. doi: 10.1016/j.tibs.2010.02.002. [DOI] [PMC free article] [PubMed] [Google Scholar]
- 24.Acquati F., Lualdi M., Bertilaccio S., Monti L., Turconi G., Fabbri M., Grimaldi A., Anselmo A., Inforzato A., Collotta A., et al. Loss of function of Ribonuclease T2, an ancient and phylogenetically conserved RNase, plays a crucial role in ovarian tumorigenesis. Proc. Natl. Acad. Sci. USA. 2013;110:8140–8145. doi: 10.1073/pnas.1222079110. [DOI] [PMC free article] [PubMed] [Google Scholar]
- 25.Monti L., Rodolfo M., Lo Russo G., Noonan D., Acquati F., Taramelli R. RNASET2 as a tumor antagonizing gene in a melanoma cancer model. Oncol. Res. 2008;17:69–74. doi: 10.3727/096504008784523658. [DOI] [PubMed] [Google Scholar]
- 26.Patel S., Chen H., Monti L., Gould E., Haralambieva E., Schmid J., Toomey D., Woessmann W., Roncador G., Hatton C.S.R., et al. RNASET2--an autoantigen in anaplastic large cell lymphoma identified by protein array analysis. J. Proteonomics. 2012;75:5279–5292. doi: 10.1016/j.jprot.2012.06.009. [DOI] [PubMed] [Google Scholar]
- 27.McKay J.D., Hung R.J., Han Y., Zong X., Carreras-Torres R., Christiani D.C., Caporaso N.E., Johansson M., Xiao X., Li Y., et al. Large-scale association analysis identifies new lung cancer susceptibility loci and heterogeneity in genetic susceptibility across histological subtypes. Nat. Genet. 2017;49:1126–1132. doi: 10.1038/ng.3892. [DOI] [PMC free article] [PubMed] [Google Scholar]
- 28.Briukhovetska D., Dörr J., Endres S., Libby P., Dinarello C.A., Kobold S. Interleukins in cancer: from biology to therapy. Nat. Rev. Cancer. 2021;21:481–499. doi: 10.1038/s41568-021-00363-z. [DOI] [PMC free article] [PubMed] [Google Scholar]
- 29.Gasser S., Orsulic S., Brown E.J., Raulet D.H. The DNA damage pathway regulates innate immune system ligands of the NKG2D receptor. Nature. 2005;436:1186–1190. doi: 10.1038/nature03884. [DOI] [PMC free article] [PubMed] [Google Scholar]
- 30.Lanier L.L. NKG2D Receptor and Its Ligands in Host Defense. Cancer Immunol. Res. 2015;3:575–582. doi: 10.1158/2326-6066.Cir-15-0098. [DOI] [PMC free article] [PubMed] [Google Scholar]
- 31.Bahram S., Bresnahan M., Geraghty D.E., Spies T. A second lineage of mammalian major histocompatibility complex class I genes. Proc. Natl. Acad. Sci. USA. 1994;91:6259–6263. doi: 10.1073/pnas.91.14.6259. [DOI] [PMC free article] [PubMed] [Google Scholar]
- 32.Raulet D.H., Gasser S., Gowen B.G., Deng W., Jung H. Regulation of ligands for the NKG2D activating receptor. Annu. Rev. Immunol. 2013;31:413–441. doi: 10.1146/annurev-immunol-032712-095951. [DOI] [PMC free article] [PubMed] [Google Scholar]
- 33.Zhang Y., Zhang Z. The history and advances in cancer immunotherapy: understanding the characteristics of tumor-infiltrating immune cells and their therapeutic implications. Cell. Mol. Immunol. 2020;17:807–821. doi: 10.1038/s41423-020-0488-6. [DOI] [PMC free article] [PubMed] [Google Scholar]
- 34.Bolli R., Dawn B., Xuan Y.T. Role of the JAK-STAT pathway in protection against myocardial ischemia/reperfusion injury. Trends Cardiovasc. Med. 2003;13:72–79. doi: 10.1016/s1050-1738(02)00230-x. [DOI] [PubMed] [Google Scholar]
- 35.Brodin P., Davis M.M. Human immune system variation. Nat. Rev. Immunol. 2017;17:21–29. doi: 10.1038/nri.2016.125. [DOI] [PMC free article] [PubMed] [Google Scholar]
- 36.Martínez-Reyes I., Chandel N.S. Cancer metabolism: looking forward. Nat. Rev. Cancer. 2021;21:669–680. doi: 10.1038/s41568-021-00378-6. [DOI] [PubMed] [Google Scholar]
- 37.Shieh Y., Eklund M., Sawaya G.F., Black W.C., Kramer B.S., Esserman L.J. Population-based screening for cancer: hope and hype. Nat. Rev. Clin. Oncol. 2016;13:550–565. doi: 10.1038/nrclinonc.2016.50. [DOI] [PMC free article] [PubMed] [Google Scholar]
- 38.National Lung Screening Trial Research Team. Aberle D.R., Adams A.M., Berg C.D., Black W.C., Clapp J.D., Fagerstrom R.M., Gareen I.F., Gatsonis C., Marcus P.M., Sicks J.D. Reduced lung-cancer mortality with low-dose computed tomographic screening. N. Engl. J. Med. 2011;365:395–409. doi: 10.1056/NEJMoa1102873. [DOI] [PMC free article] [PubMed] [Google Scholar]
- 39.Zhou W., Nielsen J.B., Fritsche L.G., Dey R., Gabrielsen M.E., Wolford B.N., LeFaive J., VandeHaar P., Gagliano S.A., Gifford A., et al. Efficiently controlling for case-control imbalance and sample relatedness in large-scale genetic association studies. Nat. Genet. 2018;50:1335–1341. doi: 10.1038/s41588-018-0184-y. [DOI] [PMC free article] [PubMed] [Google Scholar]
- 40.Hemani G., Zheng J., Elsworth B., Wade K.H., Haberland V., Baird D., Laurin C., Burgess S., Bowden J., Langdon R., et al. The MR-Base platform supports systematic causal inference across the human phenome. Elife. 2018;7:e34408. doi: 10.7554/eLife.34408. [DOI] [PMC free article] [PubMed] [Google Scholar]
- 41.Giambartolomei C., Vukcevic D., Schadt E.E., Franke L., Hingorani A.D., Wallace C., Plagnol V. Bayesian test for colocalisation between pairs of genetic association studies using summary statistics. PLoS Genet. 2014;10:e1004383. doi: 10.1371/journal.pgen.1004383. [DOI] [PMC free article] [PubMed] [Google Scholar]
- 42.Yu G., Wang L.G., Han Y., He Q.Y. clusterProfiler: an R package for comparing biological themes among gene clusters. OMICS. 2012;16:284–287. doi: 10.1089/omi.2011.0118. [DOI] [PMC free article] [PubMed] [Google Scholar]
- 43.Backman J.D., Li A.H., Marcketta A., Sun D., Mbatchou J., Kessler M.D., Benner C., Liu D., Locke A.E., Balasubramanian S., et al. Exome sequencing and analysis of 454,787 UK Biobank participants. Nature. 2021;599:628–634. doi: 10.1038/s41586-021-04103-z. [DOI] [PMC free article] [PubMed] [Google Scholar]
- 44.Tammemägi M.C., Katki H.A., Hocking W.G., Church T.R., Caporaso N., Kvale P.A., Chaturvedi A.K., Silvestri G.A., Riley T.L., Commins J., Berg C.D. Selection criteria for lung-cancer screening. N. Engl. J. Med. 2013;368:728–736. doi: 10.1056/NEJMoa1211776. [DOI] [PMC free article] [PubMed] [Google Scholar]
- 45.Sun B.B., Kurki M.I., Foley C.N., Mechakra A., Chen C.Y., Marshall E., Wilk J.B., Biogen Biobank Team. Chahine M., Chevalier P., et al. Genetic associations of protein-coding variants in human disease. Nature. 2022;603:95–102. doi: 10.1038/s41586-022-04394-w. [DOI] [PMC free article] [PubMed] [Google Scholar]
- 46.Locke A.E., Steinberg K.M., Chiang C.W.K., Service S.K., Havulinna A.S., Stell L., Pirinen M., Abel H.J., Chiang C.C., Fulton R.S., et al. Exome sequencing of Finnish isolates enhances rare-variant association power. Nature. 2019;572:323–328. doi: 10.1038/s41586-019-1457-z. [DOI] [PMC free article] [PubMed] [Google Scholar]
- 47.Ferkingstad E., Sulem P., Atlason B.A., Sveinbjornsson G., Magnusson M.I., Styrmisdottir E.L., Gunnarsdottir K., Helgason A., Oddsson A., Halldorsson B.V., et al. Large-scale integration of the plasma proteome with genetics and disease. Nat. Genet. 2021;53:1712–1721. doi: 10.1038/s41588-021-00978-w. [DOI] [PubMed] [Google Scholar]
- 48.Satpathy S., Krug K., Jean Beltran P.M., Savage S.R., Petralia F., Kumar-Sinha C., Dou Y., Reva B., Kane M.H., Avanessian S.C., et al. A proteogenomic portrait of lung squamous cell carcinoma. Cell. 2021;184:4348–4371.e40. doi: 10.1016/j.cell.2021.07.016. [DOI] [PMC free article] [PubMed] [Google Scholar]
- 49.Cao L., Huang C., Cui Zhou D., Hu Y., Lih T.M., Savage S.R., Krug K., Clark D.J., Schnaubelt M., Chen L., et al. Proteogenomic characterization of pancreatic ductal adenocarcinoma. Cell. 2021;184:5031–5052.e26. doi: 10.1016/j.cell.2021.08.023. [DOI] [PMC free article] [PubMed] [Google Scholar]
- 50.Amos C.I., Dennis J., Wang Z., Byun J., Schumacher F.R., Gayther S.A., Casey G., Hunter D.J., Sellers T.A., Gruber S.B., et al. The OncoArray Consortium: A Network for Understanding the Genetic Architecture of Common Cancers. Cancer Epidemiol. Biomarkers Prev. 2017;26:126–135. doi: 10.1158/1055-9965.Epi-16-0106. A Publication of the American Association for Cancer Research, Cosponsored by the American Society of Preventive Oncology. [DOI] [PMC free article] [PubMed] [Google Scholar]
- 51.Loh P.-R., Danecek P., Palamara P.F., Fuchsberger C., A Reshef Y., K Finucane H., Schoenherr S., Forer L., McCarthy S., Abecasis G.R., et al. Reference-based phasing using the Haplotype Reference Consortium panel. Nat. Genet. 2016;48:1443–1448. doi: 10.1038/ng.3679. [DOI] [PMC free article] [PubMed] [Google Scholar]
- 52.Taliun D., Harris D.N., Kessler M.D., Carlson J., Szpiech Z.A., Torres R., Taliun S.A.G., Corvelo A., Gogarten S.M., Kang H.M., et al. Sequencing of 53,831 diverse genomes from the NHLBI TOPMed Program. Nature. 2021;590:290–299. doi: 10.1038/s41586-021-03205-y. [DOI] [PMC free article] [PubMed] [Google Scholar]
- 53.Lawlor D.A., Harbord R.M., Sterne J.A.C., Timpson N., Davey Smith G. Mendelian randomization: using genes as instruments for making causal inferences in epidemiology. Stat. Med. 2008;27:1133–1163. doi: 10.1002/sim.3034. [DOI] [PubMed] [Google Scholar]
- 54.Burgess S., Thompson S.G. Bias in causal estimates from Mendelian randomization studies with weak instruments. Stat. Med. 2011;30:1312–1323. doi: 10.1002/sim.4197. [DOI] [PubMed] [Google Scholar]
- 55.Szklarczyk D., Gable A.L., Nastou K.C., Lyon D., Kirsch R., Pyysalo S., Doncheva N.T., Legeay M., Fang T., Bork P., et al. The STRING database in 2021: customizable protein-protein networks, and functional characterization of user-uploaded gene/measurement sets. Nucleic Acids Res. 2021;49:D605–D612. doi: 10.1093/nar/gkaa1074. [DOI] [PMC free article] [PubMed] [Google Scholar]
- 56.Hung R.J., Warkentin M.T., Brhane Y., Chatterjee N., Christiani D.C., Landi M.T., Caporaso N.E., Liu G., Johansson M., Albanes D., et al. Assessing Lung Cancer Absolute Risk Trajectory Based on a Polygenic Risk Model. Cancer Res. 2021;81:1607–1615. doi: 10.1158/0008-5472.CAN-20-1237. [DOI] [PMC free article] [PubMed] [Google Scholar]
- 57.Zhang R., Shen S., Wei Y., Zhu Y., Li Y., Chen J., Guan J., Pan Z., Wang Y., Zhu M., et al. A Large-Scale Genome-Wide Gene-Gene Interaction Study of Lung Cancer Susceptibility in Europeans With a Trans-Ethnic Validation in Asians. J. Thorac. Oncol. 2022;17:974–990. doi: 10.1016/j.jtho.2022.04.011. [DOI] [PMC free article] [PubMed] [Google Scholar]
- 58.Burgess S., Butterworth A., Thompson S.G. Mendelian randomization analysis with multiple genetic variants using summarized data. Genet. Epidemiol. 2013;37:658–665. doi: 10.1002/gepi.21758. [DOI] [PMC free article] [PubMed] [Google Scholar]
- 59.Burgess S., Small D.S., Thompson S.G. A review of instrumental variable estimators for Mendelian randomization. Stat. Methods Med. Res. 2017;26:2333–2355. doi: 10.1177/0962280215597579. [DOI] [PMC free article] [PubMed] [Google Scholar]
- 60.Bowden J., Davey Smith G., Burgess S. Mendelian randomization with invalid instruments: effect estimation and bias detection through Egger regression. Int. J. Epidemiol. 2015;44:512–525. doi: 10.1093/ije/dyv080. [DOI] [PMC free article] [PubMed] [Google Scholar]
- 61.Bowden J., Del Greco M F., Minelli C., Davey Smith G., Sheehan N.A., Thompson J.R. Assessing the suitability of summary data for two-sample Mendelian randomization analyses using MR-Egger regression: the role of the I2 statistic. Int. J. Epidemiol. 2016;45:1961–1974. doi: 10.1093/ije/dyw220. [DOI] [PMC free article] [PubMed] [Google Scholar]
- 62.Haibe-Kains B., Desmedt C., Sotiriou C., Bontempi G. A comparative study of survival models for breast cancer prognostication based on microarray data: does a single gene beat them all? Bioinformatics. 2008;24:2200–2208. doi: 10.1093/bioinformatics/btn374. [DOI] [PMC free article] [PubMed] [Google Scholar]
Associated Data
This section collects any data citations, data availability statements, or supplementary materials included in this article.
Supplementary Materials
Data Availability Statement
-
•
This paper analyzes existing, publicly available data. These access URLs for the datasets are listed in the key resources table.
-
•
This paper does not report original code.
-
•
Any additional information required to reanalyze the data reported in this paper is available from the lead contact upon request.