

Abstract
Background:
Physical therapists frequently employ heel lifts as an intervention to reduce Achilles tendon pain and restore function.
Purpose:
To determine the short-term effect of heel lifts on clinical and gait outcomes in participants with insertional Achilles tendinopathy (IAT).
Study Design:
Case series; Level of evidence, 4.
Methods:
Participants with IAT underwent eligibility screening and completed assessments at baseline and 2 weeks later. Primary outcomes included symptom severity (Victoria Institute of Sports Assessment-Achilles [VISA-A]), gait analysis with the 10-m walk-test at 2 speeds (normal and fast), and pain during walking. Pain and gait analysis were assessed under 3 conditions: before fitting 20-mm heel lifts, immediately after heel-lift fitting, and after 2 weeks of wearing heel lifts. Ultrasound images and measurements at the Achilles insertion were obtained from prone and standing positions (with and without heel lifts). Spatiotemporal gait parameters and tibial tilt angles were evaluated at normal speed using inertia measurement units during the 3 study conditions. Differences between the conditions were analyzed using paired t test or analysis of variance.
Results:
Overall, 20 participants (12 female, 13 with bilateral IAT; mean age, 51 ± 9.3 years; mean body mass index 31.6 ± 6.8 kg/m2) completed all assessments. Symptom severity (VISA-A) of the more symptomatic side significantly improved at 2 weeks (60 ± 20.6) compared with baseline (52.2 ± 20.4; P < .01). Pain during gait (Numeric Pain Rating Scale) was significantly reduced immediately after heel-lift fitting (0.7 ± 2.0) when compared with baseline (2.2 ± 2.7, P = .043). Spatiotemporal gait parameters and tibial tilt angle before and after using heel lifts at normal walking speed were not significantly different; however, gait speed, stride length, and tibial tilt angle on both sides increased significantly immediately after using heel lifts and were maintained after 2 weeks of wear.
Conclusion:
Using heel lifts not only improved symptom severity after 2 weeks but also immediately reduced pain during gait and had a positive impact on gait pattern and speed.
Keywords: Achilles tendinopathy, ankle, gait, VISA-A score
Insertional Achilles tendinopathy (IAT) causes activity-related pain, stiffness, and, in some cases, tendon swelling and thickening close to the calcaneus.13,55 The injury has been described previously as Achilles impingement tendinopathy, as it can occur secondary to bony impingement from Haglund's deformity. 49 The Achilles tendon can develop insertional calcific tendinopathy (calcific deposits), which are found in a variety of patients, including athletes, older adults, and persons who are inactive and/or obese. 41 In persons with Achilles tendon problems, IAT occurs in 23% of cases.28,42 In other studies, the incidence rate of insertional calcific tendinopathy of the Achilles tendon has been reported to range from 9% to 49%, occurring in about 21% of the general population.7,19,35,46,54
Walking-related disability is found in persons with chronic IAT. 24 This is of concern because walking-related disability has a negative effect on one's ability to be physically active, and reduces one's quality of life.16,24 During walking, repetitive compression of the Achilles tendon against the heel may cause pain and structural damage at the insertion site.10,17,32 Furthermore, pathological changes around the heel, including bursitis, bony enlargement or calcium deposits, may exacerbate the symptoms severity of IAT. According to orthopaedic surgeons, it may be advisable for patients with insertional injuries to explore nonsurgical treatment options for a period of 3 months before considering surgery. 52 However, there is no consensus on the recommendations for the timing of surgical intervention or the best nonoperative treatment for this condition.
Currently, heel lifts are used for patients with posterior heel pain and are often recommended for Achilles tendinopathy.12,53,58 Heel lifts have been shown to reduce compressive strain at the Achilles tendon during walking activities by decreasing dorsiflexion motion.12,58 When comparing heel lifts with gold-standard treatment (eccentric exercise) among persons with midportion Achilles tendinopathy, Rabusin et al 45 found that, after 2 weeks, patients who received heel lifts had comparable Achilles tendon pain severity and quality of life compared with the eccentric exercise group. 45 For patients with IAT, the short-term impact of using heel lifts on symptoms, tendon structural changes, and gait mobility remains unknown.
The aim of this study was to determine whether the use of heel lifts can reduce pain with walking at the Achilles insertion, improve symptom severity, and improve gait kinematics in the short term among persons with IAT. We hypothesized that, when using heel lifts, there will be less pain with walking and improved gait kinematics.
Methods
Study Design and Participants
This prospective case series study included participants recruited from the University of Delaware Physical Therapy Clinic and the local community through advertisements from September 1, 2020 to August 31, 2021. After providing written informed consent, participants underwent eligibility screening and a standardized clinical examination conducted by an independent physical therapist.
Included were participants with a clinical diagnosis of IAT 55 : (1) localized pain, swelling with palpation, and/or stiffness at the tendon-bone junction not extending >2 cm from the insertion; (2) increased symptoms with loading (10 single-leg hops); and (3) impaired function, as indicated by a score of <90 on the Victorian Institute of Sports Assessment-Achilles (VISA-A). Participants with bilateral symptoms completed the VISA-A for both sides, and the more symptomatic side based on VISA-A score was included in the study. Only participants with gait impairments were included, since this study was aimed to evaluate whether heel-lift improved gait. Therefore, only those who scored <10 points on VISA-A question 3 (regarding difficulty with walking) were included. All participants had to be at least 18 years old. Participants were excluded from this study if they had an Achilles tendon rupture, received injections or shockwave treatment to the Achilles tendon in the previous 4 weeks (but not if they had taken medication), had undergone Achilles tendon surgery in the previous 3 months, or had another lower extremity or back pain that limited the ability to walk. Our institutional review board approved the study protocol, and written informed consent was obtained from all participants. All assessments were completed in the Tendon and Muscle Performance Laboratory at the University of Delaware.
Study Protocol
Each participant was asked to complete 2 onsite visits, 2 weeks apart. The first visit included baseline and immediate re-evaluations after fitting the patient with heel lifts, which were inserted bilaterally to avoid potential gait asymmetry caused by the heel lift height. Participants wore the heel lifts for 2 weeks before returning for a follow-up evaluation. Thus, there were 3 conditions under which outcomes were evaluated: baseline without using heel lifts, immediately after heel-lift fitting, and 2 weeks after wearing heel lifts.
During the study, participants were advised to wear their regular shoes. A pair of 20-mm heel lifts (EVA heel lift; model number TY-FC051) was fitted at the rearfoot of participants’ shoes atop the insole. The surface material of heel lift was made of firm breathable memory foam, and the bottom material was made of ethylene-vinyl acetate foam (Figure 1), which prevents the heel lifts from sliding in the shoe. We compared insertional angles in persons with IAT at various inclinations (10° dorsiflexion, 10° plantarflexion, flat surface, and with a 20-mm heel lift) using a validated B-mode ultrasound imaging technique. 1 Our preliminary findings indicate that the 20-mm heel lift significantly increased the insertional angle (P = .003) and provided the most comfortable shoe fit; insertional angle mean ± SD for 10° dorsiflexion (11.3° ± 7.6°), 10° plantarflexion (22.4° ± 6.2°), flat surface (16.9° ± 8.5°), and 20-mm heel lift (20.66° ± 7.1°). Each participant was asked not to change their activity level during the 2 weeks and received instructions on how to use the heel lifts as well as a wear diary to track how often and during what activities they wore the lifts over the course of 2 weeks. The wear diary was also used to record participants’ pain level in the morning and during activity as well as whether they used heel lifts each day. There was no prescribed home exercise or physical therapy during the study period.
Figure 1.
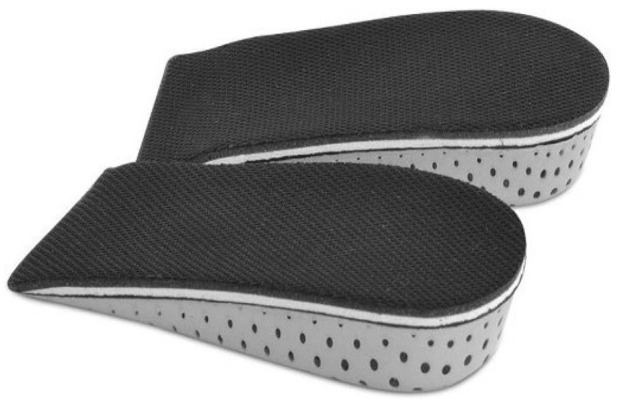
The 20-mm heel lifts used in the study.
Patient-Reported Outcomes
Our primary patient-reported outcomes were symptom severity and pain with activity. Symptom severity on each side was measured at baseline and 2 weeks after wearing heel lifts using the VISA-A questionnaire. 47 Pain intensity with activity was evaluated under all 3 study conditions (baseline, immediately after heel-lift fitting, and after 2 weeks of wearing heel lifts) during a 10-m walk test via a Numeric Pain Rating Scale (NPRS) that ranged from 0 (no pain) to 10 (worse pain imaginable). 57 Participants were asked to report their pain on the more symptomatic side after walking tests at normal and fast speeds. Average pain intensity across 3 trials of each walking speed was calculated and recorded for data analysis.
In addition, the Foot and Ankle Outcome Score-Quality of Life (FAOS-QOL), 48 Physical Activity Scale (PAS), 20 and Tampa Scale for Kinesiophobia (TSK) instruments were used to evaluate each participant's quality of life, physical activity level, and fear of movement at baseline and at the 2-week follow-up. 36 Participant expectations of benefit related to the use of heel lifts were also evaluated at baseline and after 2 weeks of wearing the heel lift. At baseline, participants were asked to rate the statement “I believe a heel lift will significantly help to improve this episode of my Achilles tendon pain” on a 5-point scale ranging from 1 (completely agree) to 5 (completely disagree). Participants were categorized into a higher-expectation of benefit group if they indicated completely agree or agree, and a lower-expectation of benefit group for all other responses. Patient satisfaction was evaluated at the 2-week follow-up using an 11-point numerical rating scale (0 = not satisfied and 10 = very satisfied) based on the question, “How satisfied are you with your treatment for your Achilles tendon injury?” Finally, we used a global rating of change (GRC) scale to quantify a participant's improvement or deterioration over time immediately after fitting the participant with heel lifts and at the 2-week follow-up. 25 The GRC uses an 11-box scale where -5 is very much worse, 0 is unchanged, and 5 is completely recovered. 25 Participants were asked the following question to rate their change: “With respect to your Achilles tendon injury, how would you describe yourself now compared to when you began the study?”
Pain Pressure Threshold
A mechanical algometer (Somedic SenseLab) was used to test the participant's pain-pressure threshold on both limbs at baseline and 2 weeks later.2,31,34,51 This small device was used to slowly apply posterior point pressure to the most painful spot of the Achilles tendon insertion (determined by palpation). Participants were instructed to press a button at the first onset of a painful sensation. Pressure on the tendon at this moment was recorded by the device and pressure was halted after this point. Three trials were performed on each side, and the average was used for analysis. 51 The interrater reliabilities of algometry were >0.788 (0.788-0.966) and pain pressure threshold values <400.11 kPa were indicative of the IAT. 4 This test was completed at baseline and at a 2-week follow-up.
Ultrasound Imaging
During the first visit, ultrasound images and measurements (tendon insertion angle [distance between tendon and calcaneus], tendon thickness, and tendon length to soleus) at the Achilles insertion were obtained by a single evaluator using the LOGIQ-e US (GE Healthcare) system and recorded using a wide-band linear array probe (5.0-12.0 MHz) with B-mode at 10 MHz. The procedure, position, and measures have been described previously and have shown good relibility. 1 In brief, we used long-axis imaging to obtain 3 independent images with the participant positioned in prone with the knees and hips extended and feet hanging freely over the edge of the plinth. In addition, 3 independent images were obtained while participants were standing barefoot on a flat surface with and without heel lifts. Images were exported to an external computer and measured by a single expert with >2 years of experience, using OsiriX imaging software (Pixmeo SARL).
Gait Analysis
Gait analysis was performed under all 3 study conditions. Using exact instructions, 8 gait evaluations were completed during 3 10-m walk tests at normal and fast speeds using timing gates along with inertial measurement units (IMUs; MuscleLab Version 10.202.93.5130, Ergotest Technology).29,44 Each participant's walking speed was assessed by asking them to walk at their usual pace and then at a faster pace on a 10-m path. 8 This helped to understand the effect of heel lifts on gait speed. The averaged gait speed of 3 trials was calculated over the central 6 m for self-selected normal and fast speeds using timing gates. Spatiotemporal gait parameters (time spent in the stance, in the swing, in the double support [ie, when both feet are in contact with the ground simultaneously], during the load-response subphase, at the footflat [ie, midstance] subphase, and in the preswing subphase)37,56; the maximum tibial tilt angles at midstance were obtained for the 3 trials of walking at normal speed and were averaged over the 9 gait cycles (middle 3 gait cycles of each trial).
The placement and analysis of IMUs (MuscleLab Version 10.202.93.5130, Ergotest Technology) have been described in a previous study. 9 In brief, Velcro straps were used to attach IMU sensors to the dorsum of the participant's left and right shoe and at the middle shaft of both tibias. The IMUs are 9 degrees of freedom wireless sensors with a sampling rate of 200 Hz. The MuscleLab system applies a proprietary algorithm to calculate spatiotemporal gait parameters. The system was also used to measure the maximal tibial tilt angle at midstance during the central 6-m of the10-m walk test. This method of evaluation is reliable for estimating the angle of the maximal tibial tilt angle at midstance and corresponds to weightbearing ankle dorsiflexion.9,27,40 The attached IMUs at the middle shaft of the tibia and on the participant's shoes allowed us to record the anteroposterior tilt angle of the foot position, as well as tibial tilt angle at static positions and during walking. The midstance phase begins at a 1 degree tilt angle before the foot is entirely flattened on the floor and finishes 1 degree after the heel is raised. The raw IMU data was processed visually to extract the degree of maximum tibial tilt angle at the midstance. The minimum value is the maximum forward tibial tilt angle at midstance. The difference between the tibial tilt angle in standing position and at midstance of gait is the maximum forward tibial tilt angle at midstance, which corresponds to the maximum dorsiflexion motion at midstance. 9 This value, along with the spatiotemporal gait parameters, was used for comparison between the 3 study conditions.
Adverse Events
Adverse events were reported via nondirected questioning of the participants at the 2-week follow-up. 18 We were interested in learning whether there was any pain or discomfort (eg, skin irritation) caused by the heel lifts.
Statistical Analysis
Descriptive statistics were used along with comparative tests for all outcomes of interest. Normality of data was checked using the Shapiro-Wilk test, and histograms and box-and-whisker plots were examined for defining outliers. If the data did not meet the assumption of normality, nonparametric tests were used.
The Friedman 1-way analysis of variance (ANOVA) was used specifically for testing the difference in pain during walking among the 3 study conditions (baseline, immediately after heel-lift fitting, and after 2 weeks of wearing heel lifts), while a 1-way ANOVA with repeated measures was conducted to compare the difference in maximum tibial tilt angle at midstance among these conditions. If a significant main effect was found, an additional post hoc comparison with Bonferroni correction was performed. For symptom severity and pain pressure threshold, a paired t test was used for comparison between baseline and 2-week follow-up of the more symptomatic side. In addition, a paired t test was performed to analyze side differences in tibial tilt angle and spatiotemporal gait parameters for self-selected normal walking speed. Limb symmetry indexes (LSIs) of the side-to-side differences were calculated to obtain percentage values (more symptomatic side/less symptomatic side × 100). If differences between sides were observed at baseline, a 2-way within-subjects ANOVA with Bonferroni correction was used to analyze the differences over time (baseline vs 2 weeks) for tibial tilt angle and spatiotemporal gait parameters. Effect sizes for the t tests were reported as Cohen d values and interpreted as no effect (<0.2), small effect (<0.5), medium effect (<0.8), or large effect (≥0.8). 14 Effect sizes or partial eta-squared (η2p) as reported for ANOVA were interpreted as no effect (<0.01), small effect (<0.06), medium effect (<0.14), or large effect (≥0.14). 14
Differences in gait phase (both as a percentage of full gait cycle and as absolute values) during normal walking speed between the more symptomatic and less symptomatic sides were compared under each of the 3 study conditions using the paired t test or Wilcoxon signed-rank test. Effect sizes for the Wilcoxon signed-rank test was calculated as r = z/√N, where r represents the effect size, z is the z score obtained from the test, and N is the total number of observations or pairs in the sample.
All statistical analyses were performed using SPSS (IBM, Released 2019. IBM SPSS Statistics for Windows, Version 26.0). The level of significance for all tests was set at P < .05.
Results
Recruitment and Participants
Between September 1, 2020 and August 31, 2021, a total of 21 participants with IAT consented and completed the baseline assessment. Overall, 20 patients completed a 2-week follow-up assessment, and their results were included in the analysis (Figure 2). Descriptive data of demographics, anthropometrics, injury information, and morphology for the more symptomatic and less symptomatic sides are summarized in Table 1. Results of outcome measures at baseline and 2 weeks after using heel lifts are displayed in Table 2.
Figure 2.
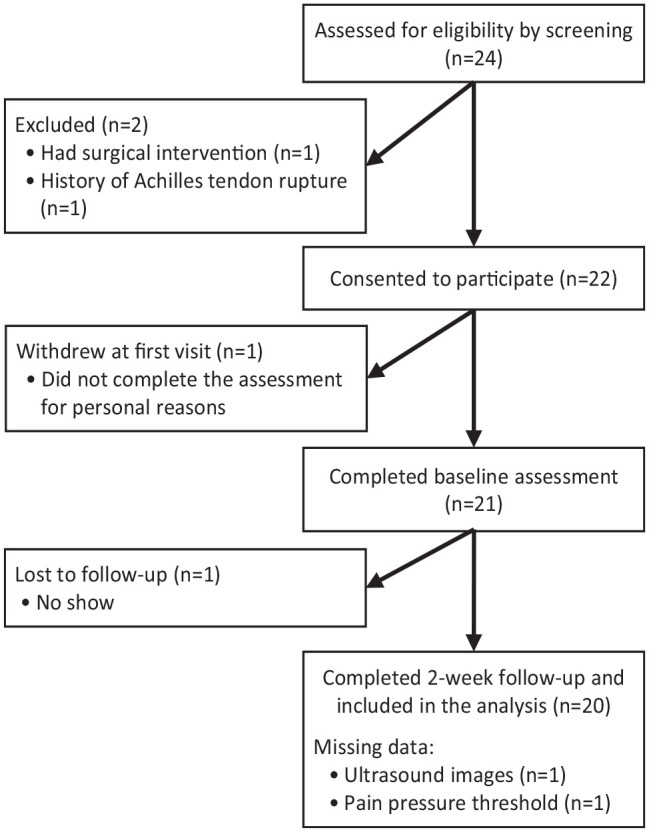
Participant flowchart.
Table 1.
Descriptive Data of Participant and Injury Data a
| Variable | Value |
|---|---|
| Participant Characteristics | |
| Age, y | 51.0 ± 9.3 |
| Sex, male/female | 8/12 |
| Height, cm | 170.6 ± 9.5 |
| Weight, kg | 91.2 ± 17.0 |
| BMI, kg/m2 | 31.6 ± 6.8 |
| Injury Information and Morphology | |
| Symptom duration, mo | 42.9 ± 96.8 |
| Symptom side, bilateral/unilateral | 7/13 |
| Calcification/bony deformity, yes/no | |
| More symptomatic side | 16/4 |
| Less symptomatic side | 14/6 |
| Neovascularization (yes/no) | |
| More symptomatic side | 18/2 |
| Less symptomatic side | 8/12 |
| Tendon thickness at calcaneus, cm | |
| More symptomatic side (n = 19) b | 0.58 ± 0.2 |
| Less symptomatic side (n = 18) b | 0.50 ± 0.1 |
| Tendon to soleus length, cm | |
| More symptomatic side (n = 19) b | 4.90 ± 1.6 |
| Less symptomatic side (n = 19) b | 5.03 ± 1.6 |
| Tendon insertion angle, deg | |
| More symptomatic side | |
| Prone/resting position | 20.7 ± 8 |
| Standing without heel lifts | 15.9 ± 8.8 |
| Standing on heel lifts | 20.3 ± 7.3 |
| Less symptomatic side (n = 19) b | |
| Prone/resting position | 19.5 ± 5.6 |
| Standing without heel lifts | 14.6 ± 5.0 |
| Standing on heel lifts | 19.3 ± 6.3 |
| Previous treatment, yes/no | |
| Physical therapy | 18/2 |
| Shockwave treatment | 1/19 |
| Laser treatment | 1/19 |
| Dry needling | 2/18 |
Data reported as mean ± SD or number of patients. BMI, body mass index.
Data missing due to poor-quality ultrasound images.
Table 2.
Outcome Measures at Baseline and After 2 Weeks of Using Heel Lifts (N = 20) a
| Outcome | Baseline | After 2 Weeks | P | ES |
|---|---|---|---|---|
| VISA-A | ||||
| More symptomatic side | 52.3 ± 20.5 | 60 ± 20.5 | .006 | 0.69 |
| Less symptomatic side | 76.3 ± 22.5 | 75.3 ± 25.7 | >.99 b | 0.0 |
| Pain pressure threshold, kPa (n = 19) | ||||
| More symptomatic side | 428.0 ± 216.6 | 487.9 ± 264.0 | .062 | 0.46 |
| Less symptomatic side | 694.8 ± 275.3 | 707.4 ± 277.8 | .295 b | -0.23 |
| TSK | 39.4 ± 5.0 | 38.6 ± 5.0 | .372 | 0.20 |
| Current PAS | 4.2 ± 1.8 | 4.45 ± 1.5 | .383 | 0.20 |
| FAOS-QOL | 41.4 ± 18.3 | 48.8 ± 17.9 | - | - |
| NPRS pain, past 24 h on more symptomatic side (scale, 0 [best] to 10) | ||||
| Current | 4 ± 2 | 2 ± 1.9 | <.001 | 0.99 |
| Best | 2 ± 2 | 1 ± 1.25 | .033 | 0.52 |
| Worst | 6.5 ± 2 | 4.5 ± 3 | <.001 | 0.51 |
| Patient’s belief and expectation (scale, 1 [best] to 5) | 2.5 ± 0.8 | 2 ± 0.9 | - | - |
| GRC (scale, -5 [worst] to 5) | 0.75 ± 2 c | 2 ± 1.3 | - | - |
| Satisfaction (scale, 0 [worst] to 10) | 6.75 ± 4 c | 7 ± 2.4 | - | - |
Data are reported as mean ± SD. Boldface P values indicate statistically significant difference between baseline and after 2 weeks (P < .05, paired t test). Dashes indicate statistical analysis not performed. ES, effect size; FAOS-QOL, foot and ankle outcome score-quality of life; GRC, global rating of change; NPRS, Numeric Pain Rating Scale; PAS, Physical Activity Scale; TSK, Tampa Scale for Kinesiophobia; VISA-A, Victoria Institute of Sports assessment-Achilles questionnaire.
Wilcoxon signed rank test.
Data are for immediately after heel lifts.
Symptom Severity and Pain Outcomes
Symptom Severity and Pain at Baseline and After 2 Weeks
The comparison between study conditions for pain level and symptom severity at baseline and 2 weeks’ follow-up of using heel lifts is displayed in Table 2. Symptom severity (VISA-A score) of the more symptomatic side significantly (P < .01) improved after 2 weeks (60 ± 20.6) compared with baseline (52.2 ± 20.4).
Pain Severity During Gait
The values for pain severity for the 3 study conditions are displayed in Table 3. There was a significant difference between the conditions for normal walking speed (χ2(2)= 9.088, P = .011, ES = 0.23), but not for fast walking speed (χ2(2) = 5.065, P = .079, ES = 0.13). Dunn-Bonferroni post hoc tests, carried out after Bonferroni correction, revealed that pain reduced immediately after fitting the participant with heel lifts when compared with baseline (P = .043), with no significant differences observed between baseline and 2 weeks or immediately after fitting and 2 weeks (P = .207 and .527, respectively).
Table 3.
Pain Severity of More Symptomatic Side During Walking a
| Pain During Walking (NPRS) | Baseline | Immediately After Fitting | 2 Weeks After Wearing | P | ES |
|---|---|---|---|---|---|
| Normal speed | 2.0 (0.2-4) | 0.5 (0-2.8) | 0.6 (0-2) | .011 (.043, b .207, c .527 d ) | 0.23 |
| Fast speed | 1.5 (0.1-3) | 1.0 (0-2.8) | 1.0 (0-1.6) | .079 (.080, b .123, c .835 d ) | 0.13 |
Data are reported as median (interquartile range). Boldface P values indicate statistically significant difference between groups (P < .05, Friedman 1-way analysis of variance; effect size reported as Kendall W); P values in parentheses are the results of pairwise comparison among the 3 study conditions. ES, effect size; NPRS, Numeric Pain Rating Scale.
Baseline vs immediately after fitting.
Baseline vs 2 weeks after wearing.
Immediately after fitting vs 2 weeks after wearing).
Maximum Tibial Tilt Angle at Midstance
Table 4 presents descriptive statistics and differences in maximum tibial tilt angle at midstance for both sides and side-to-side difference LSI under the 3 study conditions. There was a significant effect of time on tibial tilt at midstance on the more symptomatic and less symptomatic sides (F(2,38) = 5.239, P = .010, ES = 0.22; and (F(2,38) = 8.855, P = .017, ES = 0.32, respectively). Pairwise comparison revealed a significant increase in tibial tilt on both sides between baseline and immediately after heel lift (2.72° ± 0.8°, P = .011) and (4.9 ± 1.1°, P < .001). There were no significant differences in tibial tilt on the more symptomatic side (P = .326) or less symptomatic side (P = .071) between baseline and 2 weeks after or immediately after and 2 weeks after (P = .451 and .281, respectively). There was no significant difference in side-to-side difference LSI among time points (F(2,38) = 3.124, P = .081, ES = 0.14).
Table 4.
Maximum Tibial tilt Angle at Midstance During Walking at Normal Speed and Limb Symmetry Index a
| Baseline | Immediately After Fitting | 2 Weeks After Wearing | P | ES | |
|---|---|---|---|---|---|
| Maximum tibial tilt angle at midstance, deg | |||||
| More symptomatic side | 11.5 ± 5.0 | 14.2 ± 5.2 | 13.2 ± 4.3 | .010 (.011, b .326, c .451 d ) | 0.22 |
| Less symptomatic side | 10.3 ± 4.0 | 15.2 ± 5.5 | 12.9 ± 4.0 | .017 (<.001, b .071, c .281 d ) | 0.32 |
| Side-to-side difference LSI, % | 126.2 ± 69.7 | 98.9 ± 31.9 | 107.3 ± 39.3 | .081 (.150, b .316, c >.99 d ) | 0.14 |
Data are reported as mean ± SD. Boldface P values indicate statistically significant difference between groups (P < .05); P values in parentheses are the results of pairwise comparison among the 3 study conditions. ES, effect size.
Baseline vs immediately after fitting.
Baseline vs 2 weeks after wearing.
Immediately after fitting vs 2 weeks after wearing).
Gait Biomechanics
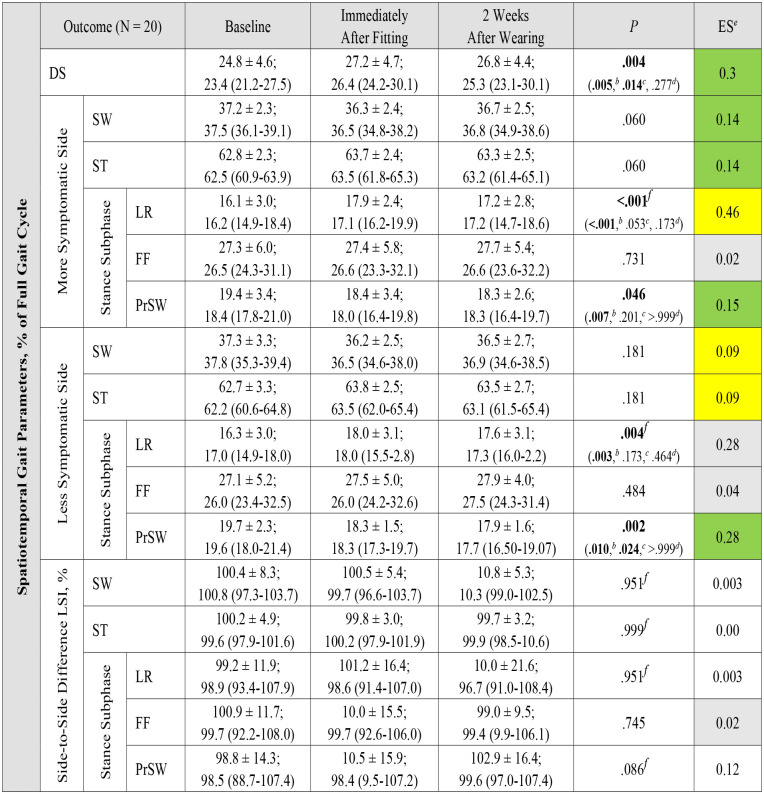
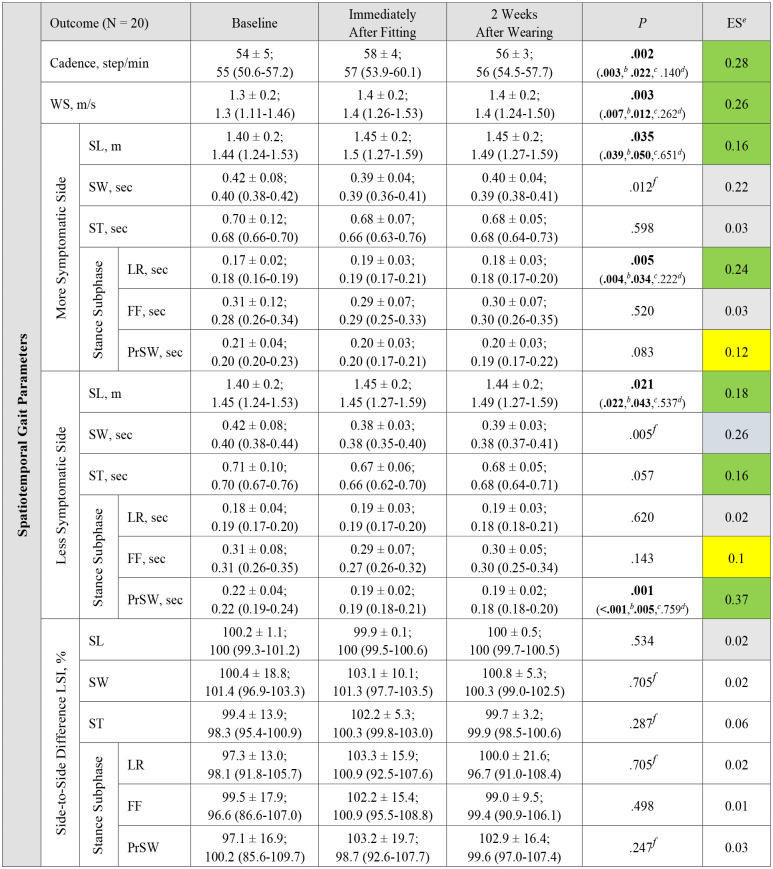
Appendix Tables A1 to A5 show descriptive statistics as well as differences in spatiotemporal gait parameters between the less symptomatic and more symptomatic sides during normal walking speed under the 3 study conditions. Variables that violated the assumption of normality are reported in Appendix Tables A1 to A5. Overall, there were no significant differences between the sides under any of the study conditions for any of the gait outcomes (P = .089 to .962, ES = -0.29 to 0.1). The summary results for spatiotemporal gait parameters are displayed in Figures 3 and 4.
Figure 3.

(A-F) Spatiotemporal gait parameters (percentage of full gait cycle) and (G) tibial tilt angle at midstance showing differences between the more symptomatic and less symptomatic sides over time (baseline, immediately after heel-lift and after 2 weeks) at normal walking speed. Data are shown as means, with error bars indicating standard deviations unless otherwise indicated (N = 20). †Medians and interquartile ranges reported for Friedman 1-way ANOVA with ES reported as Kendall W. ANOVA, analysis of variance; ES, effect size.
Figure 4.

Spatiotemporal gait parameters (absolute values): (A-E) gait phases, (F) stride length, and (G) speed and cadence, showing differences between the more symptomatic and less symptomatic sides over time (baseline, immediately after heel-lift and after 2 weeks) at normal walking speed. Data are shown as means, with error bars indicating standard deviations unless otherwise indicated (N = 20). †Medians and IQRs reported for Friedman 1-way ANOVA with ES reported as Kendall W. ANOVA, analysis of variance; ES, effect size; IQR, interquartile range.
Changes between the more symptomatic and less symptomatic sides over time were tested using 2 × 2 mixed ANOVA and showed no significant time × side interactions or main effects of side (more vs less symptomatic) for any of the gait phases. There was significant a main effect of time (baseline vs 2 weeks) for preswing phase (P = .005) and tibial tilt angle (P = .026) (Table 5).
Table 5.
Results of 2 × 2 (Time × Side) Mixed ANOVA for Changes in Gait Phases and Tibial Tilt Angle Between Sides a
| Outcome | Time | Side | Time × Side | ||||||
|---|---|---|---|---|---|---|---|---|---|
| F (1,19) | η2p | P | F (1,19) | η2p | P | F (1,19) | η2p | P | |
| Swing phase | 3.077 | 0.14 | .096 | 0.014 | 0.001 | .908 | 0.217 | 0.011 | .647 |
| Stance phase | 1.713 | 0.08 | .206 | 0.105 | 0.006 | .749 | 0.153 | 0.008 | .700 |
| Load response phase | 2.287 | 0.107 | .147 | 1.463 | 0.072 | .241 | 0.452 | 0.023 | .509 |
| Footflat phase | 0.486 | 0.025 | .494 | 0.006 | 0.00 | .940 | 0.086 | 0.004 | .774 |
| Pre-swing phase | 10.187 | 0.35 | .005 | 0.132 | 0.007 | .721 | 1.965 | 0.094 | .177 |
| Tibial tilt angle | 5.823 | 0.24 | .026 | 0.838 | 0.04 | .372 | 0.757 | 0.04 | .395 |
Boldface P values indicate statistical significance (P < .05).
Patients’ Self-Reported Compliance
After 2 weeks, 20 participants reported compliance with wearing the heel lifts, with rates of 86% to 100% while either walking, running, or participating in exercise class. One participant scored the lowest rate of compliance for wearing the heel lifts (30%) due to staying home and not wearing shoes. Figure 5 displays each participant's rate of compliance while wearing heel lifts for 14 days.
Figure 5.
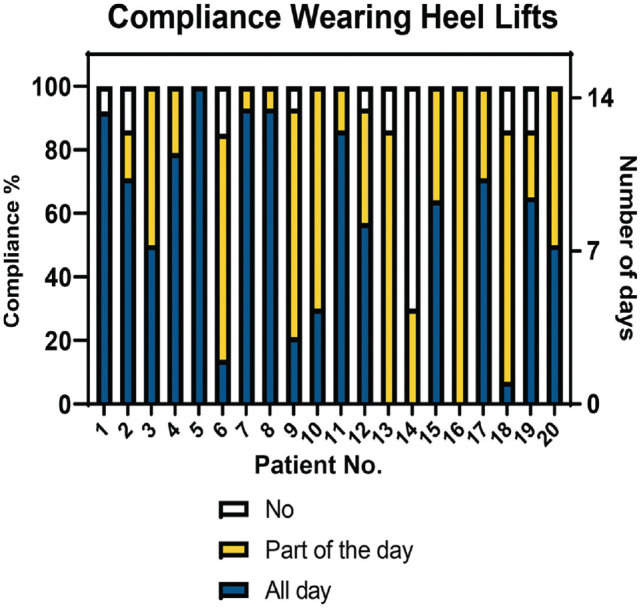
Patients’ self-reported compliance wearing heel lifts.
Patient Belief and Expectation, Satisfaction, and GRC
According to the results of patient belief and expectations, GRC, and patient satisfaction scores (Table 2), patients were satisfied immediately after using heel lift, and their satisfaction median score (7) was maintained until the 2-week follow-up. Proportionally, after 2 weeks, most patients (89.5%, 17 of 19) scored moderately to very satisfied (≥5) compared with the 10.5% (2 of 19) with low satisfaction scores (≤3) (Figure 6). Participants with greater satisfaction scores significantly improved their mean VISA-A score from 53 at baseline to 61 points after 2 weeks of using heel lifts; but the mean VISA-A score of the 2 participants with low satisfaction scores was 44.5 points at baseline and increased slightly to 48 points after 2 weeks. The median GRC scores improved 2 points after 2 weeks of wearing heel lifts, which exceeded the 1.5-point clinically important change. 25 There was no correlation between patients’ belief and expectation at baseline with symptom severity after 2 weeks (r = -0.065, P = .786).
Figure 6.
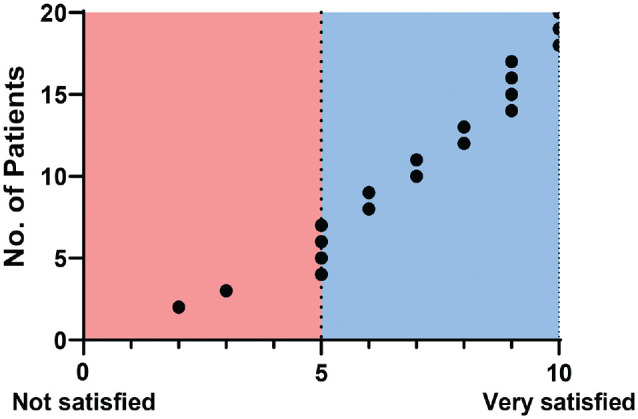
Patients’ self-reported satisfaction after 2 weeks of wearing heel lifts (n = 19 patients).
Adverse Events
No serious adverse events were reported. In general, the heel lifts were comfortable for all participants and no complaints were reported while worn. Only 2 participants reported that the heel lifts sometimes slid slightly under their forefoot. They reported the cause may be related to the type of material in their footwear insoles, resulting in instability between the 2 materials.
Discussion
Heel lifts are used commonly as an intervention by physical therapists to decrease Achilles tendon pain and restore activity. 11 However, to our knowledge, no study has evaluated the immediate and short-term effect of using heel lifts in persons with insertional Achilles. Our exploratory study found that heel lifts significantly improved pain immediately while walking. This improvement in pain remained after 2 weeks and was clinically meaningful. 33 Based on pilot data collected by the authors, in static stance, the use of the heel lift resulted in increased distance between the tendon and the calcaneus and this might be the reason for the immediate and short-term decrease in pain and symptoms. During gait, there was an increase in walking speed, stride length, and tibial tilt on both sides immediately while walking with heel lifts, and these gait improvements were maintained at 2 weeks with no other effects on spatiotemporal gait parameters. Most patients were satisfied with the heel lifts and no adverse events were reported. Comprehensively, these findings indicate that heel lifts have a significant immediate positive effect and should be recommended for patients with IAT.
Short-Term Effects on Pain and Symptom Severity
It is important to note that the 20-mm heel lifts utilized in this study significantly reduced pain immediately during normal gait and improved symptom severity after 2 weeks. This effect was statistically significant and clinically meaningful.3,5,6,33,50 Secondary analysis revealed that current participants’ VISA-A mean change score improved by 7 points, regardless of pathologies at the insertion, which exceeded 6.5 points of the minimal clinically importance difference of the IAT population. 33 However, the group without calcification and/or bony deformity was very small. To the best of the authors’ knowledge, this is the first analysis to compare participants with or without calcified insertional tendinopathy. Rabusin et al 45 compared heel lifts with calf muscle eccentric exercise for reducing pain and improving function in a randomized clinical trial. The authors reported greater symptom severity improvement in the heel lifts group (mean change, 12 points) compared with the eccentric exercise group (mean change, 5 points) in midportion Achilles tendinopathy after 2 weeks. In another study, traditional physical therapy, including heel lifts combined with or without exercise treatment showed similar mean change (-2 points) in the severity of pain (using a visual analogue scale) after 12 weeks in persons with IAT. 26 However, the height of heel lifts and outcome at earlier time points were not reported. In our study, we reported a reduction in the numeric pain rating scale within 24 hours and immediately during gait, as well as after 2 weeks of using heel lifts. Although our secondary outcomes (the pain pressure threshold and numeric pain rating scale at normal speed) were not significant after 2 weeks of using heel lifts, the ESs were medium (0.46), and small (0.23). Overall, using heel lifts at a stage of treatment in people with IAT can be considered beneficial.
Short-Term Effects on Tibial Tilt Angle and Gait Outcomes
Walking in heel lifts has been suggested to improve gait impairment in persons with Achilles tendinopathy by reducing tendon strain and compression during ankle dorsiflexion. 11 Understanding how heel lifts affect the tibial tilt angle (a correlate of dorsiflexion) and spatiotemporal gait parameters in persons with IAT is an important step toward optimizing injury management. The main findings of this study showed alterations in tibial tilt angle and gait phase durations after walking in heel lifts, the result of which increased walking speed in most participants with IAT. In addition, at each evaluation, our findings showed no significant differences between the less symptomatic and more symptomatic sides in outcomes. The side-to-side difference LSIs across each condition were similar, suggesting the current participants achieved gait symmetry. In addition, there were no side differences over time in gait phases and tibial tilt angle, indicating the heel lifts were not detrimental to gait. However, it remains unknown whether these changes in gait phases and tibial tilt angle occurred due to the heel lifts, walking speed changes, or a combination of both.
It is possible that the changes in tibial tilt angle at midstance might be caused by heel lifts, rather than walking speed. Self-selected walking speed increased by 0.1 m/s in the current results. Contrary to our expectations, the tibial tilt angle at midstance increased after walking in heel lifts. While previous studies reported increased absolute dorsiflexion angle at lower walking speed during stance,15,39 it is difficult to compare our results with these studies since the validity of tibial tilt angle as a measure of dorsiflexion at midstance remains unknown, and the methods used across studies were different. However, in our study, we believe that an increase of 7% of walking speed after using heel lifts did not influence tibial tilt angle at midstance but, instead, that the change in angle was due to the heel lift height effecting lower limb kinematics.22,23
In previous research, walking speed correlated negatively with gait phases duration, 38 and gait subphases depend on walking speed. 21 In this study, increase in walking speed was accomplished by a significant increase in cadence, stride length, and significant changes in gait phase durations (double support, load response, and preswing). Even though the durations of stance, swing, and footflat phases did not change significantly, their effect sizes were small to large (Appendix Tables A4 and A5). A previous study showed gait subphase durations decreased when speed increased by 0.1 m/s. 21 Although the mean values of the stance phase did not significantly change after using the heel lifts in our study, it is worth mentioning that using heel lifts significantly modified the duration ratio between subphases in both limbs by increasing the load response period and decreasing the preswing period. Even though the changes were small, the observed effect sizes are between small to large (Table A4). This is not surprising, since walking in heel lifts decreases triceps muscle activity during the stance phase, 30 and increases dorsiflexion excursion and time between heel-strike and heel-off in healthy participants. 23
In our study, variations in gait speed were reduced by measuring time spent in each gait phase as a percentage of the gait cycle, in addition to asking participants to walk at a self-selected pace. 8 Therefore, we believe the indirect changes in gait outcomes over time were influenced by the use of heel lifts. The 0.1 m/s increase in gait speed, as seen in our study, is deemed clinically meaningful. 43 Furthermore, using a single method (MuscleLab) to analyze gait and its subphase durations may offer clinicians useful information about the gait characteristics that are modified by heel lifts in persons with IAT.
Limitations
This study has several limitations. First, because the study was exploratory in nature, we included a small sample size without a control group or a priori power analysis. While the demographics of our participants were obese and middle-aged, this heterogenous group may not represent the entire population. However, these demographics are commonly seen in patients with IAT in everyday clinical care and may affect the outcomes. Participants in this study also reported a wide range for symptom duration, from 1 month to several years, which could explain the variability in outcomes. It may be that this intervention is more effective in a younger, lower BMI, and more acute injury population. Since there were no short-term repercussions of using the heel-lifts, we would recommend this treatment for persons with IAT. Because our results revealed only a short-term effect, we do not know whether improvements will last in the long term if no other treatment is provided. Future clinical trials should investigate both short- and long-term effects of wearing heel lifts, as well as use an a priori power analysis to determine the sample size needed to assess the impact of combining heel lifts with other nonsurgical treatments. Future research should also examine the influence of heel lifts on calf muscle function. Because heel lift compliance was self-reported, there is a chance it does not correctly reflect participants’ compliance. Finally, it should be noted that the materials used in heel lifts have elastic features that enhance footwear comfort and, as a result, may relieve pressure under the heel and influence pain perception.
Conclusion
Our findings confirmed that heel lifts have an immediate impact on gait pattern and speed. Heel lifts significantly reduced pain immediately during gait and improved symptom severity after 2 weeks. These results suggest that heel lifts may reduce painful compression at the Achilles tendon insertional and provide supporting evidence that clinicians may use heel lifts in persons with IAT as a nonoperative management technique.
Appendix
Table A1.
Comparison Between Sides in Gait and Tibial Tilt Angle at Normal Walking Speed: Baseline a
| Outcome (N = 20) | More Symptomatic | Less Symptomatic | P | ES |
|---|---|---|---|---|
| Swing phase, % GC | 37.2 ± 2.3;
37.5 (36.1-39.1) |
37.3 ± 3.3;
37.8 (35.2-39.3) |
.962 | -0.01 |
| Stance phase, % GC | 62.8 ± 2.3;
62.5 (60.8-63.3) |
62.7 ± 3.3;
62.2 (60.6-64.8) |
.962 | -0.01 |
| Load-response phase, % SPD | 16.1 ± 3.0;
16.2 (14.9-18.4) |
16.3 ± 3.0;
17.0 (14.9-18.0) |
.765 b | -0.07 |
| Footflat, % SPD | 27.3 ± 6.0;
26.5 (24.3-31.1) |
27.1 ± 5.2;
26.0 (23.4-32.5) |
.676 | 0.1 |
| Preswing phase, % SPD | 19.4 ± 3.4;
18.4 (17.8-21.03.3) |
19.7 ± 2.3;
19.6 (18.0-21.4) |
.676 | 0.1 |
| Swing phase, s | 0.42 ± 0.08;
0.40 (0.38-0.42) |
0.42 ± 0.08;
0.40 (0.38-0.44) |
.723 b | -0.08 |
| Stance phase, s | 0.70 ± 0.12;
0.68 (0.66-0.70) |
0.71 ± 0.10;
0.70 (0.67-0.76) |
.191 b | -0.29 |
| Load-response phase, s | 0.17 ± 0.02;
0.18 (0.16-0.19) |
0.18 ± 0.04;
0.19 (0.17-0.20) |
.380 b | -0.19 |
| Footflat, s | 0.31 ± 0.12;
0.28 (0.26-0.34) |
0.31 ± 0.08;
0.31 (0.26-0.35) |
.520 b | -0.14 |
| Preswing phase, s | 0.21 ± 0.04;
0.20 (0.20-0.23) |
0.22 ± 0.04;
0.22 (0.19-0.24) |
.391 b | -0.19 |
| Stride length, m | 1.40 ± 0.2;
1.44 (1.24-1.55) |
1.40 ± 0.2;
1.45 (1.24-1.53) |
.492 | 0.02 |
| Tibial tilt angle, deg | 11.5 ± 5.0;
10.2 (8.3-15.4) |
10.3 ± 4.0;
10.4 (7.3-12.8) |
.305 | -0.24 |
Data are shown as mean ± SD and median (interquartile range). ES, effect size; GC, gait cycle; SPD, stance phase duration.
Wilcoxon signed-rank test, with effect size calculated as r = z/√N.
Table A2.
Comparison Between Sides in Gait and Tibial Tilt Angle at Normal Walking Speed: Immediately After Heel-Lift Fitting a
| Outcome (N = 20) | More Symptomatic | Less Symptomatic | P | ES |
|---|---|---|---|---|
| Swing phase, % GC | 36.3 ± 2.4;
36.5 (34.8-38.2) |
36.2 ± 2.5;
36.5 (34.6-38.0) |
.765 | 0.07 |
| Stance phase, % GC | 63.7 ± 2.4;
63.5 (61.8-65.2) |
63.8 ± 2.5;
63.5 (62.0-65.4) |
.765 | 0.07 |
| Load-response phase, % SPD | 17.9 ± 2.4;
17.1 (16.2-19.9) |
18.0 ± 3.1;
18.0 (15.5-20.8) |
.830 | -0.05 |
| Footflat, % SPD | 27.4 ± 5.8;
26.6 (23.3-32.1) |
27.5 ± 5.0;
26.0 (24.2-32.6) |
.892 | -0.03 |
| Preswing phase, % SPD | 18.4 ± 3.4;
18.0 (16.4-19.8) |
18.3 ± 1.5;
18.3 (17.3-19.6) |
.894 | 0.03 |
| Swing phase, s | 0.39 ± 0.04;
0.39 (0.36-0.41) |
0.38 ± 0.03;
0.38 (0.35-0.40) |
.247 b | -0.26 |
| Stance phase, s | 0.68 ± 0.07;
0.66 (0.63-0.76) |
0.67 ± 0.06;
0.66 (0.62-0.70) |
.089 | 0.4 |
| Load-response phase, s | 0.19 ± 0.03;
0.19 (0.17-0.21) |
0.19 ± 0.03;
0.19 (0.17-0.20) |
.530 | -0.14 |
| Footflat, s | 0.29 ± 0.07;
0.29 (0.25-0.33) |
0.29 ± 0.07;
0.27 (0.26-0.32) |
.558 | -0.13 |
| Preswing phase, s | 0.20 ± 0.03;
0.20 (0.18-0.21) |
0.19 ± 0.02;
0.19 (0.17-0.21) |
.862 b | -0.03 |
| Stride length, m | 1.45 ± 0.2;
1.5 (1.31-1.57) |
1.45 ± 0.2;
1.45 (1.30-1.57) |
.602 | 0.4 |
| Tibial tilt angle, deg | 14.2 ± 5.2;
12.9 (10.8-17.3) |
15.2 ± 5.5;
14.7 (10.6-18.1) |
.344 | 0.22 |
Data are shown as mean ± SD and median (interquartile range). ES, effect size; GC, gait cycle; SPD, stance phase duration.
Wilcoxon signed-rank test, with effect size calculated as r = z/√N.
Table A3.
Comparison Between Sides in Gait Parameters and Tibial Tilt Angle at Normal Walking Speed: 2 Weeks After Wearing Heel Lifts a
| Outcome (N = 20) | More Symptomatic | Less Symptomatic | P | ES |
|---|---|---|---|---|
| Swing phase, % GC | 36.7 ± 2.5;
36.8 (34.9-38.6) |
36.5 ± 2.7;
36.9 (34.6-38.5) |
.629 | 0.11 |
| Stance phase, % GC | 63.3 ± 2.5;
63.2 (61.4-65.1) |
63.5 ± 2.7;
63.1 (61.5-65.4) |
.629 | 0.11 |
| Load-response phase, % SPD | 17.2 ± 2.8;
17.2 (14.7-18.6) |
17.6 ± 3.1;
17.3 (16.0-20.2) |
.478 b | -0.16 |
| Footflat, % SPD | 27.7 ± 5.4;
26.6 (23.5-32.2) |
27.9 ± 4.0;
27.5 (24.3-31.4) |
.764 | -0.07 |
| Preswing phase, % SPD | 18.3 ± 2.6;
18.3 (16.4-19.7) |
17.9 ± 1.6;
17.7 (16.5-19.1) |
.589 | 0.12 |
| Swing phase, s | 0.40 ± 0.04;
0.39 (0.38-0.41) |
0.39 ± 0.03;
0.38 (0.37-0.41) |
.444 b | -0.17 |
| Stance phase, s | 0.68 ± 0.05;
0.68 (0.64-0.73) |
0.68 ± 0.05;
0.68 (0.64-0.71) |
.993 | -0.002 |
| Load-response phase, s | 0.18 ± 0.03;
0.18 (0.17-0.20) |
0.19 ± 0.03;
0.18 (0.18-0.21) |
.544 | -0.14 |
| Footflat, s | 0.30 ± 0.07;
0.30 (0.26-0.35) |
0.30 ± 0.05;
0.30 (0.25-0.34) |
.910 | -0.03 |
| Preswing phase, s | 0.20 ± 0.03;
0.19 (0.17-0.22) |
0.19 ± 0.02;
0.18 (0.18-0.20) |
.332 b | -0.21 |
| Stride length, m | 1.45 ± 0.2;
1.49 (1.27-1.59) |
1.44 ± 0.2;
1.49 (1.27-1.59) |
.363 b | -0.20 |
| Tibial tilt angle, deg | 13.2 ± 4.3;
12.9 (10.8-15.4) |
12.9 ± 4.0;
14.3 (9.9-15.6) |
.305 | -0.09 |
Data are shown as mean ± SD and median (interquartile range). ES, effect size; GC, gait cycle; SPD, stance phase duration.
Wilcoxon signed-rank test, with effect size calculated as r = z/√N.
Table A4.
Spatiotemporal Gait Parameters (Percentage of Full Gait Cycle) During Normal Walking Speed for the More Symptomatic Side, Less Symptomatic Side, and Side-to-Side Difference LSI Under the 3 Study Conditions a
|
Data are presented as mean ± SD and median (interquartile range). Boldface P values represent statistically significant differences (P < .05, 1-way analysis of variance unless otherwise indicated); P values in parentheses are the results of pairwise comparison among the 3 study conditions. ANOVA, analysis of variance; DS, double support; ES, effect size; FF, footflat phase; GC, gait cycle; LR, load-response phase; LSI, limb symmetry index; PrSW, preswing phase; ST, stance phase; SW, swing phase.
Baseline vs immediately after fitting.
Baseline vs 2 weeks after wearing.
Immediately after fitting vs 2 weeks after wearing.
Green indicates large effect size, yellow indicates medium effect size, white indicates small effect size, and white indicates no effect.
Friedman 1-way ANOVA with effect size reported as Kendall W.
Table A5.
Spatiotemporal Gait Parameters (Absolute Values) During Normal Walking Speed for the More Symptomatic Side, Less Symptomatic Side, and Side-to-Side Difference LSI Under the 3 Study Conditions a
|
Data are presented as mean ± SD and median (interquartile range). Boldface P values represent statistically significant differences (P < .05, 1-way analysis of variance); P values in parentheses are the results of pairwise comparison among the 3 study conditions. ANOVA, analysis of variance; ES, effect size; FF, footflat phase; LR, load-response phase; LSI, limb symmetry index; PrSW, pre-swing phase; SL, stride length; ST, stance phase; SW, swing phase; WS, walking speed.
Baseline vs immediately after fitting.
Baseline vs 2 weeks after wearing.
Immediately after fitting vs 2 weeks after wearing.
Green indicates large effect size, yellow indicates medium effect size, white indicates small effect size, and white indicates no effect.
Friedman 1-way ANOVA with effect size reported as Kendall W.
Footnotes
Final revision submitted June 24, 2023; accepted July 31, 2023.
The authors have declared that there are no conflicts of interest in the authorship and publication of this contribution. AOSSM checks author disclosures against the Open Payments Database (OPD). AOSSM has not conducted an independent investigation on the OPD and disclaims any liability or responsibility relating thereto.
Ethical approval for this study was obtained from University of Delaware (ref No. 1602469-5).
References
- 1. Alghamdi NH, Killian M, Aitha B, Pohlig RT, Silbernagel KG. Quantifying the dimensions of achilles tendon insertional area using ultrasound imaging a validity and reliability study. Muscles Ligaments Tendons J. 2019;9(4):544-551. doi: 10.32098/mltj.04.2019.09. [DOI] [Google Scholar]
- 2. Antonaci F, Sand T, Lucas GA. Pressure algometry in healthy subjects: inter-examiner variability. Scand J Rehabil Med. 1998;30(1):3-8. doi: 10.1080/003655098444255. [DOI] [PubMed] [Google Scholar]
- 3. Balius R, Álvarez G, Baró F, et al. A 3-arm randomized trial for achilles tendinopathy: eccentric training, eccentric training plus a dietary supplement containing mucopolysaccharides, or passive stretching plus a dietary supplement containing mucopolysaccharides. Curr Ther Res Clin Exp. 2016;78:1-7. doi: 10.1016/j.curtheres.2016.11.001. [DOI] [PMC free article] [PubMed] [Google Scholar]
- 4. Barbachan Mansur NS, Pereira VF, Monteiro Cunha HC, et al. Diagnosis of Achilles insertional tendinopathies by algometry. Pain Med (United States). 2021;22(11):2670-2675. doi: 10.1093/pm/pnab255. [DOI] [PubMed] [Google Scholar]
- 5. Bell KJ, Fulcher ML, Rowlands DS, Kerse N. Impact of autologous blood injections in treatment of mid-portion Achilles tendinopathy: double blind randomised controlled trial. BMJ. 2013;346(7908):f2310. doi: 10.1136/bmj.f2310. [DOI] [PMC free article] [PubMed] [Google Scholar]
- 6. Beyer R, Kongsgaard M, Hougs Kjær B, Øhlenschlæger T, Kjær M, Magnusson SP. Heavy slow resistance versus eccentric training as treatment for Achilles tendinopathy: a randomized controlled trial. Am J Sports Med. 2015;43(7):1704-1711. doi: 10.1177/0363546515584760. [DOI] [PubMed] [Google Scholar]
- 7. Beytemür O, Öncü M. The age dependent change in the incidence of calcaneal spur. Acta Orthop Traumatol Turc. 2018;52(5):367-371. doi: 10.1016/j.aott.2018.06.013. [DOI] [PMC free article] [PubMed] [Google Scholar]
- 8. Brinkerhoff SA, Murrah WM, Hutchison Z, Miller M, Roper JA. Words matter: instructions dictate “self-selected” walking speed in young adults. Gait Posture. 2022;95:223-226. doi: 10.1016/j.gaitpost.2019.07.379. [DOI] [PubMed] [Google Scholar]
- 9. Bye TK, ALghamdi NH, Silbernagel KG. Reliability of inertial measurement unit in determining maximum ankle dorsiflexion angle at terminal stance. In: Proceedings of International Foot and Ankle Biomechanics Meeting (iFAB 2021). Held online April 11-14, 2021. [Google Scholar]
- 10. Chimenti RL, Bucklin M, Kelly M, et al. Insertional achilles tendinopathy associated with altered transverse compressive and axial tensile strain during ankle dorsiflexion. J Orthop Res. 2017;35(4):910-915. doi: 10.1002/jor.23338. [DOI] [PMC free article] [PubMed] [Google Scholar]
- 11. Chimenti RL, Cychosz CC, Hall MM, Phisitkul P. Current concepts review update: insertional achilles tendinopathy. Foot Ankle Int. 2017;38(10):1160-1169. doi: 10.1177/1071100717723127. [DOI] [PMC free article] [PubMed] [Google Scholar]
- 12. Chimenti RL, Flemister AS, Ketz J, Bucklin M, Buckley MR, Richards MS. Ultrasound strain mapping of Achilles tendon compressive strain patterns during dorsiflexion. J Biomech. 2016;49(1):39-44. doi: 10.1016/j.jbiomech.2015.11.008. [DOI] [PMC free article] [PubMed] [Google Scholar]
- 13. Clain MR, Baxter DE. Achilles tendinitis. Foot Ankle. 1992;13(8):482-487. doi: 10.1177/107110079201300810. [DOI] [PubMed] [Google Scholar]
- 14. Cohen J. Statistical Power Analysis for the Behavioral Sciences. 2nd edn. Hillsdale, NJ: L. Erlbaum Associates; 1988. [Google Scholar]
- 15. Dubbeldam R, Buurke JH, Simons C, et al. The effects of walking speed on forefoot, hindfoot and ankle joint motion. Clin Biomech. 2010;25(8):796-801. doi: 10.1016/j.clinbiomech.2010.06.007. [DOI] [PubMed] [Google Scholar]
- 16. Ettinger S, Razzaq R, Waizy H, et al. Operative treatment of the insertional Achilles tendinopathy through a transtendinous approach. Foot Ankle Int. 2016;37(3):288-293. doi: 10.1177/1071100715609921. [DOI] [PubMed] [Google Scholar]
- 17. Franz JR, Slane LC, Rasske K, Thelen DG. Non-uniform in vivo deformations of the human Achilles tendon during walking. Gait Posture. 2015;41(1): 192-197. doi: 10.1016/j.gaitpost.2014.10.001. [DOI] [PMC free article] [PubMed] [Google Scholar]
- 18. George SZ, Robinson ME. Preference, expectation, and satisfaction in a clinical trial of behavioral interventions for acute and sub-acute low back pain. J Pain. 2010;11(11):1074-1082. doi: 10.1016/j.jpain.2010.02.016. [DOI] [PMC free article] [PubMed] [Google Scholar]
- 19. Giai Via A, Oliva F, Padulo J, Oliva G, Maffulli N. Insertional calcific tendinopathy of the achilles tendon and dysmetabolic diseases. Clin J Sport Med. 2022;32(1):e68-e73. doi: 10.1097/JSM.0000000000000881. [DOI] [PubMed] [Google Scholar]
- 20. Grimby G. Physcial activity and muscle training in the elderly. Acta Med Scand. 1986;711:233-237. [DOI] [PubMed] [Google Scholar]
- 21. Hebenstreit F, Leibold A, Krinner S, Welsch G, Lochmann M, Eskofier BM. Effect of walking speed on gait sub phase durations. Hum Mov Sci. 2015;43:118-124. doi: 10.1016/j.humov.2015.07.009. [DOI] [PubMed] [Google Scholar]
- 22. Johanson MA, Allen JC, Matsumoto M, Ueda Y, Wilcher KM. Effect of heel lifts on plantarflexor and dorsiflexor activity during gait. Foot Ankle Int. 2010;31(11):1014-1020. doi: 10.3113/fai.2010.1014. [DOI] [PubMed] [Google Scholar]
- 23. Johanson MA, Cooksey A, Hillier C, Kobbeman H, Stambaugh A. Heel lifts and the stance phase of gait in subjects with limited ankle dorsiflexion. J Athl Train. 2006;41(2):159-165. [PMC free article] [PubMed] [Google Scholar]
- 24. Johnson KW, Zalavras C, Thordarson DB. Surgical management of insertional calcific Achilles tendinosis with a central tendon splitting approach. Foot Ankle Int. 2006;27(4):245-250. doi: 10.1177/107110070602700404. [DOI] [PubMed] [Google Scholar]
- 25. Kamper SJ, Maher CG, Mackay G. Global rating of change scales: a review of strengths and weaknesses and considerations for design. J Man Manip Ther. 2009;17(3):163-170. doi: 10.1179/jmt.2009.17.3.163. [DOI] [PMC free article] [PubMed] [Google Scholar]
- 26. Kedia M, Williams M, Jain L, et al. The effects of conventional physical therapy and eccentric strengthening for insertional Achilles tendinopathy. Int J Sports Phys Ther. 2014;9(4):488-497. http://www.ncbi.nlm.nih.gov/pubmed/25133077. [PMC free article] [PubMed] [Google Scholar]
- 27. Konor MM, Morton S, Eckerson JM, Grindstaff TL. Reliability of three measures of ankle dorsiflexion range of motion. Int J Sports Phys Ther. 2012;7(3):279-287. http://www.ncbi.nlm.nih.gov/pubmed/22666642%0Ahttp://www.pubmedcentral.nih.gov/articlerender.fcgi?artid=PMC3362988. [PMC free article] [PubMed] [Google Scholar]
- 28. Kvist M. Achilles tendon injuries in athletes. Ann Chir Gynaecol. 1991;80(2):188-201. http://www.ncbi.nlm.nih.gov/pubmed/1897886. [PubMed] [Google Scholar]
- 29. Lam HSP, Lau FWK, Chan GKL, Sykes K. The validity and reliability of a 6-metre timed walk for the functional assessment of patients with stroke. Physiother Theory Pract. 2010;26(4):251-255. doi: 10.3109/09593980903015235. [DOI] [PubMed] [Google Scholar]
- 30. Lee KH, Matteliano A, Medige J, Smiehorowski T. Electromyographic changes of leg muscles with heel lift: therapeutic implications. Arch Phys Med Rehabil. 1987;68(5 Pt 1):298-301. [PubMed] [Google Scholar]
- 31. Maquet D, Croisier JL, Demoulin C, Crielaard JM. Pressure pain thresholds of tender point sites in patients with fibromyalgia and in healthy controls. Eur J Pain. 2004;8(2):111-117. doi: 10.1016/S1090-3801(03)00082-X. [DOI] [PubMed] [Google Scholar]
- 32. Matsui T, Kumai T, Kamijo S, et al. Effect of ankle motion and tensile stress at the Achilles tendon on the contact pressure between the Achilles tendon and the calcaneus. J Foot Ankle Surg. 2021;60(4):753-756. doi: 10.1053/j.jfas.2021.02.008. [DOI] [PubMed] [Google Scholar]
- 33. McCormack J, Underwood F, Slaven E, Cappaert T. The minimum clinically important difference on the visa-a and lefs for patients with insertional Achilles tendinopathy. Int J Sports Phys Ther. 2015;10(5):639-644. [PMC free article] [PubMed] [Google Scholar]
- 34. Melia M, Schmidt M, Geissler B, et al. Measuring mechanical pain: the refinement and standardization of pressure pain threshold measurements. Behav Res Methods. 2015;47(1):216-227. doi: 10.3758/s13428-014-0453-3. [DOI] [PubMed] [Google Scholar]
- 35. Menz HB, Zammit G V., Landorf KB, Munteanu SE. Plantar calcaneal spurs in older people: longitudinal traction or vertical compression? J Foot Ankle Res. 2008;1:7. doi: 10.1186/1757-1146-1-7. [DOI] [PMC free article] [PubMed] [Google Scholar]
- 36. Miller RP, Kori SH, Todd DD. The Tampa scale: a measure of kinisophobia. Clin J Pain. 1991;7(1):51-52. [Google Scholar]
- 37. Misgeld BJE, Schauer T, Simanski O. Online gait phase detection with automatic adaption to gait velocity changes using accelerometers and gyroscopes. Biomed Eng Biomed Tech. 2014;59(Supplement):S803-S806. doi: 10.1515/bmt-2014-5011. [DOI] [Google Scholar]
- 38. Murray MP, Kory RC, Clarkson BH, Sepic SB. Comparison of free and fast speed walking patterns of normal men. Am J Phys Med Rehabil. 1966;45(1):8-23. [PubMed] [Google Scholar]
- 39. Murray MP, Mollinger LA, Gardner GM, Sepic SB. Kinematic and EMG patterns during slow, free, and fast walking. J Orthop Res. 1984;2(3):272-280. doi: 10.1002/jor.1100020309. [DOI] [PubMed] [Google Scholar]
- 40. Oliva-Lozano JM, Martín-Fuentes I, Muyor JM. Validity and reliability of an inertial device for measuring dynamic weight-bearing ankle dorsiflexion. Sensors (Basel). 2020;20(2):399. doi: 10.3390/s20020399. [DOI] [PMC free article] [PubMed] [Google Scholar]
- 41. Oliva F, Via AG, Maffulli N. Physiopathology of intratendinous calcific deposition. BMC Med. 2012;10:95. doi: 10.1186/1741-7015-10-95. [DOI] [PMC free article] [PubMed] [Google Scholar]
- 42. Paavola M, Kannus P, Järvinen TAH, Khan K, Józsa L, Järvinen M. Achilles tendinopathy. J Bone Joint Surg Am. 2002;84(11):2062-2076. doi: 10.2106/00004623-200211000-00024. [DOI] [PubMed] [Google Scholar]
- 43. Palombaro KM, Craik RL, Mangione KK, Tomlinson JD. Determining meaningful changes in gait speed after hip fracture. Phys Ther. 2006;86(6):809-816. doi: 10.1093/ptj/86.6.809. [DOI] [PubMed] [Google Scholar]
- 44. Peters DM, Fritz SL, Krotish DE. Assessing the reliability and validity of a shorter walk test compared with the 10-meter walk test for measurements of gait speed in healthy, older adults. J Geriatr Phys Ther. 2013;36(1):24-30. doi: 10.1519/JPT.0b013e318248e20d. [DOI] [PubMed] [Google Scholar]
- 45. Rabusin CL, Menz HB, McClelland JA, et al. Efficacy of heel lifts versus calf muscle eccentric exercise for mid-portion Achilles tendinopathy (HEALTHY): a randomised trial. Br J Sports Med. 2019;12:20. doi: 10.1136/bjsports-2019-101776. [DOI] [PubMed] [Google Scholar]
- 46. Riepert T, Drechsler T, Urban R, Schild H, Mattern R. The incidence, age dependence and sex distribution of the calcaneal spur. An analysis of its x-ray morphology in 1027 patients of the central European population. [Article in German]. Rofo. 1995;162(6):502-505. doi: 10.1055/s-2007-1015925. [DOI] [PubMed] [Google Scholar]
- 47. Robinson JM, Cook JL, Purdam C, et al. The VISA-A questionnaire: a valid and reliable index of the clinical severity of Achilles tendinopathy. Br J Sports Med. 2001;35:335-341. [DOI] [PMC free article] [PubMed] [Google Scholar]
- 48. Roos EM, Brandsson S, Karlsson J. Validation of the foot and ankle outcome score for ankle ligament reconstruction. Foot Ankle Int. 2001;22(10):788-794. doi: 10.1177/107110070102201004. [DOI] [PubMed] [Google Scholar]
- 49. Sella EJ. Disorders of the Achilles tendon and its insertion. Clin Podiatr Med Surg. 2005;22(1):87-99. doi: 10.1016/j.cpm.2004.08.007. [DOI] [PubMed] [Google Scholar]
- 50. Silbernagel KG, Thomeé R, Eriksson BI, Karlsson J. Continued sports activity, using a pain-monitoring model, during rehabilitation in patients with achilles tendinopathy: a randomized controlled study. Am J Sports Med. 2007;35(6):897-906. doi: 10.1177/0363546506298279. [DOI] [PubMed] [Google Scholar]
- 51. Smidt N, Van der Windt DA, Assendelft WJ, et al. Interobserver reproducibility of the assessment of severity of complaints, grip strength, and pressure pain threshold in patients with lateral epicondylitis. Arch Phys Med Rehabil. 2002;83(8):1145-1150. doi: 10.1053/apmr.2002.33728. [DOI] [PubMed] [Google Scholar]
- 52. Stenson JF, Reb CW, Daniel JN, Saini SS, Albana MF. Predicting failure of nonoperative treatment for insertional Achilles tendinosis. Foot Ankle Spec. 2018;11(3):252-255. doi: 10.1177/1938640017729497. [DOI] [PubMed] [Google Scholar]
- 53. Thomas JL, Christensen JC, Kravitz SR, et al. The diagnosis and treatment of heel pain: a clinical practice guideline-revision 2010. J Foot Ankle Surg. 2010;49(3):S1-S19. doi: 10.1053/j.jfas.2010.01.001. [DOI] [PubMed] [Google Scholar]
- 54. Toumi H, Davies R, Mazor M, et al. Changes in prevalence of calcaneal spurs in men & women: a random population from a trauma clinic. BMC Musculoskelet Disord. 2014;15(1):87. doi: 10.1186/1471-2474-15-87. [DOI] [PMC free article] [PubMed] [Google Scholar]
- 55. VanDijk CN, van Sterkenburg MN, Wiegerinck JI, Karlsson J, Maffulli N. Terminology for Achilles tendon related disorders. Knee Surg Sport Traumatol Arthrosc. 2011;19(5):835-841. doi: 10.1007/s00167-010-1374-z. [DOI] [PMC free article] [PubMed] [Google Scholar]
- 56. Washabaugh EP, Kalyanaraman T, Adamczyk PG, Claflin ES, Krishnan C. Validity and repeatability of inertial measurement units for measuring gait parameters. Gait Posture. 2017;55:87-93. doi: 10.1016/j.gaitpost.2017.04.013. [DOI] [PMC free article] [PubMed] [Google Scholar]
- 57. Williamson A, Hoggart B. Pain: a review of three commonly used pain rating scales. J Clin Nurs. 2005;14(7):798-804. doi: 10.1111/j.1365-2702.2005.01121.x. [DOI] [PubMed] [Google Scholar]
- 58. Wulf M, Wearing SC, Hooper SL, Bartold S, Reed L, Brauner T. The effect of an in-shoe orthotic heel lift on loading of the Achilles tendon during shod walking. J Orthop Sport Phys Ther. 2016;46(2):79-86. doi: 10.2519/jospt.2016.6030. [DOI] [PubMed] [Google Scholar]