

Abstract

Measurement of total cortisol levels in serum samples is currently based on immunoassays or liquid chromatography–mass spectrometry (LC–MS/MS). However, measurement of bioavailable cortisol is laborious, unreliable, and inconvenient for the patient. Therefore, a new versatile assay with the ability to measure both total and bioavailable cortisol from serum represents an important supplement to the current methods. We have generated a cell-based glucocorticoid reporter assay (HEK293F-GRE). The assay was validated for cell line stability, accuracy by dilution, precision, repeatability, reproducibility, and specificity. Additionally, the assay was tested for measuring both total and bioavailable cortisol in serum. The assay showed linearity at five dilution levels with R2 = 0.98 and an accuracy between 0.8 and 1.2. Precision (CV < 20%) was validated down to 3–6 nM dexamethasone, and estimation of the total cortisol concentration was comparable to cortisol immunoassay and LC–MS/MS in most serum samples. Moreover, the assay estimated the bioavailable cortisol fraction in serum samples to a level that agreed with the literature. The HEK293F-GRE assay holds the potential to be a complementary method for estimating cortisol in clinical practice. The ability to quantify bioavailable cortisol directly from serum samples is alluring and provides an opportunity for monitored and personal dose regimens of exogenous glucocorticoids.
Introduction
Glucocorticoid is a class of steroid hormone synthesized in the adrenal cortex of vertebrates in response to many different stimuli, such as infection or trauma, to name a few. Like all steroid hormones, glucocorticoids are small hydrophobic cholesterol derivatives that allow passive transport over the cell membrane. Once in the cytosol, glucocorticoids are recognized by the glucocorticoid receptor (GR), which is a member of the nuclear hormone receptor family. The glucocorticoid-GR complex translocates to the nucleus, where the complex binds to the DNA glucocorticoid-response element (GRE) that regulates transcription of the many glucocorticoid-responsive genes.1,2
Cortisol is the chief endogenous glucocorticoid, and it is usually the physician’s only available glucocorticoid to test for in the routine clinical setting. Traditionally, the immunoassay has been the method of choice for cortisol estimation but it is challenged by cross-reactivity with related endogenous steroids, lipids, or metabolites that limits specificity.3 Therefore, liquid chromatography-tandem mass spectrometry (LC–MS/MS), which is considered the gold standard for cortisol estimation, is starting to replace or supplement immunoassay testing in many laboratories.
Immunoassays and LC–MS/MS comprise artificial and nonbiological systems that try to measure the concentration of a single type of glucocorticoid while excluding related compounds. As an alternative, we present a biological assay (bioassay) that measures the sum of biological glucocorticoid activity exerted by the different compounds present in the sample. Depending on the nature of the sample, the measured activity can also be used to estimate the concentration of a specific glucocorticoid. The assay is based upon the activation of the GRE in a stable human embryonic kidney (HEK293) cell line and subsequent expression of luciferase. The assay was validated for quantification of glucocorticoids in nonbiological samples, and we explored the assay’s clinical potential using serum samples from random patients and a panel of challenging serum samples used in a Danish national quality assurance study.4
The bioassay is not meant to replace current modalities for total cortisol estimation, but it may act as a supplement to these and reveal cases of synthetic glucocorticoid consumption if needed. Furthermore, the bioassay holds the alluring potential of being able to quantify bioavailable glucocorticoids in a serum sample, creating new diagnostic opportunities for clinicians: the bioassay may be used to monitor and tailor therapeutic regimens with synthetic glucocorticoids and define the effective range of therapy in an individual. Finally, some patients respond better to synthetic glucocorticoid therapy than others. The bioassay might be used to distinguish between responders and nonresponders in such cases.
Experimental Section
Vector Cloning and Plasmid Preparation
The glucocorticoid-responsive vector (pGL4.26-GRE) was constructed by insertion of three tandem repeats of the glucocorticoid-responsive element (GGTACATTTTGTTCTGGTACAGTACGTCCT GTTCTGGTACAAACTGTTCT)5 into the pGL4.26[luc2/minP/Hygro] vector (Cat. no. E8441, Promega, WI, USA). The pGL4.26-GRE vector was transformed into competent DH5α Escherichi coli cells by heat shock, and the cells were grown in LB broth (Cat. no. L3022, Sigma-Aldrich, MO, USA) supplemented with 100 μg/mL ampicillin (Cat. no. A9518, Sigma-Aldrich, MO, USA) at 37 °C. Plasmid DNA was purified using the maxiprep kit from Zymo (Cat. no. D4203, Zymo, CA, USA).
Generation of HEK293F-GRE Cells
Naiive HEK293F cells (catalog no. R79007, Thermo Fisher Scientific, MA, USA) were cultured in suspension in Freestyle 293 Expression medium (Cat. no. 12338-018, Gibco, Thermo Fisher Scientific, MA, USA) supplemented with penicillin/streptomycin (Cat. no. 15140-122, Gibco, Thermo Fisher Scientific, MA, USA) and maintained at 36.5 °C, 8% CO2, and 125 rpm in an orbital shaker. HEK293F cells were transfected at a density of 1 × 10⁶ cells/mL with pGL4.26-GRE plasmid (30 μg) diluted in OptiPRO SFM (Cat. no. 12309-019, Gibco, Thermo Fisher Scientific, MA, USA) using the HYPE CHO Transfection kit (Cat. no. HYC03000, OZ Biosciences, CA, USA). After 24 h, the cells were transferred to a T-75 flask for adherent culturing in DMEM (Cat. no. 11995-065, Gibco, Thermo Fisher Scientific, MA, USA) supplemented with 10% FBS (Cat. no. 10500-064, Gibco, Thermo Fisher Scientific, MA, USA) and 400 μg/mL selection antibiotic, hygromycin B (Cat. no. J60681.03, Thermo Fisher Scientific, MA, USA), and subsequently maintained at 36.5 °C and 8% CO2 in a humidified incubator. Bioassay clones were verified to be mycoplasma free.
Preparation of Serum Samples for GRE Reporter Gene Assay
For quantification of total serum glucocorticoid, serum (20 μL) was mixed 1:3 (v/v) with acetonitrile (Cat. no. 2637-2.5L, CHEMSOLUTE, TH.GEYER, Germany) and incubated on ice for 5 min. Following centrifugation at 15,000g for 10 min at 4 °C, the supernatants were transferred to new tubes, and all liquid was evaporated at 45 °C using a SpeedVac. The residual serum sample was dissolved in 20 μL of PBS and stored at 4 °C.
GRE Reporter Gene Assay
When conducting the assay, HEK293F-GRE cells were seeded into white 96-well plates (Cat. no. 136102, Thermo Fisher Scientific, MA, USA) at 22.000 cells/well in 100 μL of DMEM 10% FBS. After incubation overnight at 36.5 °C and 8% CO2, the medium was aspirated from the cells and 100 μL of DMEM 1% FBS containing dexamethasone (Cat. no. D-085, Supelco, Merckmillipore, MA, USA), cortisol (Cat. no. C-106, Supelco, Merckmillipore, MA, USA), prednisolone (Cat. no. P6004, Sigma-Aldrich, MO, USA), or mifepristone (Cat. no. M8046, Sigma-Aldrich, MO, USA) were added to the cells and incubated overnight. For quantification of total serum glucocorticoid, 50 μL of DMEM (without FBS) containing 10% residual serum sample was added to the cells and incubated overnight. For quantification of bioavailable cortisol, 50 μL of undiluted and nonprecipitated serum was added to the cells and incubated overnight. Measured values were interpolated on a cortisol standard curve (1000.0 to 2.0 nM). Finally, the medium (or serum) was aspirated, and the cells were lysed with 25 μL of Glo lysis buffer (Cat. no. E266A, Promega, WI, USA) for 10 min while being shaken at 270 rpm. Subsequently, 25 μL of Steady-Glo Luciferase substrate (Cat. no. E2510, Promega, WI, USA) was added to the plate and incubated for 5 min at room temperature before measuring relative luciferase units (RLUs) using an EnSpire plate reader (2300 Enspire, version 4.1, PerkinElmer, MA, USA).
Statistical Analysis
A four-parameter logistic curve model was used to fit the dose–response correlation between RLU and glucocorticoid concentration. Half-maximal effective concentration (EC50) and half-maximal inhibitory concentration (IC50) were estimated by fitting the curve. For serum cortisol level estimation, a four-parameter logistic curve model with 1/y2 weighting was used for the cortisol standard curve. Results were presented as the mean of three replicates and standard deviation of the mean (SD). Fold induction was calculated by the sample response/negative control (S/N). Coefficient of variation (CV) and the extra sum-of-squares F test were calculated for assay stability across cell passages. The accuracy was defined as the ratio between measured values and expected values, and acceptable criteria for accuracy was set to be ≤20% (0.8–1.2) difference. The acceptance criteria for precision was defined as CV ≤ 20%.6 Analysis was carried out using Prism (version 9.4.1, GraphPad, CA, USA).
Results and Discussion
Generation of Stable Glucocorticoid-Responsive HEK293F-GRE Cell Lines
The pGL4.26-GRE luciferase reporter plasmid was transfected into HEK293F cells, producing the glucocorticoid-responsive cell line, HEK293F-GRE. The polyclonal HEK293F-GRE cell line was screened for responsiveness to 101.9 nM (40 ng/mL) dexamethasone (Figure 1A), and the cells with highest luciferase signal (F6) were selected for monoclonal propagation by limiting dilution. 12 monoclonal cell lines were isolated, and seven of these (mono 1, 2, 4, 6, 8, 10, and 11) were selected for further characterization owing to fast replication rates and significant assay responsiveness. Monoclones were tested for their response to different concentrations of dexamethasone, 1.0, 10.2, and 101.9 nM, (0.4, 4, and 40 ng/mL) and compared to their parental cell line (F6). Mono 10 and 11 showed the most potent RLU and fold induction at all tested concentrations (Figure 1B,C). Mono 8 yielded a low RLU, when stimulated with dexamethasone, but also displayed very low negative control values, resulting in a high fold induction (Figure 1B,C). The three highly responsive clones, mono 8, 10, and 11, were further evaluated using a 1.67-fold serial dilution factor of dexamethasone (223.0 to 0.8 nM), and their dose–response curves are shown in Figure 1D. Mono 10 showed the highest RLU (not shown), low variation, and a dose–response curve with a clear signal throughout the dexamethasone serial dilution. Mono 10 was therefore selected for reporter gene assay validation.
Figure 1.

Development of stable glucocorticoid-responsive HEK293F-GRE cell lines. (A) Polyclonal HEK293F-GRE cells responsiveness to 101.9 nM dexamethasone. (B,C) Response to dexamethasone for selected monoclonal cell lines and the polyclonal line, F6, in relative luciferase units (RLU, B) and fold induction (C). (D) Dexamethasone dose–response curves of monoclonal cell lines 8, 10, 11, and polyclonal cell line, F6. (E) Dexamethasone, prednisolone, cortisol, and mifepristone with dexamethasone (7 nM) dose–response curves of monoclonal cell line 10. Data points represent the mean of three replicates ± SD.
Dose–Response Curves for Natural and Synthetic Glucocorticoid
Mono 10 did not reach a saturated response using the initial dexamethasone concentrations. Increasing the highest dexamethasone concentration to 1000 nM demonstrated a good curve fitting (R2 = 0.99) and an estimated potency (EC50) of 9.7 nM (Figure 1E), which is comparable to the potency of dexamethasone in a similar assay.5 The responsiveness of mono 10 to cortisol and the synthetic glucocorticoids prednisolone and dexamethasone was compared (Figure 1E). Cortisol and prednisolone provided good dose–response curves with lower potencies (EC50: 153.6 and 95.2 nM, respectively) compared to dexamethasone. The relative potency of dexamethasone to cortisol was in accordance with the literature (Table 1), but interestingly, the relative potency of prednisolone was a two-factor lower than what was reported by Golan et al.7
Table 1. Properties of the Glucocorticoids Tested in the Assay.
| HEK293F-GRE assay |
literature7 | |||
|---|---|---|---|---|
| compound | EC50 (nM) | Emax-fold | relative potency (to cortisol) | relative potency (to cortisol) |
| dexamethasone | 9.7 | 2324 | 16 | 18 |
| prednisolone | 95.2 | 1996 | 2 | 4–5 |
| cortisol | 153.6 | 1545 | 1 | 1 |
| compound | IC50 (nM) |
|---|---|
| mifepristone | 9.6 |
The applicability of the HEK293F-GRE assay to estimate glucocorticoid neutralization was also explored using mono 10. Mifepristone, a glucocorticoid antagonist, was tested in a serial dilution range at a constant dexamethasone concentration of 7 nM. Mifepristone showed dose-dependent inhibition of dexamethasone with an IC50 of 9.6 nM (Figure 1E). To summarize, a highly responsive cell line for quantification of glucocorticoids was established based on mono 10. The results of the experiments shown in Figure 1E are summarized in Table 1.
HEK293F-GRE Assay Optimization and Stability
To determine the optimal conditions for the HEK293F-GRE assay, several parameters were evaluated to obtain the best possible dose–response curve. Evaluation of dexamethasone stimulation time was investigated at five different time points (0, 6, 12, 18, and 24 h, Figure 2A). The precision of the dose–response curve fit did not differ significantly when the stimulation time varied between 6 and 24 h (R2 = 0.99). A clear signal at a stimulation time as low as 6 h demonstrated potential for same-day readout. A slight increase in standard deviation for the dose–response curve in response to an increasing time of stimulation was observed. The CV did not increase over time. Subsequent validation experiments were performed with a maximum dexamethasone concentration of 764.4 nM (300 ng/mL), a 2-fold serial dilution factor, and a stimulation time of 18 h (Table S1).
Figure 2.
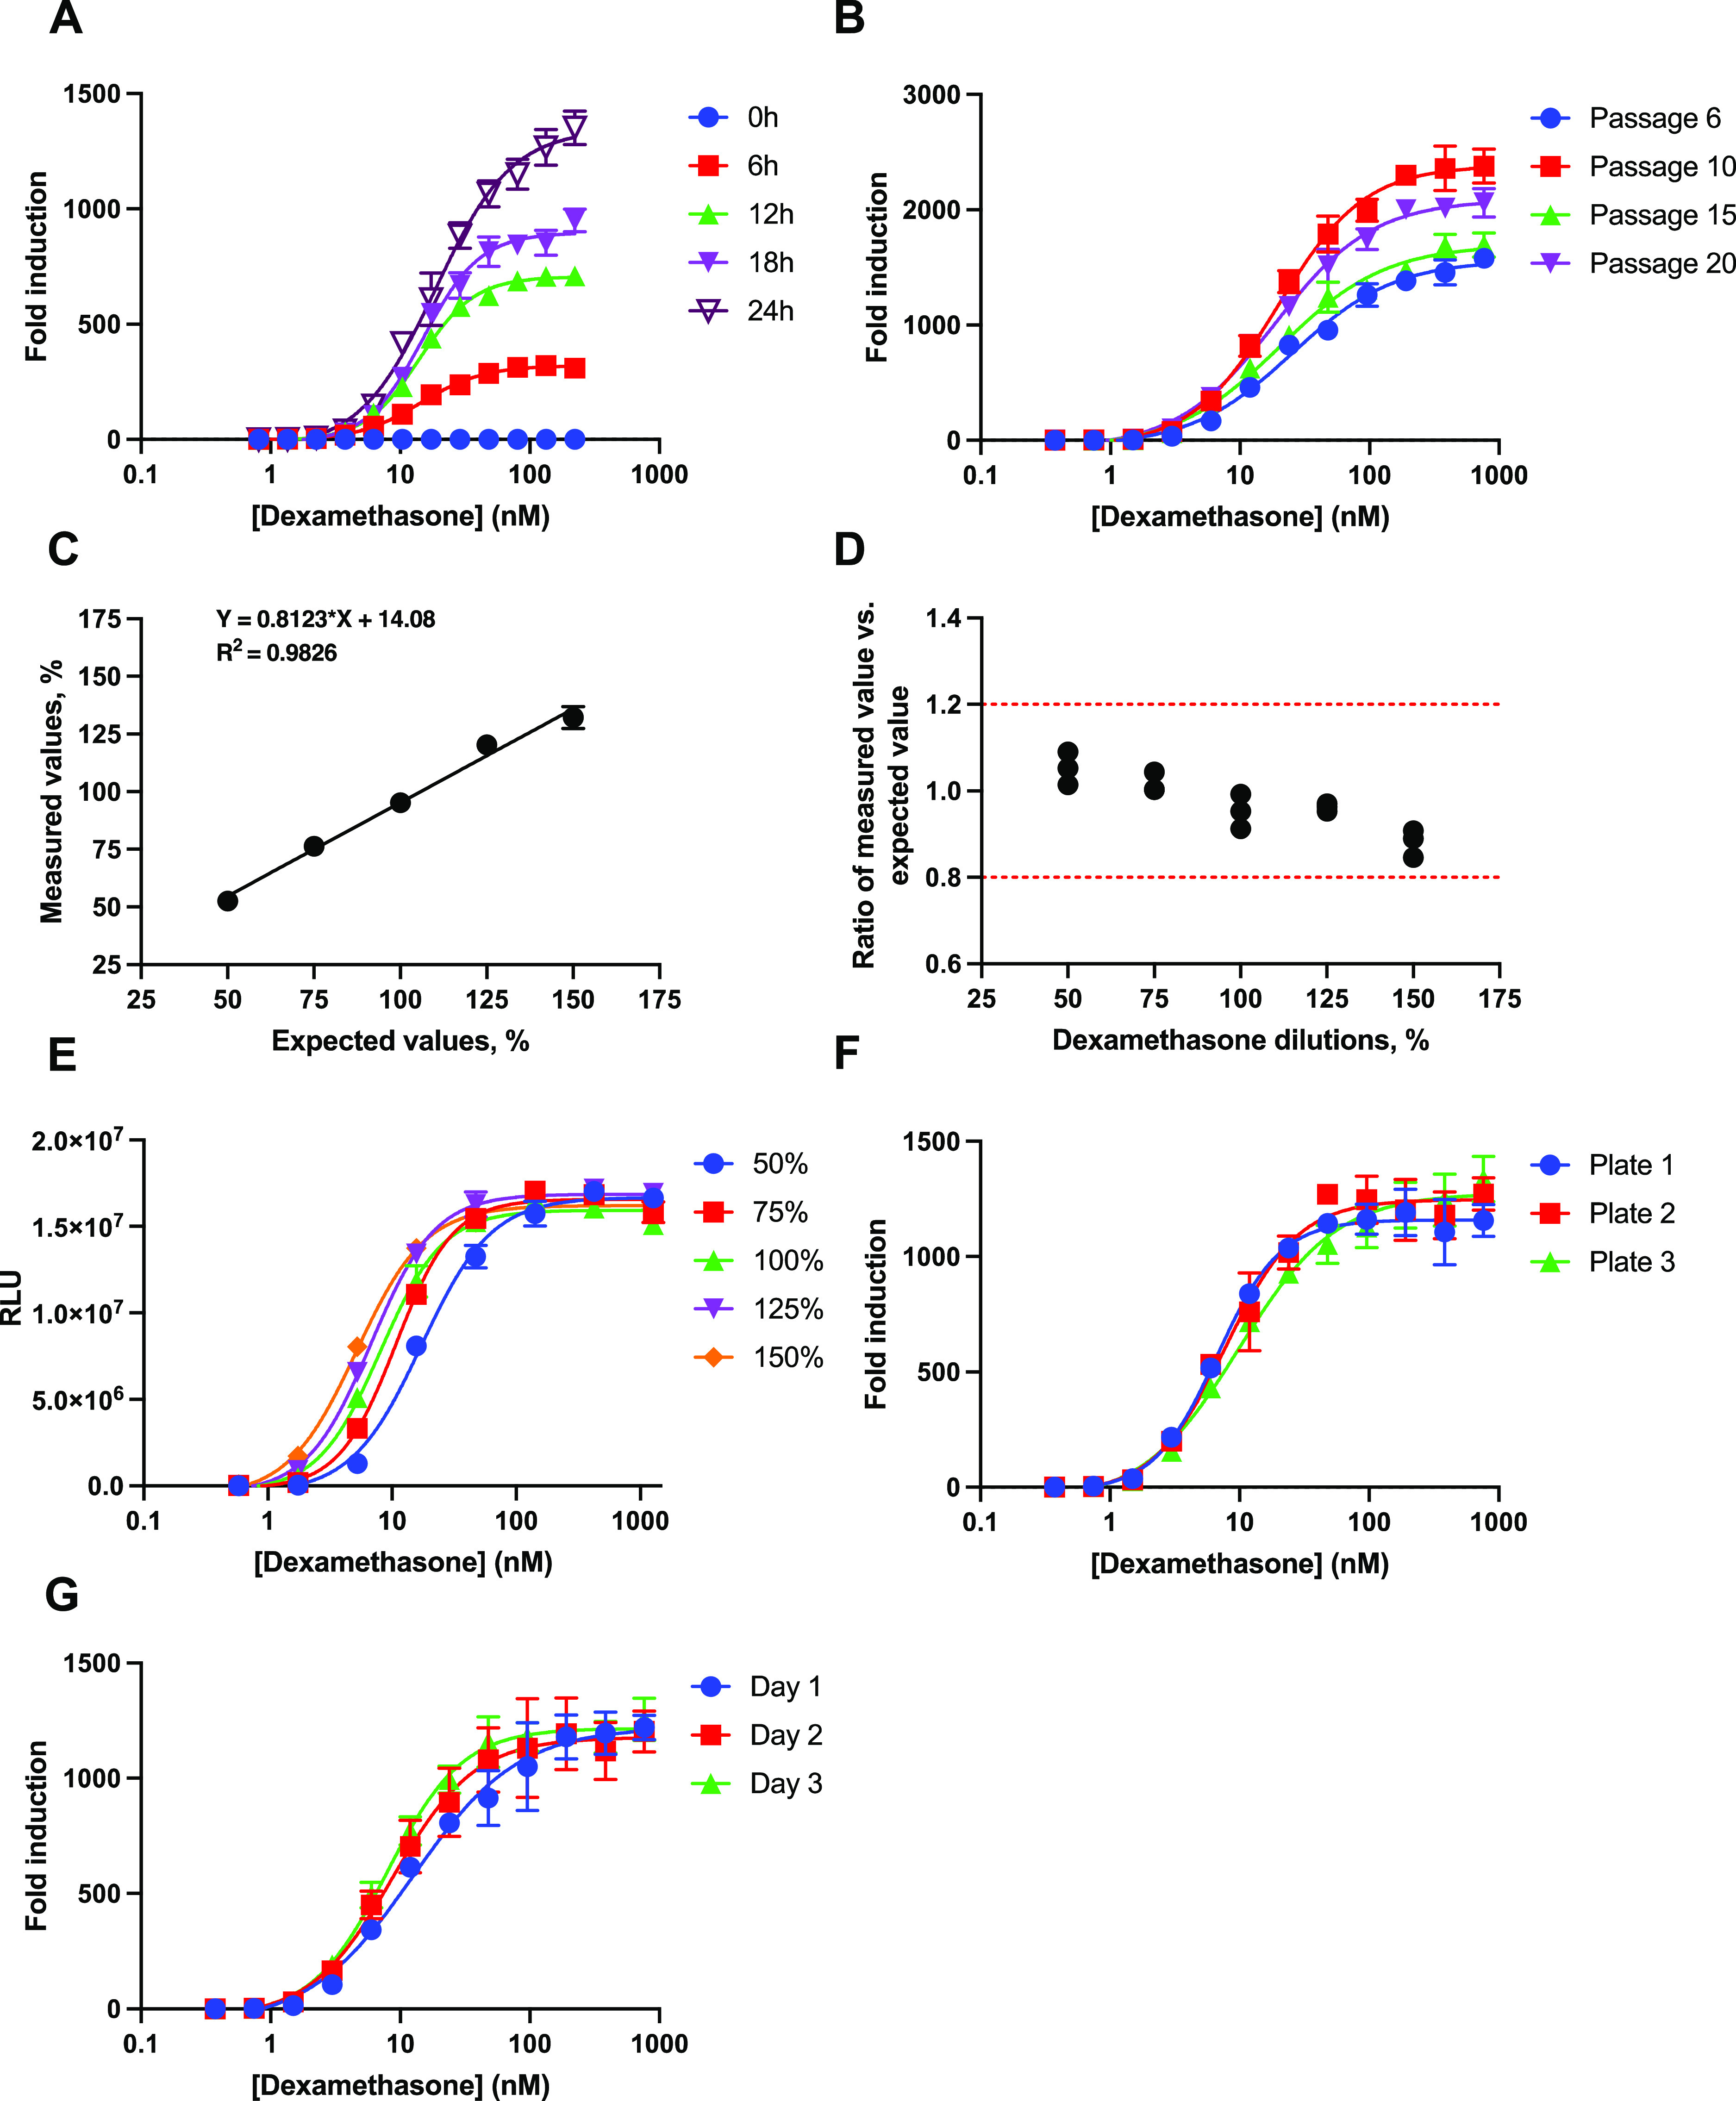
Optimization and validation of the HEK293F-GRE assay. (A) Dose–response curves of dexamethasone at different stimulation times. (B) Dexamethasone dose–response curves at different passages. (C) Plot of measured vs expected dexamethasone concentrations in a dilution range. (D) Bland–Altman plot showing the accuracy between measured and expected values with each point representing one replica. (E) Dilution linearity of dexamethasone dose–response curves interpolated onto the x-axis of the 100% sample dose–response curve with each point representing the mean of duplicates ± SD. (F) Dexamethasone dose–response curves from three different plates on the same day. (G) Dexamethasone dose–response curves measured on three consecutive days. Each data point represents the mean of three replicates ± SD. RLU (relative luciferase units).
To determine assay stability, the mono 10 cell line was evaluated for its ability to retain its dose–response performance throughout cell propagation. Cells were cultured continuously and split at 80% confluence. The mono 10 cell line was aliquoted and frozen at passages 6, 10, 15, and 20. For the evaluation, cells were thawed at the same time and cultured for 3 days before seeding. The stability of the cell line was tested using the conditions listed in Table S1. All passages showed a good dose–response performance with R2 > 0.98 and a >1500 fold induction, which did not decline with increasing cell passages (Figure 2B). Moreover, all passages displayed similar EC50 values (P = 0.06) and Hill slope of the curves (range: 1.063–1.293). Fluctuation in fold induction between passages appeared to be random and could likely be attributed to the variability of the cells instead of the passage number. In conclusion, the stability of the cell line was validated for up to 20 passages. Similar glucocorticoid bioassays showed cell line stability over 16 and 24 passages,5,8 and one assay was tested over 83 passages, but declined in response after 16 passages.9 Notably, only 3 out of 10 similar glucocorticoid bioassays reported cell line stability.5,8−16
Assessment of HEK293F-GRE Assay Dilution Linearity and Accuracy
The dilution linearity and accuracy of the HEK293F-GRE assay was determined by measuring five different dilutions of dexamethasone (measured values), corresponding to 50, 75, 100, 125, and 150% of the optimal starting concentration as listed in Table S1. An in-house sample of 764.4 nM dexamethasone was used as a reference, and its bioactivity was defined as 100% (expected values). A linearity plot showed concordance between measured values and expected values with R2 of 0.98 (Figure 2C). Plotting the ratio of the measured value vs expected value at the different dilutions of dexamethasone showed that all measured concentrations were within the acceptable criteria for accuracy of 0.8–1.2 (Figure 2D), while the precision expressed as the CV was <5% for each dilution (Table 2). There is no specific guideline for the validation of bioassays and so we defined the acceptable criteria using the Food and Drug Administration’s (FDA) guideline, “Bioanalytical Method Validation”.6 To our knowledge, no other glucocorticoid bioassay has been validated for accuracy or linearity.5,8−16 The accuracy and linearity of the HEK293F-GRE assay are comparable to those of other bioassays with different targets. These bioassays reported linearity between measured and expected values of R2 > 0.9 and an accuracy within 20% of the expected values.17−19
Table 2. Results of the Accuracy and Precision of the Dilution Linearity Validation.
| expected value (%) | mean of measured values (%) | precision (CV %) |
|---|---|---|
| 50 | 52.6 | 3.6 |
| 75 | 76.3 | 2.3 |
| 100 | 95.2 | 4.2 |
| 125 | 120.3 | 0.9 |
| 150 | 132.2 | 3.6 |
A second experiment was conducted for visual inspection of the relative potency and the appearance of the dose–response curve throughout the dilution linearity evaluation. Various initial concentrations (50, 75, 100, 125, and 150%) were tested, where the bioactivity of an initial concentration of 1274 nM (500 ng/mL) dexamethasone was defined as 100%. The resulting dose–response curves were interpolated onto the 100% dose–response curve, simulating five potency levels (Figure 2E). The five simulated relative potency levels did not affect the appearance of the dose–response curves in the assay (Figure 2E), showing concordance between measured and expected relative potencies with R2 = 0.99 and accuracy between 0.8 and 1.2 (Figure S1A,B).
HEK293F-GRE Assay Plate-To-Plate and Day-To-Day Variability
Plate-to-plate variability (repeatability) was estimated based on the CV values from three independent plates on the same day. Day-to-day variability (reproducibility) was estimated as the CV values of three independent plates on three different days. All measurements were performed in triplicate and according to the conditions listed in Table S1. The dose–response curves were highly similar when compared between plates analyzed on the same day (Figure 2F) and plates analyzed on three consecutive days (Figure 2G), with R2 > 0.96 for all dose–response curves. In conclusion, the data demonstrated a robust assay with a relatively low plate-to-plate variability (CV < 20%) for all measured concentrations of dexamethasone (Table 3). The data also showed a relatively low day-to-day variability (CV < 20%) for all concentrations down to 6.0 nM (2.34 ng/mL) dexamethasone (Table 3). The lower limit of quantification (LLOQ) of the HEK293F-GRE assay was estimated to be in the range 3–6 nM dexamethasone.
Table 3. Precision of the HEK293F-GRE Assay by Repeatability of 3 × 3 Replicates Each Day and Reproducibility of Nine Replicates for Three Consecutive Days.
| concentration of dexamethasone (nM) | repeatability |
reproducibility | ||
|---|---|---|---|---|
| day 1 (CV %) | day 2 (CV %) | day 3 (CV %) | (CV %) | |
| 764.4 | 10.1 | 9.3 | 8.4 | 9.1 |
| 382.2 | 13.7 | 13.9 | 10.2 | 12.5 |
| 191.1 | 12.7 | 12.9 | 8.1 | 11.0 |
| 95.6 | 22.4 | 17.9 | 7.9 | 16.7 |
| 47.8 | 16.6 | 12.7 | 9.0 | 15.6 |
| 23.9 | 9.2 | 15.4 | 6.5 | 13.6 |
| 11.9 | 14.7 | 15.2 | 13.3 | 16.7 |
| 6.0 | 15.6 | 12.8 | 10.6 | 19.4 |
| 3.0 | 14.3 | 18.8 | 15.4 | 28.6 |
| 1.5 | 19.0 | 17.6 | 14.9 | 35.5 |
| 0.7 | 12.8 | 17.4 | 15.8 | 33.8 |
| 0.4 | 13.6 | 32.2 | 18.5 | 23.8 |
In comparison, only 3 out of 10 glucocorticoid bioassays reported a LLOQ for their assay: 15.6 nM cortisol11 and 5.6 nM10 and 10 nM dexamethasone.9 In general, the LLOQ for glucocorticoid bioassays appear similar to cortisol immunoassays, e.g., FDA-approved cortisol immunoassays from Abbott, Roche, Siemens Advia, and Immulite reported LLOQ of 22.1 nM,20 3.0 nM,21 8.6 nM,22 and 6.9 nM23 cortisol, respectively. For LC–MS/MS, Methlie P et al. reported a LLOQ of 2.0 nM cortisol.24 However, differences between instruments and laboratories result in variations of the LLOQ for LC–MS/MS measurments.25
Estimation of Total Cortisol in Human Serum Samples Using the HEK293F-GRE Assay
Culture media without FBS or the addition of 10% human serum did not affect the dose–response curve of the HEK293F-GRE assay (Figure S2), indicating that the assay may be applied for estimation of cortisol in patient serum samples. Using the HEK293F-GRE assay, we estimated the total cortisol in serum from 12 anonymous patients that had previously been analyzed using a cortisol immunoassay (Immulite 2000 XPi, Siemens) at the Department of Clinical Biochemistry (Odense University Hospital, Odense, Denmark). Prior to the measurement, serum proteins were precipitated by addition of acetonitrile, in order to release the cortisol bound to either albumin or CBG. The HEK293F-GRE assay generally measured total cortisol at similar levels as the cortisol immunoassay (Figure 3A, Table S2), with differences less than 25% (excluding samples 3, 5, and 9). In sample 3, the difference of 43% between assays was likely a result of a low total cortisol concentration. For unknown reasons, total cortisol differed substantially between the two assays in samples 5 and 9, with sample 5 being 44% lower and sample 9 being 266% higher in the HEK293F-GRE assay. As both assays respond differently to synthetic glucocorticoids, the presence of these in the serum samples could be a possible explanation for the deviation between the two assays. The serum samples were anonymized, however, and no information about the disease or synthetic glucocorticoid intake was available.
Figure 3.

HEK293F-GRE cortisol measurement of human serum samples. (A) Total cortisol concentration from anonymous patient samples estimated by the HEK293F-GRE assay and compared with an immunoassay (Immulite 2000 XPi, Siemens). (B) Total cortisol concentration from DEKS panel samples estimated by the HEK293F-GRE assay and compared to LC–MS/MS. (C) Bioavailable cortisol estimated by the HEK293F-GRE assay. The red dotted line represents the expected level of bioavailable cortisol according to the literature.29−31 Data presented as the mean of three replicates ± SD.
To further assess the performance of the HEK293F-GRE assay, we tested its ability to estimate total cortisol in a panel of serum samples that were known to show a discrepancy between analytical methods. In 2018, the Danish Society of Clinical Biochemistry (DSKB), the Danish Society of Endocrinology (DES), and the Danish Institute for External Quality Assurance (DEKS) used these samples from men, women, women using contraceptive pills, and children with varying cortisol levels to compare routine immunological assays in Denmark with LC–MS/MS as gold standard (“Cortisol Project 2018, DSKB, DES og DEKS. Recommendation”).4 The HEK293F-GRE assay showed difficulty in estimating samples 1–4, which was also the case for nearly all of the tested immunoassays (Figure 3B and Table S3). The reason for this discrepancy between methodologies is not known. Total cortisol in these samples was estimated to a relatively low concentration by LC–MS/MS and a higher concentration by the immunoassays and the HEK293F-GRE assay. Components in samples 1–4 that were unspecifically recognized by the immunoassays and also activated the HEK293F-GRE assay would cause such discrepancy. The presence of exogenous glucocorticoids or endogenous glucocorticoid pathway stimulants are two possible explanations.15,26−28 The HEK293F-GRE assay is highly responsive to the synthetic glucocorticoid prednisolone, which is also a common interfering drug in many immunoassays. This highlights the assay’s potential to detect exogenous glucocorticoid consumption in the clinic. For the remaining samples 5–9, the HEK293F-GRE assay estimated total cortisol to a similar level or better compared to the different immunoassays (Figure 3B and Table S3).
Estimation of Bioavailable Cortisol in Human Serum Samples Using the HEK293F-GRE Assay
To explore the potential of the HEK293F-GRE assay as a method to estimate bioavailable cortisol in serum, we applied undiluted and nonprecipitated serum from six of the anonymous patients (2, 4, 6, 7, 10, and 12). The HEK293F-GRE assay estimated the bioavailable cortisol percentage at 3–7% of the total cortisol level determined by the HEK293F-GRE assay using precipitated serum (Figure 3C). The bioavailable cortisol estimates are in agreement with the literature, reporting that approximately 3–10% of total cortisol levels is bioavailable under basal conditions.29−31 Cortisol assays normally measure the total cortisol concentration in serum and do not take into account the fact that a large fraction of cortisol is bound to serum proteins and therefore not available to exert its effect on cells. Bioavailable cortisol would be the correct estimate of an individual’s cortisol load. Notwithstanding, procedures to collect and purify bioavailable cortisol from serum are laborious and lack standardization of the sample preparation.32−34 Therefore, bioavailable cortisol is currently estimated by the urine-free cortisol measurement in the clinical setting, a procedure that requires adamant compliance as the patient must collect every urine sample over 24 h. Not surprisingly, bioavailable cortisol estimation from urine produces high in-subject variation of >60%.32,35,36 With considerably less effort, the HEK293F-GRE assay was capable of estimating the bioavailable cortisol fraction using undiluted serum samples to a level in accordance with the literature.29−31
Conclusions
In summary, we generated and validated a new glucocorticoid-responsive bioassay, the HEK293F-GRE assay, for cell line stability, accuracy by dilution linearity, precision, repeatability, reproducibility, and specificity. Several glucocorticoid-responsive bioassays have been reported previously,5,8−16 but none of these have been subjected to extensive validation. The current glucocorticoid methodologies used in daily practice, LC–MS/MS and immunoassays, estimate the molar concentration of cortisol37 either directly from the mass-to-charge ratio or through interaction with an antibody (competitive assay). Instead, the HEK293F-GRE assay is based on a biological readout or “natural sensing” of GR activity that enables a fast and simple estimation of the bioavailable glucocorticoid load in an unprocessed serum sample. Moreover, the differentiated response to synthetic glucocorticoids in the HEK293F-GRE assay could approach the patient’s physiological translation of glucocorticoid treatment and would thus be a valuable tool to fine-tune glucocorticoid dosage. However, the HEK293F-GRE assay still needs further investigation and validation for this purpose.
Acknowledgments
The authors would like to thank Gitte Ratz for technical assistance and Søren Kragh Moestrup for providing critical comments. Also, we would like to thank Torben Lüth Andersson for advise on sample preparation.
Supporting Information Available
The Supporting Information is available free of charge at https://pubs.acs.org/doi/10.1021/acs.analchem.3c04435.
Linearity and accuracy of the five simulated potencies; evaluation of the human serum effect on the cortisol dose–response; optimized parameters validated for the HEK293F-GRE assay; total cortisol estimation of 12 anonymous patient samples by the HEK293F-GRE assay compared to the Immulite 2000 XPI immunoassay; and percentile differences of total cortisol estimation of DEKS panel samples by the HEK293F-GRE assay and different immunoassay compared to LC–MS/MS (PDF)
Author Contributions
∥ A.L. and C.B.F.A. share senior authorship.
Funding for this research was provided by the Novo Nordisk Foundation (NNF20OC0065245), the Lundbeck Foundation (R370-2021-1026), the Lundbeck Experiment 2022 (R400-2022-1165), and the NNF BII Proof of Concept (0062426).
The authors declare no competing financial interest.
Supplementary Material
References
- Truss M.; Beato M. Steroid hormone receptors: Interaction with deoxyribonucleic acid and transcription factors. Endocr. Rev. 1993, 14, 459–479. 10.1210/edrv-14-4-459. [DOI] [PubMed] [Google Scholar]
- Kadmiel M.; Cidlowski J. A. Glucocorticoid receptor signaling in health and disease. Trends Pharmacol. Sci. 2013, 34, 518–530. 10.1016/j.tips.2013.07.003. [DOI] [PMC free article] [PubMed] [Google Scholar]
- Lee S.; Lim H. S.; Shin H. J.; Kim S. A.; Park J.; Kim H. C.; et al. Simultaneous determination of cortisol and cortisone from human serum by liquid chromatography-tandem mass spectrometry. J. Anal. Methods Chem. 2014, 2014, 787483. 10.1155/2014/787483. [DOI] [PMC free article] [PubMed] [Google Scholar]
- DSKB, DES, DEKS . Cortisolprojekt 2018, DSKB, DES Og DEKS. Anbefaling, Rutineanalyse Af Cortisol I Serum Og Plasma, 2018.
- Novotna A.; Pavek P.; Dvorak Z. Construction and characterization of a reporter gene cell line for assessment of human glucocorticoid receptor activation. Eur. J. Pharm. Sci. 2012, 47, 842–847. 10.1016/j.ejps.2012.10.003. [DOI] [PubMed] [Google Scholar]
- FDA US . US Food and Drug Administration Guidance for Industry: Bioanalytical Method Validation; US FDA: Silver Spring, MD, 2018. [Google Scholar]
- Golan D. E.; Tashjian A. H.; Armstrong E. J.. Principles of Pharmacology: The Pathophysiologic Basis of Drug Therapy; Wolters Kluwer Health/Lippincott Williams & Wilkins, 2017; p 531. [Google Scholar]
- de la Rosa R.; Vazquez S.; Tachachartvanich P.; Daniels S. I.; Sillé F.; Smith M. T. Cell-based bioassay to screen environmental chemicals and human serum for total glucocorticogenic activity. Environ. Toxicol. Chem. 2021, 40, 177–186. 10.1002/etc.4903. [DOI] [PMC free article] [PubMed] [Google Scholar]
- Wilson V. S.; Bobseine K.; Lambright C. R.; Gray L. E. A novel cell line, MDA-kb2, that stably expresses an androgen- and glucocorticoid-responsive reporter for the detection of hormone receptor agonists and antagonists. Toxicol. Sci. 2002, 66, 69–81. 10.1093/toxsci/66.1.69. [DOI] [PubMed] [Google Scholar]
- Vermeer H.; Hendriks-Stegeman B. I.; Van Den Brink C. E.; Van Der Saag P. T.; Van Der Burg B.; Van Buul-Offers S. C.; Jansen M. A novel specific bioassay for the determination of glucocorticoid bioavailability in human serum. Clin. Endocrinol. 2003, 59, 49–55. 10.1046/j.1365-2265.2003.01793.x. [DOI] [PubMed] [Google Scholar]
- Raivio T.; Palvimo J. J.; Kannisto S.; Voutilainen R.; Jänne O. A. Transactivation assay for determination of glucocorticoid bioactivity in human serum. J. Clin. Endocrinol. Metab. 2002, 87, 3740–3744. 10.1210/jcem.87.8.8729. [DOI] [PubMed] [Google Scholar]
- Bovee T. F. H.; Helsdingen R. J. R.; Hamers A. R. M.; Brouwer B. A.; Nielen M. W. F. Recombinant cell bioassays for the detection of (gluco)corticosteroids and endocrine-disrupting potencies of several environmental PCB contaminants. Anal. Bioanal. Chem. 2011, 401, 873–882. 10.1007/s00216-011-5162-5. [DOI] [PMC free article] [PubMed] [Google Scholar]
- Ishikawa K.; Tamamura S.; Semba K.; Watanabe S. Establishment of reporter cells that respond to glucocorticoids by a transposon-mediated promoter-trapping system. Eur. J. Pharm. Sci. 2021, 162, 105819. 10.1016/j.ejps.2021.105819. [DOI] [PubMed] [Google Scholar]
- Sedlak D.; Paguio A.; Bartůněk P. Two panels of steroid receptor luciferase reporter cell lines for compound profiling. Comb. Chem. High Throughput Screening 2011, 14, 248–266. 10.2174/138620711795222446. [DOI] [PMC free article] [PubMed] [Google Scholar]
- Perogamvros I.; Kayahara M.; Trainer P. J.; Ray D. W. Serum regulates cortisol bioactivity by corticosteroid-binding globulin-dependent and independent mechanisms, as revealed by combined bioassay and physicochemical assay approaches. Clin. Endocrinol. 2011, 75, 31–38. 10.1111/j.1365-2265.2011.04003.x. [DOI] [PubMed] [Google Scholar]
- Paguio A.; Stecha P.; Wood K. V.; Fan F. Improved dual-luciferase reporter assays for nuclear receptors. Curr. Chem. Genomics 2010, 4, 43–49. 10.2174/1875397301004010043. [DOI] [PMC free article] [PubMed] [Google Scholar]
- Camacho-Sandoval R.; Sosa-Grande E. N.; González-González E.; Tenorio-Calvo A.; López-Morales C. A.; Velasco-Velázquez M.; Pavón-Romero L.; Pérez-Tapia S. M.; Medina-Rivero E. Development and validation of a bioassay to evaluate binding of adalimumab to cell membrane-anchored TNFα using flow cytometry detection. J. Pharm. Biomed. Anal. 2018, 155, 235–240. 10.1016/j.jpba.2018.03.057. [DOI] [PubMed] [Google Scholar]
- Wang L.; Xu G.-l.; Gao K.; Wilkinson J.; Zhang F.; Yu L.; Liu C. y.; Yu C. f.; Wang W. b.; Li M.; et al. Development of a robust reporter-based assay for the bioactivity determination of anti-VEGF therapeutic antibodies. J. Pharm. Biomed. Anal. 2016, 125, 212–218. 10.1016/j.jpba.2016.03.042. [DOI] [PubMed] [Google Scholar]
- Fu Z.; Liu H.; Wang L.; Yu C.; Yang Y.; Feng M.; Wang J. A reporter gene assay for determining the biological activity of therapeutic antibodies targeting TIGIT. Acta Pharm. Sin. B 2021, 11, 3925–3934. 10.1016/j.apsb.2021.09.011. [DOI] [PMC free article] [PubMed] [Google Scholar]
- Abbott Laboratories SI . 510(k) Premarket Notification: K062204. Architect Cortisol Assay; U.S Food and Drug Administration, 2006.
- ROCHE DIAGNOSTICS . 510(k) Premarket Notification: K152227. Elecsys Cortisol II; U.S Food and Drug Administration, 2016.
- SHD Inc. 510(k) Premarket Notification: K142723. ADVIA Centaur Cortisol (COR) Assay; U.S Food and Drug Administration, 2015. [Google Scholar]
- SHDP Ltd. 510(k) Premarket Notification: K202826. IMMULITE 2000 Cortisol; U.S Food and Drug Administration, 2021. [Google Scholar]
- Methlie P.; Hustad S.; Kellman R.; Almås B.; Erichsen M. M.; Husebye E. S.; Løvås K. Multisteroid LC-MS/MS assay for glucocorticoids and androgens and its application in Addison’s disease. Endocr. Connect. 2013, 2, 125–136. 10.1530/EC-13-0023. [DOI] [PMC free article] [PubMed] [Google Scholar]
- Ponzetto F.; Parasiliti-Caprino M.; Settanni F.; Nonnato A.; Mengozzi G.; Ghigo E.; Giordano R. Simultaneous measurement of cortisol, cortisone, dexamethasone and additional exogenous corticosteroids by rapid and sensitive LC-MS/MS analysis. Molecules 2022, 28, 248. 10.3390/molecules28010248. [DOI] [PMC free article] [PubMed] [Google Scholar]
- Dineen R.; Stewart P. M.; Sherlock M. Factors impacting on the action of glucocorticoids in patients receiving glucocorticoid therapy. Clin. Endocrinol. 2019, 90, 3–14. 10.1111/cen.13837. [DOI] [PubMed] [Google Scholar]
- Krasowski M. D.; Drees D.; Morris C. S.; Maakestad J.; Blau J. L.; Ekins S. Cross-reactivity of steroid hormone immunoassays: clinical significance and two-dimensional molecular similarity prediction. BMC Clin. Pathol. 2014, 14, 33. 10.1186/1472-6890-14-33. [DOI] [PMC free article] [PubMed] [Google Scholar]
- Roberts R. F.; Roberts W. L. Performance characteristics of five automated serum cortisol immunoassays. Clin. Biochem. 2004, 37, 489–493. 10.1016/j.clinbiochem.2004.01.009. [DOI] [PubMed] [Google Scholar]
- Huang W.; Kalhorn T. F.; Baillie M.; Shen D. D.; Thummel K. E. Determination of free and total cortisol in plasma and urine by liquid chromatography-tandem mass spectrometry. Ther. Drug Monit. 2007, 29, 215–224. 10.1097/FTD.0b013e31803d14c0. [DOI] [PubMed] [Google Scholar]
- Lewis J. G.; Bagley C. J.; Elder P. A.; Bachmann A. W.; Torpy D. J. Plasma free cortisol fraction reflects levels of functioning corticosteroid-binding globulin. Clin. Chim. Acta 2005, 359, 189–194. 10.1016/j.cccn.2005.03.044. [DOI] [PubMed] [Google Scholar]
- Siiteri P. K.; Murai J. T.; Raymoure W. J.; Kuhn R. W.; Hammond G. L.; Nisker J. A.. The serum transport of steroid hormones. In Greep RO. Proceedings of the 1981 Laurentian Hormone Conference; Academic Press: Boston, 1982; pp 457–510. [DOI] [PubMed]
- Choi M. H. Clinical and technical aspects in free cortisol measurement. Endocrinol. Metab. 2022, 37, 599–607. 10.3803/EnM.2022.1549. [DOI] [PMC free article] [PubMed] [Google Scholar]
- Turpeinen U.; Hämäläinen E. Determination of cortisol in serum, saliva and urine. Best Pract. Res., Clin. Endocrinol. Metab. 2013, 27, 795–801. 10.1016/j.beem.2013.10.008. [DOI] [PubMed] [Google Scholar]
- Vogeser M.; Möhnle P.; Briegel J. Free serum cortisol: quantification applying equilibrium dialysis or ultrafiltration and an automated immunoassay system. Clin. Chem. Lab. Med. 2007, 45, 521–525. 10.1515/cclm.2007.104. [DOI] [PubMed] [Google Scholar]
- El-Farhan N.; Rees D. A.; Evans C. Measuring cortisol in serum, urine and saliva - are our assays good enough?. Ann. Clin. Biochem. 2017, 54, 308–322. 10.1177/0004563216687335. [DOI] [PubMed] [Google Scholar]
- Casals G.; Hanzu F. A. Cortisol measurements in cushing’s syndrome: Immunoassay or mass spectrometry?. Ann. Lab. Med. 2020, 40, 285–296. 10.3343/alm.2020.40.4.285. [DOI] [PMC free article] [PubMed] [Google Scholar]
- Taylor A. E.; Keevil B.; Huhtaniemi I. T. Mass spectrometry and immunoassay: how to measure steroid hormones today and tomorrow. Eur. J. Endocrinol. 2015, 173, D1–D12. 10.1530/EJE-15-0338. [DOI] [PubMed] [Google Scholar]
Associated Data
This section collects any data citations, data availability statements, or supplementary materials included in this article.