

Abstract
Objective:
To determine the underlying relationships between a broad range of headache-associated symptoms and how they relate to headache burden.
Background:
Symptoms associated with head pain inform classification of headache disorders. However, many headache-associated symptoms are not included in the diagnostic criteria, which is largely based on expert opinion. Large symptom databases can assess headache-associated symptoms irrespective of pre-existing diagnostic categories.
Methods:
We conducted a large single-center cross-sectional study on youth (6–17 years old) assessing patient-reported outpatient headache questionnaires between June 2017 and February 2022. Multiple correspondence analysis, an exploratory factor analysis, was applied to 13 headache-associated symptoms.
Results:
6662 participants (64% female; median age 13.6 years) were included. Multiple correspondence analysis dimension 1 (25.4% of the variance) captured the absence or abundance of headache-associated symptoms. A greater number of headache-associated symptoms correlated with greater headache burden. Dimension 2 (11.0% of the variance) revealed three symptom clusters: (1) cardinal features of migraine (light, sound, and smell sensitivity, nausea, and vomiting), (2) nonspecific global neurologic dysfunction symptoms (lightheadedness, trouble thinking, blurry vision), (3) vestibular and brainstem dysfunction symptoms (vertigo, balance problems, ear ringing, double vision).
Conclusion:
Assessing a broader range of headache-associated symptoms reveals clustering of symptomatology and a strong relationship with headache burden.
Keywords: Pediatric, Headache, diagnosis, migraine, headache-associated symptoms
Introduction
Symptoms associated with head pain are integral to the diagnosis of headache disorders. One hallmark distinction between tension-type headache and migraine is the respective absence and presence of light and sound sensitivity and nausea/vomiting (1). Yet, many symptoms commonly associated with head pain are not considered in diagnostic criteria. This is for good reason – the International Classification of Headache Disorders (ICHD) has been simplified over multiple iterations, to aide clinician diagnosis (1). However, current diagnostic criteria may not capture the full range of symptomatology associated with headache disorders. This is important for two reasons. First, the exploration of headache-associated symptoms has provided insight into the underlying pathophysiology of migraine and has supported its description as a sensory processing disorder (2). Second, criteria are used to determine which patients are included in clinical trials, and thus what therapies are available.
Formal diagnostic criteria were initially based on expert consensus of headache presentation in adults, followed by efforts to adapt the criteria to improve their sensitivity and specificity in children. A study evaluating 260 children diagnosed with migraine by a headache specialist found that adding additional associated symptoms (lightheadedness, fatigue, and trouble thinking) did not increase the sensitivity of a migraine diagnosis. However, decreasing the required duration and allowing for bilateral head pain did increase the sensitivity of making a migraine diagnosis (3), which is now reflected in the ICHD-3 (4). These changes have improved diagnosis of migraine in children to best match the experiences of headache experts, however basing diagnosis on expert opinion is also a limitation. Large symptom databases may allow us to determine underlying relationships between headache-associated symptoms in youth that are agnostic to existing diagnostic categories and clinical judgement.
We performed a cross-sectional study of standardized patient-entered headache intake questionnaires from general neurology and headache clinics. We employed multiple correspondence analysis (MCA)—a form of exploratory factor analysis—to determine the underlying relationships between 13 headache-associated symptoms: light, sound, and smell sensitivity, nausea, vomiting, lightheadedness, trouble thinking, room spinning, balance problems, ear ringing, blurry vision, double vision, and neck pain.
Methods
Patient survey data
This cross-sectional study was conducted from patient headache intake questionnaires at Children’s Hospital of Philadelphia general neurology and headache outpatient clinics. Patient survey data were managed using REDCap electronic data (5,6) capture tools hosted at Children’s Hospital of Philadelphia. The institution’s Institutional Review Board approved the extraction of the data from the electronic health record into a research registry, with a waiver of consent and assent to maximize generalizability. Patient-reported demographics and headache history were collected which included the frequency of severe headaches, headache-related disability (PedMIDAS) (7), headache location, pain quality, and headache-associated symptoms. PedMIDAS grade (no, mild, moderate, or severe disability) was used because there was a large skew in the distribution of the raw scores. ICHD-3 diagnosis was made based on a diagnostic algorithm applied to the patient survey data, which we have described in our prior work from this database (8).
We included surveys from respondents aged 6 to 17 years of any sex and race/ethnicity if the following criteria were met: (1) questionnaire completed between June 2017 and February 2022; (2) the participant had answers on overall headache severity, PedMIDAS score, and answered at least some questions related to symptoms associated with headache. Inclusion/exclusion criteria were purposefully broad to capture the fullest range of presentation.
Data analysis
All analyses were performed using custom written code in Matlab (Mathworks, Natick, MA), which is publicly available (9).
Multiple correspondence analysis.
We applied MCA to determine the underlying relationships between 13 headache-associated symptoms. Allodynia was considered for analysis but was omitted because data were only available for those with continuous headache. As an exploratory analysis, MCA was used to explore relationships between headache-associated symptoms and determine if there were symptoms that tended to cluster together – for instance are those who report lightheadedness also more likely to report nausea. MCA reduces the dimensionality of categorical data in Euclidean space (10), similar to principal component analysis for quantitative data. The first-dimension accounts for the most variability in the data, with higher dimensions accounting for less variability. Factor loadings represent the geometric distance between symptom absence or presence. Symptoms located close to each other in MCA space (Figure 2), are more likely to co-occur than symptoms at opposite ends of the plot. MCA calculations were performed through singular value decomposition of an indicator matrix that represent the presence or absence of the 13 headache-associated symptoms as expanded binary values. This was adapted from publicly available Matlab code (11). The sign of MCA dimension 2 was flipped by multiplying all MCA dimension 2 factor loadings by −1 for visual ease of describing the results and did not impact the analysis.
Figure 2.
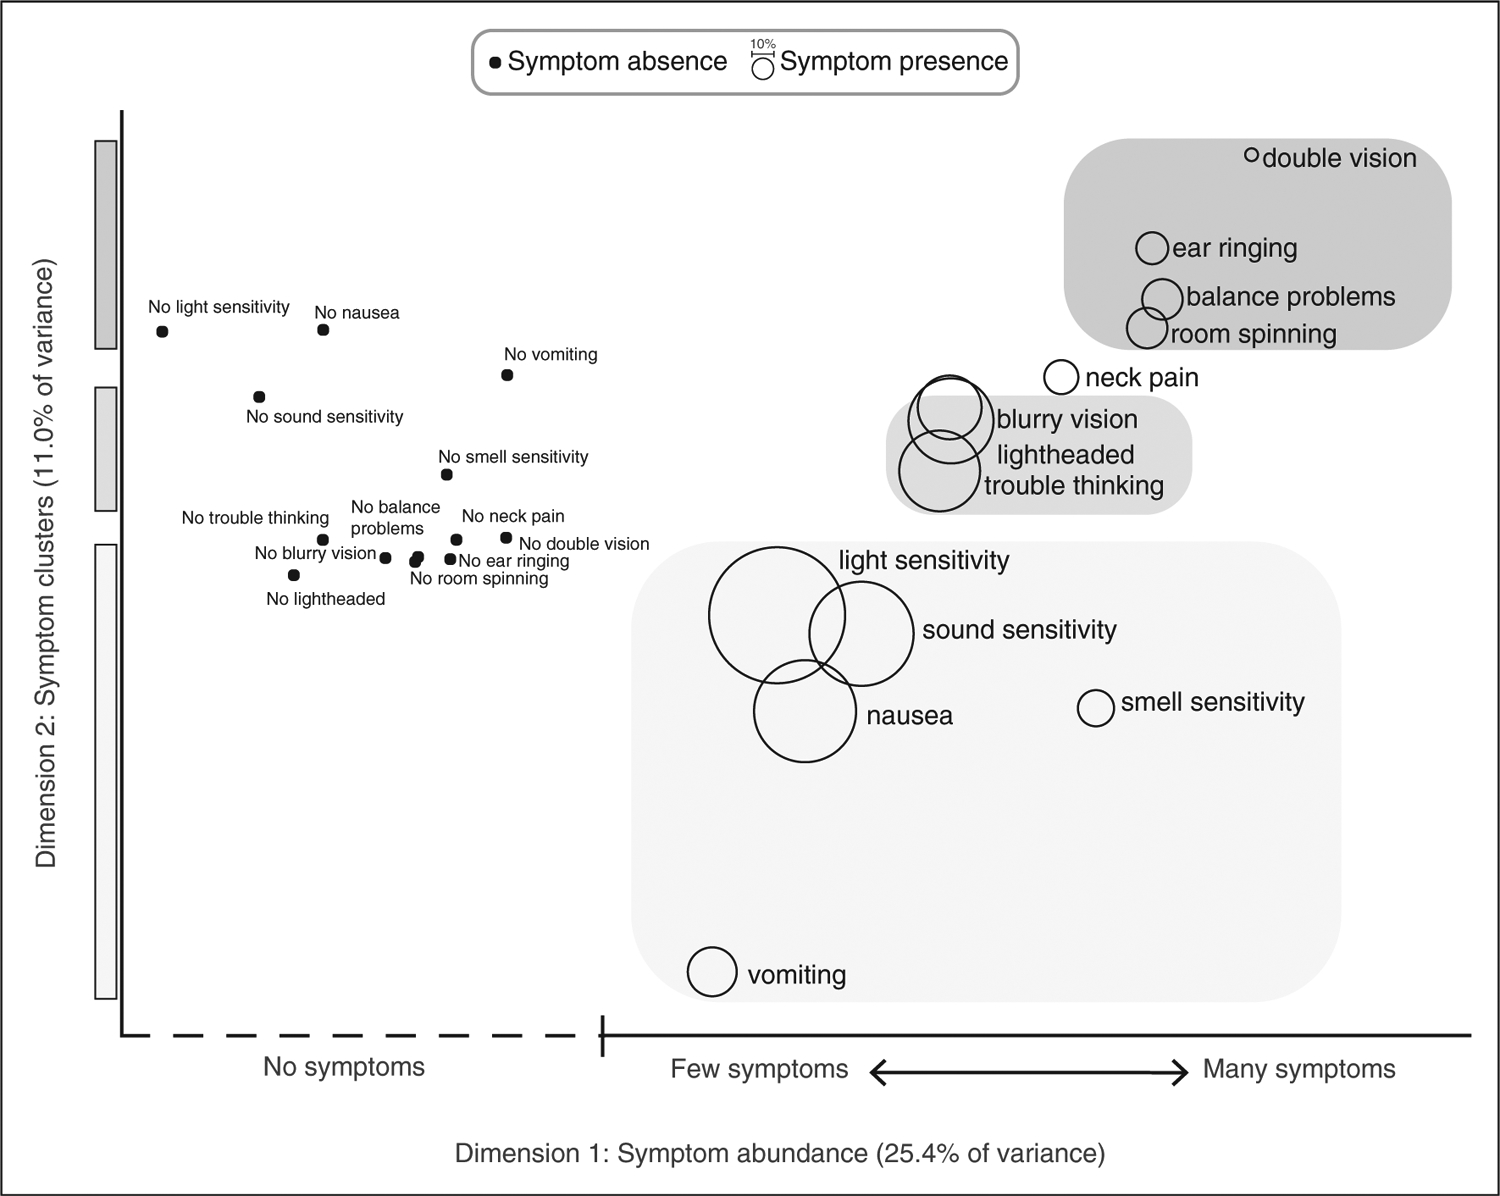
Headache-associated symptoms in MCA space. Factor loadings corresponding to the presence and absence of 13 headache-associated symptoms for MCA dimension 1 (x-axis) and MCA dimension 2 (y-axis). The presence of symptoms are shown as bubbles, with bubble size representing the proportion of respondents who reported the presence of that symptom. Factor loadings for the absence of each symptom is shown as black dots. The proximity of two data points in the 2-dimensional MCA space indicates that these symptoms are more likely to co-occur. Factor loading units are omitted for clarity since the absolute values do not hold specific meaning. MCA dimension 1 consists of the relative absence (left side of graph) or abundance (right side of graph) of headache-associated symptoms. Symptom absence is found at the far left of the graph, and the presence of symptoms to the far right of the graph are more likely to be reported with many other symptoms, while symptoms to the middle of the graph are more likely to be reported with few other symptoms. For instance, vomiting and balance problems are reported with similar frequency, but vomiting is more likely to be reported with relatively few symptoms, while balance problems tend to be reported as one of many symptoms. MCA dimension 2 (y-axis) reveals symptom clustering. Symptoms of hypersensitivity tend to co-occur with nausea and vomiting (bottom of graph, lightest gray), while symptoms of nonspecific neurologic dysfunction (lightheaded, blurry vision, trouble thinking) cluster in the middle of the graph (middle gray), and vestibular and brainstem symptoms cluster at the top of the graph (darkest gray).
Statistical analysis.
Median and interquartile ranges are reported due to non-normal distributions. Effect sizes with 95% confidence intervals are reported as these are more informative than p-values given the large size of the dataset. Confidence intervals are determined by bootstrap analysis with replacement. Cohen’s d criteria were used for dichotomous data (small effect defined as d ≥ 0.2, medium effect defined as d ≥ 0.5, large effect defined as d ≥ 0.8). Spearman’s rank correlation was used for ordinal data, and Pearson’s correlation coefficient was used for continuous data (small effect (R or ρ ≥ 0.1), medium effect (R or ρ ≥ 0.3), large effect (R or ρ ≥ 0.5). Descriptive comparison was made across ICHD-3 diagnosis categories. Missing data, which overall was quite low (<4%) in part due to inclusion/exclusion criteria, are reported in the tables. Kolmogorov-Smirnov test (for interval data) or χ2 test (for nominal data) was used to compare demographic features of respondents who were excluded due to missing data to included respondents.
To address potential bias introduced by excluding questionnaires with missing data, we repeated the analysis on data collected between November 2022 and May 2023, which had improvement in form completion rates by sending reminders to fill out the questionnaires prior to the visit. We did not exclude any participants due to missing data in this secondary analysis. For associated symptoms, where missingness was approximately 6%, the model was rerun two ways - assuming all missing values at the minimum (all missing values set to 0, or not present) and then again at the maximum (all missing values set to 1, or present) to assess model stability.
Results
We screened 9363 patient-reported headache intake questionnaires entered between June 2017 and February 2022 for inclusion (Figure 1): 656 did not meet age requirements, 415 did not start the questionnaire, and 1630 were excluded for missing data. Those with missing data did not significantly differ based on age (h = 0.02, p = 0.50), legal sex (χ2 = 4.3, p = 0.12), or ethnicity (χ2 = 0.71, p = 0.87). However, there were differences in race (χ2 = 18.4, p = 0.005): specifically, there was a smaller percentage of those who identified as Black in the final cohort compared to questionnaires that could not be included due to missing data (13.7 vs. 17.1%). The final cohort included 6662 participants who were 64% female and median age was 13.6 years [IQR 10.5, 15.8]; 32.7% reported continuous headache (i.e. no pain-free periods). Migraine was the most common ICHD-3 diagnosis (44.3%). Race and ethnicity demographics reflected statewide Pennsylvania census data (Table 1) (12).
Figure 1.

Flowchart. Questionnaire inclusion/exclusion are shown. The majority of those excluded for missing data occurred with the PedMIDAS question as this was the nal aspect of the questionnaire. Demographics of those with missing questionnaire data did not significantly differ from the nal cohort based on age (h = 0.02, p = 0.50), sex assigned at birth (χ2 = 4.3, p = 0.12), or ethnicity (χ2 = 0.71, p = 0.87), but did differ by race (χ2 = 18.4, p = 0.005). Specially, a larger percentage of missing data identified as Black compared to the final cohort (13.7% vs. 17.1%).
Table 1.
Respondent demographics and headache characteristics. ICHD3 diagnosis is based on an algorithm applied to patient responses.
| All (n = 6662) | Migraine (44.3%) | Prob Mig (22.4%) | TTH (5.1%) | TAC (1.2%) | Other (0.4%) | PTH (11.1%) | NDPH (10.3%) | Undefined (4.8%) | |
|---|---|---|---|---|---|---|---|---|---|
| Age (yr) [IQR] | 13.6 [10.5, 15.8] | 13.6 [10.7, 15.8] | 12.8 [9.8, 15.3] | 10.9 [8.3, 14.1] | 15.1 [12.1, 16.2] | 14.0 [9.4, 16.3] | 15.0 [12.6, 16.6] | 14.5 [12.1, 16.2] | 12.0 [8.8, 14.8] |
| % Female* | 64.3 | 66.0 | 59.1 | 61.9 | 75.6 | 55.2 | 64.5 | 71.8 | 56.1 |
| Race (%) | |||||||||
| White | 68.0 | 71.1 | 64.5 | 67.7 | 65.9 | 86.2 | 71.6 | 64.7 | 54.5 |
| Black | 13.7 | 11.8 | 16.4 | 12.0 | 18.3 | 0.0 | 12.8 | 14.7 | 19.6 |
| Asian | 2.8 | 2.0 | 3.3 | 5.9 | 2.4 | 3.4 | 2.2 | 3.5 | 4.1 |
| AI | <0.1 | 0.1 | <0.1 | 0.0 | 0.0 | 0.0 | 0.0 | 0.0 | <0.1 |
| PI | <0.1 | 0.0 | 0.0 | 0.0 | 0.0 | 0.0 | 0.0 | <0.1 | 0.0 |
| Unknown | 13.8 | 13.7 | 13.8 | 13.2 | 12.2 | 10.3 | 11.5 | 14.7 | 20.3 |
| No answer | 1.3 | 0.9 | 1.7 | 0.6 | 0.0 | 0.0 | 1.8 | 1.9 | 0.9 |
| Missing | 0.3 | 0.4 | 0.3 | 0.6 | 1.2 | 0.1 | 0.1 | 0.5 | 0.6 |
| Ethnicity (%) | |||||||||
| Hispanic | 7.8 | 7.6 | 7.4 | 7.0 | 8.5 | 3.4 | 7.5 | 8.1 | 11.2 |
| Not Hisp. | 90.3 | 90.9 | 90.7 | 90.0 | 90.2 | 93.1 | 89.7 | 89.2 | 86.9 |
| Unknown | <0.1 | 0.0 | 0.0 | 0.0 | 0.0 | 0.0 | 0.0 | 0.0 | 0.0 |
| No answer | 1.6 | 1.1 | 1.7 | 2.3 | 0.0 | 3.4 | 2.5 | 2.0 | 1.6 |
| Missing | 0.3 | 0.4 | 0.2 | 0.7 | 1.3 | 0.1 | 0.3 | 0.7 | 0.3 |
| HA pattern (%) | |||||||||
| Intermittent | 67.3 | 73.7 | 79.9 | 89.1 | 41.5 | 96.6 | 59.6 | 0.0 | 92.5 |
| Continuous | 32.8 | 26.3 | 20.1 | 10.9 | 58.5 | 3.4 | 40.2 | 100.0 | 7.5 |
| Missing | <0.1 | 0.0 | 0.0 | 0.0 | 0.0 | 0.0 | 0.2 | 0.0 | 0.0 |
| Usual HA severity (%) | |||||||||
| Mild | 8.7 | 2.8 | 8.1 | 40.5 | 0.0 | 6.9 | 9.3 | 8.3 | 32.7 |
| Moderate | 57.3 | 54.8 | 64.7 | 53.1 | 51.2 | 62.1 | 56.3 | 61.5 | 44.5 |
| Severe | 34.0 | 42.4 | 27.1 | 6.5 | 48.8 | 31.0 | 34.3 | 30.2 | 22.7 |
| PedMIDAS (%) | |||||||||
| None | 35.3 | 28.1 | 45.1 | 66.0 | 17.1 | 86.2 | 25.3 | 25.4 | 68.9 |
| Mild | 32.1 | 36.7 | 31.7 | 22.3 | 30.5 | 3.4 | 26.6 | 30.5 | 22.7 |
| Moderate | 13.0 | 15.0 | 10.1 | 6.2 | 12.2 | 6.9 | 16.1 | 15.1 | 3.7 |
| Severe | 19.6 | 20.3 | 13.1 | 5.6 | 40.2 | 3.4 | 32.0 | 28.9 | 4.7 |
| Bad HA freq (%) | |||||||||
| Never | 2.0 | 0.4 | 1.8 | 5.9 | 0.0 | 6.9 | 1.1 | 2.9 | 14.3 |
| < 1 month | 12.5 | 11.8 | 16.0 | 17.3 | 1.2 | 6.9 | 8.0 | 6.3 | 24.9 |
| 1–3 month | 25.3 | 30.2 | 25.3 | 28.5 | 17.1 | 6.9 | 19.6 | 14.2 | 18.4 |
| 1/week | 14.3 | 16.9 | 14.2 | 13.2 | 8.5 | 17.2 | 13.3 | 7.4 | 10.0 |
| 2–3/week | 17.4 | 17.4 | 16.6 | 15.3 | 22.0 | 17.2 | 22.2 | 19.0 | 8.4 |
| > 3/week | 9.1 | 8.4 | 8.7 | 6.7 | 22.0 | 20.7 | 11.2 | 12.2 | 3.4 |
| Daily | 11.0 | 8.5 | 9.5 | 6.2 | 22.0 | 20.7 | 15.5 | 23.1 | 5.9 |
| Always | 3.5 | 2.1 | 2.5 | 1.2 | 7.3 | 0.0 | 6.2 | 9.7 | 1.9 |
| Other | 3.4 | 2.6 | 3.6 | 4.7 | 0.0 | 3.5 | 2.0 | 4.8 | 8.4 |
| Missing | 1.5 | 1.7 | 1.8 | 1.0 | 0.0 | 0.0 | 0.9 | 0.4 | 4.4 |
Prob Mig=Probable migraine, AI=American Indian, PI=Pacific Islander, Not Hisp=Not Hispanic, HA=Headache, IQR=interquartile range, TAC=trigeminal autonomic cephalalgia, PTH=post-traumatic headache, NDPH=new daily persistent headache, Other=other primary headache disorders, occipital neuralgia and primary stabbing headache, undefined=those who did not meet classification criteria for any of the other headache diagnoses, PedMIDAS=PedMIDAS disability grade.
Indicates legal sex. Other primary HA disorder includes occipital neuralgia and primary stabbing headache.
The rates of the 13 headache-associated symptoms included in the MCA ranged between 6.4% and 64.1% (Table 2); correlation of symptoms is also reported (Online Supplementary Table S1). Light sensitivity, sound sensitivity, and nausea (cardinal symptoms of migraine) were most frequently reported. The first MCA dimension captured the absence or abundance of headache-associated symptoms (Figure 2, x-axis). The second MCA dimension revealed three symptom clusters: sensory hypersensitivity and nausea, symptoms of nonspecific global neurologic dysfunction (lightheadedness, blurry vision, and trouble thinking), and symptoms of brainstem and vestibular dysfunction (room spinning, balance problems, ear ringing, and double vision; Figure 2, y-axis).
Table 2.
Percentage of respondents who reported individual headache-associated symptoms.
| % respondents reporting | All (n=6662) | Migraine (44.3%) | Prob Mig (22.4%) | TTH (5.1%) | TAC (1.2%) | Other (0.4%) | PTH (11.1%) | NDPH (10.3%) | Undefined (4.8%) |
|---|---|---|---|---|---|---|---|---|---|
| Light sensitivity | 64.1 | 81.6 | 45.6 | 19.9 | 86.6 | 13.8 | 71.3 | 61.2 | 23.1 |
| Sound sensitivity | 49.2 | 67.9 | 25.7 | 5.9 | 70.7 | 6.9 | 56.3 | 49.7 | 12.2 |
| Nausea | 48.2 | 70.9 | 23.2 | 0.0 | 59.8 | 6.9 | 49.5 | 45.9 | 10.0 |
| Dizziness* | 47.7 | 54.4 | 36.7 | 18.5 | 74.4 | 17.2 | 57.9 | 54.8 | 25.2 |
| Lightheaded | 39.8 | 46.4 | 28.7 | 13.2 | 67.1 | 13.8 | 48.3 | 46.8 | 18.7 |
| Room spinning | 18.7 | 21.8 | 13.4 | 6.2 | 26.8 | 3.4 | 22.2 | 24.7 | 5.9 |
| Balance problem | 18.7 | 19.8 | 12.7 | 5.3 | 32.3 | 10.3 | 29.9 | 23.7 | 10.6 |
| Trouble thinking | 37.7 | 44.1 | 25.4 | 14.7 | 56.1 | 10.3 | 51.7 | 42.2 | 14.3 |
| Blurry vision | 30.0 | 33.8 | 22.1 | 12.9 | 43.9 | 3.5 | 37.9 | 35.6 | 18.1 |
| Vomiting | 23.2 | 38.2 | 11.4 | 0.0 | 19.5 | 6.9 | 15.4 | 14.1 | 5.3 |
| Smell sensitivity | 16.6 | 24.5 | 7.0 | 1.8 | 30.5 | 6.9 | 15.1 | 17.4 | 3.1 |
| Neck pain | 16.1 | 19.8 | 8.8 | 4.7 | 25.6 | 10.3 | 24.0 | 20.4 | 5.9 |
| Ear ringing | 14.8 | 16.3 | 9.5 | 6.5 | 26.8 | 6.9 | 20.8 | 21.1 | 5.3 |
| Double vision | 6.4 | 6.9 | 4.4 | 3.5 | 11.0 | 0.0 | 10.0 | 7.8 | 1.9 |
HA = Headache, sx = symptom, GI = gastrointestinal,
Dizziness = proportion of individuals who reported any of the following: lightheadedness, room spinning, balance problems. Overall, 2.3% had missing GI symptom data (nausea, vomiting), 2.1% had missing visual symptom data (blurry vision, double vision), and 2.1% were missing all other symptoms.
Headache-associated symptoms, headache burden, and respondent characteristics
We compared MCA factor loadings across multiple metrics of headache burden (Figure 3a). MCA dimension 1 showed a small association with headache severity (ρ = 0.24; 95% CI 0.22, 0.27), greater frequency of severe headache (ρ = 0.19; 95% CI 0.16, 0.21), and the presence of continuous headache (d = 0.49; 95% CI 0.43, 0.54), and a moderate association with greater headache-related disability (ρ = 0.41; 95% CI 0.39, 0.43). Older age (R = 0.32, 95% CI 0.29, 0.34; medium effect) and female sex (d = 0.40; 95% CI 0.36, 0.45; small effect) were also associated with a greater number of headache-associated symptoms. Females showed a larger association between MCA dimension 1 factor loadings and age than males (R = 0.32, 95% CI 0.29, 0.34; medium effect vs. R = 0.23, 95% CI 0.20, 0.27; small effect), with this divergence occurring around the onset of puberty (Figure 3b).
Figure 3.

Comparison of abundance of headache-associated symptoms with headache burden and demographic data. (a) MCA dimension 1 factor loadings for individual respondents is shown as a function of overall headache severity (left panel), headache-related disability as measured by PedMIDAS (middle panel), and frequency of severe headaches (right panel). Box-and-whisker plots represent the median (thick line), interquartile range (box), 95th percentile (whiskers), and outliers (+ signs) and (b) Median MCA dimension 1 factor loadings are plotted as a function of age (binned by age in years), and legal sex. HA = headache, mod. = moderate, mo = month, wk = week, yr = year.
MCA dimension 2 showed inconsistent small-to-negligible associations with headache burden metrics including severity (ρ = −0.18; 95% CI −0.20, −0.15), frequency (ρ = 0.18; 95% CI 0.15, 0.20), disability (ρ = 0.04; 95% CI 0.01, 0.06), and the presence of continuous headache (d = 0.38; 95%CI 0.33, 0.43), indicating that headache burden did not consistently vary with symptom type. There was a small effect of age (R = 0.14; 95%CI 0.12, 0.17) and sex on dimension 2 (d = 0.23; 95% CI 0.18, 0.28) indicating older youth and females were more likely to report symptoms of nonspecific global neurologic dysfunction (lightheadedness, trouble thinking, blurry vision), and vestibular and brainstem symptoms (vertigo, balance problems, ear ringing, double vision). Removing the 788 (11.8%) of respondents with no headache-associated symptoms (for whom MCA dimension 2 factor loadings do not hold meaning) revealed a small association between positive MCA dimension 2 factor loadings and greater headache-related disability (ρ = 0.11; 95% CI 0.08, 0.13), but did not significantly affect other metrics.
Comparison of MCA and ICHD-3 headache diagnoses
We compared total number headache-associated symptoms, and MCA dimension 1 and dimension 2 factor loadings across ICHD-3 headache diagnosis for the most common diagnoses (Figure 4). Respondents with migraine reported the most headache-associated symptoms and those with tension-type headache reported the least, in part because migraine requires headache-associated symptoms, while tension-type headache requires their absence. However, this relationship remained when a broader range of headache-associated symptoms were considered. Probable migraine fell in between, but overlapped with migraine. Of those (n = 1491) with probable migraine, 893 (59.9%) did not meet migraine criteria solely based on lack of headache-associated symptoms. Of those, 204/893 (22.8%) had an MCA dimension 1 score above the 25th percentile of dimension factor loadings reported by those with migraine. This suggests that, conservatively, at least 13.7% (204/1491) of those with probable migraine would meet criteria for migraine if a broader range of symptoms was included. Post-traumatic headache and new daily persistent headache, diagnoses defined by the circumstances of their onset, demonstrated broader distributions. MCA dimension 2 factor loadings clustered in the sensory hypersensitivity range for those with migraine (in part by design), while other diagnostic categories had greater representation of MCA dimension 2 factor loadings that represented different forms of dizziness.
Figure 4.
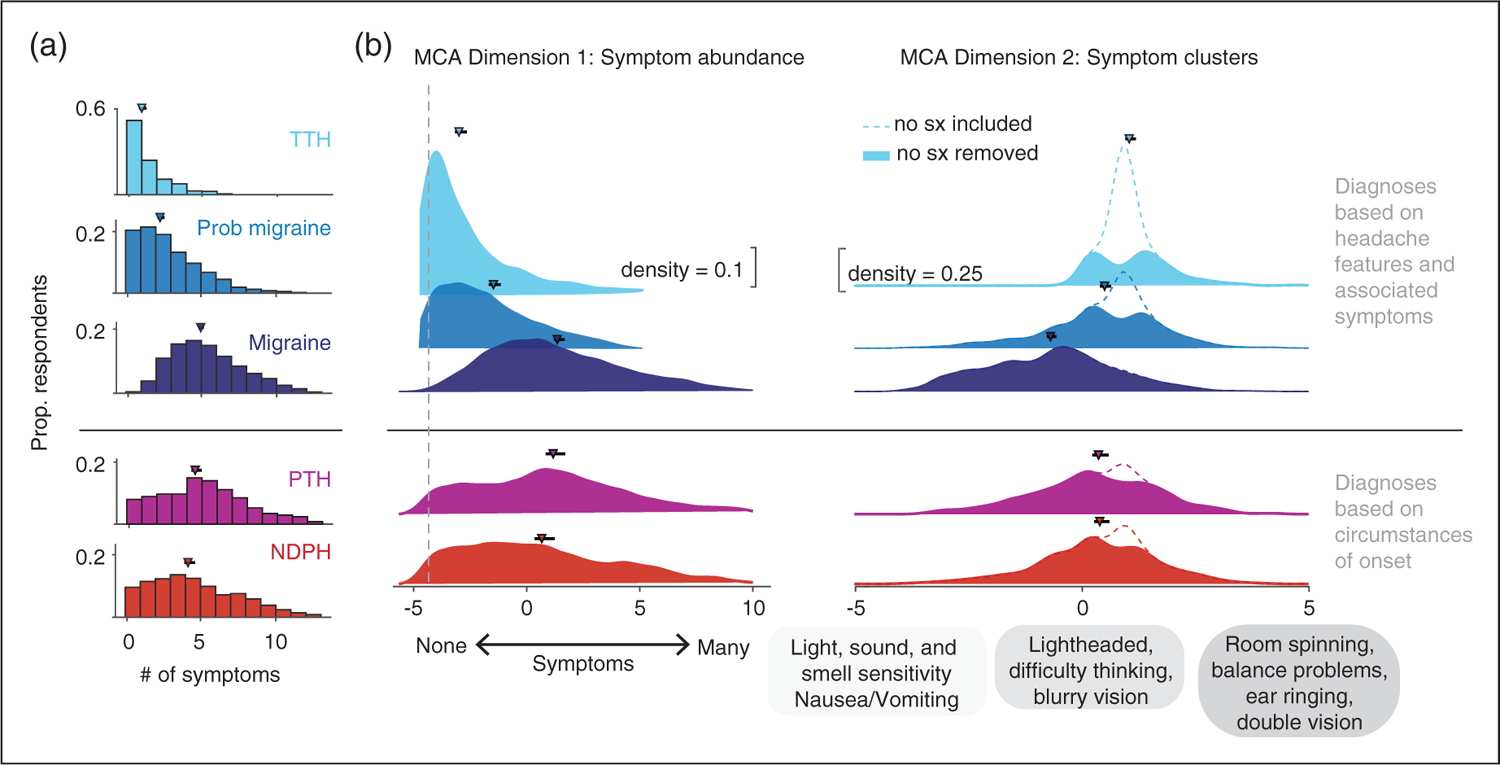
Headache-associated symptom by ICHD-3 diagnosis. (a) Histograms of the total number of headache-associated symptoms (maximum 13) reported by individual respondents by ICHD-3 headache diagnosis. Markers indicate median number of symptoms with 95% confidence intervals by bootstrap analysis. A small percentage (0.4%) of those with a migraine diagnosis reported no headache-associated symptoms because ICHD-3 associated symptom criteria could still be met if they reported light and sound as a trigger for headache, though this was a rare occurrence (b) Ridgeline plots of individual respondents’ factor loadings of MCA dimensions 1 (left panel), and 2 (right panel) by ICHD-3 diagnosis. Markers and errorbars represent the median MCA score for each diagnosis with 95% confidence intervals. ICHD-3 diagnoses are grouped based on whether diagnosis is made by features of headache (migraine, probable migraine, tension-type headache) or the circumstances of their onset (post-traumatic headache, new daily persistent headache). Dotted gray line represents the factor loading corresponding to no symptoms for MCA dimension 1. Ridgeline plots for MCA dimension 2 are shown with (dotted line) and without (solid color) respondents who reported no symptoms. This was done to distinguish respondents who reported no symptoms compared to those who were experiencing symptoms in the lightheadedness cluster, which have similar factor loadings near 0. Distributions represent kernel density function based on normal distribution with a bandwidth of 0.5 for MCA dimension 1, and 0.25 for MCA dimension 2. # = number, Sx = symptoms, TTH = tension-type headache, PTH = post-traumatic headache, NDPH = New daily persistent/new onset headache.
Secondary analysis to address missingness
A secondary analysis was run on 1221 questionnaires collected between November 2022 and May 2023 because missing data rates were much lower in this sample: headache severity 4.4%, PedMIDAS 3.8%, 6.7% for gastrointestinal (GI) associated symptoms, 4.7% for visual associated symptoms, 6.3% for all other associated symptoms. In this sample, no participants were excluded due to missing data. This analysis yielded very similar results to our main analysis (see Online Supplemental materials). These relationships were preserved when all missing headache-associated symptom data were set to minimum and maximum values, indicating these headache symptom clusters were robust.
Discussion
We applied exploratory factor analysis to a cross-sectional sample of patient survey data to determine the underlying relationships between headache-associated symptoms in youth. We found that the cardinal symptoms of migraine cluster. There were additional symptom clusters that consisted of nonspecific global neurologic dysfunction (lightheadedness, trouble thinking, blurry vision), and symptoms associated with vestibular and brainstem dysfunction (vertigo, balance problems, ear ringing, double vision). We also found that a greater number of headache-associated symptoms correlated with greater headache burden. Our approach differs from prior exploratory factor analysis of headache features (13,14) because it focuses specifically on the relationships between headache-associated symptoms across a wide range of symptom types. This difference fundamentally shifts the focus from head pain to the constellation of neurologic symptoms associated with head pain, which is related to greater headache-related disability (15), and is of similar importance to alleviate as head pain from the perspective of individuals with migraine (16).
Tension-type headache, probable migraine, and migraine, a spectrum?
We found an abundance of headache-associated symptoms consistently correlated with other metrics indicating higher headache burden, which also differed across ICHD-3 headache diagnoses. Most respondents with tension-type headache reported no headache-associated symptoms while those with migraine reported the most headache-associated symptoms. Notably, those with probable migraine demonstrated a distribution of MCA dimension 1 factor loadings with a long tail that overlapped substantially with the migraine group. Of those with probable migraine, nearly 14% could have met full criteria for migraine if a broader range of headache-associated symptoms were considered. Our findings are consistent with the proposal that these primary headache disorders exist across a gamut of severity, but we cannot confidently differentiate between the ‘spectrum’ and ‘continuum’ theory. Specifically, whether tension-type headache is its own entity and probable migraine and migraine exist along a spectrum of disease (17), or tension-type, probable migraine, and migraine exist along the same continuum (18). Our findings do indicate that assessing a broader range of headache-associated symptoms, and the overall number of symptoms reported, could help define the spectrum of severity in migraine.
Age-related changes in headache-associated symptoms
Older children tended to report a greater number of headache-associated symptoms. Further, pre-pubertal males and females had very similar MCA dimension 1 factor loadings that diverged around the time of puberty. These findings are consistent with adult studies that show females experience a greater number of headache-associated symptoms than males, and that the incidence and prevalence of migraine increases around the time of puberty at a greater rate in females than males (19–21). Our findings are also consistent with headache-associated symptoms changing throughout childhood. Vomiting may have been reported with fewer symptoms because it is more commonly reported in young children, who reported fewer headache-associated symptoms (22). By contrast, adolescents who were more likely to report dizziness in our cohort than others (22), were also more likely to report a greater number of headache-associated symptoms. This may be due, at least in part, to language development during childhood – younger children who may not have the language to describe light and sound sensitivity or light headedness can directly demonstrate vomiting, and therefore may be more likely to be identified as having migraine at a younger age.
Vertiginous and non-vertiginous dizziness in youth with headache
Nearly half of the cohort (47.7%) reported some form of dizziness, similar to adults with migraine (23), over eight times the general pediatric population rate (24). Dizziness may be particularly relevant for headache disorders that first present in childhood because headache is associated with first presentation of dizziness at a younger age (25), and 25–35% of dizziness/vertigo evaluated in pediatric vestibular clinics is attributed to vestibular migraine (26,27).
Different forms of dizziness appeared to cluster with other headache-associated symptoms. Lightheadedness was the most prevalent form of dizziness and was most closely associated with other symptoms of nonspecific, global neurologic dysfunction including trouble thinking and blurry vision. This symptom cluster is also reported in hemodynamic orthostatic dizziness (28). Room spinning and balance problems were less common, and were closely associated with each other, and with other vestibular and brainstem symptoms including ear ringing and double vision. Interestingly, neck pain fell in between these two dizziness clusters.
The ICHD-3 considers vertiginous forms of dizziness in headache diagnosis under specific circumstances. Migraine with brainstem aura includes vertigo as part of aura. Vestibular migraine is in the Appendix of the ICHD-3, indicating that it is a less well-established diagnosis (4). While we were unable to assess the timing of symptoms, in our clinical experience these symptoms do not always present as strictly defined aura, but can be present throughout a headache attack, outside of headache attacks, and in some cases are persistent. The prevalence of migraine with brainstem aura is an estimated 0.04% of the general population (29), making it unlikely that this symptom cluster is representative of the ICHD-3 diagnosis. Our results indicate that both vertiginous and non-vertiginous dizziness are commonly reported in youth with headache, supporting their inclusion in the ICHD.
Separate, but overlapping neural networks associated with headache
The pathophysiology of migraine is complex, affecting multiple brain regions involved in sensory and pain processing including the cortical and subcortical regions, the brain stem, and the cerebellum (30,31). We speculate that the symptom clusters represent disruption of different neural networks associated with head pain. Sensory hypersensitivity has been associated with enhanced responses in corresponding sensory cortices (32). Lightheadedness, blurry vision, and trouble thinking may reflect involvement of the trigemino-autonomic reflex. Vertigo, ear ringing, and double vision symptom clusters have been attributed to vestibular and brainstem dysfunction when they take the form of an aura (4), though alternatively could originate in the parieto-temporal cortex (33).
Central sensitization of the trigeminal nociceptive system (34) has become integral to our understanding of the pathophysiology of migraine and may be the common thread linking all headache-associated symptoms. It may be that genetic and environmental differences confer varying vulnerabilities of different neural networks to be disrupted by central sensitization. Broader neural network disruption may yield a greater abundance of headache-associated symptoms and a more severe headache phenotype. Better characterization of headache-associated symptoms may help us understand and identify different genetic clusters within migraine as migraine genetics studies have thus far shown great heterogeneity. One study has already found success with this type of approach, identifying a gene locus specifically associated with sound sensitivity trait (35).
Limitations
The following limitations should be considered when interpreting these data. The study design is potentially impacted by multiple forms of bias including selection bias, recall bias, self-reporting bias. The sample was limited to those with sufficiently severe headaches to seek specialty care, therefore more mild forms of headache like tension-type headache is likely to be underrepresented. Our measures were based on patient response, which is subject to misinterpretation and recall bias. In our prior work with this dataset, we found some discrepancy between patient responses and provider documentation that could impact ICHD-3 diagnosis in one third of entries (8). Selection bias also could have impacted our results as there were demographic differences between those excluded. Reassuringly, we were able to replicate our results by running the same analysis on more recently collected headache questionnaires after changes were made to improve respondent completion of the questionnaire. Data were collected from a single center, thus additional work is needed to determine the generalizability of our findings. The selection of the headache-associated symptoms included in this analysis impacts the overall outcomes. The headache-associated symptoms are not an exhaustive list, but it included many commonly reported symptoms (4) that extend beyond the cardinal symptoms of migraine.
Disparities in headache diagnosis
Additional findings and limitations should be noted regarding health disparities across under-represented populations. Questionnaires that were excluded based on missing data generally came from patients with similar demographics, but they were more likely to be Black, which indicates this group was underrepresented in our cohort compared to the broader community served by The Children’s Hospital of Philadelphia neurology, introducing a potential source of bias. This has been linked to differences in completion rates by clinic site (36). This is an important disparity that our group is working to address, and we have made some progress in rates of headache questionnaire completion. A higher percentage of males and minority races and ethnicities including individuals who identified as Black, Asian, and Hispanic were in the undefined ICHD3 headache category than the ICHD3 categories (Table 1). It has been shown that racial and ethnic minority groups are less likely to receive a specific headache diagnosis that impacts the care they receive (37), that African Americans showed differences in headache characteristics as children (38), and were more likely to meet diagnostic criteria for probable migraine than migraine in adults, which had implications for treatment (39). Since diagnosis was based on patient responses prior to provider input, our findings provide additional evidence that further work is needed to understand how headaches and associated symptoms are experienced and described across the sexes and a broader range of ethnic and racial groups and incorporated into the ICHD.
Conclusions
Our findings confirm the cluster of the cardinal associated symptoms of migraine. However, we also found two headache-associated symptom clusters that are not captured by the cardinal features of migraine, which provided important information about headache burden. We propose creating migraine subgroups based on headache-associated symptoms that include vertiginous and non-vertiginous forms of dizziness in diagnostic criteria. This will help to expand headache diagnosis and validate the experiences of youth with headache. Further work is needed to determine if these symptom clusters reflect involvement of different neural networks associated with head pain, and whether this information can be used to inform biomarker development, prognosis, and guide treatment.
Supplementary Material
Article highlights.
Youth with a greater number of headache-associated symptoms had higher headache burden.
The cardinal, sensory hypersensitivity symptoms of migraine tended to co-occur in youth with headache. Additional symptom clusters consistent of symptoms of nonspecific global neurologic dysfunction, and vestibular and brainstem symptoms.
A broader range of headache-associated symptoms should be considered in diagnosis.
Funding
The authors disclosed receipt of the following financial support for the research, authorship, and/or publication of this article: This work was supported by the National Institute of Neurological Disorders and Stroke of the National Institutes of Health K23NS124986 (to C.P.G) and K23NS102521 (to C. L.S.), the Minds Matter Frontier Program grant from the Children’s Hospital of Philadelphia (to C.P.G.), American Academy of Neurology Clinical Research Training Scholarship (to C.P.G.), the International Headache Academy Research Award sponsored by the American Headache Society (to C.P.G.), the CHOP/Penn NeuroNEXT fellowship (to C.P.G.), and Department of Defense Grant W81XWH-151-0447 (to G.K.A.). Pfizer Grant for Learning and Change supported the development of the patient questionnaire and registry (to C.L.S.).
Declaration of conflicting interests
The authors declared the following potential conflicts of interest with respect to the research, authorship, and/or publication of this article: C.P.G. has received salary support from grants from the American Academy of Neurology Clinical Research Training Scholarship, the International Headache Academy Research Award sponsored by the American Headache Society, the CHOP/Penn NeuroNEXT fellowship, and is currently funded by the National Institutes of Health/National Institute of Neurological Disorders and Stroke (K23 NS124986).
G.K.A. serves on the scientific advisory board of Nia Therapeutics for which he has received stock options; the company was not involved in this research.
A.D.H. or his institution have received compensation for serving as a consultant for AbbVie, Amgen, Biohaven, Eli Lilly, Lundbeck, Supernus, Teva, Theranica and Upsher-Smith. His institution has also received research support from Amgen, Biohaven, Eli Lilly, Theranica, Upsher-Smith, and the NIH NINDS/NICHDS.
C.L.S. has received research/grant support from the National Institutes of Health/National Institute of Neurological Disorders and Stroke (K23 NS102521) and the Pfizer Grant for learning and change. Dr. Szperka or her institution have received compensation for her consulting work for Impel NeuroPharma, Inc.; Eli Lilly; Lundbeck; Teva Pharmaceutical Industries Ltd; Upsher-Smith Laboratories, LLC; and Abbvie.
References
- 1.Goadsby PJ. Recent advances in the diagnosis and management of migraine. BMJ 2006; 332: 25–29. [DOI] [PMC free article] [PubMed] [Google Scholar]
- 2.Harriott AM and Schwedt TJ. Migraine is associated with altered processing of sensory stimuli. Curr Pain Headache Rep 2014; 18: 1–7. [DOI] [PubMed] [Google Scholar]
- 3.Hershey AD, Winner P, Kabbouche MA, et al. Use of the ICHD-ii criteria in the diagnosis of pediatric migraine. Headache J Head Face Pain 2005; 45: 1288–1297. [DOI] [PubMed] [Google Scholar]
- 4.International Headache Society. The International Classification of Headache Disorders, 3rd edition. Cephalalgia 2018; 38: 1–211. [DOI] [PubMed] [Google Scholar]
- 5.Harris PA, Taylor R, Minor BL, et al. The REDCap consortium: Building an international community of software platform partners. J Biomed Inform 2019; 95: 103208. [DOI] [PMC free article] [PubMed] [Google Scholar]
- 6.Harris PA, Taylor R, Thielke R, et al. Research electronic data capture (REDCap)—A metadata-driven methodology and workflow process for providing translational research informatics support. J Biomed Inform 2009; 42: 377–381. [DOI] [PMC free article] [PubMed] [Google Scholar]
- 7.Hershey AD, Powers SW, Vockell A-LB, et al. PedMIDAS: development of a questionnaire to assess disability of migraines in children. Neurology 2001; 57: 2034–2039. [DOI] [PubMed] [Google Scholar]
- 8.Patterson Gentile C, Aguirre GK, Hershey AD, et al. Comparison of continuous headache features in youth with migraine, new daily persistent headache, and persistent post-traumatic headache. Cephalalgia 2023; 43. DOI: 10.1177/033310242211313. [DOI] [PMC free article] [PubMed] [Google Scholar]
- 9.Patterson-Gentile C. Headache Symptom Clusters Repository. https://github.com/carlynpatterson/Headache-symptom-clusters.git (2023, accessed 13 June 2023).
- 10.Panagiotakos D and Pitsavos C. Interpretation of epidemiological data using multiple correspondence analysis and log-linear models. J Data Sci 2004; 2: 75–86. [Google Scholar]
- 11.Trujillo-Ortiz A. Multiple Correspondence Analysis Based on the Indicator Matrix. https://www.mathworks.com/matlabcentral/fileexchange/22154-multiple-correspondence-analysis-based-on-the-indicator-matrix, MATLAB Central File Exchange (retrieved 22 February 2022).
- 12.Pennsylvania Census Data. https://www.census.gov/library/stories/state-by-state/pennsylvania-population-change-between-census-decade.html. (2020, accessed 28 February 2022).
- 13.Ziegler DK, Hassanein RS and Couch JR. Headache syndromes suggested by statistical analysis of headache symptoms. Cephalalgia 1982; 2: 125–134. [DOI] [PubMed] [Google Scholar]
- 14.Drummond PD and Lance JW. Clinical diagnosis and computer analysis of headache symptoms. J Neurol Neurosurg Psychiatry 1984; 47: 128–133. [DOI] [PMC free article] [PubMed] [Google Scholar]
- 15.Tkachuk GA, Cottrell CK, Gibson JS, et al. Factors associated with migraine-related quality of life and disability in adolescents: a preliminary investigation. Headache J Head Face Pain 2003; 43: 950–955. [DOI] [PMC free article] [PubMed] [Google Scholar]
- 16.Lipton RB, Hamelsky SW and Dayno JM. What do patients with migraine want from acute migraine treatment? Headache J Head Face Pain 2002; 42: 3–9. [DOI] [PubMed] [Google Scholar]
- 17.Lipton RB, Cady RK, Stewart WF, et al. Diagnostic lessons from the Spectrum Study. Neurology 2002; 58: S27–S31. [DOI] [PubMed] [Google Scholar]
- 18.Vargas BB. Tension-type headache and migraine: Two points on a continuum? Curr Pain Headache Rep 2008; 12: 433–436. [DOI] [PubMed] [Google Scholar]
- 19.Stewart WF, Linet MS, Celentano DD, et al. Age- and sex-specific incidence rates of migraine with and without visual aura. Am J Epidemiol 1991; 134: 1111–1120. [DOI] [PubMed] [Google Scholar]
- 20.Buse DC, Loder EW, Gorman JA, et al. Sex differences in the prevalence, symptoms, and associated features of migraine, probable migraine and other severe headache: Results of the American Migraine Prevalence and Prevention (AMPP) Study. Headache J Head Face Pain 2013; 53: 1278–1299. [DOI] [PubMed] [Google Scholar]
- 21.Lipton RB, Bigal ME, Diamond M, et al. Migraine prevalence, disease burden, and the need for preventive therapy. Neurology 2007; 68: 343–349. [DOI] [PubMed] [Google Scholar]
- 22.Eidlitz-Markus T, Gorali O, Haimi-Cohen Y, et al. Symptoms of migraine in the paediatric population by age group. Cephalalgia 2008; 28: 1259–1263. [DOI] [PubMed] [Google Scholar]
- 23.Bisdorff A, Andrée C, Vaillant M, et al. Headache-associated dizziness in a headache population: Prevalence and impact. Cephalalgia 2010; 30: 815–820. [DOI] [PubMed] [Google Scholar]
- 24.Brodsky JR, Lipson S and Bhattacharyya N. Prevalence of pediatric dizziness and imbalance in the United States. Otolaryngol Neck Surg 2020; 162: 241–247. [DOI] [PubMed] [Google Scholar]
- 25.Teggi R, Manfrin M, Balzanelli C, et al. Point prevalence of vertigo and dizziness in a sample of 2672 subjects and correlation with headaches. Acta Otorhinolaryngol Ital 2016; 36: 215–219. [DOI] [PMC free article] [PubMed] [Google Scholar]
- 26.Wang A, Zhou G, Lipson S, et al. Multifactorial characteristics of pediatric dizziness and imbalance. Laryngoscope 2021; 131: E1308–E1314. [DOI] [PubMed] [Google Scholar]
- 27.O’Reilly RC, Greywoode J, Morlet T, et al. Comprehensive vestibular and balance testing in the dizzy pediatric population. Otolaryngol Neck Surg 2011; 144: 142–148. [DOI] [PubMed] [Google Scholar]
- 28.Kim HA, Bisdorff A, Bronstein AM, et al. Hemodynamic orthostatic dizziness/vertigo: Diagnostic criteria. J Vestib Res 2019; 29: 45–56. [DOI] [PMC free article] [PubMed] [Google Scholar]
- 29.Yamani N, Chalmer MA and Olesen J. Migraine with brainstem aura: defining the core syndrome. Brain 2019; 142: 3868–3875. [DOI] [PubMed] [Google Scholar]
- 30.Charles A. The pathophysiology of migraine: implications for clinical management. Lancet Neurol. 2018; 17: 174–182. [DOI] [PubMed] [Google Scholar]
- 31.Burstein R, Noseda R and Borsook D. Migraine: Multiple processes, complex pathophysiology. J Neurosci 2015; 35: 6619–6629. [DOI] [PMC free article] [PubMed] [Google Scholar]
- 32.Demarquay G and Mauguiére F. Central nervous system underpinnings of sensory hypersensitivity in migraine: insights from neuroimaging and electrophysiological studies. Headache J Head Face Pain 2016; 56: 1418–1438. [DOI] [PubMed] [Google Scholar]
- 33.Demarquay G, Ducros A, Montavont A, et al. Migraine with brainstem aura: Why not a cortical origin? Cephalalgia 2018; 38: 1687–1695. [DOI] [PubMed] [Google Scholar]
- 34.Burstein R. Deconstructing migraine headache into peripheral and central sensitization. Pain 2001; 89: 107–110. [DOI] [PubMed] [Google Scholar]
- 35.Anttila V, Kallela M, Oswell G, et al. Trait components provide tools to dissect the genetic susceptibility of migraine. Am J Hum Genet 2006; 79: 85–99. [DOI] [PMC free article] [PubMed] [Google Scholar]
- 36.Szperka CL, Witzman S, Ostapenko S, et al. Patient headache questionnaires can improve diagnosis and treatment in children. Headache J Head Face Pain. 2023. In press. [DOI] [PMC free article] [PubMed] [Google Scholar]
- 37.Kellier D, Anto M, Szperka C, et al. Racial and ethnic disparities in headache management in the pediatric emergency room. 2023.
- 38.Gladstein J, Holden EW, Peralta L, et al. Diagnoses and symptom patterns in children presenting to a pediatric headache clinic. Headache J Head Face Pain 1993; 33: 497–500. [DOI] [PubMed] [Google Scholar]
- 39.Silberstein S, Loder E, Diamond S, et al. Probable migraine in the United States: Results of the American Migraine Prevalence and Prevention (AMPP) Study. Cephalalgi 2007; 27: 220–229. [DOI] [PubMed] [Google Scholar]
Associated Data
This section collects any data citations, data availability statements, or supplementary materials included in this article.