

Supplemental Digital Content is Available in the Text.
Maternal trajectories of pain catastrophizing and pain interference in the perinatal period and into the postpartum period are associated with baseline mental health and pain symptomology.
Keywords: Gestation, Maternal, Pain assessment, Pregnancy, Prenatal, Postnatal
Abstract
Introduction:
Chronic pain (pain >3 months) is a growing epidemic. Normal pregnancy may give rise to recurrent and sometimes constant pain for women. Women with worse pain symptoms are more likely to report symptoms of anxiety, depression, and/or insomnia during the perinatal period, which may impact labor and delivery outcomes. We examined the relationship between demographic and psychological predictors of pain throughout pregnancy and into the postpartum.
Objectives:
To examine trajectories of pain intensity, pain catastrophizing, and pain interference during pregnancy and the early postpartum, and associated sociodemographic predictors of trajectory membership.
Methods:
One hundred forty-two pregnant women were assessed at 4 time points for measures of pain intensity, pain catastrophizing, pain interference, and symptoms of insomnia, depression, and generalized anxiety. Women completed the first survey before 20 weeks’ gestation and were reassessed every 10 weeks. Surveys were completed on average at 15 weeks', 25 weeks', and 35 weeks' gestation, and at 6-week postpartum. Using latent class mixed models, trajectory analysis was used to determine trajectories of pain intensity, pain catastrophizing, and pain interference.
Results:
A 1-class pain intensity model, 2-class pain catastrophizing model, and 3-class pain interference model were identified. Adaptive lasso and imputation demonstrated model robustness. Individual associations with trajectories included baseline symptoms of anxiety, depression, and insomnia, and pain symptomology.
Conclusion:
These findings may help to identify women who are at high risk for experiencing pain symptoms during pregnancy and could aid in developing targeted management strategies to prevent mothers from developing chronic pain during their pregnancy and into the postpartum period.
1. Introduction
Globally, chronic pain is the leading cause of years lived with disability.23 Women are overrepresented as patients with chronic pain, with upward of 70% of patients with chronic pain identifying as women.16 Pain experienced during pregnancy presents a unique burden on expecting mothers because it is an ailment often associated with a normal pregnancy. Reports of pain prevalence during pregnancy widely vary in the literature, ranging between 30% and 85% depending on how, when, and what kind of pregnancy-related pain was assessed.9,29,45 Pain experienced during pregnancy may also persist chronically to the postpartum in up to 15% of women.22,36
Pregnancy-related pain has been associated with disruptions to activities of daily living, including but not limited to physical activity, hygiene, and work-related functioning.6,14 This can lead to feelings of dependence and inadequacy, as well as a loss of personal identity, because unmanaged pain may require women to take premature leave from work, affect their sexual relationship with their partner, and/or make it difficult to engage in self-care.6,14 Pain interference, or the extent to which pain affects an individual's activities of daily living, is thus an important consideration in understanding pain experience.2
Pain during pregnancy has been strongly associated with psychological distress, including pain catastrophizing, which is the tendency to ruminate, magnify, or feel helpless in the presence of pain.16,33,42 Women who report greater pain catastrophizing are more likely to report increased pain intensity both predelivery and postdelivery and poorer physical recovery when returning to activities of daily living.20 Women with greater pain severity are also more likely to report symptoms of anxiety, depression, and/or insomnia during the perinatal period, which may have implications for their labor and delivery.48 Pregnancy-related pain has been identified as a risk factor for longer labor, emergency caesarean section, assisted delivery, and/or increased complications during birth.7 The concurrence of anxiety, depression, insomnia, and chronic pain has been associated with preeclampsia, gestational diabetes, and preterm birth.1,46 It is thus important to identify women who may suffer from compounded risks of pain to prevent adverse perinatal outcomes.
Longitudinal studies have been conducted to describe pain experiences during pregnancy and to determine when symptoms are likely to first occur or worsen.5,14,29 Pain manifests in a broad array of bodily regions, including the truncal regions (lower back, upper back, and pelvic girdle), feet/ankle, knees, hip, wrists/hands, head, and/or neck.29,36,45 The constellation of pain, or the type, pattern, and intensity of pain, generally changes for an individual as pregnancy progresses into the postpartum.17 Overall, pain appears to progressively worsen as gestational age advances, with increases in both pain locations and severity, before comparatively decreasing in the postpartum.18 For example, pain in the lower back and pelvic girdle regions often emerges in the second and third trimesters.45 In addition, there are significant increases in reports of hand, neck, low back, hip, knee, and ankle pain during the third trimester.18 Higher numbers of pain locations endorsed by women during pregnancy have been associated with increased pain severity. However, pain experiences may change between the prenatal period and postpartum because of childbirth and alterations to daily activities (eg, breastfeeding).18,24 This change may be difficult to differentiate if the pain remains localized to the same region such as the truncal or pelvic areas.18
]The assumption from longitudinal studies is that most women experience the same pattern of change in pain symptoms over the perinatal period. However, there is evidence that sociodemographic factors (age, body mass index, and ethnicity), parity, amenorrhea, history of hypermobility, and history of pain before pregnancy are risk factors for pain development in pregnancy and postpartum.34,43,53 Owing to the variability in pain experiences, it is advantageous to identify specific subgroups of women who follow distinct pain trajectories.4,18 Identifying women who are at high risk for experiencing pain symptoms could aid in developing targeted treatment strategies related to pregnancy-related pain.
This exploratory study examined trajectories of pain intensity, pain catastrophizing, and pain interference during pregnancy and early postpartum. It was hypothesized that there would be identifiable subgroups of high and low pain trajectories, which could be associated with the mothers' symptomology at first assessment. Exploration of pain and prospective associations with pain development are needed to better characterize risk factors for persistent pain and adverse perinatal outcomes in this population.
2. Methods
2.1. Participants
On approval by the University of Calgary Health Research Ethics Board (REB17-0507), 142 pregnant women were recruited from maternity clinics in Western Canada. Participants provided informed consent and answered eligibility screening questions. Inclusion criteria included participants of singleton pregnancy, older than 17 years, and <19 weeks' gestation. Exclusion criteria included the inability to read or answer questions in English and lack of access to a computer. Participants were asked to complete 4 online surveys. A link to the first survey was emailed to participants when they were <20 weeks' gestation. Subsequent surveys were then sent to participants 10 weeks after the completion of the previous survey. All data were collected and stored in REDCap,25 a secure, online database.
2.2. Measures
2.2.1. Demographic information
Participants self-reported their age, gestational age, ethnicity, highest level of completed education, annual household income, marital status, employment status, prepregnancy height and weight, and parity.
2.2.2. Patient-Reported Outcomes Measurement Information System Pain Intensity short form (3 items)
Participants indicated the intensity of pain that they experienced in the past 7 days, with higher scores indicating a higher degree of pain intensity. This scale has previously shown high internal consistency in community samples (Cronbach alpha = 0.91) and had good internal consistency in this sample (Cronbach alpha = 0.87). A t-score of 50, with a standard deviation of 10, is representative of average pain intensity found in the general American population. Therefore, a t-score of 60 or higher is considered worse than the average. A minimally important difference between time points for nonpain samples has been found to range from 3.5 to 4.5 points.11
2.2.3. Pain Catastrophizing Scale (13 items)
Participants reported their catastrophizing in the context of actual or anticipated pain, with higher scores indicating a higher degree of pain catastrophizing. The total Pain Catastrophizing Scale (PCS) score has shown high internal consistency (Cronbach alpha = 0.87–0.93) in clinical samples.38 The scale had high internal consistency (Cronbach alpha = 0.94) in the current study sample. A total PCS score of 30 is representative of clinically relevant pain catastrophizing.51
2.2.4. Patient-Reported Outcomes Measurement Information System Pain Interference subscale short form (4 items)
Participants were asked to indicate the extent to which pain interfered with daily routines as well as social and physical activities.2 Higher scores indicate a higher degree of pain interference. The short form has comparable internal consistency to the full Patient-Reported Outcomes Measurement Information System Pain Interference (Cronbach alpha = 0.96–0.99). There was acceptable internal consistency (Cronbach alpha = 0.72) for the short form in the current sample. A t-score of 50, with a standard deviation of 10, is representative of average pain interference found in the general American population. Therefore, a t-score of above 60 is considered worse than the average. A minimally important difference between time points for nonpain samples has been found to range from 3.5 to 4.5 points.11
2.2.5. Insomnia Severity Index (7 items)
Participants indicated the severity of their insomnia symptoms within the last 2 weeks,35 with higher scores indicating greater symptom severity. The Insomnia Severity Index (ISI) has demonstrated excellent reliability in both a community sample and a clinical sample (Cronbach alpha = 0.90–0.91). For a community sample, a cut-off score of 10 was identified.35 Insomnia Severity Index internal consistency within this study sample was good (Cronbach alpha = 0.87).
2.2.6. Generalized Anxiety Disorder 7-item scale
Participants indicated the degree to which they experienced symptoms of anxiety in the previous 2 weeks. Higher scores represent a higher frequency of anxiety symptoms. The Generalized Anxiety Disorder 7-item (GAD-7) scale demonstrated excellent internal consistency (Cronbach alpha = 0.92).50 The optimal, valid clinical cut-off for a pregnant population has been found to be 13.49 There was also good internal consistency for this scale within the current sample (Cronbach alpha = 0.86).
2.2.7. Edinburgh Postnatal Depression Scale (10 items)
Participants reported on their symptoms of depressed mood in the past 7 days. Higher scores represent a greater number of depressive symptoms. Satisfactory psychometric properties were found in both postnatal and nonpostnatal samples of mothers for the Edinburgh Postnatal Depression Scale (EPDS).12 The optimal, valid clinical cut-off for a pregnant population has been found to be 13.12 Good internal consistency for the EPDS was found in the current sample (Cronbach alpha = 0.86).
2.3. Statistical analyses
2.3.1. Descriptive analysis
Descriptive analyses were conducted using SPSS version 27.0 statistical software (IBM, Armonk, NY). Continuous demographic variables were tested for normality using the Shapiro–Wilk (P < 0.05) and presented as mean (SD) or median [interquartile range]. Categorical variables were presented as frequency (percentage).
2.3.2. Trajectory analysis
Trajectory analyses were conducted using R studio version 1.0 with R statistical software version 4.1.3 (The R Project for Statistical Computing, Vienna, Austria) and SPSS version 27.0.
2.3.3. Trajectory classes and model selection
Trajectory analyses used latent class mixed modeling, which belongs to the same mixture modeling family as growth mixture modeling (GMM), (LCMM 1.7.8 package in R) to model pain intensity, pain catastrophizing, and pain interference trajectories over time and to assign participants to trajectory membership.41 For complete details, please refer to Appendix A, http://links.lww.com/PR9/A219.
2.3.4. Sample size estimation
The required sample size for GMM varies depending on numerous factors, including group differences, relative sizes of groups, and reliability of measurements; however, a minimum threshold of 100 participants has been identified.13,44 It has been demonstrated that GMM outperforms other clustering methods in identifying heterogeneity in longitudinal trajectories, even when performed on small sample sizes (<500).31
2.3.5. Factors associated with trajectory class
On final model selection and assignment of trajectory membership, characteristics of distinct trajectory groups and baseline associations of trajectory membership were determined. Baseline characteristics of each trajectory class were examined using χ2 tests for categorical variables and Mann–Whitney U tests or Kruskall–Wallis tests (≥2 trajectories). Variables were nonparametric and thus reported as median [interquartile range]. To identify critical associations of trajectory membership, univariate (2 trajectories) or multinomial (>2 trajectories) logistic models were used. Odds ratios (ORs) and 95% confidence intervals (CIs) were presented to illustrate the clinical impact of each selected variable on individual trajectories.
2.3.6. Lasso and imputation
Multivariable complete case models to predict baseline characteristics associated with trajectory membership were developed using least absolute shrinkage and selection operator (lasso) regression. Adaptive lasso was used for outcomes with 2 trajectories, whereas multinomial lasso was used for outcomes with greater than 2 trajectories (glmnet 4.1–8 package in R).21 Missing data imputation was used to complete a sensitivity analysis of the complete case logistic and multinomial multivariable models (MICE 3.16.0 package in R).8 Both complete case and imputed case models were presented using odds ratios, 95% CIs, and P values. For complete details, please refer to Appendix A, http://links.lww.com/PR9/A219.
3. Results
3.1. Sociodemographic characteristics
Sociodemographic characteristics of our recruited cohort are presented in Table 1.
Table 1.
Sociodemographic characteristics of our cohort at baseline (N = 142).
| Sociodemographic variables | |
|---|---|
| Age (y), median [IQR] | 31.0 [28.0–35.0] |
| Prepregnancy body mass index, median [IQR] | 23.2 [20.9–26.5] |
| Ethnicity | |
| Arab | 2 (1.4%) |
| Asian (East Asian, South Asian, Southeast Asian, or West Asian) | 37 (26.1%) |
| Black (African Canadian, Haitian, or Jamaican) | 2 (1.4%) |
| Hispanic or Latino | 4 (2.8%) |
| Mixed race or none of the above | 7 (4.9%) |
| White (Caucasian) | 90 (63.4%) |
| Household income | |
| <$10,000–$49,999 | 21 (14.8%) |
| $50,000–$99,999 | 36 (25.4%) |
| $100,000–$149,999 | 35 (24.6%) |
| $150,000–$199,999 | 21 (14.8%) |
| $200,000–$249,000 | 21 (14.8%) |
| $250,000< | 8 (5.6%) |
| Marital status | |
| Married/common law | 133 (93.7%) |
| Divorced/separated/single/never married | 9 (6.3%) |
| Employment | |
| Full time | 106 (74.6%) |
| Part time | 14 (9.9%) |
| Unemployed | 6 (4.2%) |
| Stay-at-home parent | 16 (11.3%) |
| Education | |
| Less than high school | 2 (1.4%) |
| High school diploma or equivalent | 10 (7.0%) |
| Postsecondary certificate or diploma | 29 (20.4%) |
| Bachelor's degree | 54 (38.0%) |
| Master's degree | 37 (26.1%) |
| Doctorate or other professional degree | 10 (7.0%) |
| Parity | |
| Primipara | 69 (48.6%) |
Continuous data presented as median [interquartile range] per finding of nonnormality (Shapiro–Wilk test, P < 0.05).
Categorical data presented as frequency (percentage).
IQR, interquartile range; N, number of participants.
3.2. Pain symptomology during pregnancy and early postpartum
The prevalence of clinically significant pain intensity as defined by a t-score above 60 was 4.7% (early-pregnancy), 16.4% (mid-pregnancy), 20.6% (late-pregnancy) and 12.9% (postpartum). The prevalence of clinically significant pain catastrophizing, as defined by a PCS score of 30 or above was 2.3% (early-pregnancy), 3.4% (mid-pregnancy), 1.9% (late-pregnancy) and 2.0% (postpartum). The prevalence of clinically significant pain interference, as defined by a t-score above 60 was 13.1% (early-pregnancy), 24.0% (mid-pregnancy), 25.2% (late-pregnancy) and 6.9% (postpartum) (Table 2).
Table 2.
Descriptive statistics of key variables.
| Variable | Time 1 | Time 2 | Time 3 | Time 4 | ||||
|---|---|---|---|---|---|---|---|---|
| N | 142 | 127 | 117 | 112 | ||||
| Gestational age (wk), median [IQR] | 15.0 [12.0–17.0] | 25.0 [23.0–27.0] | 35.0 [33.0–37.0] | — | ||||
| Median [IQR] | n (%) above clinical cut-off or general population averages | Median [IQR] | n (%) above clinical cut-off or general population averages | Median [IQR] | n (%) above clinical cut-off or general population averages | Median [IQR] | n (%) above clinical cut-off or general population averages | |
| Pain Catastrophizing Scale (PCS), total | 3.0 [0.0–9.0] | 3 (2.3%) | 3.0 [0.0–9.0] | 4 (3.5%) | 2.0 [0.0–7.0] | 2 (1.9%) | 1.0 [0.0–4.0] | 2 (2.0%) |
| Pain Interference (PROMIS), t-score | 53.9 [41.6–57.1] | 17 (13.0%) | 54.8 [49.6–61.2] | 28 (24.1%) | 54.8 [49.6–61.2] | 27 (25.2%) | 54.8 [49.6–61.2] | 7 (6.9%) |
| Pain Intensity (PROMIS), t-score | 43.5 [40.2–46.3] | 6 (4.6%) | 43.5 [40.2–47.1] | 19 (16.4%) | 44.9 [40.2–49.4] | 22 (20.6%) | 43.5 [40.2–46.3] | 13 (12.9%) |
| Insomnia (ISI), total | 7.0 [3.0–11.0] | 43 (32.8%) | 7.0 [3.8–10.3] | 37 (31.9%) | 8.0 [4.0–12.0] | 42 (39.3%) | 5.5 [2.0–9.0] | 21 (20.8%) |
| Generalized Anxiety Disorder 7-item (GAD-7) scale, total | 2.0 [1.0–4.0] | 3 (2.3%) | 2.0 [0.0–5.0] | 5 (4.3%) | 2.0 [0.0–5.0] | 7 (6.5%) | 3.0 [0.0–5.0] | 5 (5.0%) |
| Edinburgh Postnatal Depression Scale (EPDS), total | 5.0 [3.0–8.0] | 11 (8.4%) | 6.0 [2.0–9.0] | 14 (12.1%) | 5.0 [2.0–9.0] | 9 (8.4%) | 4.0 [1.0–8.0] | 7 (6.9%) |
Continuous data presented as median [interquartile range] per finding of nonnormality (Shapiro–Wilk test, P < 0.05).
Categorical data presented as frequency (percentage).
Clinical cut-offs/scores above population averages: (1) Pain Catastrophizing Scale (PCS): total score above 30. (2) Pain Interference and Pain Intensity (PROMIS): t-scores above 60. (3) Insomnia (ISI): total score above 10. (4) Generalized Anxiety Disorder (GAD-7): total score above 13. (5) Edinburgh Postnatal Depression Scale (EPDS): total score above 13.
IQR, interquartile range; N, number of participants.
3.3. Model selection
3.3.1. Pain intensity modeling
After fitting the trajectory models, the summed Akaike information criterion (AIC) and Bayesian information criterion (BIC) indicated model fit did not improve with increasing numbers of classes, such that a single trajectory best fit the data (Supplemental Table S1, http://links.lww.com/PR9/A219).
The final model consisted of a quadratic term, with a single trajectory group and random intercept, and 5 equidistant knots (Fig. 1). The single trajectory group remained stable and within population averages of pain intensity, despite an increased proportion of reported pain intensity above population averages by 11% in the second trimester and 16% in the third trimester as compared to the first trimester. As a single trajectory best modeled pain intensity in this population, no analyses of posterior probability and calculation of baseline factors, lasso, or imputation were performed.
Figure 1.
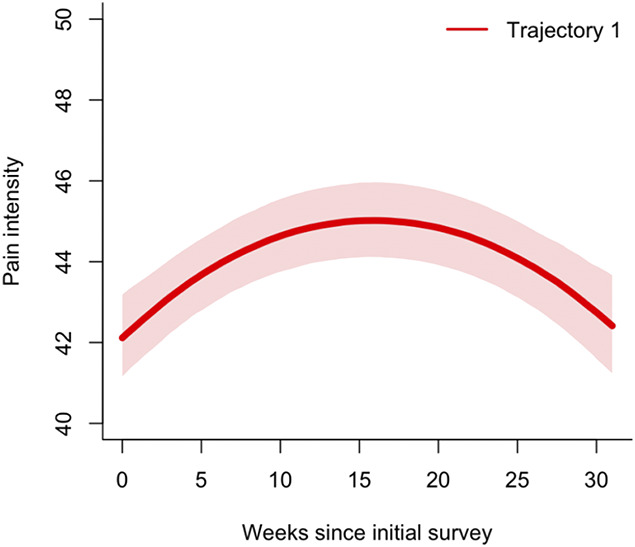
Pain intensity trajectory. Shaded areas represent 95% confidence intervals. Clinical cut-offs/scores above population averages: Pain intensity t-scores above 60.
3.3.2. Pain catastrophizing modeling
After fitting the trajectory models, the summed AIC and BIC indicated that a 2-group model best fit the data, with a near even distribution of participants between the 2 groups (Supplemental Table S2, http://links.lww.com/PR9/A219).
The final model consisted of a quadratic term, with 2 trajectory groups, random intercept, and slope, and 3 quantile knots (Fig. 2). To see plots of individual specific data points, please refer to Supplemental Figure S1, http://links.lww.com/PR9/A219. The moderate pain catastrophizing group (N = 69, 49%) entered the study with pain catastrophizing below the clinically significant range (PCS total score <30), which remained stable before declining postpartum. The no pain catastrophizing group (N = 71, 51%) entered the study with a median PCS score of 0. The convergence of 95% CIs is indicative of decreasing pain catastrophizing and a reduction in differences between trajectory groups postpartum. The average posterior probabilities for the individual groups were 0.93 for the moderate pain catastrophizing group and 0.91 for the no pain catastrophizing group, which exceed the recommended acceptable posterior probability of 0.70.
Figure 2.
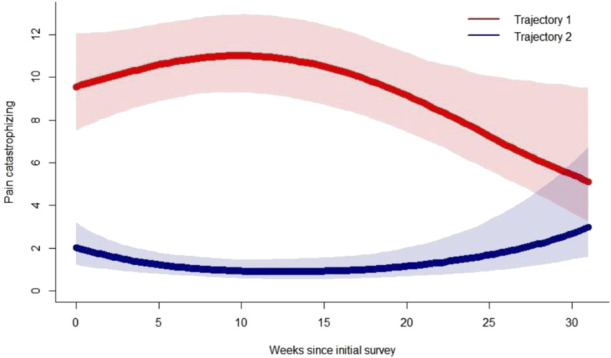
Pain catastrophizing trajectories. Trajectory 1 (red) represents the moderate pain catastrophizing group. Trajectory 2 (blue) represents the no pain catastrophizing group. Shaded areas represent the 95% confidence intervals. Clinical cut-offs/scores above population averages: Pain Catastrophizing (PCS) total score above 30.
3.3.3. Pain catastrophizing trajectory characteristics
Baseline characteristics of patients by pain catastrophizing trajectory are provided in Table 3. Income and baseline measures of pain catastrophizing, pain interference, pain intensity, anxiety, and depression were significantly different between trajectory groups.
Table 3.
Pain catastrophizing trajectory characteristics.
| Trajectory 1 Moderate pain catastrophizing (N = 69, 49%) |
Trajectory 2 No pain catastrophizing (N = 71, 51%) |
P | |
|---|---|---|---|
| Age (y) | 31.0 [28.0–33.5] | 31.0 [29.0–35.0] | 0.407* |
| Body mass index (kg/m2) | 23.2 [20.1–27.3] | 23.5 [21.4–26.5] | 0.656* |
| Ethnicity | 0.087† | ||
| Caucasian | 39 (57) | 50 (70) | |
| Other | 30 (43) | 21 (30) | |
| Income | 11.0 [8.0–16.0] | 14.0 [9.0–21.0] | 0.041*‡ |
| Education | 0.195† | ||
| High School or less | 7 (10) | 4 (6) | |
| Postsecondary | 44 (64) | 39 (55) | |
| Master's/Doctorate | 18 (26) | 38 (39) | |
| Number of children | 0.0 [0.0–1.0] | 0.0 [0.0–1.0] | 0.291* |
| Baseline pain catastrophizing | 6.0 [3.0–14.0] | 0.0 [0.0–4.0] | <0.001*‡ |
| Baseline postnatal depression score | 7.0 [5.0–11.0] | 4.0 [2.0–6.0] | <0.001*‡ |
| Baseline pain interference score | 55.6 [52.5–60.9] | 49.6 [41.6–55.6] | <0.001*‡ |
| Baseline pain intensity score | 43.5 [40.2–46.3] | 40.2 [40.2–43.5] | <0.001*‡ |
| Baseline anxiety score | 3.0 [1.0–5.80] | 1.5 [0.0–3.0] | <0.001*‡ |
| Baseline Insomnia Severity Index | 9.0 [4.0–13.0] | 6.0 [2.0–8.0] | 0.001*‡ |
Pain catastrophizing at baseline and across all time points was missing for 2 participants; thus, N = 140 for pain catastrophizing trajectory analysis.
Continuous data presented as median [interquartile range] per finding of nonnormality (Shapiro–Wilk test, P < 0.05), based on Mann–Whitney U.
Categorical data presented as frequency (percentage), based on χ2 tests.
Statistical significance (P < 0.05).
N, number of participants.
3.3.4. Associations of pain catastrophizing trajectory membership
Significant individual associations of trajectory membership included symptoms of anxiety and depression, insomnia, pain interference, and pain intensity (Table 4). Relative to the no pain catastrophizing group, higher anxiety and depressive symptoms at first assessment were associated with increased odds of belonging to the moderate pain catastrophizing group (OR = 1.44 [1.21–1.71], OR = 1.25 [1.13–1.39], respectively, P < 0.001). Having insomnia was also related to higher odds of belonging to the moderate pain catastrophizing group (OR = 1.12 [1.04–1.20], P = 0.003). Finally, relative to the no pain catastrophizing group, higher reports of pain interference and pain intensity at first assessment increased the odds of belonging to the moderate pain catastrophizing group (OR = 1.12 [1.06–1.17], OR = 1.15 [1.07–1.24], respectively, P < 0.001). Table 5 provides the complete odds ratios and P values.
Table 4.
Associations with pain catastrophizing trajectory membership.
| Trajectory 1 (in reference trajectory 2) Odds ratio (95% confidence interval) |
P | |
|---|---|---|
| Age (y) | 0.96 (0.89–1.04) | 0.296 |
| Body mass index (kg/m2) | 1.00 (0.94–1.06) | 0.919 |
| Ethnicity | ||
| Caucasian | Reference | Reference |
| Other | 1.83 (0.91–3.68) | 0.089 |
| Income | 0.95 (0.90–1.00) | 0.029* |
| Education | ||
| High School or less | 1.55 (0.42–5.70) | 0.509 |
| Postsecondary | Reference | Reference |
| Master's/Doctorate | 0.57 (0.27–1.19) | 0.132 |
| No. of children | 0.74 (0.45–1.22) | 0.240 |
| Baseline pain catastrophizing score | 1.27 (1.16–1.41) | <0.001* |
| Baseline postnatal depression score | 1.25 (1.13–1.39) | <0.001* |
| Baseline pain interference score | 1.12 (1.06–1.17) | <0.001* |
| Baseline pain intensity score | 1.15 (1.07–1.24) | <0.001* |
| Baseline anxiety score | 1.44 (1.21–1.71) | <0.001* |
| Baseline Insomnia Severity Index | 1.12 (1.04–1.20) | 0.003* |
Trajectory 1 = moderate pain catastrophizing group.
Trajectory 2 = no pain catastrophizing group.
Statistical significance (P < 0.05).
Table 5.
Associations between baseline characteristics and pain catastrophizing trajectory group.
| *Complete case (N = 129) | Imputed case (N = 142) | |||
|---|---|---|---|---|
| Estimate (95% CI) | P | Estimate (95% CI) | P | |
| Intercept | 7.45 × 10⁻³ (5.84 × 10⁻⁴ to 6.63 × 10⁻²) | <0.001† | 1.01 × 10⁻² (1.20 × 10⁻³ to 8.57 × 10⁻²) | <0.001† |
| Ethnicity | 2.01 (0.72–5.88) | 0.188 | 1.63 (0.62–4.30) | 0.319 |
| Number of children | 0.71 (0.33–1.42) | 0.349 | 0.79 (0.42–1.49) | 0.466 |
| Baseline pain intensity | 1.70 (1.21–2.48) | <0.001† | 1.61 (1.16–2.23) | 0.005† |
| Baseline anxiety | 1.35 (1.10–1.74) | <0.001† | 1.36 (1.10–1.68) | 0.005† |
| Baseline pain catastrophizing | 1.20 (1.08–1.36) | <0.001† | 1.22 (1.09–1.36) | <0.001† |
| Model summary | AUC (95% CI): 0.85 (0.77–0.91) | AUC (95% CI): 0.86 (0.78–0.91) | ||
Independent factors to adjust for associations between trajectory groups were selected using least absolute shrinkage and selection operator (LASSO) regression. Trajectory group 2 (the no pain catastrophizing group) was the reference group. Non-zero coefficients as found by LASSO regression were subsequently transferred to a multivariable logistic regression.
Complete cases represent those with available data for all listed model variables.
Statistical significance (P < 0.05).
AUC, area under the curve; CI, confidence interval; N, number of participants.
3.3.5. Pain catastrophizing lasso and imputation
Non-zero coefficients of pain catastrophizing trajectory groups included ethnicity, number of children, baseline pain intensity, anxiety, and pain catastrophizing. To assess whether trajectory groups could accurately discriminate women with no and moderate pain catastrophizing, model sensitivity and specificity were calculated as 74.6 and 85.5, respectively. The area under the receiver operating characteristic (ROC) curve was 0.848 (CI: 0.772–0.910). Results of multivariable logistic regression after imputation are presented in Table 5.
3.3.6. Pain interference modeling
After fitting the trajectory models, the summed AIC and BIC indicated that a 3-group model best fit the data (see Supplemental Table S3, http://links.lww.com/PR9/A219).
The final model consisted of a quadratic term, with 3 trajectory groups, random intercept, and slope, and 5 equidistant knots (Fig. 3). To see plots of individual specific data points, please refer to Supplemental Figure S2, http://links.lww.com/PR9/A219. The moderate pain interference group (N = 68, 48%) consistently reported pain interference within population averages. The no pain interference group (N = 31, 22%) entered the study with scores below the population average, which were consistently maintained into the postpartum assessment. The high pain interference group (N = 43, 30%) entered the study with scores within population average, which then increased above population averages (Patient-Reported Outcomes Measurement Information System Pain Interference score >60) in the second and third trimester, and were consistently maintained into the postpartum assessment. The average posterior probabilities for the individual groups were 0.93 for the moderate pain interference group, 0.95 for the no pain interference group, and 0.93 for the high pain interference group, which exceed the recommended acceptable posterior probability of 0.70.
Figure 3.
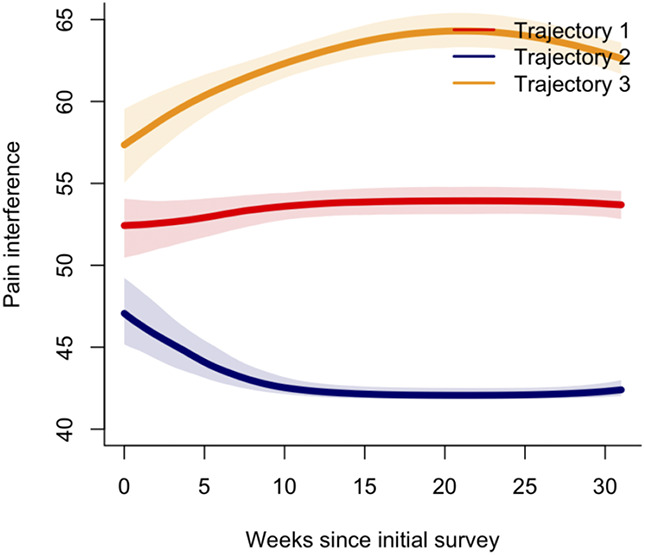
Pain interference trajectories. Trajectory 1 (red) represents the moderate pain interference group. Trajectory 2 (blue) represents the no pain interference group. Trajectory 3 (yellow) represents the high pain interference group. Shaded areas represent the 95% confidence intervals. Clinical cut-offs/scores above population averages: Pain interference (PROMIS) t-scores above 60.
3.3.7. Pain interference trajectory characteristics
Baseline characteristics of participants by pain interference trajectory are given in Table 6. Ethnicity, baseline pain catastrophizing, anxiety, pain intensity, depression, pain interference, and insomnia differed between the trajectory groups.
Table 6.
Pain interference trajectory characteristics.
| Trajectory 1 Moderate pain interference group (N = 68, 48%) |
Trajectory 2 No pain interference group (N = 31, 22%) |
Trajectory 3 High pain interference group (N = 43, 30%) |
P | |
|---|---|---|---|---|
| Age (y) | 30.0 [28.0–35.0] | 32.0 [29.5–35.0] | 31.0 [28.5–34.0] | 0.411* |
| Body mass index (kg/m2) | 23.4 [21.9–26.8] | 23.7 [21.4–26.5] | 22.7 [19.8–26.3] | 0.328* |
| Ethnicity | 0.021†‡§‖ | |||
| Caucasian | 51 (75) | 17 (55) | 22 (51) | |
| Other | 17 (25) | 14 (45) | 21 (49) | |
| Income | 12.0 [8.0–20.0] | 14.0 [10.0–20.5] | 11.0 [8.0–14.0] | 0.293* |
| Education | 0.807‡ | |||
| High school or less | 6 (9) | 1 (3) | 5 (12) | |
| Postsecondary | 42 (61) | 20 (65) | 21 (49) | |
| Master's/Doctorate | 20 (29) | 10 (32) | 17 (39) | |
| No. of children | 0.0 [0.0–1.0] | 1.0 [0.0–1.0] | 0.0 [0.0–1.0] | 0.123* |
| Baseline pain catastrophizing | 3.0 [0.0–8.0] | 0.0 [0.0–4.0] | 5.0 [2.0–12.0] | <0.001†*§# |
| Baseline postnatal depression score | 6.0 [3.0–8.0] | 3.0 [1.0–5.0] | 7.0 [5.0–11.0] | <0.001†*§‖# |
| Baseline pain interference score | 53.9 [49.6–55.6] | 41.6 [41.6–54.8] | 58.8 [53.9–62.5] | <0.001†*§‖# |
| Baseline pain intensity score | 43.5 [40.2–46.3] | 40.2 [30.7–43.5] | 43.5 [40.2–47.1] | 0.002†*# |
| Baseline anxiety score | 2.0 [1.0–4.0] | 1.0 [0.0–3.0] | 3.0 [1.0–6.0] | 0.005†*§# |
| Baseline Insomnia Severity Index | 7.0 [4.0–9.5] | 4.0 [1.0–6.0] | 10.0 [4.50–14.0] | <0.001†*§‖# |
Continuous data presented as median [interquartile range] per finding of nonnormality (Shapiro–Wilk test, P < 0.05), based on Kruskal–Wallis.
Statistical significance (P < 0.05).
Categorical data presented as frequency (percentage), based on χ2 tests.
Significantly different between trajectory 1 and 2 by the Mann–Whitney U Test (P < 0.05).
Significantly different between trajectory 1 and 3 by the Mann–Whitney U Test (P < 0.05).
Significantly different between trajectory 2 and 3 by the Mann–Whitney U Test (P < 0.05).
N, number of participants.
3.3.8. Associations of pain interference trajectory membership
Significant associations with the no pain interference trajectory membership include ethnicity, baseline pain catastrophizing, depression, pain interference, pain intensity, anxiety, and insomnia. The odds of following the no pain interference trajectory group were decreased for participants with ethnicities other than Caucasian (OR = 0.405 [0.165–0.99], P = 0.048) and were increased for women with multiple children (OR = 1.86 [1.02–3.38], P = 0.044). The odds of following the no pain interference trajectory group additionally decreased for every unit increase in baseline pain catastrophizing (OR = 0.875 [0.783–0.977], P = 0.018), depressive symptoms (OR = 0.752 [0.635–0.891], P < 0.001), pain interference (OR = 0.878 [0.820–0.939], P < 0.001), pain intensity (OR = 0.911 [0.839–0.989], P = 0.026), anxiety (OR = 0.763 [0.602–0.966], P < 0.025), and insomnia (OR = 0.861 [0.767–0.967], P < 0.011). Relative to the moderate pain interference group, higher pain catastrophizing (OR = 1.06 [1.003–1.11], P = 0.037), depressive symptoms (OR = 1.12 [1.03–1.22], P = 0.010), pain interference (OR = 1.10 [1.04–1.17], P = 0.002), pain intensity (OR = 1.13 [1.03–1.23], P = 0.010), and insomnia (OR = 1.09 [1.01–1.18], P = 0.034) at first assessment were associated with increased odds of belonging to the high pain interference group. Refer to Table 7 for complete odds ratios and P values.
Table 7.
Associations with pain interference trajectory membership.
| Trajectory 2 (reference Trajectory 1) Odds ratio (95% confidence interval) |
P | Trajectory 3 (reference Trajectory 1) Odds ratio (95% confidence interval) |
P | |
|---|---|---|---|---|
| Age (y) | 1.04 (0.99–1.19) | 0.099 | 1.01 (0.93–1.11) | 0.769 |
| Body mass index (kg/m2) | 1.01 (0.93–1.09) | 0.830 | 0.96 (0.88–1.04) | 0.278 |
| Ethnicity | ||||
| Caucasian | Reference | Reference | Reference | Reference |
| Other | 0.41 (0.17–0.99) | 0.048* | 0.35 (0.16–0.79) | 0.011* |
| Income | 1.01 (0.95–1.07) | 0.747 | 0.96 (0.91–1.01) | 0.141 |
| Education | ||||
| High school or less | 1.38 (0.48–3.92) | 0.551 | 1.15 (0.44–3.02) | 0.771 |
| Postsecondary | Reference | Reference | Reference | Reference |
| Master's/Doctorate | 1.00 (0.36–2.75) | 1.000 | 0.68 (0.27–1.68) | 0.402 |
| No. of children | 1.86 (1.02–3.38) | 0.044* | 1.07 (0.59–1.94) | 0.837 |
| Baseline pain catastrophizing score | 0.88 (0.78–0.98) | 0.018* | 1.06 (1.00–1.11) | 0.037* |
| Baseline postnatal depression score | 0.75 (0.64–0.89) | <0.001* | 1.12 (1.03–1.22) | 0.010* |
| Baseline pain interference score | 0.88 (0.82–0.94) | <0.001* | 1.10 (1.04–1.17) | 0.002* |
| Baseline pain intensity score | 0.91 (0.84–0.99) | 0.026* | 1.13 (1.03–1.23) | 0.010* |
| Baseline anxiety score | 0.76 (0.60–0.97) | 0.025* | 1.07 (0.95–1.19) | 0.277 |
| Baseline Insomnia Severity Index | 0.86 (0.77–0.97) | 0.011* | 1.09 (1.01–1.18) | 0.034* |
Trajectory 1 = moderate pain interference group.
Trajectory 2 = no pain interference group.
Trajectory 3 = high pain interference group.
Statistical significance (P < 0.05).
3.3.9. Pain interference lasso and imputation
Non-zero coefficients of pain interference trajectory groups included baseline depression, pain interference, and pain intensity. The area under the ROC curve for trajectory 2 was 0.799 (0.705–0.881), and the area under the ROC curve for trajectory 3 was 0.760 (0.658–0.834). Results of multinomial regression after imputation are presented in Table 8.
Table 8.
Associations between baseline characteristics and pain interference trajectory group.
| Trajectory 2 | Trajectory 3 | |||||||
|---|---|---|---|---|---|---|---|---|
| *Complete case (N = 129) | Imputed case (N = 142) | *Complete case (N = 129) | Imputed case (N = 142) | |||||
| Estimate (95% CI) | P | Estimate (95% CI) | P | Estimate (95% CI) | P | Estimate (95% CI) | P | |
| Intercept | 1.41 × 10² (1.68–1.19 × 10⁴) | 0.029† | 3.12 ×10² (4.54–2.14 × 10⁴) | 0.008† | 2.03 ×10⁻⁴ (1.06 × 10⁻⁶ to 3.88 × 10⁻²) | 0.002† | 6.58 ×10⁻⁴ (7.23 × 10⁻⁶ to 5.98 × 10⁻²) | 0.002† |
| Baseline pain intensity | 0.96 (0.87–1.06) | 0.440 | 0.98 (0.89–1.08) | 0.686 | 1.10 (0.98–1.24) | 0.097 | 1.05 (0.96–1.17) | 0.247 |
| Baseline depression | 0.81 (0.68–0.97) | 0.024† | 0.78 (0.66–0.93) | 0.007† | 1.05 (0.95–1.16) | 0.328 | 1.08 (0.99–1.18) | 0.094 |
| Baseline pain interference | 0.94 (0.87–1.01) | 0.097 | 0.91 (0.84–0.98) | 0.015† | 1.06 (0.99–1.15) | 0.115 | 1.07 (1.00–1.15) | 0.045 |
| Model summary | AUC (95% CI): 0.80 (0.71–0.88) | AUC (95% CI): 0.84 (0.74–0.90) | AUC (95% CI): 0.76 (0.66–0.83) | AUC (95% CI): 0.78 (0.68–0.85) | ||||
Trajectory 1 = moderate pain interference group.
Trajectory 2 = no pain interference group.
Trajectory 3 = high pain interference group.
Complete case: AUC of trajectory 1 compared with trajectory 2 and 3: 0.61 (0.51–0.71).
Imputed case: AUC of trajectory 1 compared with trajectory 2 and 3: 0.49 (0.38–0.60).
Independent predictors to adjust for associations between trajectory groups were selected using least absolute shrinkage and selection operator (LASSO) regression. Trajectory group 1 was the reference group. Non-zero coefficients as found by LASSO regression were subsequently transferred to a multivariable multinomial logistic regression model.
Complete cases represent those with available data for all listed model variables.
Statistical significance (P < 0.05).
AUC, area under the curve; CI, confidence interval; N, number of participants.
4. Discussion
These exploratory analyses identified distinct trajectories of pain catastrophizing and pain interference from early pregnancy to postpartum. Two trajectories of pain catastrophizing emerged, and 3 trajectories of pain interference were identified. Overall, reports of pain intensity, pain catastrophizing, and pain interference remained subclinical for a large proportion of participants. This suggests that the propensity for pain to interfere with everyday functioning is relatively low in this population. The subset of individuals reporting higher pain symptomology at initial assessment were more likely to report an increase across all pain measures during the third trimester.
Pain intensity is a highly used pain metric in clinical care and research settings.19,27 However, there were no discernible heterogeneous trajectories across pregnancy and into the postpartum, indicating that the pain intensity experience of women was relatively homogeneous across our sample. Clinically significant reports of pain intensity were greatest in the third trimester, with 20.6% of our sample scoring above clinical cutoffs. However, assigning objective value to the subjective pain experience is challenging. This is particularly true when trying to assign a clinical value to single-item pain scales.26 Single-item pain measures are inadequate in describing pain experience, which may explain the homogeneity in reported pain intensity across our sample. Multiple facets of the pain experience should be used to evaluate pain symptomology more holistically.
Pain catastrophizing represents the extent that individuals ruminate, magnify, and feel helpless in response to pain. In pregnant populations, pain catastrophizing has been associated with fear of birth, increased incidence of depression and anxiety, poorer physical ability, and poorer postpartum recovery.16,20,37,47 Although pain catastrophizing symptoms remained low for a substantial proportion of women throughout pregnancy, women with greater pain interference, pain intensity, anxiety, depression, and insomnia at baseline were more likely to belong to the moderate pain catastrophizing trajectory group. Therefore, the moderate pain catastrophizing group may be at increased risk for concurrent internalizing mental health conditions and pain symptomology. Individuals in the moderate pain catastrophizing group may benefit from symptom monitoring and anticipatory interventions to manage pain catastrophizing symptoms. Identification of pregnant women at risk for pain catastrophizing and the timely introduction of pain interventions may improve postpartum recovery outcomes.
Pain interference refers to the extent that pain disrupts daily routines, social, and physical activities.28 Reports of pain interference in pregnancy have been associated with poorer work functioning and difficulty in both physical and daily activities.6,14 Exploration of pain interference in pregnant samples has been limited; however, previous literature has indicated that pregnant women with higher reports of pain interference are more likely to report greater pain intensity and pain catastrophizing.10 In the present study, women experiencing higher pain catastrophizing, pain intensity, depressive symptoms, anxiety symptoms, and insomnia were more likely to belong to the moderate or high pain interference trajectory group, as compared to the no pain interference trajectory group. Close to half of all participants belonged to the moderate pain interference group. Moreover, 30 percent of women belonged to the high pain interference group, reporting clinically significant pain interference in the second and third trimesters. Women in both the moderate and high pain interference groups may be at risk for disruptions to activities of daily living and could perhaps benefit from symptom monitoring and anticipatory treatment to reduce negative consequences of pain interference. Early identification of pregnant women at risk for developing clinically significant pain interference could allow for the introduction of appropriate pain coping strategies, which may reduce the burden of pain-related disability and improve their quality of life.
This study demonstrated heterogeneous groups of pain catastrophizing and pain interference, and associations with internalizing mental health indices during a critical time of infant development, which may have implications for both mothers and their children. Increased pain incidence during pregnancy has been associated with a reduction in quality of life, greater report of internalizing mental health conditions, and adverse labor and delivery outcomes.7,18,48 Clinical findings of both prenatal and postnatal stress and maternal somatic complaints have been associated with increased child somatization at 18 months.54 Similarly, increased maternal stress hormone levels during pregnancy have been associated with worse behavioral stress recovery and larger cortisol responses to a painful procedure in infants aged 2 years.15 Therefore, maternal prenatal stress may increase the risk of development of comorbid somatization and internalizing problems in infants.
There are several limitations to this exploratory work. Although the sample size reached the minimum threshold for GMM, and is comparable to other studies using GMM, we recognize that this sample size is on the lower end of what is acceptable for this analysis.39,44 Although this study generated meaningful results to inform future work, conclusions drawn from our findings must be interpreted with caution. A larger sample size may improve discriminatory capacity of our models to detect differences in pain experience.
This work was a secondary analysis of prenatal and postpartum data48 and would have benefited from additional measures to characterize pain. For example, pain history is an important consideration, given that a previous history of chronic pain is a known risk factor for the development of pain during pregnancy.34 Recording pain locations is important to discern whether a new pain problem has emerged or whether the reported pain is persistent. There is limited work exploring changes in the pain type during pregnancy vs the postpartum period, which is an important direction for future research. We also do not have information on pain medication use or pain treatment during the prenatal and postpartum period. The use of several commonly prescribed pain medications during pregnancy has been proven to be safe and effective3 and could potentially alter pain experience. Therefore, pain medication use during pregnancy is an important consideration for future work characterizing pain during pregnancy. In addition, excessive weight gain during pregnancy has been linked to enhanced stress on the musculoskeletal system32 and has been associated with persistent pain in the postpartum.52 Therefore, weight gain during pregnancy should be considered.
The participants in our study were predominantly White and of higher socioeconomic status (SES). Lower and moderate SES groups are at higher risk for chronic pain development, and pregnant lower SES women specifically are at higher risk of adverse pregnancy outcomes.30,40 Replication of the present study in more diverse samples is an important future research consideration. Furthermore, as all women in this study were considered low-risk pregnancies, future work in high-risk pregnancies and pregnant women with comorbidities or clinically diagnosed internalizing mental health conditions should be studied to ensure the generalizability of the findings from this work.
In summary, we demonstrated heterogeneity in pain catastrophizing and pain interference symptomology from pregnancy into the postpartum. Although a small subset of women experienced clinically significant pain catastrophizing, a larger identifiable group of women experienced clinically significant pain interference. These findings highlight the prevalence of pain throughout pregnancy and reinforce the need for regular pain assessment and management, as a part of pregnancy and postnatal care.
Disclosures
The authors have no conflict of interest to declare.
Supplementary Material
Acknowledgements
This study was supported by the Alberta Children's Hospital Research Foundation, the Alberta Children's Hospital Research Institute, and the Canada Research Chair program awarded to L.T.-M. Support from the Canadian Institute of Health Research Canada Graduate Scholarship-master's and the Alberta Graduate Excellence Scholarship was awarded to J.J.
Data availability: Deidentified data that support the findings of this study are available from the corresponding author on reasonable request.
Supplemental digital content
Supplemental digital content associated with this article can be found online at http://links.lww.com/PR9/A219.
Footnotes
Sponsorships or competing interests that may be relevant to content are disclosed at the end of this article.
Supplemental digital content is available for this article. Direct URL citations appear in the printed text and are provided in the HTML and PDF versions of this article on the journal's Web site (www.painrpts.com).
Contributor Information
Jenna Jessa, Email: jenna.jessa@ucalgary.ca.
Lianne Tomfohr-Madsen, Email: lianne.tomfohrmadsen@ubc.ca.
Ashley Dhillon, Email: ash.dhillon@mail.utoronto.ca.
Andrew Walker, Email: andrew.walker@ahs.ca.
Melanie Noel, Email: melanie.noel@ucalgary.ca.
Ivan Sedov, Email: ivan.sedov@ahs.ca.
References
- [1].Alföldi P, Wiklund T, Gerdle B. Comorbid insomnia in patients with chronic pain: a study based on the Swedish quality registry for pain rehabilitation (SQRP). Disabil Rehabil 2014;36:1661–9. [DOI] [PubMed] [Google Scholar]
- [2].Amtmann D, Cook KF, Jensen MP, Chen W-H, Choi S, Revicki D, Cella D, Rothrock N, Keefe F, Callahan L, Lai J-S. Development of a PROMIS item bank to measure pain interference. PAIN 2010;150:173–82. [DOI] [PMC free article] [PubMed] [Google Scholar]
- [3].Babb M, Koren G, Einarson A. Treating pain during pregnancy. Can Fam Physician 2010;56:25–7. [PMC free article] [PubMed] [Google Scholar]
- [4].Bai G, Raat H, Jaddoe VWV, Mautner E, Korfage IJ. Trajectories and predictors of women's health-related quality of life during pregnancy: a large longitudinal cohort study. PLoS One 2018;13:e0194999. [DOI] [PMC free article] [PubMed] [Google Scholar]
- [5].Berg G, Hammar M, Möller-Nielsen J, Lindén U, Thorblad J. Low back pain during pregnancy. Obstet Gynecol 1988;71:71–5. [PubMed] [Google Scholar]
- [6].Bergström C, Persson M, Mogren I. Psychosocial and behavioural characteristics in women with pregnancy-related lumbopelvic pain 12 years postpartum. Chiropr Man Therap 2019;27:34. [DOI] [PMC free article] [PubMed] [Google Scholar]
- [7].Brown A, Johnston R. Maternal experience of musculoskeletal pain during pregnancy and birth outcomes: significance of lower back and pelvic pain. Midwifery 2013;29:1346–51. [DOI] [PubMed] [Google Scholar]
- [8].Buuren S, Groothuis-Oudshoorn K. MICE: multivariate imputation by chained equations in R. J Stat Softw 2011;45:1–67. [Google Scholar]
- [9].Carvalho MECC, Lima LC, Terceiro CAdL, Pinto DRL, Silva MN, Cozer GA, Couceiro TCdM. Low back pain during pregnancy. Braz J Anesthesiol 2017;67:266–70. [DOI] [PubMed] [Google Scholar]
- [10].Chang H-Y, Jensen MP, Yang Y-L, Lee C-N, Lai Y-H. Risk factors of pregnancy-related lumbopelvic pain: a biopsychosocial approach. J Clin Nurs 2012;21:1274–83. [DOI] [PubMed] [Google Scholar]
- [11].Chen CX, Kroenke K, Stump TE, Kean J, Carpenter JS, Krebs EE, Bair MJ, Damush TM, Monahan PO. Estimating minimally important differences for the PROMIS pain interference scales: results from 3 randomized clinical trials. PAIN 2018;159:775–82. [DOI] [PMC free article] [PubMed] [Google Scholar]
- [12].Cox JL, Holden JM, Sagovsky R. Detection of postnatal depression. Development of the 10-item Edinburgh postnatal depression scale. Br J Psychiatry 1987;150:782–6. [DOI] [PubMed] [Google Scholar]
- [13].Curran PJ, Obeidat K, Losardo D. Twelve frequently asked questions about growth curve modeling. J Cogn Dev 2010;11:121–36. [DOI] [PMC free article] [PubMed] [Google Scholar]
- [14].Dantas THM, Dantas DS, Correia GN, Viana ESR, Pereira ARR, Magalhães AG. Disability and functioning of women with low-risk pregnancy: assessment using the world health organization disability assessment schedule 2.0 (WHODAS 2.0). Int J Gynaecol Obstet 2020;148:53–8. [DOI] [PubMed] [Google Scholar]
- [15].Davis EP, Glynn LM, Waffarn F, Sandman CA. Prenatal maternal stress programs infant stress regulation. J Child Psychol Psychiatry 2011;52:119–29. [DOI] [PMC free article] [PubMed] [Google Scholar]
- [16].Doğru HY, Özsoy F, Doğru S, Karaman T, Şahin A, Özsoy AZ, Çakmak B, Süren M. Catastrophizing, depression and anxiety during pregnancy: relation between lumbopelvic pain and physical/social functioning. J Rational Emotive Cognit Behav Ther 2018;36:119–36. [Google Scholar]
- [17].Drabble SJ, Long J, Alele B, O'Cathain A. Constellations of pain: a qualitative study of the complexity of women's endometriosis-related pain. Br J Pain 2021;15:345–56. [DOI] [PMC free article] [PubMed] [Google Scholar]
- [18].Dunn G, Egger MJ, Shaw JM, Yang J, Bardsley T, Powers E, Nygaard IE. Trajectories of lower back, upper back, and pelvic girdle pain during pregnancy and early postpartum in primiparous women. Womens Health (London, England) 2019;15:1–8. [DOI] [PMC free article] [PubMed] [Google Scholar]
- [19].Farrar JT, Young JPJ, LaMoreaux L, Werth JL, Poole MR. Clinical importance of changes in chronic pain intensity measured on an 11-point numerical pain rating scale. PAIN 2001;94:149–58. [DOI] [PubMed] [Google Scholar]
- [20].Flink IK, Mroczek MZ, Sullivan MJL, Linton SJ. Pain in childbirth and postpartum recovery: the role of catastrophizing. Eur J Pain (London, England) 2009;13:312–6. [DOI] [PubMed] [Google Scholar]
- [21].Friedman J, Tibshirani R, Hastie T. Regularization paths for generalized linear models via coordinate descent. J Stat Softw 2010;33:1–22. [PMC free article] [PubMed] [Google Scholar]
- [22].Gausel AM, Kjærmann I, Malmqvist S, Dalen I, Larsen JP, Økland I. Pelvic girdle pain 3-6 months after delivery in an unselected cohort of Norwegian women. Eur Spine J 2016;25:1953–9. [DOI] [PubMed] [Google Scholar]
- [23].Global, regional, and national disability-adjusted life-years (DALYs) for 333 diseases and injuries and healthy life expectancy (HALE) for 195 countries and territories, 1990–2016: a systematic analysis for the Global Burden of Disease Study 2016. Lancet 2017;390:1260–344. [DOI] [PMC free article] [PubMed] [Google Scholar]
- [24].Glowacka M, Rosen N, Chorney J, Snelgrove Clarke E, George RB. Prevalence and predictors of genito-pelvic pain in pregnancy and postpartum: the prospective impact of fear avoidance. J Sex Med 2014;11:3021–34. [DOI] [PubMed] [Google Scholar]
- [25].Harris PA, Taylor R, Thielke R, Payne J, Gonzalez N, Conde JG. Research electronic data capture (REDCap)—a metadata-driven methodology and workflow process for providing translational research informatics support. J Biomed Inform 2009;42:377–81. [DOI] [PMC free article] [PubMed] [Google Scholar]
- [26].Hodgins MJ. Interpreting the meaning of pain severity scores. Pain Res Manag 2002;7:192–8. [DOI] [PubMed] [Google Scholar]
- [27].Jensen MP, Karoly P, Braver S. The measurement of clinical pain intensity: a comparison of six methods. PAIN 1986;27:117–26. [DOI] [PubMed] [Google Scholar]
- [28].Karayannis NV, Sturgeon JA, Chih-Kao M, Cooley C, Mackey SC. Pain interference and physical function demonstrate poor longitudinal association in people living with pain: a PROMIS investigation. PAIN 2017;158:1063–8. [DOI] [PMC free article] [PubMed] [Google Scholar]
- [29].Kesikburun S, Güzelküçük Ü, Fidan U, Demir Y, Ergün A, Tan AK. Musculoskeletal pain and symptoms in pregnancy: a descriptive study. Ther Adv Musculoskelet Dis 2018;10:229–34. [DOI] [PMC free article] [PubMed] [Google Scholar]
- [30].Kim MK, Lee SM, Bae S-H, Kim HJ, Lim NG, Yoon S-J, Lee JY, Jo M-W. Socioeconomic status can affect pregnancy outcomes and complications, even with a universal healthcare system. Int J Equity Health 2018;17:2. [DOI] [PMC free article] [PubMed] [Google Scholar]
- [31].Martin DP, von Oertzen T. Growth mixture models outperform simpler clustering algorithms when detecting longitudinal heterogeneity, even with small sample sizes. Struct Equat Model A Multidisciplinary J 2015;22:264–75. [Google Scholar]
- [32].Matsuda N, Kitagaki K, Perrein E, Tsuboi Y, Ebina A, Kondo Y, Murata S, Isa T, Okumura M, Kawaharada R, Horibe K, Ono R. Association between excessive weight gain during pregnancy and persistent low back and pelvic pain after delivery. Spine 2020;45:319–24. [DOI] [PubMed] [Google Scholar]
- [33].Miller AM, Judd F, Dargaville PA, Neil AL. Psychological distress and self-rated health status in reproductive aged women with pain: findings from a national, cross-sectional survey. BMC Womens Health 2019;19:62. [DOI] [PMC free article] [PubMed] [Google Scholar]
- [34].Mogren IM. BMI, pain and hyper-mobility are determinants of long-term outcome for women with low back pain and pelvic pain during pregnancy. Eur Spine J 2006;15:1093–102. [DOI] [PMC free article] [PubMed] [Google Scholar]
- [35].Morin CM, Belleville G, Bélanger L, Ivers H. The Insomnia Severity Index: psychometric indicators to detect insomnia cases and evaluate treatment response. Sleep 2011;34:601–8. [DOI] [PMC free article] [PubMed] [Google Scholar]
- [36].Munro A, George RB, Chorney J, Snelgrove-Clarke E, Rosen NO. Prevalence and predictors of chronic pain in pregnancy and postpartum. J Obstet Gynaecol Can 2017;39:734–41. [DOI] [PubMed] [Google Scholar]
- [37].Olsson CB, Grooten WJA, Nilsson-Wikmar L, Harms-Ringdahl K, Lundberg M. Catastrophizing during and after pregnancy: associations with lumbopelvic pain and postpartum physical ability. Phys Ther 2012;92:49–57. [DOI] [PubMed] [Google Scholar]
- [38].Osman A, Barrios FX, Kopper BA, Hauptmann W, Jones J, O'Neill E. Factor structure, reliability, and validity of the pain catastrophizing scale. J Behav Med 1997;20:589–605. [DOI] [PubMed] [Google Scholar]
- [39].Pagé MG, Katz J, Curtis K, Lutzky-Cohen N, Escobar EMR, Clarke HA. Acute pain trajectories and the persistence of post-surgical pain: a longitudinal study after total hip arthroplasty. J Anesth 2016;30:568–77. [DOI] [PubMed] [Google Scholar]
- [40].Prego-Domínguez J, Khazaeipour Z, Mallah N, Takkouche B. Socioeconomic status and occurrence of chronic pain: a meta-analysis. Rheumatology (Oxford, England) 2021;60:1091–105. [DOI] [PubMed] [Google Scholar]
- [41].Proust-Lima C, Philipps V, Liquet B. Estimation of extended mixed models using latent classes and latent processes: the R package lcmm. J Stat Softw 2017;78:1–56. [Google Scholar]
- [42].Quartana PJ, Campbell CM, Edwards RR. Pain catastrophizing: a critical review. Expert Rev Neurother 2009;9:745–58. [DOI] [PMC free article] [PubMed] [Google Scholar]
- [43].Rabiee M, Sarchamie N. Low back pain severity and related disability in different trimesters of pregnancy and risk factors. Int J Womens Health Reprod Sci 2018;6:438–43. [Google Scholar]
- [44].Ram N, Grimm KJ. Growth mixture modeling: a method for identifying differences in longitudinal change among unobserved groups. Int J Behav Dev 2009;33:565–76. [DOI] [PMC free article] [PubMed] [Google Scholar]
- [45].Ray-Griffith SL, Morrison B, Stowe ZN. Chronic pain prevalence and exposures during pregnancy. Pain Res Manag 2019;2019:6985164. [DOI] [PMC free article] [PubMed] [Google Scholar]
- [46].Rejnö G, Lundholm C, Öberg S, Lichtenstein P, Larsson H, D'Onofrio B, Larsson K, Saltvedt S, Brew BK, Almqvist C. Maternal anxiety, depression and asthma and adverse pregnancy outcomes - a population based study. Sci Rep 2019;9:13101. [DOI] [PMC free article] [PubMed] [Google Scholar]
- [47].Rondung E, Ekdahl J, Sundin Ö. Potential mechanisms in fear of birth: the role of pain catastrophizing and intolerance of uncertainty. Birth 2019;46:61–8. [DOI] [PubMed] [Google Scholar]
- [48].Sedov ID, Tomfohr-Madsen LM. Trajectories of insomnia symptoms and associations with mood and anxiety from early pregnancy to the postpartum. Behav Sleep Med 2021;19:395–406. [DOI] [PubMed] [Google Scholar]
- [49].Simpson W, Glazer M, Michalski N, Steiner M, Frey BN. Comparative efficacy of the generalized anxiety disorder 7-item scale and the Edinburgh Postnatal Depression Scale as screening tools for generalized anxiety disorder in pregnancy and the postpartum period. Can J Psychiatry 2014;59:434–40. [DOI] [PMC free article] [PubMed] [Google Scholar]
- [50].Spitzer RL, Kroenke K, Williams JBW, Löwe B. A brief measure for assessing generalized anxiety disorder: the GAD-7. Arch Intern Med 2006;166:1092–7. [DOI] [PubMed] [Google Scholar]
- [51].Sullivan MJL, Bishop SR, Pivik J. The pain catastrophizing scale: development and validation. Psychol Assess 1995;7:524–32. [Google Scholar]
- [52].To WWK, Wong MWN. Factors associated with back pain symptoms in pregnancy and the persistence of pain 2 years after pregnancy. Acta Obstet Gynecol Scand 2003;82:1086–91. [DOI] [PubMed] [Google Scholar]
- [53].Wang S-M, Dezinno P, Maranets I, Berman MR, Caldwell-Andrews AA, Kain ZN. Low back pain during pregnancy: prevalence, risk factors, and outcomes. Obstet Gynecol 2004;104:65–70. [DOI] [PubMed] [Google Scholar]
- [54].Wolff N, Darlington A-S, Hunfeld J, Verhulst F, Jaddoe V, Hofman A, Passchier J, Tiemeier H. Determinants of somatic complaints in 18-month-old children: the generation R study. J Pediatr Psychol 2010;35:306–16. [DOI] [PubMed] [Google Scholar]