

Abstract
Aim:
To compare the diagnostic validity of NIA-AA criteria, for AD CSF biomarkers, with our own new criteria.
Materials and Methods:
Between 2008 and 2011, 170 patients with Mild Cognitive Impairment (MCI) were included. CSF levels of Aβ1-42, T-tau, P-tau181, and ratios of T-tau/Aβ1-42 and P-tau181/Aβ1-42 were analyzed. In our criteria, we considered 3 or more abnormal variables indicative of a high likelihood of MCI due to AD.
Results:
After a clinical follow-up of 4.5 ± 1.2 years, 44 patients remained stable, 95 developed AD, 15 other forms of dementia, 7 died and 9 received other diagnoses. Using the NIA-AA criteria and our own criteria, the diagnostic validity of the CSF biomarkers was 58% versus 85%, specificity 84% versus 72%, PPV 82% versus 79% and NPV 61% versus 79%.
Conclusion:
The inclusion of the ratios in diagnostic criteria increases sensitivity and NPV for the diagnosis of MCI due to AD.
Keywords: mild cognitive impairment, Alzheimer’s disease, biomarkers, CSF, ratios, diagnostic validity
Introduction
Early identification of patients with Alzheimer’s disease (AD) has become a priority within the neurosciences. To this end, the National Institute on Aging and the Alzheimer’s Association (NIA-AA) criteria for the diagnosis of preclinical and prodromal AD (or mild cognitive impairment [MCI] due to AD) have recently been defined. In these criteria, cerebrospinal fluid (CSF) biomarkers have been accepted as evidence of the underlying pathophysiology of the disease, especially for research, but their use is yet limited in daily clinical practice. 1 The standardization of the use of biomarkers is still limited, the results between laboratories are variable, and there is no consensus of how exactly they should be used. Subsequently, different criteria for assessing the CSF biomarkers of AD have been published. 2 -4 These previous studies propose the use of the biomarkers, including ratios, in isolation or in specific combinations. 2,3 In this way, relevant information can be lost or complex mathematical formulas 4 are needed.
In our study, we propose the assessment of these biomarkers that comprises consider them clearly altered when 3 or more abnormal variables are obtained, where we included Aβ, total-tau (T-tau), P-tau, and Aβ/tau ratios as well. In this way, important information regarding both pathways of the illness, amyloid and neuronal injury, won’t be lost and there is no need to perform complex mathematical calculations.
We suggest that the criteria proposed herein are more sensitive than the NIA-AA criteria for diagnosing MCI due to AD because using the ratios the relationship between the 2 pathophysiological pathways of the disease is included. 5
Materials and Methods
Study Design
Longitudinal study.
Study Participants
Between 2008 and 2011, 170 patients with amnestic MCI diagnosed according to the 2006 Petersen criteria were included. 6 Most of the patients were from the cognitive impairment consultation of the General University Hospital of Alicante, 25 from the Denia Marina-Salud Regional Hospital, and 21 from the Baix Vinalopó Hospital of Elche. A physical and neurological examination, neuropsychological testing, Yesavage depression scale (15 items), blood tests, brain magnetic resonance imaging (MRI), and lumbar puncture (LP) were performed. The patients were followed in the outpatient clinic with at most an annual examination. During these examinations, the progression to AD was assessed according to the NIA-AA criteria 1 and evaluated using the Geriatric Depression Scale. All patients whose LP had been performed at least 3 years earlier were included in this study.
Inclusion Criteria
Patients with amnestic MCI, over age 55, with a Folstein Mini Mental State Examination (MMSE) score lower than 27 and an Informant Questionnaire on Cognitive Decline in the Elderly (IQCODE) score below 78. For inclusion in the study and performance of LP, all patients signed an informed consent.
Exclusion Criteria
Exclusion criteria included the presence of dementia or other neurological, psychiatric, or systemic disease that could cause cognitive impairment, anticoagulant therapy, lack of informed consent, and Yesavage Depression Scale score greater than 5 points.
Procedures
The responsible neurologist issued a diagnosis of pure amnestic MCI or multiple-domain amnestic MCI according to the 2006 Petersen criteria. 6 Subsequently, a neuropsychological evaluation was conducted involving memory, language, executive functions, attention, and visual-constructional capabilities through the MMSE, Rey Auditory-Verbal Learning Test, Trail Making Test, and the IQCODE. Alteration in a function was defined as a Z result of −1.5 or less, which is at least 1.5 standard deviations below the mean of the control participants, in at least one of the tests used to study the function. The criteria for considering conversion of MCI to AD were meeting the NIA-AA criteria for diagnosing this disease, the McKeith et al criteria for the diagnosis of dementia with Lewy bodies, 7 the NINDS-AIREN criteria for diagnosis of vascular dementia, 8 the Lund-Manchester Consortium criteria for the diagnosis of frontotemporal dementia, 9 and the Zerr et al criteria 10 for the diagnosis of Creutzfeldt-Jakob disease. The clinical diagnosis was made blindly with respect to the CSF results.
Brain MRI 1.5 Tesla General Electrics was performed on all patients to assess medial temporal lobe atrophy (MTA) according to Korf et al criteria 11 and to rule out brain injuries responsible for the clinical presentation, particularly those of vascular origin.
Collection and Analysis of CSF
The CSF was collected between February 2008 and February 2011, obtaining samples between 10:00 am and 2:00 pm. The LP was performed by the responsible neurologist with a 20 × 3-½′′ needle. The CSF was collected in polypropylene tubes, centrifuged, aliquoted, and frozen within 1 hour at −80°C. Prior to obtaining samples for freezing, a tube was collected for conducting biochemical testing and cell count. In no cases did the count show more than 100 red blood cells. All the samples were analyzed at the same laboratory.
Quantification of CSF Protein Levels of Aβ1-42, T-tau, and P-tau181p
The CSF biomarkers of AD were analyzed using INNOTEST reagents for Aβ1-42, T-tau, and P-tau181p proteins by Innogenetics (Ghent, Belgium). In addition, T-tau/Aβ1-42 and P-tau181p/Aβ1-42 ratios were obtained. The latter ratios are still widely used by several authors as they seem to reflect the relationship between the amyloid and tau pathways of the disease. All samples were analyzed blindly for clinical data.
Analysis of CSF Results and Brain MRI
Aβ1-42 protein levels were considered abnormal if they were below 550 pg/mL, and the remaining variables were considered abnormal if values were above 350 pg/mL in T-tau, 52 pg/mL in P-tau181p, 0.5 in the T-tau/Aβ1-42 ratio, and 0.07 in the P-tau181p/Aβ1-42 ratio, based on previously published cutoff values and validated in our laboratoy. 2,5,12,13 Using our criteria, likelihood was considered high with 3 abnormal variables, intermediate with 2 abnormal variables and low with a single abnormal variable. The NIA-AA criteria describe high likelihood when Aβ1-42 and 1 of the other 2 proteins of neuronal injury are abnormal; intermediate likelihood when only 1 protein is abnormal and the others are not analyzed; low when none of these proteins is abnormal, and uninformative when all 3 proteins are analyzed and only 1 is abnormal (Table 1). In our study, we compare the diagnostic validity of the corresponding criteria to high likelihood of MCI due to AD regarding CSF biomarkers. Brain MRI was considered abnormal when the sum of right and left MTA was 3 or higher.
Table 1.
NIA-AA and Our Classification.
| High | Intermediate | Low | |
|---|---|---|---|
| NIA-AA Classificationa | |||
| Aβ biomarker (PET or CSF) | Abnormal | Untested/abnormal | Normal |
| Neuronal injury (tau, FDG, sMRI) | Abnormal | Untested/Abnormal | Normal |
| Ours Classification | |||
| Normal values | |||
| Aβ1-42 >500 pg/mL | 3 or more measurements abnormal | 2 measurements abnormal | <2 measurements abnormal |
| T-tau <350 pg/mL | |||
| P-tau181 <52 pg/mL | |||
| T-tau/Aβ1-42 ratio <0.5 | |||
| P-tau181/Aβ1-42 ratio <0.07 | |||
Statistical Analysis
For analysis of the type of distribution of each variable, the Kolmogorov-Smirnov test was used and for comparison between 2 groups, the Mann-Whitney test. To detect associations, the χ2 test or, where necessary, Fisher exact test was used. The relative risk was used with a confidence interval of 95% to quantify the magnitude of the association. To study predictive ability, sensitivity, specificity, positive predictive value (PPV), and negative predictive value (NPV) were calculated. Statistical significance was set at P < .05. The SPSS software version 19.0 was used.
Ethical Criteria
The pharmaceutical companies that have supported this project have had no role in the design, data collection or interpretation, or in the writing of this article. All patients gave informed consent to the LP and to inclusion in this study, which was approved by the Clinical Research Ethics Committee of the University General Hospital of Alicante.
Results
Clinical and Demographic Characteristics
After a follow-up of 4.5 ± 1.2 years, of the sample of 170 patients, 44 patients with MCI remained stable, 95 developed AD, 15 developed other dementias (ODs), 7 died during follow-up, and 9 received other diagnoses. Among those who developed ODs, 10 patients were eventually diagnosed with dementia with Lewy bodies, 2 patients with frontotemporal dementia, 2 with vascular dementia, and 1 with a final diagnosis of Creutzfeldt-Jakob disease.
Table 2 shows the clinical and demographic characteristics of each of the groups. We found no significant differences in years of education, history of hypertension, the Folstein MMSE score, onset of the symptoms, or the IQCODE score. Significant differences were found between the age of the stable MCI group and the other 3 groups, the rate of amnestic MCI and in the medial temporal atrophy among the 4 groups. Nevertheless, these differences are not relevant for this study.
Table 2.
Clinical and Demographic Characteristics of the Patients Included.
| Stable MCI | AD | OD | Death and Depression | P | |
|---|---|---|---|---|---|
| Number of cases (%) | 44 (25.8%) | 95 (55.8%) | 15 (8.8%) | 16 (9.4%) | |
| Men (%) | 16 (39) | 37 (38) | 8 (57) | 7 (43) | |
| Age, years (mean) | 69.9 | 72.6 | 72.0 | 70.4 ± 6.3 | .008 |
| History (%) | |||||
| Diabetes | 9 (21.9) | 21 (22.5) | 2 (15.3) | 3 (18.7) | |
| Hypertension | 21 (51.2) | 44 (47.3) | 6 (46.1) | 6 (37.5) | |
| Hyperlipidemia | 22 (53.6) | 51 (54.8) | 4 (30.7) | 5 (31.2) | |
| Depression | 17 (41.4) | 23 (24.7) | 3 (23.1) | 7 (43.7) | |
| Schooling, years (mean) | 4.15 (± 1.2) | 3.0 (±1.3) | 4.7 (± 0.5) | 4.5 (± 1.1) | .5 |
| Start of symptoms before LP, months (mean) | 21.1 (± 4.3) | 21.8 (± 6.4) | 22.4 (± 5.6) | 21.4 (± 5.1) | .4 |
| Folstein MMSE (mean) | 25.5 (± 3.4) | 24.3 (± 3.6) | 25.0 (± 3.2) | 24.6 (4.7) | .3 |
| IQCODE (mean) | 64.7 (± 8.4) | 62.9 (± 7.5) | 68.5 (± 6.3) | 65.5 (± 9.5) | .5 |
| Amnestic MCI (%) | 95.4 | 97.8 | 46.6 | 62.5 | .001 |
| MRI-MTA | 3.5 (1.1) | 4.3 (1.5) | 3.7 (1.2) | 3.1 (0.7) | .05 |
| Aβ1-42, pg/mL, median ± SD | 823.7 ± 290.9 | 550.9 ± 240.4 | 671.7 ± 255.3 | 853.7 ± 263.5 | .0001 |
| T-tau, pg/mL, median ± SD | 460.9 ± 436.6 | 675.6 ± 408.3 | 684.8 ± 918.2 | 542.5 ± 424.5 | .015 |
| P-tau, pg/mL, median ± SD | 53.7 ± 34.9 | 92.8 ± 65.7 | 43.3 ± 16.8 | 56.7 ± 23.4 | .0001 |
| T-tau/Aβ1-42, median ± SD | 0.73 ± 0.92 | 1.41 ± 0.95 | 1,32 ± 1.87 | 0.8 ± 1.1 | .0001 |
| P-tau/Aβ1-42, median ± SD | 0.08 ± 0.07 | 0.19 ± 0.22 | 0,08 ± 0,06 | 0.08 ± 0.09 | .0001 |
Abbreviations: AD, Alzheimer’s disease; IQCODE, Informant Questionnaire on Cognitive Decline in the Elderly; LP, lumbar puncture; MCI, mild cognitive impairment; MMSE, Mini Mental State Examination; MRI-MTA, magnetic resonance imaging medial temporal lobe atrophy; ODs, other dementias; P, significance level (P < .05); SD, standard deviation.
The results of brain MRI showed no difference in the presence of white matter lesions. Baseline levels of biomarkers showed no significant differences between groups, which is achieved by comparing the group of patients who progress to EA against those who remain stable and progress to OD.
Comparison of the Criteria
Following the NIA-AA criteria, in 67 patients the CSF biomarkers of AD were considered high likelihood, in 37 patients there was low or intermediate likelihood, and 66 patients were considered as uninformative. Following our own criteria, 102 patients were classified with high likelihood, 34 with intermediate or low likelihood, and 34 with normal likelihood.
Table 3 shows the results of the diagnostic accuracy obtained with these criteria after the follow-up period of this study. Using the NIA-AA criteria, we obtained a much lower sensitivity and NPV, with quite similar specificities and PPV.
Table 3.
Comparison of Diagnostic Accuracy Between the NIA-AA Criteria and Our Own Criteria.
| NIA-AA Criteria | Our Criteria | |
|---|---|---|
| Sensitivity | 58% (47-68) | 85% (78-93) |
| Specificity | 84% (75-93) | 72% (61-83) |
| PPV | 82% (72-92) | 79% (71-88) |
| NPV | 61% (51-71) | 79% (69-90) |
Abbreviations: NIA-AA, National Institute on Aging and Alzheimer’s Association; NPV, negative predictive value; PPV, positive predictive value.
Progression to AD Based on the Different Criteria
Figures 1 and 2 show the behavior of each of the groups based on conversion time to AD. Comparing both charts, we can see that the uninformative biomarker group in the NIA-AA classification behaves much like the low/intermediate likelihood group using our criteria.
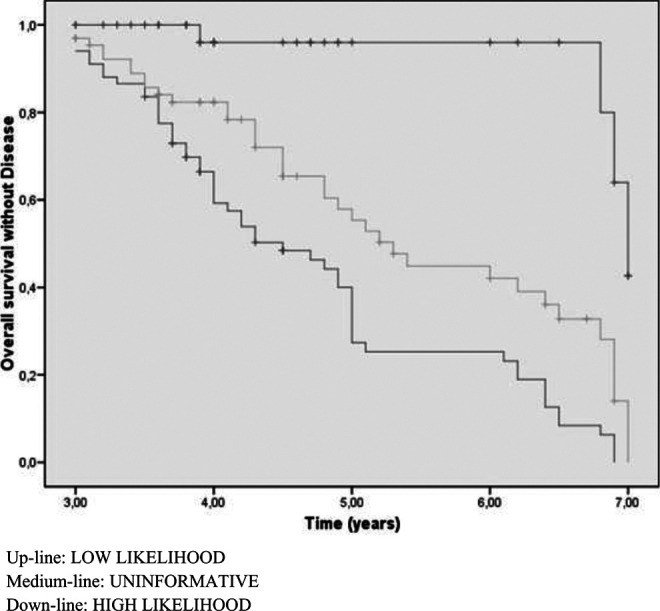
Figure 1.

Figure 2.
The median time to development of the disease following NIA-AA criteria is 4.57 years for patients with high likelihood biomarkers, 7 years for intermediate or low likelihood, and 5.65 years for uninformative. However, this median, based on our criteria is 4.7 years for high likelihood, 6.6 for intermediate or low, and 7 for normal (Table 4). The overall accumulative conversion rate to AD was 18% for the first year, 35% for the second, 47% for the third, and 58% for the last 4.5 years. In each period, the numbers of patients who did not develop EA were 140, 103, 63, and 53, respectively.
Table 4.
Progression to AD Based on NIA-AA and on Own Criteria.
| Odds Ratio | Significance Level | Time to Development of Dementia, years | ||
|---|---|---|---|---|
| Progression to AD based on NIA-AA criteria (Figure 1) | ||||
| Up-line | Low likelihood | 2 | .01 | 7 |
| Medium-line | Uninformative | Reference | 5.65 | |
| Down-line | High likelihood | 11.23 | .001 | 4.57 |
| Progression to AD based on own criteria (Figure 2) | ||||
| Up-line | Normal | Reference | 7 | |
| Medium-line | Intermediate/low likelihood | 6.17 | .01 | 6.6 |
| Down-line | High likelihood | 16.00 | .0001 | 4.7 |
Abbreviations: AD, Alzheimer’s disease; NIA-AA, National Institute on Aging and Alzheimer’s Association.
Discussion
With this study, we demonstrated that, when there are at least 3 abnormal variables in the CSF analysis in patients with MCI, including the ratios, we were able to significantly increase the sensitivity and NPV, although slightly decreases in specificity, to identify them as having a high likelihood of progressing to AD, with respect to the NIA-AA criteria. We believe these results are very relevant when using this technique for designing clinical trials in patients with MCI due to AD. Another study using the same criteria obtained similar results. 15
To date, different CSF biomarker profiles have been described as typical of AD. The best known and used is the one published by the NIA-AA, 1,14 where abnormal Aβ protein levels and at least 1 CSF biomarker for neuronal degeneration (T-tau and/or P-tau) is considered high likelihood. However, following these criteria, a proportion of patients show conflicting results. 16
Other authors have different methods for assessing these results as a whole. Thus, Hulstaert et al 17 reported an index obtained exclusively from Aβ and T-tau levels. Using weighted regression formulas developed by combining the results of different biomarkers, Mattsson et al 18 showed that values above 1 obtained a sensitivity of 86% and a specificity of 80% and a 91% PPV and an NPV of 63% when comparing patients with MCI versus AD. Molinuevo et al 4 used indices that included the values of the 3 proteins to differentiate between patients with AD and control participants, obtaining high sensitivity and specificity. In the studies by Shoonenboom et al 19 when comparing patients with AD versus ODs, high sensitivity but a decrease in specificity to 72% was observed. In all these studies, 4,12,17,20 good sensitivity of around 85% is achieved, with variations in specificity ranging between 63% and 85%, especially in differentiating between patients with MCI and ODs. 19,21,22 The results of our study were similar to those of other authors; however, we used a much simpler method to differentiate between the patients with MCI who will progress to AD and those who will remain stable.
The basis for our proposal to include ratios lies in their ability to indicate an early disturbance in the balance between the 2 metabolic pathways of the disease, 5 not always evident from the absolute values of biomarkers, particularly in the early stages or when these are within normal ranges. These ratios have proven to be a better predictor of MCI due to AD than each of the biomarkers separately. 23,24 Furthermore, several authors consider the Aβ/T-tau ratio to be the most sensitive biomarker for early diagnosis of AD. 2
The combination of the different biomarkers provides good accuracy in the differential diagnosis between AD and ODs. 19,25,26 In addition, numerous studies have shown that the combination of these CSF biomarkers significantly increases both sensitivity and specificity. 17,27 -30 In our study, the logical use of the absolute values of each biomarker is complemented by use of the ratios since they represent the relationship between 2 of them, and their alteration implies the presence of an imbalance between the 2 metabolic pathways of amyloid and neuronal injury involved in the disease. Thus, 3 altered variables confirm the involvement of both pathophysiological pathways of AD. This profile can be especially useful for early diagnosis of the disease and for the differentiation between AD and ODs, such as dementia with Lewy bodies, where the T-tau/Aβ ratio shows very different values to those found in AD 21,31,32 or Creutzfeldt-Jakob disease where an important rise in T-tau is produced without an alteration in Aβ protein levels. 33
The results described as uninformative, according to NIA-AA classification, behave similarly to those we classify as intermediate likelihood, as there are few differences in progression to AD. This group of patients is more heterogeneous, as we are not always aware of the involvement of the 2 pathogenic pathways of disease, and this can be found on the limit of normality. Therefore, in our opinion, they should not be included in a hypothetical clinical trial of patients with MCI due to AD. However, this is a group that deserves very close attention since the likelihood of progression to AD is high.
Among the limitations of this study, we note the absence of other techniques for the assessment of cerebral amyloidosis such as Pittsburgh Compound B-Positron Emission Tomography [PIB-PET]; although according to some authors, the data obtained from this technique is superimposable on the data resulting from CSF analysis. 34,35 Additionally, we did not have APOE genotype studies since this has only been available to us for the past 3 years. The cutoffs used may vary from one laboratory to another, which remains a problem to be solved if CSF biomarkers are to be used in everyday clinical setting. We used cutoffs widely accepted in the literature and validated in our laboratory. Finally, we did not have pathological confirmation and no generalization to other settings.
In summary, our results demonstrate that the combination of the different CSF biomarkers of AD, in the patients with MCI, including ratios, significantly increases the sensitivity for early diagnosis of the disease allowing us to strengthen monitoring, design clinical trials, and implement the best suited treatment strategies at all times.
Acknowledgments
The authors would like to thank Maria de los Angeles Miguel Sanz from the Immunology Laboratory for the excellent management of samples.
Footnotes
The authors declared no potential conflicts of interest with respect to the research, authorship, and/or publication of this article.
Funding: The authors disclosed receipt of the following financial support for the research, authorship, and/or publication of this article: Funded by Novartis Spain and Grunenthal Spain.
References
- 1. McKhann GM, Knopman DS, Chertkow H, et al. The diagnosis of dementia due to Alzheimer’s disease: Recommendations from the National Institute on Aging and the Alzheimer’s Association workgroup. Alzheimers Dement. 2011;7(3):263–269. [DOI] [PMC free article] [PubMed] [Google Scholar]
- 2. Duits FH, Teunissen CE, Bouwman FH, et al. The cerebrospinal fluid “Alzheimer profile”: easily said, but what does it mean? Alzheimers Dement. 2014;10(6):713–723. [DOI] [PubMed] [Google Scholar]
- 3. Ferreira D, Perestelo-Pérez L, Westman E, Wahlund LO, Sarría A, Serrano-Aguilar P. Meta-review of CSF core biomarkers in Alzheimer’s disease: The state-of-the-art after the new revised diagnostic criteria. Front Aging Neurosci. 2014;6:47. [DOI] [PMC free article] [PubMed] [Google Scholar]
- 4. Molinuevo JL, Gispert JD, Dubois B, et al. The AD-CSF-index discriminates Alzheimer’s disease patients from healthy controls: a validation study. J Alzheimers Dis. 2013;36(1):67–77. [DOI] [PubMed] [Google Scholar]
- 5. Shaw LM, Vanderstichele H, Knapik-Czajka M, et al. Alzheimer’s disease neuroimaging initiative. Cerebrospinal fluid biomarker signature in Alzheimer’s disease neuroimaging initiative subjects. Ann Neurol. 2009;65(4):403–413. [DOI] [PMC free article] [PubMed] [Google Scholar]
- 6. Artero S, Petersen R., Touchon J., Ritchie K. Revised criteria for mild cognitive impairment: validation within a longitudinal population study. Dement Geriatr Cogn Disord. 2006;22(5-6):465–470. [DOI] [PubMed] [Google Scholar]
- 7. McKeith IG, Dickson DW, Lowe J, et al. Diagnosis and management of dementia with Lewy bodies: third report of the DLB Consortium. Neurology. 2005;65(12):1863–1872. [DOI] [PubMed] [Google Scholar]
- 8. Roman GC, Tatemichi TK, Erkinjuntti T, et al. Vascular dementia: diagnostic criteria for research studies. Report of the NINDS-AIREN International Workshop. Neurology. 1993;43(2):250–260. [DOI] [PubMed] [Google Scholar]
- 9. Neary D, Snowden JS, Gustafson L, et al. Frontotemporal lobar degeneration: a consensus on clinical diagnostic criteria. Neurology. 1998;51(6):1546–1554. [DOI] [PubMed] [Google Scholar]
- 10. Zerr I, Kallenberg K, Summers DM, et al. Updated clinical diagnostic criteria for sporadic Creutzfeldt-Jakob disease. Brain. 2009;132(Pt 10):2659–2668. [DOI] [PMC free article] [PubMed] [Google Scholar]
- 11. Korf ES, Wahlund LO, Visser PJ, Scheltens P. Medial temporal lobe atrophy on MRI predicts dementia in patients with mild cognitive impairment. Neurology. 2004;63(1):94–100. [DOI] [PubMed] [Google Scholar]
- 12. Mulder C, Verwey NA, van der Flier WM, et al. Amyloid-beta (1-42), total tau, and phosphorylated tau as cerebrospinal fluid biomarkers for the diagnosis of Alzheimer disease. Clin Chem. 2010;56(2):248–253. [DOI] [PubMed] [Google Scholar]
- 13. Bouwman FH, Schoonenboom SN, van der Flier WM, et al. CSF biomarkers and medial temporal lobe atrophy predict dementia in MCI. Neurobiol Aging. 2007;28(7):1070–1074. [DOI] [PubMed] [Google Scholar]
- 14. Albert MS, DeKosky ST, Dickson D, et al. The diagnosis of mild cognitive impairment due to Alzheimer’s disease: recommendations from the National Institute on Aging-Alzheimer’s Association workgroups on diagnostic guidelines for Alzheimer’s disease. Alzheimers Dement. 2011;7(3):270–279. [DOI] [PMC free article] [PubMed] [Google Scholar]
- 15. Prestia A, Caroli A, Wade SK, et al. Prediction of AD dementia by biomarkers following the NIA-AA and IWG diagnostic criteria in MCI patients from three European memory clinics. Alzheimers Dement. 2015;11(10):1191–1201. [DOI] [PubMed] [Google Scholar]
- 16. Petersen RC, Aisen P, Boeve BF, et al. Mild cognitive impairment due to Alzheimer disease in the community. Ann Neurol. 2013;74(2):199–208. doi: 10.1002/ana.23931. [DOI] [PMC free article] [PubMed] [Google Scholar]
- 17. Hulstaert F, Blennow K, Ivanoiu A, et al. Improved discrimination of AD patients using beta-amyloid(1-42) and tau levels in CSF. Neurology. 1999;52(8):1555–1562. [DOI] [PubMed] [Google Scholar]
- 18. Mattsson N, Portelius E, Rolstad S, et al. Longitudinal cerebrospinal fluid biomarkers over four years in mild cognitive impairment. J Alzheimers Dis. 2012;30(4):767–778. [DOI] [PubMed] [Google Scholar]
- 19. Schoonenboom NS, Reesink FE, Verwey NA, et al. Cerebrospinal fluid markers for differential dementia diagnosis in a large memory clinic cohort. Neurology. 2012;78(1):47–54. [DOI] [PubMed] [Google Scholar]
- 20. Tabaraud F, Leman JP, Milor AM, et al. Alzheimer CSF biomarkers in routine clinical setting. Acta Neurol Scand. 2012;125(6):416–423. [DOI] [PubMed] [Google Scholar]
- 21. Mollenhauer B, Cepek L, Bibl M, et al. Tau protein, Abeta42 and S-100B protein in cerebrospinal fluid of patients with dementia with Lewy bodies. Dement Geriatr Cogn Disord. 2005;19(2-3):164–170. [DOI] [PubMed] [Google Scholar]
- 22. Tapiola T, Alafuzoff I, Herukka SK, et al. Cerebrospinal fluid (beta)-amyloid 42 and tau proteins as biomarkers of Alzheimer-type pathologic changes in the brain. Arch Neurol. 2009;66(3):382–389. [DOI] [PubMed] [Google Scholar]
- 23. Van Rossum IA, Vos SJ, Burns L, et al. Injury markers predict cognitive decline in subjects with MCI and amyloid pathology. Neurology. 2012;79(17):1809–1816. [DOI] [PMC free article] [PubMed] [Google Scholar]
- 24. Qiu Y, Li L, Zhou TY, Lu W; Alzheimer’s Disease Neuroimaging Initiative. Alzheimer’s disease progression model based on integrated biomarkers and clinical measures. Acta Pharmacol Sin. 2014;35(9):1111–1120. [DOI] [PMC free article] [PubMed] [Google Scholar]
- 25. Bian H, Van Swieten JC, Leight S, et al. CSF biomarkers in frontotemporal lobar degeneration with known pathology. Neurology. 2008;70(19 Pt 2):1827–1835. [DOI] [PMC free article] [PubMed] [Google Scholar]
- 26. de Souza LC, Lamari F, Belliard S, et al. Cerebrospinal fluid biomarkers in the differential diagnosis of Alzheimer’s disease from other cortical dementias. J Neurol Neurosurg Psychiatry. 2011;82(3):240–246. [DOI] [PubMed] [Google Scholar]
- 27. Hampel H, Teipel SJ, Fuchsberger T, et al. Value of CSF beta-amyloid1-42 and tau as predictors of Alzheimer’s disease in patients with mild cognitive impairment. Mol Psychiatry. 2004;9(7):705–710. [DOI] [PubMed] [Google Scholar]
- 28. Ibach B, Binder H, Dragon M, et al. Cerebrospinal fluid tau and beta-amyloid in Alzheimer patients, disease controls and an age-matched random sample. Neurobiol Aging. 2006;27(9):1202–1211. [DOI] [PubMed] [Google Scholar]
- 29. Smach MA, Charfeddine B, Ben Othman L, et al. Evaluation of cerebrospinal fluid tau/beta-amyloid (42) ratio as diagnostic markers for Alzheimer disease. Eur Neurol. 2009;62(6):349–355. [DOI] [PubMed] [Google Scholar]
- 30. Welge V, Fiege O, Lewczuk P, et al. Combined CSF tau, p-tau181 and amyloid-beta 38/40/42 for diagnosing Alzheimer’s disease. J Neural Transm. 2009;116(2):203–212. [DOI] [PubMed] [Google Scholar]
- 31. Clark CM, Xie S, Chittams J, et al. Cerebrospinal fluid tau and beta-amyloid: how well do these biomarkers reflect autopsy-confirmed dementia diagnoses? Arch Neurol. 2003;60(12):1696–1702. [DOI] [PubMed] [Google Scholar]
- 32. Vranová HP, Hényková E, Kaiserová M, et al. Tau protein, beta-amyloid1–42 and clusterin CSF levels in the differential diagnosis of Parkinsonian syndrome with dementia. J Neurol Sci. 2014;343(1-2):120–124. [DOI] [PubMed] [Google Scholar]
- 33. Skillbäck T, Rosén C, Asztely F, Mattsson N, Blennow K, Zetterberg H. Diagnostic performance of cerebrospinal fluid total tau and phosphorylated tau in Creutzfeldt-Jakob disease: results from the Swedish Mortality Registry. JAMA Neurol. 2014;71(4):476–483. [DOI] [PubMed] [Google Scholar]
- 34. Fagan AM, Roe CM, Xiong C, Mintun MA, Morris JC, Holtzman DM. Cerebrospinal fluid tau/beta-amyloid(42) ratio as a prediction of cognitive decline in nondemented older adults. Arch Neurol. 2007;64(3):343–349. [DOI] [PubMed] [Google Scholar]
- 35. Palmqvist S, Zetterberg H, Mattsson N, et al. Detailed comparison of amyloid PET and CSF biomarkers for identifying early Alzheimer disease. Neurology. 2015;85(14):1240–1249. [DOI] [PMC free article] [PubMed] [Google Scholar]