

Abstract
We report the findings from a clinical trial in which a group of patients clinically diagnosed with probable Alzheimer’s disease (AD) were discriminated from an age-matched group of healthy volunteers (HVs) with statistical significance (P < .001). The results from 20 patients with AD and 20 HVs were obtained by a Fluorescent Ligand Eye Scanning (FLES) technique that measures a fluorescent signature specific to an exogenous ligand bound to amyloid-β in the lens of the eye. Sensitivity and specificity of 85% and 95%, respectively, have been achieved in predicting clinical diagnosis. Additionally, amyloid brain imaging using florbetapir F18 positron emission tomography shows significant correlation with the results obtained in the eye. Results of the study demonstrate the safety of the FLES system.
Keywords: Alzheimer’s disease, human lens, amyloid-β, amyloid PET imaging, fluorescence spectroscopy
Introduction
Alzheimer’s disease (AD) is the leading neurodegenerative disorder in the world today and accounts for approximately two-thirds of the cases of dementia. In the United States alone, approximately 5.2 million people have AD and the number is projected to reach 13.8 million in 2050, with 7 million aged 85 years or older. 1 The annual associated costs are estimated to be close to US$203 billion in 2013. 2 Presently, there is no cure for the disease and definite diagnosis of AD is performed postmortem through histopathological identification of characteristic features including amyloid-β (Aβ) plaques. 3 –5 These plaques of Aβ deposits in the patient’s brain, according to the amyloid cascade hypothesis, are one of the hallmarks of the pathogenesis of AD. 6 –8
Currently, there is a major effort to improve diagnosis of AD by detecting the presence and accumulation of Aβ protein in the brain. 9 –11 Amyvid (florbetapir F18) and Vizamyl (flutemetamol), radioactive tracers, were recently approved by the US Food and Drug Administration for positron emission tomography (PET) imaging of the brain, estimating Aβ plaque density in patients who are being evaluated for cognitive impairment. 12 However, the role of amyloid imaging PET in the evaluation of such individuals is not established and it is not practical for use as a routine AD screening tool. In addition, the Centers for Medicare and Medicaid Services (CMS) have been reluctant thus far to cover for its procedural cost.
Other studies have demonstrated AD-related molecular and pathological changes in the eye 14 –17 and detected the presence of Aβ in the lens 18 –20 and in the retina. 21,22 Frederikse et al demonstrated that Alzheimer’s precursor protein and Aβ are present in the interior fiber cells of the mammalian ocular lens. 18 Such proteins are formed in β-sheet arrays organized in an amyloid protein supramolecular order. Goldstein et al identified Aβ1-40 and Aβ1-42 in the supranuclear region of the lens at similar concentration levels as have been found in the brain. 20 Additional studies in transgenic mice and individuals with Down’s syndrome support the hypothesis linking the AD-associated pathology in the brain and lens. 23,24 Moreover, deep cortical cataract has been documented in transgenic mice expressing human Aβ. 25
An exploratory clinical trial was conducted at 2 sites using Fluorescent Ligand Eye Scanning (FLES) to compare 5 patients clinically diagnosed with probable AD to 5 healthy volunteers (HVs). The study demonstrated the safety and effectiveness of the FLES technique in predicting clinical diagnosis. 26
In this study, we conducted a clinical trial on 40 participants (20 probable AD and 20 HV) and compared the results obtained by FLES in the eye with that obtained by amyloid florbetapir F18 PET imaging in the brain.
Materials and Methods
Ethics Statement
The study was conducted in accordance with the current revision of Declaration of Helsinki, guiding physicians in medical research involving patients. The Western Institutional Review Board , Olympia, Washington, approved the protocol to initiate the clinical trial. The participants provided their signed written consent form. Consent was provided by the legally authorized representative for patients unable to consent.
Fluorescent Ligand Eye Scanning System: Combination Product
The FLES system is a combination product of ligand device that detects the fluorescent signature of the applied ligand bound to Aβ in the supranucleus of the lens. The ligand is an ophthalmic ointment that is applied topically to the eye. The device is based on scanning the supranucleus of the eye and performing fluorescence lifetime measurements.
Fluorescent Ligand: Aftobetin Hydrochloride
The ligand substance (aftobetin hydrochloride), whose chemical name is 2-propenoic acid, 2-cyano-3-[6-(1-piperidinyl)-2-napthalenyl]-,2-[2-(2-methoxyethoxy) ethoxy] ethyl ester, hydrochloride (1:1), is an amyloid-binding ligand. 27 Its fluorescent structure features a molecular rotor motif whose fluorescence quantum yield is dependent on the surrounding environment. This type of molecules produces specific fluorescent properties upon binding to Aβ (such as increase in fluorescence intensity and specific lifetime decay rate), which make it very attractive for use in applications for amyloid plaques detection using fluorescence techniques.
Ophthalmic Ointment Preparation
The ligand is formulated into a sterile ophthalmic ointment consisting of 0.54% aftobetin hydrochloride (0.5% w/w as free base), 80% petrolatum, and 19.46% mineral oil for topical application.
The ophthalmic ointment was manufactured by Bio-Concept Laboratories Inc, (Salem, New Hampshire), in compliance with the current Good Manufacturing Practices as set forth in the Code of Federal Regulations, Section 21 parts 210 and 211.
For this study, the ointment was packaged in sterile 1-cm3 tuberculin-type syringes that were not fitted with either a cannula or a needle. Each dose consisted of a 1/2-in ribbon containing 50 mg of fluorescent ligand. Bioavailability and toxicity/phototoxicity studies in addition to in vitro fluorescence characterization of the ointment have already been demonstrated. 26
Fluorescent Ligand Eye Scanning Device
The laser scanning device is designed to detect and measure emitted fluorescence signal of the fluorescent ligand bound to Aβ aggregates in the supranuclear region of the lens. The device enables a scan along the optical axis of the eye (scanning time 120 milliseconds) to locate the supranucleus region in the lens as an initial step. Upon identification of the region of interest, which is about 900 μm below the lens capsule, the device initiates a time-resolved fluorescence lifetime measurement (scanning time 1 second). The fluorescence excitation during the measurement is generated using short pulses of light and the emission is recorded as a function of time delay following the excitation. 28 The time domain technique has several unique advantages of which it allows discrimination between different fluorophores and obtaining of multiple lifetimes (complex fluorescence decays) in a single measurement.
Optical scanning system
The source is a pulsed laser (Becker & Hickl GmbH, Berlin, Germany) with a peak wavelength at 473 nm (full width at half maximum [FWHM] 100 pseconds, repetition rate 50 MHz), and an average output power of 10 μWatts illuminates the eye. A pair of galvanometer scanners (Cambridge Technology Inc, Bedford, MA) steers the laser beam in a raster configuration that defines the measurement scan area (50 × 50 μm) in the lens. Fluorescence from excited molecules is collected in epifluorescence configuration, filtered with dichroic mirrors (Semrock, Inc. Rochester, NY) and an additional bandpass filter (centered at 585 nm), and passed through an aperture to enable confocal detection. The arrival of photons is detected with single-photon avalanche photodiode (MPD, Bolzano, Italy; timing resolution 50 pseconds FWHM, efficiency 50% at 550 nm).
Data acquisition and analysis
The photons detected are time stamped using a time correlation single-photon counting data acquisition board (SPC150, Becker & Hickl GmbH, Berlin, Germany). A time decay histogram profile of the detected photons is constructed and fitted with multiple exponential components from which frequency counts (values) of photons with specific decay lifetime of ligand bound to Aβ are calculated. In order to account for signal distortion due to eye blinking and motion, a normalization algorithm is implemented. The fluorescence uptake value (FUV) is determined from the ratio between the fluorescence signal associated with bound ligand to Aβ and the background signal associated with lens autofluorescence.
Positron Emission Tomography Imaging
Positron emission tomography imaging sessions were performed on all participants with Amyvid (florbetapir F18), a radioactive tracer, used to estimate the Aβ plaque density in patients’ brains. A 370-MBq (10 mCi) bolus injection of Amyvid was administered and a 20-minute PET image was obtained approximately 50 minutes postinjection. 29 The images were reconstructed immediately after the 20-minute scan, and in cases of detected motion artifact, another 20-minute image was acquired. Positron emission tomography image interpretation was performed by a single masked certified reader at Banner Alzheimer’s Institute.
Image Interpretation
Image interpretation of amyloid PET imaging was based upon the distribution of radioactive signal within the brain. Images were designated as positive or negative by comparing the radioactivity in cortical gray matter with activity in the adjacent white matter. 29 This determination was made only in the cerebral cortex as follows:
Negative scans showed more radioactivity in white matter than in gray matter, creating clear gray–white contrast.
Positive scans showed cortical areas with reduction in or loss of the normally distinct gray–white contrast. These scans had one or more areas with increased cortical gray matter signal, which resulted in reduced (or absent) gray–white contrast.
Statistical Analysis
Receiver–operating characteristics (ROC) analysis was used to determine the decision threshold, or level of separation, between the AD and the HV groups. The threshold is set to obtain a balance between sensitivity and specificity and to calculate the area under the curve (AUC). The same analysis was used in comparing results between the 2 methods, FLES and PET. The Cohen’s κ coefficient (κ ) was calculated as a statistical measure for the agreement between the results obtained by either PET or FLES and the clinical diagnosis of AD.
Study Design and Participants
The study was an observer-masked, age-matched case–control study of patients with AD and HV. The operator of the FLES device did not have access to the patient’s medical history and the ophthalmologist was masked as to the diagnosis of the patient. The reader of the PET images was also masked as to the clinical diagnosis of the patient.
A “time and events” schedule is summarized in Figure 1. All patients (both patients with AD and HV) attended 5 visits.
Figure 1.

Time and event schedule. 1 Partial exemption allowed inclusion of this test performed within 12 months. 2 Vital signs were taken within 7 minutes of each administration of the ointment. Patients were seated and nonactive for 5 minutes.
Visit 1 was a screening visit that included several procedures with an overall objective of ensuring each individual met the inclusion/exclusion criteria (detailed subsequently) for participation in the clinical trial.
Visit 2 included baseline (predose) measurements with the FLES device and 3 doses with the ointment. An aliquot of ointment was instilled into the lower cul de sac of the designated treatment eye only beginning at 3 pm (±2 hours). The application of ointment was repeated at 5 pm (±30 minutes) and 7 pm (±30 minutes) of visit 2. A single dose consists of a ½-in ribbon (approximately 0.05 cm3) of ointment topically administered to the inside of the lower eyelid with a syringe applicator. Each dose of ointment was applied to the study eye of the participant by a trained technician, ophthalmologist, or nurse at the study site. The dosed eye was covered with an eye cup for 30 minutes after application of each dose. The participant was asked to keep the dosed eye closed. Vital signs were taken within 7 minutes of each administration of the ointment. Before vital signs were measured, the patient was seated and nonactive for at least 5 minutes.
A measurement session was conducted with the device the next morning (visit 3) at 18 (±2) hours following the last application of ointment after the first dose. After the measurement session, an eye examination was performed on each patient to assess changes in ophthalmic signs.
Visit 4 was a 7 (±2)-day follow-up safety examination only, which included physical, eye examinations, and clinical laboratory assessments.
Visit 5 consisted of amyloid PET imaging and was conducted within 90 days after visit 4.
Inclusion criteria for patients with AD
Subjective memory concern as reported by patient, study partner, or clinician;
Clinical Dementia Rating (CDR) between 0.5 and 2, with a rating of at least 1 on the memory subscale
Mini-Mental State Examination (MMSE) score between 14 and 24 inclusive;
Functional Activities Questionnaire scale of greater than 4;
Alzheimer’s Disease Assessment Scale-Cognitive score of greater than 16;
National Institute of Neurological and Communicative Disorders and Stroke-Alzheimer’s Disease and Related Disorder Association (NINCDS-ADRDA) criteria for probable AD;
Diagnostic and Statistical Manual of Mental Disorders (Fourth Edition; DSM-IV) criteria for Dementia of the Alzheimer’s type;
abnormal memory function documented by scoring within the education adjusted ranges on the Logical Memory II subscale from the Wechsler Memory Scale-Revised (the maximum score is 25).
Inclusion criteria for HVs
Free of memory complaints, verified by a study partner, aside from those normal with age;
cognitively normal, based on an absence of significant impairment in cognitive functions or activities of daily living (ADL);
CDR-Global score of 0 and CDR-Memory score of 0;
MMSE score between 26 and 30;
normal ADL by history;
psychiatrically healthy, no depression in the clinical judgment of investigator;
normal memory function documented by scoring within the education adjusted ranges on the Logical Memory II subscale (Delayed Paragraph Recall, Paragraph A only) from the Wechsler Memory Scale-Revised (the maximum score is 25).
Participants
Twenty (45% females) patients with AD with median age of 76 years met the NINCDS-ADRDA criteria for probable AD and DSM-IV criteria for dementia of the Alzheimer’s type. Figure 2 is a list of the demographics recruited for the study showing the age, sex, race, ethnicity, and test scores of CDR and MMSE for both the groups. Each patient with AD had a score of 0.5 or more on the CDR scale. In addition, each patient with AD had a magnetic resonance imaging (MRI) brain scan without findings indicative of stroke, generalized cerebrovascular disease, or other non-AD etiologies for the dementia.
Figure 2.

Demographics of all patients in the study.
Twenty HVs (45% females) with median age of 72 years were recruited with no evidence of cognitive impairment and had MMSE score between 26 and 30. Clinical Dementia Rating scores were collected for both HV and patients with AD. The HVs all had a CDR score of 0. Additionally, each HV had a MRI brain scan judged as “normal (age appropriate)” including age-related white matter changes scale scores supporting the lack of cerebrovascular disease (eg, a white matter lesion score of 0 or 1 or 2 and a basal ganglia score of 0 or 1) and a Scheltens scale verifying the lack of cerebral atrophy (eg, bilateral temporal lobe atrophy visual score of 0 or 1).
First patient was enrolled into the study on December 5, 2012, and the last patient completed study on September 11, 2013.
Safety
Safety was evaluated by documentation of adverse events (AEs), assessment of clinical laboratory findings, physical examination, including measurement of vital signs, and ophthalmic examination.
Patients were asked at each visit whether they had experienced any symptoms since their last examination. Questions were asked in an “open-ended” manner so as to solicit all inputs from patients regarding all potential AEs.
Ophthalmic examinations included assessments of best spectacle-corrected visual acuity, uncorrected visual acuity, intraocular pressure, slit lamp examination, Lens Opacities Classification System cataract, and ocular surface. Each ophthalmic examination was performed by a board-certified ophthalmologist who evaluated any signs and symptoms observed versus the patient’s baseline measures.
Physical examinations and clinical laboratory measures were taken before and after each exposure to the test product. In addition, a 7-day poststudy examination was conducted by the investigator and samples of both blood and urine were collected for clinical examination. The results were reviewed for any clinically significant changes.
Measurement Sessions
Baseline eye scanning measurements with FLES were performed prior to dosing with ligand. After the baseline measurements, the ligand was topically administered to the eye of the recruited patients 3 times at 2-hour (±30 minutes) intervals. The same measurements with FLES were performed the next day.
Results and Discussion
Fluorescent Ligand Eye Scanning
The FUVs of the signal to background are calculated for each patient. Figure 3 is a scatter plot of the FUV for all patients tested by the device in the study. The average FUV of the AD group (0.50) is almost double that of the HV group (0.23). The separation between the 2 groups is represented by the line at the threshold (=0.367), which is calculated by the ROC analysis that is used to maximize both sensitivity and specificity for this cohort. Using the line threshold at 0.367, 1 false positive and 3 false negatives (FNs) resulted in predicting clinical diagnosis.
Figure 3.

Scatter plot of the FUV for all patients in the study. The patients are grouped as clinically diagnosed as HV or with AD. The values differed significantly among diagnostic groups (85% sensitivity, 95% specificity, P < .0001, 95% CI, threshold = 0.36). The color coded represents the diagnosis by PET read as positive (red) or negative (black) for AD. FUV indicates fluorescence uptake value; HV, healthy volunteer; AD, Alzheimer’s disease; Ci, confidence interval; PET, positron emission tomography.
The results reveal a substantial range of 0.82 (0.14-0.96) in the AD group and 0.45 (0.05-0.49) in the HV group. This range is potentially important and could be leveraged for potential diagnosis of people at different stages of the disease (eg, mild cognitive impairment) or even at earlier stages, before the symptoms arise or the individual is clinically diagnosed. Further studies with larger cohort including people at different stages of the disease are needed to validate this hypothesis.
The ROC analysis of the data (Figure 4) shows that FLES predicts clinical diagnosis with a sensitivity of 85% and a specificity of 95% using the Cohen’s κ test (κ = 0.80, 95% confidence interval [CI] = 0.61-0.99, P < .001, AUC = 0.915).
Figure 4.

Efficacy results of FLES to predict clinical diagnosis. FLES indicates Fluorescent Ligand Eye Scanning.
Positron emission tomography imaging
Similar statistical analysis as used in the FLES test was performed for the Amyvid PET readings that were obtained on the same cohort in the study. Figure 5 details the statistical results of Amyvid PET predicting clinical diagnosis. Both sensitivity and specificity of 80% were achieved (κ = 0.60, 95% CI = 0.35-0.85, P < .001).
Figure 5.
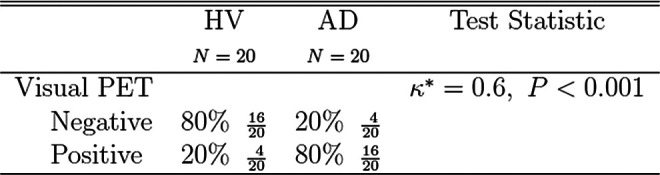
Efficacy results of Amyvid PET to predict clinical diagnosis. PET indicates positron emission tomography.
Comparison: FLES and visual PET
Amyloid brain PET imaging had 4 false positive and 4 FN cases (color coded in Figure 3). The 4 FN cases as diagnosed by PET were correctly predicted by FLES.
Figure 6 details the results of the ROC analysis, predicting PET results from the eye test. In this analysis, the threshold used is the same one used to maximize both sensitivity and specificity for FLES prediction of clinical diagnosis. When PET predicts AD correctly, there is 81% agreement with FLES in detecting the disease group. However, when PET predicts HV correctly, there is 100% agreement with FLES in identifying the normal group. On the other hand, when PET predicts AD incorrectly, FLES correctly predicts 100% of the disease cases and in the case when PET predicts HV incorrectly, FLES correctly predicts 75% of normal cases.
Figure 6.

Fluorescent Ligand Eye Scanning correlation with Amyvid PET by clinical diagnosis.
Assessment of FLES with age
Alzheimer’s disease is pathologically characterized by the presence of neurofibrillary tangles of τ protein and amyloid plaques, which are thought to build up before the decline of cognitive functions by at least a decade or 2. In this relatively small size study, we assessed the measured values that represent the signature of ligand bound to Aβ in the eye, relative to the age of the patients in the age-matched (±5 years) groups (Figure 7). In the AD group, we observed an increase in the values with age (slope .921 × 10−2 ± 0.005, r2 = .39). On the other hand, the HV group did not exhibit a substantial increase with age (slope .117 × 10−2 ± 0.004, r2 = .24). The inset table represents the average values for both the groups in decades of the participant ages. In each decade, the average AD group scored higher than the HV group by at least a factor of 2. The age deduced from this cohort from which the 2 groups can be discriminated was 55 years, which was obtained by extrapolating the regression line of the AD group to the threshold value resulted from the ROC analysis described in the previous section.
Figure 7.
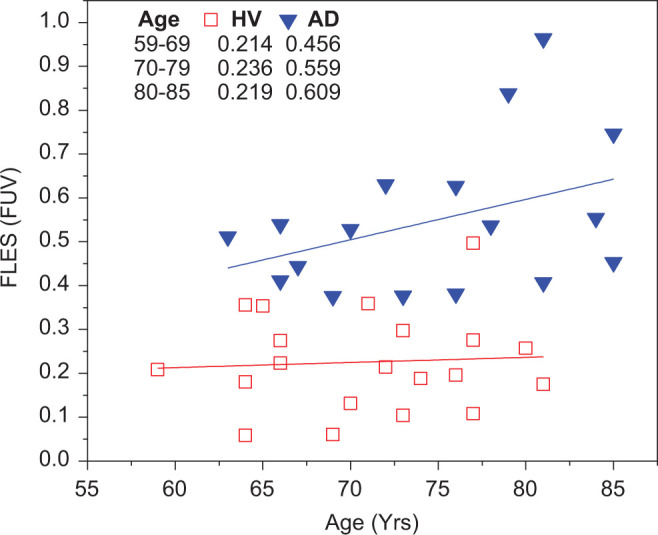
Fluorescence uptake value assessment as a function of age in both the group with AD and the HV group. The HV group did not exhibit a substantial increase in the FUV with age while a significant increase in FUV was observed in the AD group. The age at which both groups can be discriminated is 55 years old. FUV indicates fluorescence uptake value; HV, healthy volunteer; AD, Alzheimer’s disease.
Comparison: FLES and quantitative PET
In an attempt to investigate the pathological extent of the accumulation of Aβ overlap between the brain and the eye, we evaluated the correlation between values obtained in the eye with FLES and the quantitative measurements of the mean cortical to cerebellar (standardized uptake value ratio [SUVr]) obtained with PET. Although the Amyvid (florbetapir F18) PET SUVr has not been accepted yet in clinical practice, with no clear threshold for the onset of cognitive impairment associated with Aβ, studies have demonstrated that the quantitative analysis correlates well with the Aβ burden measured from autopsy. 30,31
In addition to visual reads, SUVr from PET imaging were obtained for all patients who participated in the study. Since both PET and FLES are imperfect predictors of clinical diagnosis, as discussed earlier, cases where either qualitative PET or FLES made an incorrect prediction were excluded from the analysis. In Figure 8, the data obtained by both methods that correctly predict clinical diagnosis ( ) show a statistically significant linear regression relationship (r2 = .33, P < .0006, 95% CI). The quantitative uptake values in the brain and that in the eye even on a small population size show a significant correlation between the 2 methods across the whole cohort of participants. The gap between the 2 groups, AD and HV, could be indicative of Aβ accumulation with a different pattern in a subgroup. It is important to note that the outliers, especially the 4 FNs of PET, were correctly predicted by FLES (
 ). On the other hand, the 3 FNs that resulted by FLES were correctly predicted by PET (
 ).
).
Figure 8.
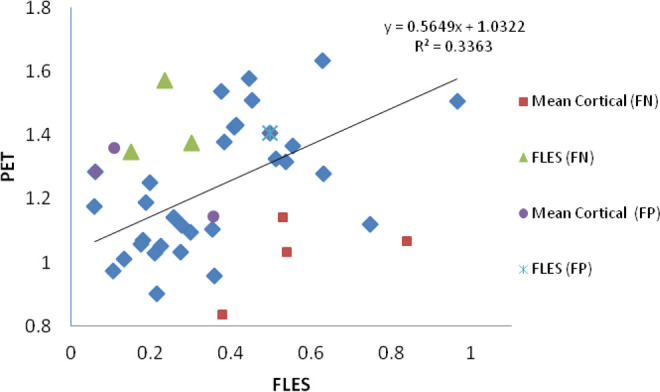
Positron emission tomography (mean cortical) and FLES (FUV) results obtained for all patients. There is a linear regression correlation (r2 = .33, P < .0006) between both methods that correctly predict clinical diagnosis. Overall, FLES did not correctly predict 4 patients; 3 false negatives (FN) and 1 false positive (FP). Visual PET did not correctly predict 8 patients; 4 FNs and 4 FPs. FLES indicates Fluorescent Ligand Eye Scanning; PET, positron emission tomography; FUV, fluorescence uptake value.
Safety
Comprehensive ophthalmic examinations were conducted at 3 time points: before application of the fluorescent ligand (visit 1), after application of the fluorescent ligand and employment of the device (visit 2), and follow-up (visit 3). None of the patients were discontinued from the study for any reason. Slit lamp biomicroscopy was also performed as a part of the study along with an ophthalmoscopic examination. No remarkable observations were made either by slit lamp biomicroscopy or by ophthalmoscopy. Observations of the dilated fundus showed no significant changes during the course of the clinical trial.
Discussion
At the completion of the clinical trial, there were no clinically significant changes that could be attributed to this procedure. Results of the study demonstrate the safety of the FLES system. The results show that the FLES system, device, and the ophthalmic ointment, used in this study, posed no substantial safety risk, with no serious AEs or unanticipated adverse device effects reported in the course of the study.
The results demonstrated the capability of FLES system platform to discriminate between the HV and the AD groups (40 participants) by detecting fluorescent signature of bound aftobetin hydrochloride to Aβ. The findings complement a previous exploratory study performed on 10 participants. In comparison with brain imaging, Amyvid PET, the FLES results showed better prediction of clinical diagnosis than those of Aβ PET. In addition, there was significant correlation between FLES measurements in the eye and the PET SUVr analysis in the brain.
Our analysis has several limitations including the sample size, the exclusion of the outliers, and the imperfection of both technologies to predict clinical diagnosis. Further investigation with larger sample size, including groups with different degree of severity of the disease, will be needed for correlation and statistical analysis.
Based on the promising results in separating the 2 groups with statistical significance and the fact that a dynamic range was observed within these groups, the FLES eye test not only has the potential to detect AD but also could enable classification of the disease at different stages.
Acknowledgments
We thank Dr. Adam Fleisher of Banner Alzheimer Institute for conducting the centralized PET read. We would like to thank everyone involved in the conduct of the study, the preparation of the manuscript, and the study participants and their families.
Footnotes
The authors declared the following potential conflicts of interest with respect to the research, authorship, and/or publication of this article: Dr Sadowsky, Dr Tariot, Dr Agronin and Dr Alva were principal investigators on the study. None of the investigators have a conflict of interest with the sponsor. Dr.Turner, the study statistician, is an independent contractor to Cognoptix, Inc.
Funding: The authors disclosed receipt of the following financial support for the research, authorship, and/or publication of this article: This work was an independent study sponsored by Cognoptix, Inc.
References
- 1. Hebert LE, Weuve J, Scherr PA, Evans DA. Alzheimer disease in the United States (2010-2050) estimated using 2010 census. Neurology. 2013;80(19):1778–1783. [DOI] [PMC free article] [PubMed] [Google Scholar]
- 2. Thies W, Bleiler L; Alzheimer's Association. 2013. Alzheimer’s Disease Facts and Figures. Alzheimers Dement. 2013;9(2):208–245. [DOI] [PubMed] [Google Scholar]
- 3. Hyman BT, Phelps CH, Beach TG, et al. National institute on aging-Alzheimer’s association guidelines for the neuropathologic assessment of Alzheimer’s disease. Alzheimers Dement. 2012;8(1):1–13. [DOI] [PMC free article] [PubMed] [Google Scholar]
- 4. McKhann GM, Knopman DS, Chertkow H, et al. The diagnosis of dementia due to Alzheimer’s disease: recommendations from the national institute of aging-Alzheimer’s association workgroups on diagnostic guidelines for Alzheimer’s disease. Alzheimers Dement. 2011;7(3):263–269. [DOI] [PMC free article] [PubMed] [Google Scholar]
- 5. McKhann G, Drachman D, Folstein M, Katzman R, Price D, Stadlan EM. Clinical diagnosis of Alzheimer's disease: report of the NINCDS-ADRDA work group under the auspices of department of health and human services task force on Alzheimer's disease. Neurology. 1984;34(7):939–944. [DOI] [PubMed] [Google Scholar]
- 6. Hardy J, Selkoe DJ. The amyloid hypothesis of Alzheimer’s disease: progress and problems on the road to therapeutics. Science. 2002;297(5580):353–356. [DOI] [PubMed] [Google Scholar]
- 7. Karran E, Mercken M, De Strooper B. The amyloid cascade hypothesis for Alzheimer’s disease: an appraisal for the development of therapeutics. Nat Rev Drug Discov. 2011;10(9):698–712. [DOI] [PubMed] [Google Scholar]
- 8. Reiman EM, Quiroz YT, Fleisher AS, et al. Brain imaging and fluid biomarker analysis in young adults at genetic risk for autosomal dominant Alzheimer's disease in the presenilin 1 E280A kindred: a case-control study. Lancent Neurol. 2012;11(12):1048–1056. [DOI] [PMC free article] [PubMed] [Google Scholar]
- 9. Klunk WE, Engler H, Nordberg A, et al. Imaging brain amyloid in Alzheimer’s disease with Pittsburg compound-B. Ann Neurol. 2004;55(3):306–319. [DOI] [PubMed] [Google Scholar]
- 10. Nordberg A. PET imaging of amyloid in Alzheimer's disease. Lancet Neurol. 2004;3(9):519–527. [DOI] [PubMed] [Google Scholar]
- 11. Doraiswamy PM, Sperling RA, Coleman RE, et al. Amyloid-β assessed by florbetapir F18 PET and 18-month cognitive decline: a multicenter study. Neurology. 2012;79(16):1636–1644. [DOI] [PMC free article] [PubMed] [Google Scholar]
- 12. Yang L, Rieves D, Ganley C. Brain amyloid imaging – FDA approval of florbetapir F18 injection. N Engl J Med. 2012;367(10):885–887. [DOI] [PubMed] [Google Scholar]
- 13. Parnell M, Guo L, Abdi M, Cordeiro MF. Ocular manifestations of Alzheimer's disease in animal models. Int J Alzheimers Dis. 2012;2012:786494. [DOI] [PMC free article] [PubMed] [Google Scholar]
- 14. Liang JJ. Interaction between beta-amyloid and lens alphaB-crystallin. FEBS Lett. 2000;484(2):98–101. [DOI] [PubMed] [Google Scholar]
- 15. Isas JM, Luibl V, Johnson LV, et al. Soluble and mature amyloid fibrils in drusen deposits. Invest Ophthalmol Vis Sci. 2010;51(3):1304–1310. [DOI] [PMC free article] [PubMed] [Google Scholar]
- 16. Bruban J, Dinet V, Mascarelli F. The role of amyloid-β in retinal degeneration. Adv Exp Med Biol. 2012;723:67–74. [DOI] [PubMed] [Google Scholar]
- 17. Frederikse PH, Garland D, Zigler JS, Jr, Piatigorsky J. Oxidative stress increases production of beta-amyloid precursor protein and beta-amyloid (Abeta) in mammalian lenses, and Abeta has toxic effects on lens epithelial cells. J Biol Chem. 2010;51(3):1304–1310. [DOI] [PubMed] [Google Scholar]
- 18. Frederikse PH. Amyloid-like protein structure in mammalian ocular lenses. Curr Eye Res. 2000;20(6):462–468. [PubMed] [Google Scholar]
- 19. Goldstein LE, Muffat JA, Cherny RA, et al. Cytosolic β-amyloid deposition and supranuclear cataracts in lenses from people with Alzheimer’s disease. Lancet. 2003;361(9365):1258–1265. [DOI] [PubMed] [Google Scholar]
- 20. Koronyo-Hamaoui M, Koronyo Y, Ljubimov AV, et al. Identification of amyloid plaques in retinas from Alzheimer's patients and noninvasive in vivo optical imaging of retinal plaques in a mouse model. Neuroimage. 2011;54 suppl 1:S204–S2017. [DOI] [PMC free article] [PubMed] [Google Scholar]
- 21. Koronyo Y, Salumbides BC, Black KL, Koronyo-Hamaoui M. Alzheimer's disease in the retina: imaging retinal Aβ plaques for early diagnosis and therapy assessment. Neurodegener Dis. 2012;10(1-4):285–293. [DOI] [PubMed] [Google Scholar]
- 22. Moncaster JA, Pineda R, Moir RD, et al. Alzheimer's disease Amyloid-β links lens and brain pathology in down syndrome. PLoS One. 2010;5(5):e10659. [DOI] [PMC free article] [PubMed] [Google Scholar]
- 23. Jun G, Moncaster JA, Koutras C, et al. δ-Catenin is genetically and biologically associated with cortical cataract and future Alzheimer-related structural and functional brain change. PLoS One. 2012;7(9):e43728. [DOI] [PMC free article] [PubMed] [Google Scholar]
- 24. Melov S, Wolf N, Strozyk D, Doctrow SR, Bush AI. Mice transgenic for Alzheimer disease beta-amyloid develop lens cataract that are rescued by antioxidant treatment. Free Radic Biol Med. 2005;38(2):258–261. [DOI] [PubMed] [Google Scholar]
- 25. Kerbage C, Sadowsky CH, Jennings D, Cagle GD, Hartung PD. Alzheimer’s disease diagnosis by detecting exogenous fluorescent signal of ligand bound to beta amyloid in the lens of human eye: an exploratory study. Front Neurol. 2013;4:62. [DOI] [PMC free article] [PubMed] [Google Scholar]
- 26. Sutharsan J, Dakanali M, Capule CC, Haidekker MA, Yang J, Theodorakis EA. Rational design of amyloid binding agents based on the molecular rotor motif. ChemMedChem. 2010;5(1):56–60. [DOI] [PMC free article] [PubMed] [Google Scholar]
- 27. Koberling F, Krämer B, Kapusta P, Patting M, Wahl M, Erdmann R. Time-resolved confocal fluorescence microscopy: Novel technical features and applications for FLIM, FRET and FCS using a sophisticated data acquisition concept in TCSPC. Proc SPIE. 2007;6583:65830Y. [Google Scholar]
- 28. http://pi.lilly.com/us/amyvid-uspi.pdf.
- 29. Clark CM, Schneider JA, Bedell BJ, et al. Use of florbetapir-PET for imaging β-amyloid pathology. JAMA. 2011;305(3):275–283. [DOI] [PMC free article] [PubMed] [Google Scholar]
- 30. Fleisher AS, Chen K, Liu X, et al. Using positron emission tomography and florbetapir F18 to image cortical amyloid in patients with mild cognitive impairement or dementia due to Alzheimer. Arch Neurol. 2011;68(11):1404–1411. [DOI] [PubMed] [Google Scholar]