Abstract
Background
The infiltrative nature of human gliomas renders complete surgical removal of tumors futile. Thus, illuminating mechanisms of their infiltrative properties may improve therapies and outcomes of glioma patients.
Methods
Comprehensive bioinformatic analyses of PRSS family were undertaken. Transfection of HTRA1 siRNAs was used to suppress HTRA1 expression. CCK‐8, EdU, and colony formation assay were employed to assess cell viability, and cell migration/invasion was detected by transwell, wound healing, and 3D tumor spheroid invasion assays. Immunoprecipitation was applied to study the mechanism that HTRA1 affected cell migration. In addition, in situ xenograft tumor model was employed to explore the role of HTRA1 in glioma growth in vivo.
Results
HTRA1 knockdown could lead to suppression of cell viability, migration and invasion, as well as increased apoptosis. Immunoprecipitation results indicates HTRA1 might facilitate combination between HDAC6 and α‐tubulin to enhance cell migration by decreasing α‐tubulin acetylation. Besides, HTRA1 knockdown inhibited the growth of xenografts derived from orthotopic implantation of GBM cells and prolonged the survival time of tumor‐bearing mice.
Conclusion
Our results indicate that HTRA1 promotes the proliferation and migration of GBM cells in vitro and in vivo, and thus may be a potential target for treatment in gliomas.
Keywords: glioma cell migration, glioma cell proliferation, HTRA1, tubulin acetylation
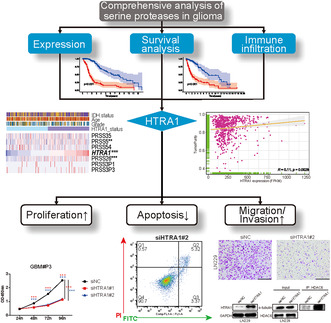
The HTRA1 serine protease has been found to have the ability to promote glioma cell proliferation, migration/invasion, and to inhibit tumor apoptosis, in vitro and in vivo. HTRA1 might facilitate the combination between HDAC6 and α‐tubulin to reduce α‐tubulin acetylation, enhancing cell migration.
1. INTRODUCTION
Human glioma is the most common and lethal intracranial tumors and account for up to 80% of primary human brain tumors. To date, glioma remain one of the most refractory human tumor types due to the scarcity of approaches to manage glioma. One of the most intriguing features of glioma is the frequent intracranial infiltration while extracranial metastasis is rare. In addition, intracranial recurrence after surgery mainly arises from the infiltrative nature of human glioma. Therefore, the study of the mechanisms underlying glioma invasion and infiltration may be beneficial to the development of therapies with improved efficacy in the treatment of this deadly tumor type.
High‐temperature requirement‐A1 serine protease (HTRA1), also named as serine protease 11 (PRSS11), is one of the proteins participating in tumor invasion and migration. 1 As a member of the serine protease superfamily, HTRA1 is a highly conserved protein expressed in different organisms, including bacteria, 2 plants, fungi, and human being. 3 , 4 HTRA1 is widely expressed in various tissues and organs of human, mostly in the brain, mature epidermis and placenta. 5 HTRA1 is a 50‐kDa protease with protease and PDZ domains at the C‐terminus. 6 , 7 The protein is secreted by cells and involved in extracellular matrix degradation. 8 It is also reported that HTRA1 could participate intracellularly in cell apoptosis, migration, and invasion in tumor cells through EGFR pathways. 9 , 10 Other signaling pathways, including the Wnt, 11 Notch, 7 NF‐κB 12 and TGF‐β 13 , 14 , 15 pathways can also be modulated by HTRA1. On the one hand, HTRA1 is primarily viewed as a tumor suppressor protein in cancer, including ovarian cancer, 16 , 17 melanoma, 3 endometrial cancer 18 , 19 and thyroid tumors. 20 On the other hand, it has also been reported to function as an oncogenic protein facilitating angiogenesis, 7 tumor proliferation, and metastasis. 21 In addition, high HTRA1 expression has been associated with poor prognosis in gastric cancer patients. 12 However, to the best of our knowledge, no other studies to date have illuminated the function of HTRA1 in human glioma.
In this study, we analyzed publicly available databases to explore the expression pattern of HTRA1 in glioma tissues and the correlation between HTRA1 expression levels and the prognosis of glioma patients. We also investigated the function of HTRA1 in glioblastoma (GBM) cells in vitro and in vivo, and found that HTRA1 promoted tumor progression by enhancing proliferation, invasion, and migration. The prometastatic effect of HTRA1 might be mediated by the HDAC6/Ac‐α‐tubulin pathway. In vivo experiments with isogenic HTRA1 knockdown cells indicated that HTRA1 facilitated the infiltration of glioma and shortened the survival period of nude mice. In summary, our findings suggested that HTRA1 functioned as an oncogene in glioma and might be a potential prognostic marker and therapeutic target for gliomas.
2. MATERIALS AND METHODS
2.1. Clinical specimens and databases
Paraffin‐embedded WHO grade II (n = 4), III (n = 4), and IV (n = 4) glioma tissues were obtained from the Neurosurgery Department of Qilu Hospital (Jinan, China). Normal brain tissues (n = 4) were obtained during decompression surgery performed on patients who had sustained severe head trauma. Written informed consent was obtained from patients for research purposes, and all procedures approved by the Ethics Committee of Qilu Hospital. The transcriptome data and patient survival were obtained from TCGA, Rembrandt, and GEPIA2 22 databases. TCGA and Rembrandt databases were displayed in GlioVis. 23
2.2. Survival analysis and risk score model establishment
The schematic illustration of this process is displayed in Figure S1A. After the 52 members of PRSS family genes were included, survival analysis was used to find PRSS genes whose expression was significantly correlated with prognosis of glioma patients. Then the obtained genes were applied to least absolute shrinkage and selection operator (LASSO) regression to select major PRSS genes contributing to the risk score together with their corresponding coefficients. Then the “predict” function of “glmnet” package in R was employed to calculate the risk score of each sample in TCGA glioma or GBM cohort based on each major genes' expression level and corresponding coefficients. 24 Basically, it was calculated by the following formula:
The patients with a risk score higher than the median number of risk scores were regarded as “high risk”, and the others were considered as “low risk”.
The test and train data were composed of samples randomly selected from all glioma or GBM samples and the test or train data had 50% of all data. Risk scores of each sample were calculated with the major genes' coefficients and their expression level. The prognostic effect of risk models was inspected with survival curve or ROC curve.
2.3. Implantation and in vivo imaging of in situ tumors
All animal procedures were approved by the Institutional Animal Care and Use Committee of Shandong University (ID: DWLL‐2021‐101). Cells (1 × 10⁶) expressing luciferase and infected with Lenti‐Control or Lenti‐shHTRA1 were implanted into the cortex of the brains of nude mice. The precise position was 2 mm lateral, 1 mm posterior to the bregma at a depth of 1.5 mm. In vivo imaging was conducted as previously described 25 with a bioluminescence imaging system (IVIS Lumina Series III; PerkinElmer; MA, USA) at 3, 7, 14, 21, and 28 days after implantation.
2.4. Statistical analysis
The Shapiro–Wilk test was used to assess the normality of the data. For comparison of two groups of data, Student's t‐test was used for data that passed the normality test, while the Mann–Whitney test was applied to data that did not pass the normality test. The one‐way ANOVA test was applied to the comparison of three or more groups, and Kruskal‐Wallis test was employed when data did not pass normality test. Relationships between variables were analyzed via Pearson's correlation analysis. The results of the CCK‐8 proliferation assay were assessed with two‐way ANOVA, and Dunnett's multiple comparisons test was used for the post hoc test. Survival analysis was conducted by log‐rank test. All values are presented as the means ± SEM. All statistical analyses were performed in GraphPad Prism (version 8.3.0) or R (version 4.1.3).
Detailed Methods are available in Data S1.
3. RESULTS
3.1. High HTRA1 expression is correlated with increasing grade of glioma
PRSS family members showed highly various functions modulating immunity, carcinogenesis, and cancer progression. 26 , 27 The members in this family have been reported to show pro‐tumor effects in prostate cancer, 28 diffuse large B‐cell lymphoma, 27 pancreatic cancer, 29 colorectal cancer 30 and gastric cancer. 31 Considering there was no other studies reporting their function in glioma to the best of our knowledge, we tried to study the effect of PRSS family in glioma via bioinformatic tools. All 52 PRSS family genes in TCGA database were included. A risk score was established by applying lasso regression to the PRSS family genes as described in section 2.2 and Figure S1A. The results suggested that patients with high risk scores showed more death and worse prognosis both in all glioma (Figure S1) as well as GBM data (Figure S2). These analyses indicated that PRSS genes' expression might be a prognostic factor in glioma patients. Then we found the expression level of HTRA1 was the highest among 52 serine proteases and expression level of HTRA1 in gliomas was significantly higher than in normal tissues, and high HTRA1 expression predicted poor prognosis of glioma patients (Figure S3). Besides, high HTRA1 expression was found to be associated with low M1 macrophage infiltration (Figure S4A), low immune reactivity and high tumor purity (Figure S4B,C) in TCGA glioma samples. This suggested high HTRA1 expression might be correlated with suppressed anti‐tumor immunity.
To explore the role of HTRA1 in glioma, analysis was performed on publicly available databases to determine the expression levels of HTRA1 in human gliomas. Analysis was first performed in the GlioVis data portal 23 to determine the expression levels of HTRA1 and the possible correlation of overall survival with glioma patients (Figure 1A–C). The average HTRA1 expression level was slightly higher in GBM samples than in nontumor samples in the TCGA (Figure 1A, left) and Rembrandt datasets (Figure 1A, right). HTRA1 expression levels were also significantly higher in classical and mesenchymal subtypes than in the proneural subtype in the TCGA (Figure 1B, left) and Rembrandt datasets (Figure 1B, right). Both classical and mesenchymal subtypes are regarded as more aggressive than the proneural subtype. 32 High HTRA1 expression was also significantly correlated with worse prognosis in glioma patients in the TCGA cohort (Figure 1C). In the Rembrandt cohort, the patients with high HTRA1 expression also showed a slightly shorter median overall survival than patients in the low expression group (Figure 1C, right). HTRA1 also showed increased expression in low‐grade glioma (LGG) and GBM compared to normal brain tissue samples in another public database, GEPIA2 (Figure 1D, left). In this dataset, patients with tumors with high HTRA1 expression exhibited worse prognosis than patients with tumors of low HTRA1 expression (Figure 1D, right).
FIGURE 1.
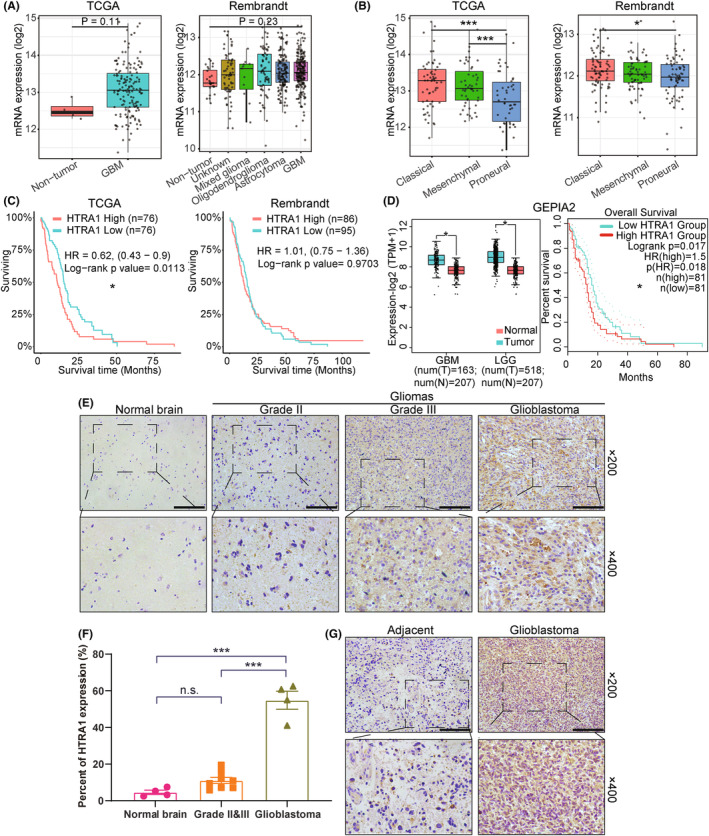
Increased expression of HTRA1 is associated with high grade gliomas and worse prognosis in patients. (A, B) Expression levels of HTRA1 based on analysis of TCGA (n = 667) and Rembrandt (n = 537) databases displayed by (A) histology or (B) molecular subtype. (C) Survival rate of GBM patients with high or low HTRA1 expression levels based on analysis of the TCGA (left, n = 152) or Rembrandt (right, n = 181) database. (D) Expression levels of HTRA1 (GBM, n = 163; LGG, n = 518) and survival rate of GBM patients (n = 162) with high or low HTRA1 expression levels in GEPIA2 database. (E, F) Representative images of immunohistochemistry detecting HTRA1 in different grades of glioma and normal brain tissue. Bar graph of the percent of cells expressing HTRA1. Bar = 100 μm. (G) Representative images of immunohistochemistry detecting HTRA1 in glioblastoma and adjacent brain tissues. Bar = 100 μm. (A, B and F), one‐way ANOVA, post hoc Dunnett's test; (C) and survival analysis in (D), log‐rank test; Expression analysis in (D), Student's t‐test. *P < 0.05; ***P < 0.001.
Immunohistochemistry furthermore showed that HTRA1 protein levels in GBM were significantly higher than in adjacent normal tissue and thus paralleled the RNA analysis (Figure 1E–G). Overall, we demonstrated that HTRA1 expression levels were significantly increased in higher grade gliomas and that high expression was correlated with worse prognosis in glioma patients.
3.2. Gene enrichment analysis of HTRA1 and coregulated genes
Enrichment analysis was performed for genes with expression levels that were significantly correlated with HTRA1 (r > 0.3 or r < −0.3) to identify potential signaling pathways and biological processes involving the gene. GO (Figure 2A) and KEGG (Figure 2B) analyses and GSEA (Figure 2C) yielded enriched pathways related to the cell cycle, cell adhesion and microtubule‐based processes in. These results indicated that HTRA1 might participate in cell proliferation and cell adhesion processes. We also performed RNA‐seq analysis of GBM#P3‐shNC and ‐shHTRA1 cells to identify putative genes regulated by HTRA1. Differentially expressed genes included 400 upregulated and 370 downregulated genes in the GBM#P3‐shHTRA1 cells compared with GBM#P3‐shNC cells (Figure 2D). In GO and KEGG enrichment analyses of the differentially expressed genes, cell adhesion‐related pathways were among the top 10 identified pathways (Figure 2E,F). This result was in agreement with the previous analysis. In addition, pathways related to PI3K‐Akt, Wnt and TGF‐β signaling pathways were also identified, and PI3K‐Akt‐related pathways were found both in top 10 of GO and KEGG enrichment analysis. However, cell cycle‐related pathways were not among the top 20 pathways. Overall, we concluded that HTRA1 and coregulated genes might be involved in the regulation of cell migration and microtubule‐based processes.
FIGURE 2.
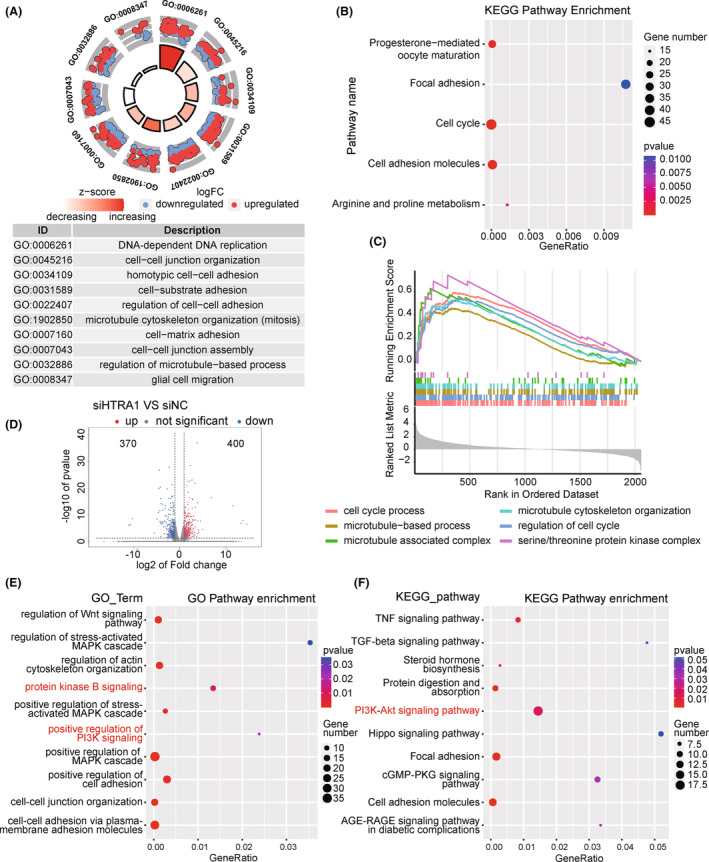
Gene enrichment analysis of HTRA1 coregulated genes. (A–C) Gene enrichment analysis of expression‐correlated genes of HTRA1 by (A) GO, (B) KEGG, and (C) GSEA enrichment analysis. (D) Volcano plot showing the DEGs derived from RNA‐seq analysis. (E) GO and (F) KEGG enrichment analysis of DEGs derived from RNA‐seq analysis.
3.3. HTRA1 knockdown suppresses proliferation and causes apoptosis in GBM cells
The results of the enrichment analysis indicated that HTRA1 and co‐expressed genes are involved in the cell cycle, which is tightly correlated with cell proliferation. Therefore, we examined the proliferation of GBM cells with siRNA knockdown of HTRA1 via CCK8 assay. Loss of HTRA1 induced a statistically significant reduction in relative cell proliferation values after 48 h in LN229, U251MG and GBM#P3 cells (Figure 3A). In colony formation assays, the number of colonies was reduced in cells transfected with HTRA1 siRNA (Figure 3B). LN229, U251MG and GBM#P3 cells also exhibited decreased EdU‐positive ratios after HTRA1 knockdown, which suggested a reduced proliferative cell ratio (Figure 3C,D). Furthermore, the cell proliferation marker PCNA 33 was also decreased, as assessed on western blots, and the results suggested that the PCNA levels significantly decreased after downregulating HTRA1 in LN229, U251MG and GBM#P3 cells (Figure 3E). Besides, according to the enrichment analyses mentioned above (Figure 2E,F), we analyzed PI3K‐Akt pathway in GBM cells with HTRA1 knockdown, which was tightly associated with cell proliferation. 34 The results showed that the levels of activated forms of PI3K and Akt decreased significantly after HTRA1 knockdown (Figure 3E). The effect of HTRA1 on cell cycle was also examined via flow cytometry. And the results indicated HTRA1 knockdown could lead to an increase in the proportion of cells in G0/G1 phase, and the decreases in G2/M proportion suggested that cell proliferation and division was inhibited (Figure S5). These data suggested that HTRA1 might promote GBM cell proliferation.
FIGURE 3.
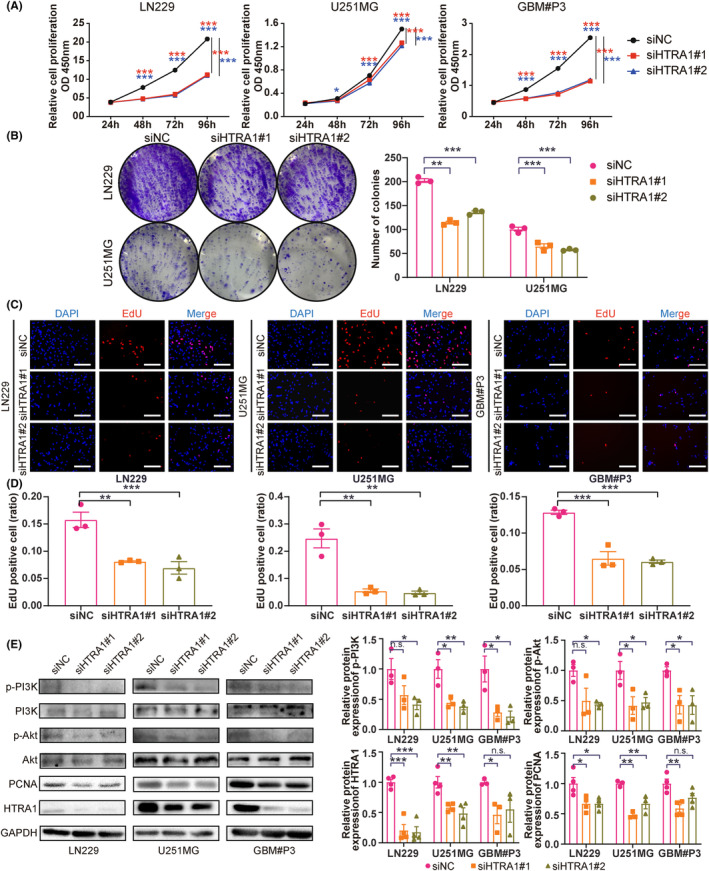
Downregulation of HTRA1 suppresses the growth of GBM cells. (A) CCK‐8 assays detecting the cell viabilities of LN229, U251MG and GBM#P3 cells transfected with siNC, siHTRA1#1 and siHTRA1#2. (B) Representative images of colony formation assay and colony number counts of LN229 and U251MG cells treated with HTRA1 siRNA. (C) Representative images and (D) positive ratios for EdU assays performed on LN229, U251MG and GBM#P3 cells with knockdown of HTRA1. Bar = 100 μm. (E) Western blots showing knockdown efficiency of HTRA1 siRNAs and levels of PI3K‐Akt pathway proteins (p‐PI3K, PI3K, p‐Akt, Akt), as well as proliferation marker (PCNA) in LN229, U251MG and GBM#P3 cells. GAPDH was used as the control for loading. (A), two‐way ANOVA, post hoc Dunnett's test; (B, D and E), one‐way ANOVA, post hoc Dunnett's test. *P < 0.05; **P < 0.01; ***P < 0.001.
Under evaluation with microscopy, we frequently found more apoptotic cells after HTRA1 knockdown. We, therefore, determined the ratio of apoptotic cells with flow cytometry. The ratios of apoptotic cells in LN229, U251MG and GBM#P3 transfected with HTRA1 siRNA significantly increased compared with cells transfected with siNC (Figure 4A). Moreover, we found protein levels of apoptosis markers cleaved PARP and BAX 35 increased while an apoptosis inhibitor BCL2 decreased 35 in LN229, U251MG and GBM#P3 with knockdown of HTRA1 (Figure 4B,C). Overall, we found that HTRA1 might be involved in promoting proliferation and inhibiting apoptosis in GBM cell lines.
FIGURE 4.
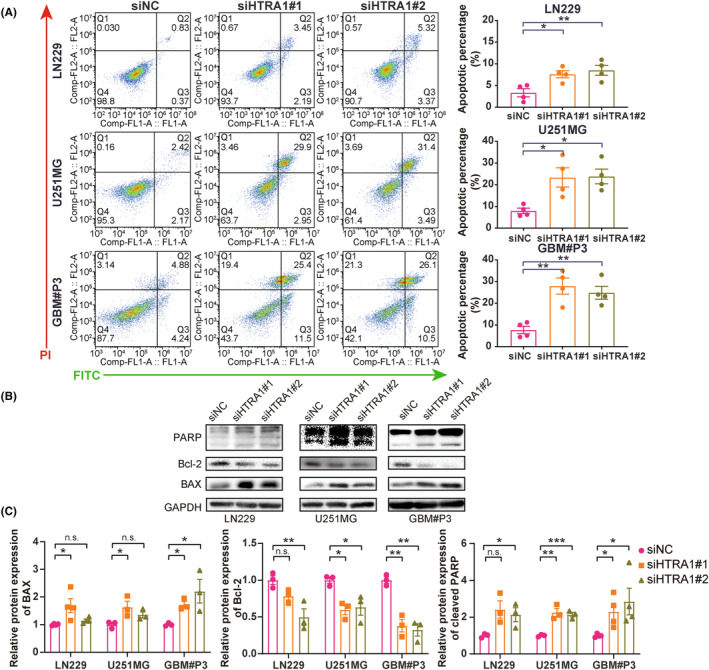
HTRA1 knockdown promotes apoptosis of GBM cells. (A) Flow cytometry analysis detecting percentage apoptosis of LN229, U251MG and GBM#P3 cells transfected with siNC, siHTRA1#1 and siHTRA1#2. (B) Representative images of western blots and (C) relative protein levels of apoptosis‐related proteins in lysates prepared from LN229, U251MG and GBM#P3 cells with HTRA1 knockdown. (A, C), one‐way ANOVA, post hoc Dunnett's test. *P < 0.05; **P < 0.01; ***P < 0.001.
3.4. HTRA1 knockdown inhibits the migration and invasion of GBM cells
The enrichment analysis indicated a putative role for HTRA1 in cell adhesion processes. We, therefore, investigated whether HTRA1 was involved in the migration and invasion of GBM cells. First, transwell assays revealed a significant decrease in the number of migrated cells per view after knockdown of HTRA1 in LN229 and U251MG cells (Figure 5A,B). Second, LN229 and U251MG cells transfected with HTRA1 siRNA also showed a decreased migration rate in the wound healing assay (Figure 5C,D). These results indicated that the migration ability of GBM cells decreased after HTRA1 knockdown. Finally, in the 3D spheroid invasion assay, we found that the U251MG and GBM#P3 spheroids with loss of HTRA1 exhibited a significantly decreased invasion area compared to the siNC spheroid controls (Figure 5E,F). These indicated that HTRA1 knockdown decreased the invasion ability of GBM cells.
FIGURE 5.
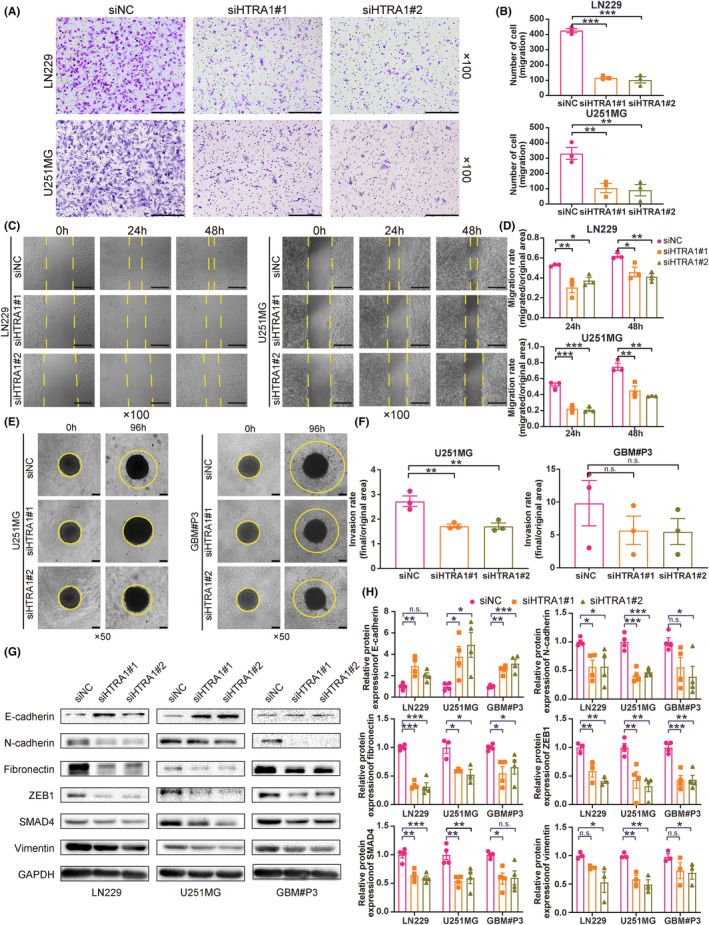
HTRA1 knockdown inhibits cell migration and proliferation of GBM cells in vitro. (A, B) Representative images of transwell assays and cell counting results for LN229 and U251MG cells transfected with HTRA1 siRNAs. Bar = 200 μm. (C, D) Representative images of wound healing assay and migration rates for LN229 and U251MG cells transfected with HTRA1 siRNAs. Bar = 200 μm. (E, F) Representative images of 3D invasion assays and invasion rates for U251MG and GBM#P3 cells transfected with HTRA1 siRNAs. Bar = 100 μm. (G, H) Representative images of western blots and relative expression levels of EMT‐related proteins in lysates prepared from LN229, U251MG and GBM#P3 cells transfected with HTRA1 siRNA. (B, D, F and H), one‐way ANOVA, post hoc Dunnett's test. *P < 0.05; **P < 0.01; ***P < 0.001.
It is well‐known that epithelial‐mesenchymal transition (EMT) plays a crucial role in the migration and invasion of tumor cells. 36 , 37 We, therefore, investigated whether HTRA1 was involved in EMT of GBM cells. We found that expression of mesenchymal markers, including N‐cadherin, fibronectin, SMAD4 and vimentin, as did that of the upstream transcription factor ZEB1, significantly decreased with HTRA1 knockdown (Figure 5G,H). In contrast, the expression of the epithelial marker E‐cadherin increased with HTRA1 knockdown (Figure 5G,H). These results indicated that HTRA1 promoted EMT in GBM cells.
3.5. HTRA1 facilitates the formation of invadopodia and destabilizes microtubules via HDAC6‐mediated deacetylation
To further investigate whether HTRA1 promoted invasion and migration, we evaluated cytoskeleton‐ and microtubule‐based processes in GBM cells transfected with HTRA1 siRNA. We first used phalloidin detection of F‐actin, a protein involved in the formation of invadopodia and cell migration. 38 With knockdown of HTRA1, the percentage of LN229 and U251MG cells with invadopodia significantly decreased (Figure 6A,B). And the expression levels of cortactin, a marker of invadopodia formation, 39 declined after HTRA1 knockdown (Figure 6C,D). These results were consistent with the decreased migration ability observed in wound healing assays (Figure 5C,D). Second, the formation of invadopodia is also previously reported to be correlated with cytoskeleton formation regulated by HDAC6, a deacetylase that causes the deacetylation of α‐tubulin. 40 The increase in ac‐α‐tubulin levels has also been reported to be associated with inhibition of migration and invasion. 41 Our results showed that the protein levels of HDAC6 were decreased, while the protein levels of ac‐α‐tubulin were significantly increased in GBM cells with HTRA1 knockdown (Figure 6C,D). Third, HTRA1 and HDAC6 mRNA levels were positively correlated in the TCGA and CGGA databases (Figure 6E). Besides, immunoprecipitations performed on lysates prepared from LN229‐siHTRA1 cells demonstrated that the interaction between HDAC6 and α‐tubulin was decreased with the knockdown of HTRA1 in GBM cells, and samples with HTRA1 overexpression exhibited reverse results (Figure 6F). Last but not the least, the immunofluorescence detection indicated that the co‐localization of HDAC6 and α‐tubulin was suppressed after downregulation of HTRA1 in GBM cells, and overexpression of HTRA1 enhanced the HDAC6/α‐tubulin co‐localization (Figure 6G).
FIGURE 6.
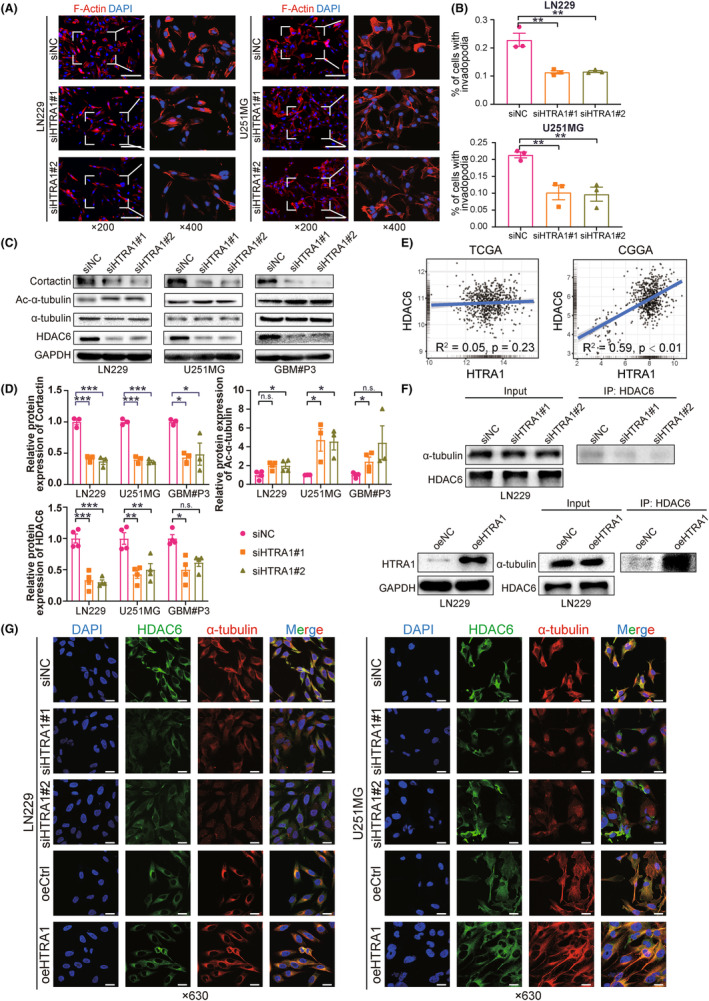
Knockdown of HTRA1 inhibits formation of invadopodia in glioma cells via the HDAC6/Ac‐α‐tubulin pathway. (A, B) Representative fluorescence images of staining of invadopodia and formation rates in LN229 and U251MG cells transfected with HTRA1 siRNAs. Bar = 100 μm. (C, D) Western blots for the detection of Cortactin, HDAC6, α‐tubulin and ac‐α‐tubulin in LN229, U251MG and GBM#P3 cells transfected with HTRA1 siRNA. (E) Correlation analyses for mRNA expression levels of HTRA1 and HDAC6 based on TCGA and CGGA databases. (F) Western blots of lysates prepared from LN229‐siHTRA1 or oeHTRA1 cells (left panel) and immunoprecipitations (right panels) performed with anti‐HDAC6 antibody showing binding of HDAC6 to α‐tubulin in the presence of increased HTRA1. (G) Representative images of immunofluorescence detecting co‐localization between HDAC6 and α‐tubulin in LN229 and U251MG cells transfected with HTRA1 siRNAs or HTRA1 overexpression plasmids. Bar = 25 μm. (B, D), one‐way ANOVA, post hoc Dunnett's test; for ac‐α‐tubulin of LN229 and HDAC6 of GBM#P3 in (D), Kruskal‐Wallis, post hoc Dunn's test. *P < 0.05; **P < 0.01; ***P < 0.001.
These results suggested that HTRA1 promoted cell migration by decreasing ac‐α‐tubulin levels. Thus, increased HTRA1 expression was associated with increased HDAC6 expression, and the HDAC6‐α‐tubulin interaction was enhanced with overexpression of HTRA1. These results were consistent with the presence of an HDAC6/ac‐α‐tubulin axis in GBM cells.
3.6. Knockdown of HTRA1 inhibits GBM cell growth in vivo and prolongs overall survival of tumor‐bearing mice
To study the effect of HTRA1 on in vivo tumor growth, we stably knocked down HTRA1 in LN229 and GBM#P3 cells expressing luciferase. LN229 and GBM#P3 cells expressing luciferase were transduced with lentivirus containing siRNA sequences, and the knockdown efficiency was assessed on western blot (Figure 7A). The results indicated that only shHTRA1#2 efficiently knocked down HTRA1 in both LN229 and GBM#P3 cells. LN229luc‐ and GBM#P3luc‐shHTRA1#2 cells (and controls, ‐shNC) were implanted into the cortex of nude mice brains, and the tumor size was assessed through measurement in vivo bioluminescence at 3, 7, 14, 21 and 28 days after orthotopic implantation. The bioluminescence of both LN229luc‐ and GBM#P3luc‐shHTRA1#2 intracranial tumors was significantly reduced at 21 to 28 days after implantation relative to controls (Figure 7B). In addition, the overall survival of tumor‐bearing animals was significantly longer for the shHTRA1 group than for the shNC group (Figure 7C). In terms of histology, the results of HE staining showed suppressed invasion ability at the margin of xenograft tumor in LN229luc‐ and GBM#P3luc‐shHTRA1#2 group (Figure 8A). IHC revealed decreased expression of mesenchymal markers, including N‐cadherin and fibronectin, as well as cell proliferation marker Ki‐67, in LN229luc‐ and GBM#P3luc‐shHTRA1#2 xenografts relative to shNC controls (Figure 8B,C). In contrast, the number of cells positive for ac‐α‐tubulin was significantly increased in LN229luc‐ and GBM#P3luc‐shHTRA1#2 xenografts relative to shNC controls. These in vivo results confirmed our in vitro results. Taken together, the downregulation of HTRA1 in vivo resulted in suppressed GBM cell proliferation, but increased ac‐α‐tubulin levels.
FIGURE 7.
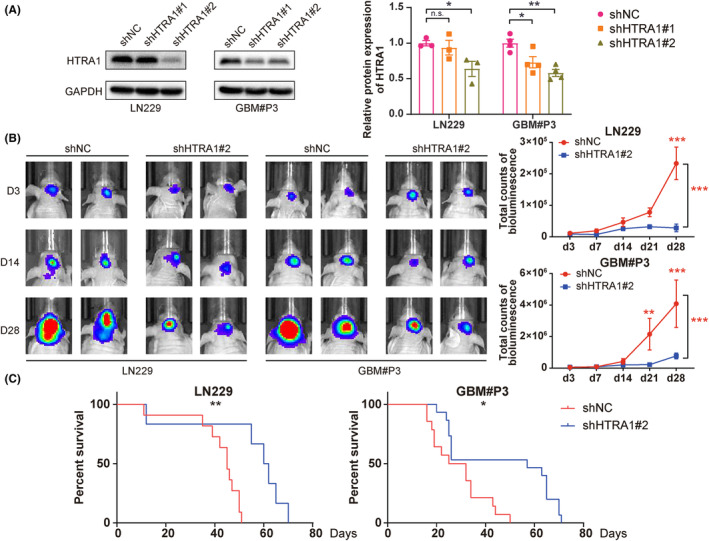
Downregulation of HTRA1 inhibits GBM cell growth in vivo. (A) Western blot results indicating that shHTRA1#2 works well in both LN229 and GBM#P3 cells. (B) Representative images of in vivo tumor imaging and total bioluminescence from day 3 to day 28. (C) Survival rates of LN229‐ and GBM#P3‐shHTRA1 tumor‐bearing mice. (A), one‐way ANOVA, post hoc Dunnett's test; (B), two‐way ANOVA, post hoc Dunnett's test; (C), log‐rank test. *P < 0.05; **P < 0.01; ***P < 0.001.
FIGURE 8.
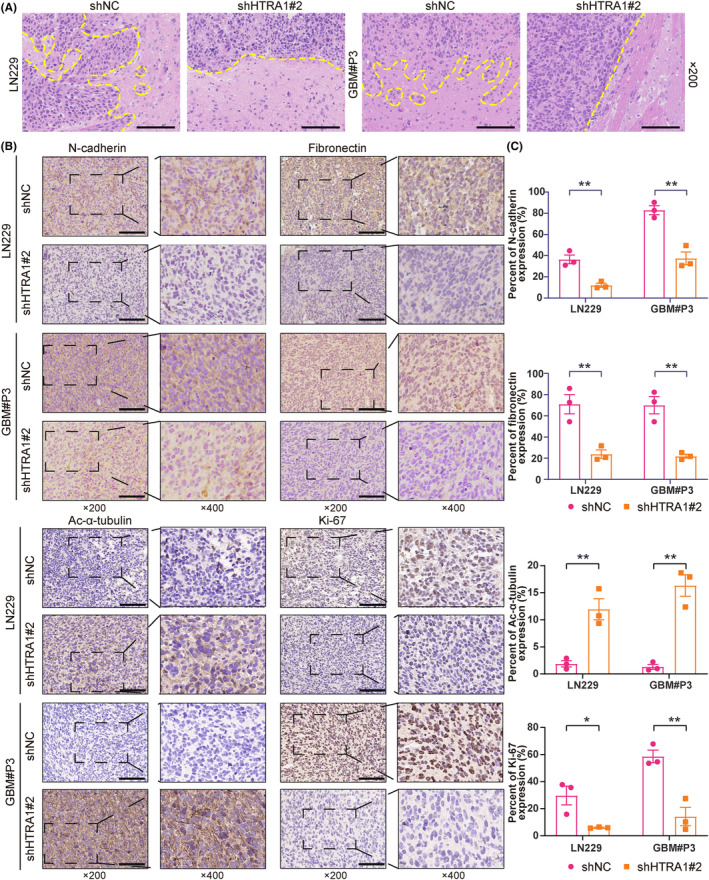
Histologic results showing knockdown of HTRA1 downregulates GBM cell invasion and growth in vivo. (A) Representative images of HE staining showing the margins between xenografts and normal brain. Bar = 100 μm. (B, C) Representative images of immunohistochemistry detecting N‐cadherin, fibronectin, ac‐α‐tubulin and Ki‐67 in LN229‐ and GBM#P3‐shHTRA1 xenografts and the percent of expression of these four proteins. (C), Student's t‐test. *P < 0.05; **P < 0.01. Bar = 100 μm.
4. DISCUSSION
In this study, we found increased HTRA1 expression in gliomas relative to nontumor brain tissue. High HTRA1 expression was associated with the more aggressive glioma molecular subtypes, mesenchymal and classical subtypes. GO and KEGG analysis of HTRA1 coregulated genes revealed enrichment of several pathways related to cell migration and invasion, and knockdown of HTRA1 with siRNA led to reduced migration, invasion and invadopodia formation in GBM cells. HTRA1 knockdown also reduced proliferation but increased apoptosis in cells. Analysis of transcriptome sequencing data from LN229‐ and GBM#P3‐shHTRA1#2 revealed that differentially expressed genes were enriched in pathways related to cell adhesion and migration. In addition, transcription factor analysis demonstrated that the transcription factor SMAD4 might be involved in these gene expression changes often associated with EMT in tumor cells. 42 In vivo orthotopic implantation of modified GBM cells indicated that HTRA1 knockdown inhibited intracranial tumor growth and prolonged overall survival of nude mice.
Glioma is an intracranial tumor type resistant to the current standard of care, and invasion and migration are key properties contributing to this resistance. EMT is an essential and dynamic process driving the invasion and migration of tumor cells. 43 , 44 Here, we report that HTRA1 depletion significantly inhibited the migration and invasion abilities of GBM cells, and mesenchymal markers, including ZEB1, N‐cadherin, vimentin, fibronectin and CD44, decreased, while the epithelial marker E‐cadherin increased. Changes in the F‐actin cytoskeleton was consistent with the suppression of the formation of invadopodia, which are protrusions of the cell membrane that are rich in F‐actin and facilitate the dissemination of tumor cells. 45 Previous reports indicate that HDAC6 is involved in cytoskeletal organization as well as invadopodia formation through deacetylation of α‐tubulin. 40 HDAC6 is a member of the HDAC family that is mainly located in the cytoplasm and promotes tumor cell migration and invasion through deacetylation of α‐tubulin and cortactin, which destabilizes the cytoskeleton. 46 HDAC6 expression decreased in GBM cells with HTRA1 depletion, while ac‐α‐tubulin increased. These results indicated that HTRA1 depletion led to decreased migration and invasion by enhancing the stability of the cytoskeleton. We also observed an increase of interaction between HDAC6 and α‐tubulin when HTRA1 was over expressed, but the activity of HTRA1 on HDAC6 requires further investigation.
HTRA1 has been reported to promote apoptosis in many types of tumor cells, such as esophageal squamous cell carcinoma 47 and pancreatic cancer cells. 48 Our study demonstrated that apoptosis was enhanced in GBM cells with depletion of HTRA1, and markers of apoptosis were also correspondingly regulated. These results indicated that HTRA1 inhibited apoptosis in human GBM cells.
Our findings are consistent with a role for HTRA1 as an oncogene in GBM cells. These results support a previous study on gastric cancer, 12 in which HTRA1 was reported to induce the transdifferentiation of fibroblasts into cancer‐associated fibroblasts by activating the NF‐κB/bFGF pathway. In addition, HTRA1 was recently reported to promote tumor metastasis by binding to the pro‐oncogenic protein PITPNC1. 49 On the other hand, HTRA1 is widely regarded as a tumor suppressor. HTRA1 was shown to suppress the proliferation of tumor cells by inhibiting Wnt/β‐catenin through complexing with β‐catenin. 11 Moreover, HTRA1 was reported to suppress angiogenesis in cancer stromal cells by activating the Notch pathway. 7
A limitation of this study is that we did not‐test any HTRA1 inhibitor in vivo to explore its translational utility. Most of the known inhibitors, such as galegenimab, 50 6‐boroV 51 and NVP‐LBG976 52 were reported as peptide inhibitors so it would be hard for them to pass through brain–blood barrier. Thus, it is likely that small molecules that inhibit HTRA1 may be beneficial for glioma treatment in vivo and further studies are required for confirmation.
In summary, the role of HTRA1 as an oncogene or tumor suppressor might be dependent on cellular context. Our work indicates that HTRA1 might promote the development of human glioma by enhancing cell migration and invasion. However, the molecular mechanisms underlying HTRA1 activity in glioma requires further investigation.
5. CONCLUSION
Our current research provides evidences that HTRA1 might be a carcinogenic gene in glioma cells. HTRA1 also promoted migration of glioma cells. This effect might be mediated via downregulating acetylated α‐tubulin by facilitating HDAC6 expression. Our work explores the role of HTRA1 in glioma cells and also provides new insights for the infiltration of glioma cells.
AUTHOR CONTRIBUTIONS
Wenbo Zhao conducted all experiments. Shuai Wang collected and analyzed data. Feihu Zhao and Wenyu Liu helped to conduct animal experiments. Zhiyi Xue, Lin Zhang, Jian Wang and Mingzhi Han wrote the manuscript. Xingang Li and Bin Huang designed all experiments.
CONFLICT OF INTEREST STATEMENT
The authors declare no conflict of interest.
Supporting information
Figure S1.
Figure S2.
Figure S3.
Figure S4.
Figure S5.
Data S1.
ACKNOWLEDGMENTS
This work was supported by the Department of Science & Technology of Shandong Province (ZR2019ZD33, ZR2019PH042 and 2020CXGC010903), the Special Foundation for Taishan Scholars (ts20110814), the Clinical Research Center of Shandong University (2020SDUCRCB002), the Research Project of Jinan Microecological Biomedicine Shandong Laboratory (JNL‐2022003A and JNL‐2022042C) and the Shandong Provincial Laboratory Project (SYS202202).
Zhao W, Wu Y, Wang S, et al. HTRA1 promotes EMT through the HDAC6/Ac‐α‐tubulin pathway in human GBM cells. CNS Neurosci Ther. 2024;30:e14605. doi: 10.1111/cns.14605
Contributor Information
Xingang Li, Email: lixg@sdu.edu.cn.
Bin Huang, Email: hb@sdu.edu.cn.
DATA AVAILABILITY STATEMENT
Data are available upon reasonable request from the corresponding author.
REFERENCES
- 1. Li Y, Yuan J, Rothzerg E, et al. Molecular structure and the role of high‐temperature requirement protein 1 in skeletal disorders and cancers. Cell Prolif. 2020;53(2):e12746. [DOI] [PMC free article] [PubMed] [Google Scholar]
- 2. Figaj D, Gieldon A, Polit A, et al. The LA loop as an important regulatory element of the HtrA (DegP) protease from Escherichia coli: structural and functional studies. J Biol Chem. 2014;289(22):15880‐15893. [DOI] [PMC free article] [PubMed] [Google Scholar]
- 3. Baldi A, De Luca A, Morini M, et al. The HtrA1 serine protease is down‐regulated during human melanoma progression and represses growth of metastatic melanoma cells. Oncogene. 2002;21(43):6684‐6688. [DOI] [PubMed] [Google Scholar]
- 4. Zhao Z, Li H, Wang C, Xu W, Sun J, Zhao W. Serine protease HtrA1 as an inhibitor on proliferation invasion and migration of gastric cancer. Med Oncol. 2015;32(4):112. [DOI] [PubMed] [Google Scholar]
- 5. De Luca A, De Falco M, Severino A, et al. Distribution of the serine protease HtrA1 in normal human tissues. J Histochem Cytochem. 2003;51(10):1279‐1284. [DOI] [PubMed] [Google Scholar]
- 6. An E, Sen S, Park SK, Gordish‐Dressman H, Hathout Y. Identification of novel substrates for the serine protease HTRA1 in the human RPE secretome. Invest Ophthalmol Vis Sci. 2010;51(7):3379‐3386. [DOI] [PMC free article] [PubMed] [Google Scholar]
- 7. Klose R, Adam MG, Weis EM, et al. Inactivation of the serine protease HTRA1 inhibits tumor growth by deregulating angiogenesis. Oncogene. 2018;37(31):4260‐4272. [DOI] [PubMed] [Google Scholar]
- 8. Bao W, Zhu F, Duan Y, Yang Y, Cai H. HtrA1 resensitizes multidrug‐resistant hepatocellular carcinoma cells by targeting XIAP. Biomed Pharmacother. 2015;70:97‐102. [DOI] [PubMed] [Google Scholar]
- 9. Chien J, Ota T, Aletti G, et al. Serine protease HtrA1 associates with microtubules and inhibits cell migration. Mol Cell Biol. 2009;29(15):4177‐4187. [DOI] [PMC free article] [PubMed] [Google Scholar]
- 10. Zurawa‐Janicka D, Skorko‐Glonek J, Lipinska B. HtrA proteins as targets in therapy of cancer and other diseases. Expert Opin Ther Targets. 2010;14(7):665‐679. [DOI] [PubMed] [Google Scholar]
- 11. Globus O, Evron T, Caspi M, Siman‐Tov R, Rosin‐Arbesfeld R. High‐temperature requirement A1 (Htra1) ‐ a novel regulator of canonical Wnt signaling. Sci Rep. 2017;7(1):17995. [DOI] [PMC free article] [PubMed] [Google Scholar]
- 12. Wu H, Ma S, Xiang M, Tong S. HTRA1 promotes transdifferentiation of normal fibroblasts to cancer‐associated fibroblasts through activation of the NF‐κB/bFGF signaling pathway in gastric cancer. Biochem Biophys Res Commun. 2019;514(3):933‐939. [DOI] [PubMed] [Google Scholar]
- 13. Beaufort N, Scharrer E, Kremmer E, et al. Cerebral small vessel disease‐related protease HtrA1 processes latent TGF‐β binding protein 1 and facilitates TGF‐β signaling. Proc Natl Acad Sci USA. 2014;111(46):16496‐16501. [DOI] [PMC free article] [PubMed] [Google Scholar]
- 14. Friedrich U, Datta S, Schubert T, et al. Synonymous variants in HTRA1 implicated in AMD susceptibility impair its capacity to regulate TGF‐β signaling. Hum Mol Genet. 2015;24(22):6361‐6373. [DOI] [PubMed] [Google Scholar]
- 15. Hara K, Shiga A, Fukutake T, et al. Association of HTRA1 mutations and familial ischemic cerebral small‐vessel disease. N Engl J Med. 2009;360(17):1729‐1739. [DOI] [PubMed] [Google Scholar]
- 16. Chien J, Staub J, Hu SI, et al. A candidate tumor suppressor HtrA1 is downregulated in ovarian cancer. Oncogene. 2004;23(8):1636‐1644. [DOI] [PubMed] [Google Scholar]
- 17. Shridhar V, Sen A, Chien J, et al. Identification of underexpressed genes in early‐ and late‐stage primary ovarian tumors by suppression subtraction hybridization. Cancer Res. 2002;62(1):262‐270. [PubMed] [Google Scholar]
- 18. Bowden MA, Di Nezza‐Cossens LA, Jobling T, et al. Serine proteases HTRA1 and HTRA3 are down‐regulated with increasing grades of human endometrial cancer. Gynecol Oncol. 2006;103(1):253‐260. [DOI] [PubMed] [Google Scholar]
- 19. Narkiewicz J, Lapinska‐Szumczyk S, Zurawa‐Janicka D, Skorko‐Glonek J, Emerich J, Lipinska B. Expression of human HtrA1, HtrA2, HtrA3 and TGF‐beta1 genes in primary endometrial cancer. Oncol Rep. 2009;21(6):1529‐1537. [DOI] [PubMed] [Google Scholar]
- 20. Zurawa‐Janicka D, Kobiela J, Galczynska N, et al. Changes in expression of human serine protease HtrA1, HtrA2 and HtrA3 genes in benign and malignant thyroid tumors. Oncol Rep. 2012;28(5):1838‐1844. [DOI] [PubMed] [Google Scholar]
- 21. Tang H, Leung L, Saturno G, et al. Lysyl oxidase drives tumour progression by trapping EGF receptors at the cell surface. Nat Commun. 2017;8:14909. [DOI] [PMC free article] [PubMed] [Google Scholar]
- 22. Tang Z, Kang B, Li C, Chen T, Zhang Z. GEPIA2: an enhanced web server for large‐scale expression profiling and interactive analysis. Nucleic Acids Res. 2019;47(W1):W556‐w560. [DOI] [PMC free article] [PubMed] [Google Scholar]
- 23. Bowman RL, Wang Q, Carro A, Verhaak RGW, Squatrito M. GlioVis data portal for visualization and analysis of brain tumor expression datasets. Neuro Oncol. 2017;19(1):139‐141. [DOI] [PMC free article] [PubMed] [Google Scholar]
- 24. Zhang Z, Zeng X, Wu Y, Liu Y, Zhang X, Song Z. Cuproptosis‐related risk score predicts prognosis and characterizes the tumor microenvironment in hepatocellular carcinoma. Front Immunol. 2022;13:925618. [DOI] [PMC free article] [PubMed] [Google Scholar]
- 25. Wang H, Chen Z, Wang S, et al. TGFβ1‐induced beta‐site APP‐cleaving enzyme 2 upregulation promotes tumorigenesis through the NF‐κB signalling pathway in human gliomas. Mol Oncol. 2020;14(2):407‐425. [DOI] [PMC free article] [PubMed] [Google Scholar]
- 26. Poddar NK, Maurya SK, Saxena V. Role of serine proteases and inhibitors in cancer. Proteases in Physiology and Pathology. Springer Singapore; 2017:257‐287. [Google Scholar]
- 27. Zheng L, Wang X, Zheng W, Huang H. Serine protease 3 promotes progression of diffuse large B‐cell lymphoma and serves as a novel prognostic predictor. Dis Markers. 2022;2022:1254790. [DOI] [PMC free article] [PubMed] [Google Scholar]
- 28. Marvin SG, Torres KE, McCormick DL. Serine proteases as targets for prostate cancer prevention: identification by analysis of differential gene expression in rodent and human prostate cancers. Cancer Res. 2010;70(8_Supplement):967. [Google Scholar]
- 29. Liu Q, Guo L, Zhang S, Wang J, Lin X, Gao F. PRSS1 mutation: a possible pathomechanism of pancreatic carcinogenesis and pancreatic cancer. Mol Med. 2019;25(1):44. [DOI] [PMC free article] [PubMed] [Google Scholar]
- 30. Tan Z, Gao L, Wang Y, et al. PRSS contributes to cetuximab resistance in colorectal cancer. Sci Adv. 2020;6(1):eaax5576. [DOI] [PMC free article] [PubMed] [Google Scholar]
- 31. Li D, Xia L, Huang P, et al. Serine protease PRSS56, a novel cancer‐testis antigen activated by DNA hypomethylation, promotes colorectal and gastric cancer progression via PI3K/AKT axis. Cell Biosci. 2023;13(1):124. [DOI] [PMC free article] [PubMed] [Google Scholar]
- 32. Fedele M, Cerchia L, Pegoraro S, Sgarra R, Manfioletti G. Proneural‐mesenchymal transition: phenotypic plasticity to acquire multitherapy resistance in glioblastoma. Int J Mol Sci. 2019;20(11):2746. [DOI] [PMC free article] [PubMed] [Google Scholar]
- 33. Wang YL, Wu WR, Lin PL, et al. The functions of PCNA in tumor Stemness and invasion. Int J Mol Sci. 2022;23(10):5679. [DOI] [PMC free article] [PubMed] [Google Scholar]
- 34. Hoxhaj G, Manning BD. The PI3K‐AKT network at the interface of oncogenic signalling and cancer metabolism. Nat Rev Cancer. 2020;20(2):74‐88. [DOI] [PMC free article] [PubMed] [Google Scholar]
- 35. Brinkmann K, Ng AP, de Graaf CA, Strasser A. What can we learn from mice lacking pro‐survival BCL‐2 proteins to advance BH3 mimetic drugs for cancer therapy? Cell Death Differ. 2022;29(6):1079‐1093. [DOI] [PMC free article] [PubMed] [Google Scholar]
- 36. Pastushenko I, Blanpain C. EMT transition states during tumor progression and metastasis. Trends Cell Biol. 2019;29(3):212‐226. [DOI] [PubMed] [Google Scholar]
- 37. Chiu HC, Li CJ, Yiang GT, Tsai A, Wu MY. Epithelial to mesenchymal transition and cell biology of molecular regulation in endometrial carcinogenesis. J Clin Med. 2019;8(4):439. [DOI] [PMC free article] [PubMed] [Google Scholar]
- 38. Seetharaman S, Etienne‐Manneville S. Cytoskeletal Crosstalk in Cell Migration. Trends Cell Biol. 2020;30(9):720‐735. [DOI] [PubMed] [Google Scholar]
- 39. Ren XL, Qiao YD, Li JY, et al. Cortactin recruits FMNL2 to promote Actin polymerization and endosome motility in invadopodia formation. Cancer Lett. 2018;419:245‐256. [DOI] [PubMed] [Google Scholar]
- 40. Balmik AA, Sonawane SK, Chinnathambi S. The extracellular HDAC6 ZnF UBP domain modulates the Actin network and post‐translational modifications of tau. Cell Commun Signal. 2021;19(1):49. [DOI] [PMC free article] [PubMed] [Google Scholar]
- 41. Ge LP, Jin X, Yang YS, et al. Tektin4 loss promotes triple‐negative breast cancer metastasis through HDAC6‐mediated tubulin deacetylation and increases sensitivity to HDAC6 inhibitor. Oncogene. 2021;40(12):2323‐2334. [DOI] [PubMed] [Google Scholar]
- 42. Rasti A, Madjd Z, Saeednejad Zanjani L, et al. SMAD4 expression in renal cell carcinomas correlates with a stem‐cell phenotype and poor clinical outcomes. Front Oncol. 2021;11:581172. [DOI] [PMC free article] [PubMed] [Google Scholar]
- 43. Iser IC, Pereira MB, Lenz G, Wink MR. The epithelial‐to‐mesenchymal transition‐like process in glioblastoma: An updated systematic review and in Silico investigation. Med Res Rev. 2017;37(2):271‐313. [DOI] [PubMed] [Google Scholar]
- 44. Kahlert UD, Nikkhah G, Maciaczyk J. Epithelial‐to‐mesenchymal(−like) transition as a relevant molecular event in malignant gliomas. Cancer Lett. 2013;331(2):131‐138. [DOI] [PubMed] [Google Scholar]
- 45. Mgrditchian T, Sakalauskaite G, Müller T, et al. The multiple roles of Actin‐binding proteins at invadopodia. Int Rev Cell Mol Biol. 2021;360:99‐132. [DOI] [PubMed] [Google Scholar]
- 46. Li T, Zhang C, Hassan S, et al. Histone deacetylase 6 in cancer. J Hematol Oncol. 2018;11(1):111. [DOI] [PMC free article] [PubMed] [Google Scholar]
- 47. Xia J, Wang F, Wang L, Fan Q. Elevated serine protease HtrA1 inhibits cell proliferation, reduces invasion, and induces apoptosis in esophageal squamous cell carcinoma by blocking the nuclear factor‐κB signaling pathway. Tumour Biol. 2013;34(1):317‐328. [DOI] [PubMed] [Google Scholar]
- 48. Cheng H, Zhu H, Cao M, et al. HtrA1 suppresses the growth of pancreatic cancer cells by modulating Notch‐1 expression. Braz J Med Biol Res. 2018;52(1):e7718. [DOI] [PMC free article] [PubMed] [Google Scholar]
- 49. Halberg N, Sengelaub CA, Navrazhina K, Molina H, Uryu K, Tavazoie SF. PITPNC1 recruits RAB1B to the Golgi network to drive malignant secretion. Cancer Cell. 2016;29(3):339‐353. [DOI] [PMC free article] [PubMed] [Google Scholar]
- 50. Khanani AM, Hershberger VS, Pieramici DJ, et al. Phase 1 study of the anti‐HtrA1 antibody‐binding fragment FHTR2163 in geographic atrophy secondary to age‐related macular degeneration. Am J Ophthalmol. 2021;232:49‐57. [DOI] [PubMed] [Google Scholar]
- 51. Oura Y, Nakamura M, Takigawa T, et al. High‐temperature requirement a 1 causes photoreceptor cell death in zebrafish disease models. Am J Pathol. 2018;188(12):2729‐2744. [DOI] [PubMed] [Google Scholar]
- 52. Grau S, Baldi A, Bussani R, et al. Implications of the serine protease HtrA1 in amyloid precursor protein processing. Proc Natl Acad Sci USA. 2005;102(17):6021‐6026. [DOI] [PMC free article] [PubMed] [Google Scholar]
Associated Data
This section collects any data citations, data availability statements, or supplementary materials included in this article.
Supplementary Materials
Figure S1.
Figure S2.
Figure S3.
Figure S4.
Figure S5.
Data S1.
Data Availability Statement
Data are available upon reasonable request from the corresponding author.


