

Abstract
This study aims to construct and evaluate a deep learning model, utilizing ultrasound images, to accurately differentiate benign and malignant thyroid nodules. The objective includes visualizing the model’s process for interpretability and comparing its diagnostic precision with a cohort of 80 radiologists. We employed ResNet as the classification backbone for thyroid nodule prediction. The model was trained using 2096 ultrasound images of 655 distinct thyroid nodules. For performance evaluation, an independent test set comprising 100 cases of thyroid nodules was curated. In addition, to demonstrate the superiority of the artificial intelligence (AI) model over radiologists, a Turing test was conducted with 80 radiologists of varying clinical experience. This was meant to assess which group of radiologists’ conclusions were in closer alignment with AI predictions. Furthermore, to highlight the interpretability of the AI model, gradient-weighted class activation mapping (Grad-CAM) was employed to visualize the model’s areas of focus during its prediction process. In this cohort, AI diagnostics demonstrated a sensitivity of 81.67%, a specificity of 60%, and an overall diagnostic accuracy of 73%. In comparison, the panel of radiologists on average exhibited a diagnostic accuracy of 62.9%. The AI’s diagnostic process was significantly faster than that of the radiologists. The generated heat-maps highlighted the model’s focus on areas characterized by calcification, solid echo and higher echo intensity, suggesting these areas might be indicative of malignant thyroid nodules. Our study supports the notion that deep learning can be a valuable diagnostic tool with comparable accuracy to experienced senior radiologists in the diagnosis of malignant thyroid nodules. The interpretability of the AI model’s process suggests that it could be clinically meaningful. Further studies are necessary to improve diagnostic accuracy and support auxiliary diagnoses in primary care settings.
Keywords: Thyroid nodules, deep learning, ResNet, diagnostic accuracy, Grad-CAM, AI interpretability, ultrasound images
Impact Statement
First, the time artificial intelligence (AI) needed for diagnosis was significantly shorter than the entire panel of radiologists. Second, deep learning is a valuable tool in differentiating benign and malignant thyroid nodules. Third, the interpretable method was applied to explore the AI prediction principle.
Introduction
Thyroid nodules, common incidental findings in clinical practice, are discrete, non-palpable thyroid masses, radiologically distinct from the surrounding parenchyma. They affect an estimated 4–7% of the adult population, or approximately 16 million people in the United States.1,2 The advent of ultrasound imaging has significantly increased detection rates, with nodules found in as many as 219 million adult patients in the United States, a number similar to estimations from autopsy studies.1,3 The prevalence of thyroid nodules can fluctuate based on the diagnostic technology employed, with ultrasound having the highest detection rate at 65%. 4
While the majority of thyroid nodules are benign or asymptomatic, accounting for 90–95% of cases, it is essential to distinguish the ones that harbor cancer such as papillary thyroid carcinoma (~10%) or cause compressive symptoms or thyroid dysfunction (~5%).1,5 This discernment has significant public health implications, considering the incidence rate of thyroid cancer was reported as 17.09/100,000 in Beijing alone, with 3491 new cases diagnosed in 2014. 6
Artificial intelligence (AI) and deep learning algorithms have revolutionized the medical imaging field.7–9 AI technology can perform tasks requiring human intelligence, and deep learning uses multi-layered computational models to learn feature representations from large data sets, contributing to accurate disease classification.10,11 A derivative of deep learning, convolutional neural networks (CNNs), has transformed how we interpret two-dimensional (2D) ultrasound images by enabling the model to learn a hierarchy of features automatically.12,13 This innovation reduces the potential for inconsistent diagnoses or misdiagnoses due to inter-personnel variation in training, experience, or disparities in equipment quality.12,14
However, a challenge with the widespread adoption of AI in healthcare has been its “black box” nature. The algorithms that drive AI decision-making are often opaque, hindering clinical understanding and acceptance.15,16 To address this, we applied gradient-weighted class activation mapping (Grad-CAM) to visualize the region of interest (ROI) during AI diagnosis. This step allows clinicians to understand the rationale behind AI’s decisions, thereby increasing its credibility and acceptance in the clinical setting.
In this study, we aimed to construct and evaluate a CNN model tailored for thyroid ultrasound images. The model is designed to differentiate benign and malignant thyroid neoplasms using morphometric features extracted from ultrasound images of thyroid nodules. Diagnoses were validated by fine-needle aspiration cytology (FNAC) or histopathology. The model’s diagnostic accuracy was then benchmarked against a panel of radiologists, emphasizing its potential optimized performance within specific clinical settings, especially for patients with thyroid nodules over 18 years old.
The diagnoses were confirmed by FNAC or histopathology. We then compared the diagnostic accuracy of this CNN model with that of a panel of radiologists to determine its potential utility in a clinical setting.
Materials and methods
Patients and data set
This retrospective study was approved by the institutional review board at the Beijing Friendship Hospital of Capital Medical University (approval no. 2016 P2-071-02). Informed consent was obtained from the enrolled patients. We reviewed the 3566 ultrasound images of 1082 thyroid nodules at our center between June 2016 and September 2017 from patients over 18 years old. The following inclusion criteria were applied for this study: (1) the patients with malignant thyroid nodules (PTC, other types) underwent thyroidectomy and histopathological analysis; (2) the patients with benign thyroid nodules were diagnosed by FNAC and histopathological examination with 6-month follow-up; (3) all patients with preoperative ultrasound images of thyroid nodules; (4) the patients with available surgical pathology or cytological pathology results. We excluded the cases with incomplete cytology and/or surgical results.
There were a total of 2906 images of nodule target regions from 655 thyroid nodule cases that were selected according to the criteria, of which the ratio of benign to malignant nodules is approximately 1:1 as the training set. To uniform the input size of the ResNet model, all images were reshaped into 256 × 256 pixels. For model performance evaluation and human-machine competition, 100 cases between October 2017 and November 2017 (50 benign nodules and 50 malignant nodules) were collected as an independent test set.
Thyroid ultrasound examination
All ultrasound examinations were performed by one radiologist using HI VISION ASCENDUS (HITACHI, Japan) equipped with a 5 to 12 MHz linear-array transducer. The ultrasound images of thyroid nodules were obtained for the transverse and sagittal images using a standardized protocol. Each thyroid nodule was displayed with measurements and Doppler flow images. The suspicious thyroid nodules were classified according to the thyroid imaging reporting and data system (TI-RADS). 5 TI-RADS categorizes thyroid nodules from TI-RADS 2 (benign) to TI-RADS 6 (biopsy-proven malignant), with categories 3–5 indicating increasing suspicion levels. All the images with TI-RADS categories 3–6 were included in the training set. The details of training and test sets are recorded in Supplemental Table S1.
AI model development and training strategy
The AI model used in this study was based on an open-source CNN, RetinaNet. This CNN identifies and classifies lesions by setting an anchor and bounding box, thereby eliminating the need to separate the foreground from the background. We specifically implemented Residual Network-50 (ResNet-50), a highly advanced CNN technique for distinguishing benign and malignant thyroid nodules. With 50 layers and 3.8 billion free parameters in the network, ResNet-50 excels at convolution, pooling, and corresponding parameters. Its design also effectively curbs over-fitting, particularly through the use of dropout layers, making it an ideal network for our study.
Our CNN model design consisted of three major components: (1) image data processing, (2) important image feature extraction and model building, and (3) CNN model training. Data processing included three operations: image preprocessing (format conversion and noise removal), data normalization (dimension reconstruction and pixel unification), and image segmentation, where ultrasound images were processed using the Level Set Method (LSM; see Supplemental Figures S1 to S3). LSM is a mathematical technique that evolves contours based on the image’s features to identify regions of interest. This method allowed us to refine and prepare the ultrasound images for subsequent post-processing. 17
Following this, we extracted distinct image characteristics of different thyroid nodules through the convolution and pooling layer design, and employed the deep learning neural network model. Finally, we trained and optimized the model using multithread technology and parallel computing. The model underwent training for 100 epochs by the Adam optimizer with a learning rate of 0.0001, and the cross-entropy loss function was used
| (1) |
y and present the target label and prediction, respectively.
To avoid overfitting, we implemented a 10-fold cross-validation method. To further prevent overfitting, dropout layers were incorporated into the architecture, as they randomly drop out neurons during training, ensuring the model does not rely too heavily on any specific neuron. The project was developed on PyTorch(v1.10.0) and Python (v3.8.5) and ran on a server equipped with an NVIDIA GeForce RTX 3060 (12 GB) GPU.
Gradient-weighted CAM
Grad-CAM was utilized to visualize AI interpretation, showing how the AI diagnoses thyroid nodules on ultrasound images. Grad-CAM highlights AI’s areas of focus during diagnosis, creating a thermal map for an intuitive understanding of AI’s decision-making process. 18 It generates a coarse localization heat map showing the ROI in the input image during prediction, based on the gradients of the specific class concept flowing into the final convolutional layer. 19
Human-machine competition
To compare the diagnostic abilities of the AI and radiologists, we assembled a panel of 80 radiologists from eight different hospitals and private practices. Based on their clinical experience, they were divided into four groups: Group 1, “Residents” with 2 to 5 years of experience; Group 2, “Attending” with 6 to 10 years of experience; Group 3, “Chief” with more than 10 years of experience; and Group 4, “Other” for those (interns or students) with less than 2 years (see Figure 1). Both the radiologists and AI model were tested on the same independent test set, and the area under the receiver operating characteristic (ROC) curves (AUCs) score was calculated as the criterion for evaluation.
Figure 1.
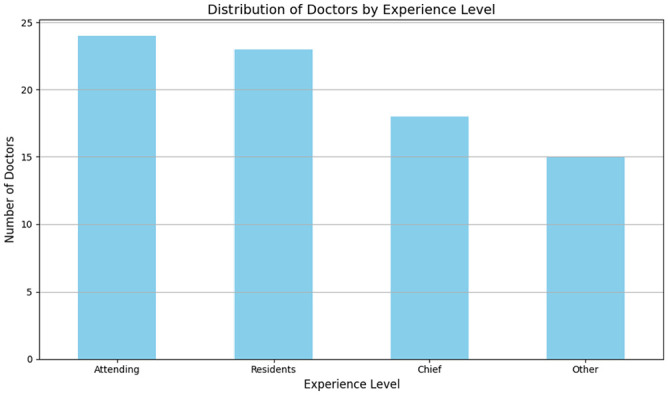
Distribution of radiologists based on clinical experience: Junior (0–3 years’ post-graduation), Intermediate (4–7 years of practice), and Senior (8 years and beyond).
Evaluation methods and statistical analysis
SPSS (Version 19; IBM, New York) software was utilized to analyze the data. Multiple parameters were recorded and calculated. The classification performance includes (sensitivity, specificity, and accuracy) shown below, and the diagnostic time of radiologists and AI were calculated and compared by the two-tailed Student’s t-test
| (2) |
| (3) |
| (4) |
where TP is true positive, TN is true negative, FP is false positive, and FN is false negative.
The AUCs were assessed by the ROC curve. A comparison of consistency between histopathology diagnosis and diagnosis of radiologists/AI was completed by the McNemar test. The threshold for statistical significance was set at P < 0.05.
Results
In this study, both AI and radiologists analyzed a set of ultrasound images derived from 300 cases for the independent testing set, and a separate set of 100 cases for the comparison with radiologists. The diagnoses of these specimens were confirmed through histopathology evaluations, consisting of 115 benign and 185 malignant thyroid tumors for the independent set and 40 benign and 60 malignant thyroid tumors for the comparison set. On the independent test set of 300 ultrasound images, AI accurately identified 90 benign and 155 malignant cases, achieving a sensitivity of 83.78%, a specificity of 73.91%, a diagnostic accuracy of 80.00%, and an AUC of 0.79. Table 1 provides a detailed breakdown of the diagnostic accuracy of the radiologist panel, including their clinical experiences and the difficulty levels of the imaging diagnostics. To better understand the challenges faced during diagnosis, we introduced a classification system for the difficulty levels of the cases. This system was based on the percentage of consensus among the radiologists. Specifically, cases were labeled as “Difficult” when less than 50% of radiologists agreed on the diagnosis. “Intermediate” cases had a consensus agreement between 50% and 80%. Finally, “Simple” cases were those where more than 80% of radiologists had a mutual diagnosis. This classification was intended to reflect the inherent complexity and ambiguity of certain cases and provide a contextual understanding of the diagnostic challenges. In this cohort of samples, AI accurately diagnosed 24 benign cases and 49 malignant cases, with 81.67% sensitivity, 60% specificity, and 73% diagnostic accuracy (see Figure 2). Meanwhile, in the panel of radiologists, the best performer (D51) accurately diagnosed 30 benign cases and 46 malignant cases, with 76.67% sensitivity, 75% specificity, and 76% diagnostic accuracy. In stark contrast, the lowest-performing radiologist (D71) managed only a 46% diagnostic accuracy, correctly identifying 25 benign and 21 malignant cases, and yielding a sensitivity and specificity of 35% and 62.5%, respectively. These details can be found in Tables 1 and 2. Our analysis revealed that the diagnostic capacity of AI and the best radiologist in the panel (D51) was comparable (P = 0.083) as shown in Table 3. Regardless of the clinical experiences of these radiologists, the time AI needed for diagnosis was significantly shorter than the entire panel (P < 0.001), as highlighted in Table 4 (P < 0.001).
Table 1.
Diagnostic accuracy of the panel of radiologists.
| Parameters | Value | |
|---|---|---|
| Histopathology diagnosis (n (%)) | Benign | 40 (40%) |
| Malignant | 60 (60%) | |
| Clinical experiences of the radiologists (n (%)) | Resident | 32 (40%) |
| Attending | 20 (25%) | |
| Chief | 16 (20%) | |
| Other | 12 (15%) | |
| Percentage of accurate imaging diagnosis (%) a | Mean ± SD | 62.93% ± 21.49 |
| Range | 5–97.5% | |
| Difficulty of imaging diagnostics (n (%)) b | Difficult | 24 (24%) |
| Intermediate | 53 (53%) | |
| Simple | 23 (23%) |
SD: standard deviation.
The ratio of radiologists who correctly performed imaging diagnosis in the entire panel.
Difficult cases are defined < 50% of accurate imaging diagnosis, intermediate cases 50–80%, and simple cases ⩾ 80%.
Figure 2.

Comparative diagnostic metrics of AI and radiologists.
Table 2.
Consistency of the diagnoses from AI, radiologists, and histopathology evaluation.
| Histopathology | Total | P | Kappa (95% CI) | Specificity (%) | Sensitivity (%) | |||
|---|---|---|---|---|---|---|---|---|
| Benign | Malignant | |||||||
| AI | Benign | 24 (60%) | 11 (18.33%) | 35 (35%) | 0.336 | 0.426 (0.244, 0.607) | 60.00 | 81.67 |
| Malignant | 16 (40%) | 49 (81.67%) | 65 (65%) | |||||
| D51 a | Benign | 30 (75%) | 14 (23.33%) | 44 (44%) | 0.4142 | 0.508 (0.338, 0.678) | 75.00 | 76.67 |
| Malignant | 10 (25%) | 46 (76.67%) | 56 (56%) | |||||
| D71 a | Benign | 25 (62.5%) | 39 (65%) | 64 (64%) | 0.001 | –0.023 (–0.198, 0.152) | 62.50 | 35.00 |
| Malignant | 15 (37.5%) | 21 (35%) | 36 (36%) | |||||
CI: confidence interval; AI: artificial intelligence.
D51: the radiologist with the highest diagnostic accuracy; D71: the radiologist with the lowest diagnostic accuracy.
Table 3.
Consistency of the diagnoses from AI and radiologists.
| AI diagnosis | Total | P | Kappa (95% CI) | |||
|---|---|---|---|---|---|---|
| Benign | Malignant | |||||
| D51 a | Benign | 26 (74.29%) | 18 (27.69%) | 44 (44%) | 0.083 | 0.330 (0.264, 0.616) |
| Malignant | 9 (25.71%) | 47 (72.31%) | 56 (56%) | |||
| D71 a | Benign | 24 (68.57%) | 40 (61.54%) | 64 (64%) | < 0.001 | 0.059 (–0.104, 0.222) |
| Malignant | 11 (31.43%) | 25 (38.46%) | 36 (36%) | |||
AI: artificial intelligence; CI: confidence interval.
D51: the radiologist with the highest diagnostic accuracy; D71: the radiologist with the lowest diagnostic accuracy.
Table 4.
The comparison of diagnosis time (min) between AI and radiologists with varied experiences.
| Groups | No. | Mean ± SD | Range (min, max) | P a |
|---|---|---|---|---|
| AI | – | 8.57 | – | |
| Radiologists b | 80 | 20.80 ± 5.26 | 27.05 (7.07, 34.12) | < 0.001 |
| Group 1 | 32 | 19.51 ± 4.82 | 17.30 (12.63, 29.93) | < 0.001 |
| Group 2 | 20 | 22.97 ± 4.47 | 16.13 (13.98, 30.12) | < 0.001 |
| Group 3 | 16 | 22.19 ± 3.43 | 12.32 (16.30, 28.62) | < 0.001 |
| Group 4 | 12 | 18.75 ± 7.86 | 27.05 (7.07, 34.12) | 0.001 |
SD: standard deviation; AI: artificial intelligence.
Comparison between AI and radiologists.
Group 1: “Residents” with 2 to 5 years of experience; Group 2: “Attending” with 6 to 10 years of experience; Group 3: “Chief” with more than 10 years of experience; and Group 4: “Other” for those (interns or students) with less than 2 years of experience.
In total, 80 radiologists from different hospitals or regions in China were recruited for the Turing test. Based on their clinical experiences, these radiologists were further divided into four groups (see Figure 1). The diagnostic accuracy performed by these groups was 61.91% ± 6.78 in Residents, 66.35% ± 6.60 in Attending, 66.25% ± 5.37 in Chief, and 55.50% ± 7.28 in Other (see Figure 2). The diagnostic accuracy of AI was comparable with the radiologists for the simple and intermediate cases (see Table 5). When given difficult cases, AI was more accurate than the radiologists (see Table 5).
Table 5.
The comparison of diagnosis accuracy between AI and radiologists with varied experiences.
| Cases level | Groups | No. | Mean ± SD | Range (min, max) | P a |
|---|---|---|---|---|---|
| All | AI | – | 73 | – | |
| Radiologists b | 80 | 62.93 ± 7.44 | 30.00 (46.00,76.00) | < 0.001 | |
| Group 1 | 32 | 61.91 ± 6.78 | 25.00 (48.00, 73.00) | < 0.001 | |
| Group 2 | 20 | 66.35 ± 6.60 | 22.00 (54.00, 76.00) | < 0.001 | |
| Group 3 | 16 | 66.25 ± 5.37 | 21.00 (54.00, 75.00) | < 0.001 | |
| Group 4 | 12 | 55.50 ± 7.28 | 24.00 (46.00, 70.00) | < 0.001 | |
| Simple | AI | – | 95.65 | – | |
| Radiologists b | 80 | 87.06 ± 13.55 | 52.17 (47.83, 100.00) | < 0.001 | |
| Group 1 | 32 | 86.41 ± 12.77 | 43.48 (56.52, 100.00) | 0.001 | |
| Group 2 | 20 | 92.83 ± 7.76 | 30.43 (69.57, 100.00) | 0.791 | |
| Group 3 | 16 | 92.93 ± 6.52 | 21.74 (78.26, 100.00) | 0.581 | |
| Group 4 | 12 | 71.38 ± 17.82 | 52.17 (47.83, 100.00) | 0.001 | |
| Intermediate | AI | 75.47 | |||
| Radiologists b | 80 | 66.53 ± 9.96 | 43.40 (45.28, 88.68) | < 0.001 | |
| Group 1 | 32 | 66.45 ± 9.47 | 37.74 (45.28, 83.02) | < 0.001 | |
| Group 2 | 20 | 68.77 ± 9.82 | 32.07 (49.06, 81.13) | 0.007 | |
| Group 3 | 16 | 70.16 ± 8.91 | 39.62 (49.06, 88.68) | 0.031 | |
| Group 4 | 12 | 58.18 ± 8.99 | 28.30 (47.17, 75.47) | < 0.001 | |
| Difficult | AI | 45.83 | |||
| Radiologists b | 80 | 31.82 ± 10.92 | 66.67 (0.00, 66.67) | < 0.001 | |
| Group 1 | 32 | 28.39 ± 10.28 | 45.83 (0.00, 45.83) | < 0.001 | |
| Group 2 | 20 | 35.63 ± 7.82 | 29.17 (20.83, 50.00) | < 0.001 | |
| Group 3 | 16 | 32.03 ± 10.62 | 41.67 (12.50, 54.17) | < 0.001 | |
| Group 4 | 12 | 34.38 ± 15.19 | 50.00 (16.67, 66.67) | < 0.001 |
SD: standard deviation; AI: artificial intelligence.
Comparison between AI and radiologists.
Group 1:“Residents” with 2 to 5 years of experience; Group 2: “Attending” with 6 to 10 years of experience; Group 3: “Chief” with more than 10 years of experience; and Group 4: “Other” for those (interns or students) with less than 2 years of experience.
The level of professional training and experiences (primary, intermediate, advanced, and others (interns or students) varied among this panel of radiologists, and this may affect their diagnostic accuracy. The positive predictive value (PPV) and negative predictive value (NPV) in different radiologists and AI were also calculated and shown in Figures 3 and 4. Overall, AI possessed a comparable or even better diagnostic specificity and sensitivity to the radiologists (see Tables 6 and 7).
Figure 3.
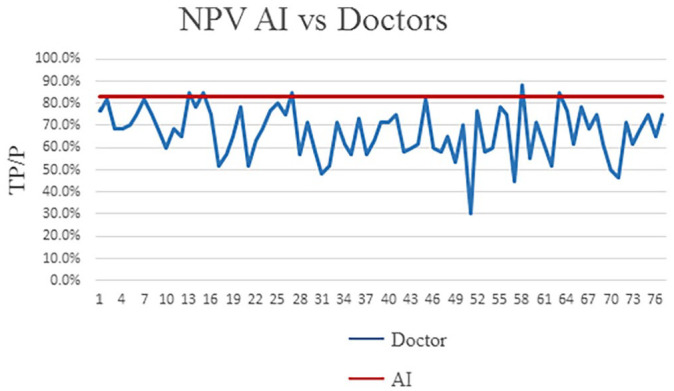
The comparison of NPV (negative predictive value) between radiologists and AI.
Figure 4.
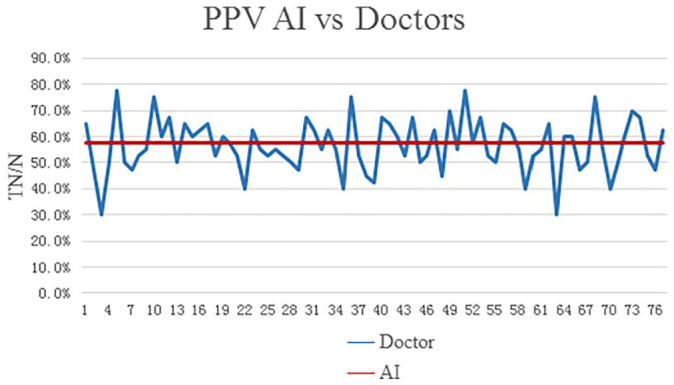
The comparison of PPV (positive predictive value) between radiologists and AI.
Table 6.
The comparison of diagnosis specificity (%) between AI and radiologists with varied experiences.
| Cases level | Groups | No. | Mean ± SD | Range (min, max) | P a |
|---|---|---|---|---|---|
| All | AI | – | 60.00 | – | |
| Radiologists b | 80 | 57.31 ± 13.84 | 62.5 (17.5, 80) | 0.086 | |
| Group 1 | 32 | 55.31 ± 14.12 | 62.5 (17.50, 80.00) | 0.052 | |
| Group 2 | 20 | 60.25 ± 11.53 | 40.00 (40.00, 80.00) | 0.924 | |
| Group 3 | 16 | 62.19 ± 11.14 | 35.00 (45.00, 80.00) | 0.444 | |
| Group 4 | 12 | 51.25 ± 17.69 | 55.00 (25.00, 80.00) | 0.115 | |
| Simple | AI | – | 100.00 | – | |
| Radiologists b | 80 | 86.25 ± 21.1 | 87.50 (12.50, 100.00) | < 0.001 | |
| Group 1 | 32 | 84.38 ± 21.77 | 66.67 (0.00, 66.67) | < 0.001 | |
| Group 2 | 20 | 90 ± 16.52 | 46.67 (13.33, 60.00) | 0.008 | |
| Group 3 | 16 | 95.31 ± 7.74 | 46.66 (6.67, 53.33) | 0.063 | |
| Group 4 | 12 | 72.92 ± 31 | 73.33 (6.67, 80.00) | 0.008 | |
| Intermediate | AI | 52.96 | |||
| Radiologists b | 80 | 66.91 ± 17.82 | 88.24 (5.88, 94.12) | < 0.001 | |
| Group 1 | 32 | 66.91 ± 17.08 | 75.00 (25.00, 100.00) | < 0.001 | |
| Group 2 | 20 | 68.82 ± 15.63 | 62.50 (37.50,100.00) | 0.115 | |
| Group 3 | 16 | 73.53 ± 15.19 | 25.00 (75.00, 100.00) | 0.021 | |
| Group 4 | 12 | 54.90 ± 22.2 | 87.50 (12.50, 100.00) | 0.767 | |
| Difficult | AI | 45.83 | |||
| Radiologists b | 80 | 31 ± 16.74 | 80.00 (0.00, 80.00) | < 0.001 | |
| Group 1 | 32 | 26.67 ± 17.02 | 66.67 (0.00, 66.67) | 0.007 | |
| Group 2 | 20 | 34.67 ± 14.12 | 46.67 (13.33, 60.00) | 0.041 | |
| Group 3 | 16 | 31.67 ± 15.68 | 46.66 (6.67, 53.33) | 0.003 | |
| Group 4 | 12 | 35.56 ± 20.37 | 73.33 (6.67, 80.00) | 0.108 |
SD: standard deviation; AI: artificial intelligence.
Comparison between AI and radiologists.
Group 1: “Residents” with 2 to 5 years of experience; Group 2: “Attending” with 6 to 10 years of experience; Group 3: “Chief” with more than 10 years of experience; and Group 4: “Other” for those (interns or students) with less than 2 years of experience.
Table 7.
The comparison of diagnosis sensitivity (%) between AI and radiologists with varied experiences.
| Cases level | Groups | No. | Mean ± SD | Range (min, max) | P a |
|---|---|---|---|---|---|
| All | AI | – | 81.67 | – | |
| Radiologists b | 80 | 66.67 ± 13.79 | 65 (30.00,95.00) | < 0.001 | |
| Group 1 | 32 | 66.30 ± 12.42 | 51.67 (43.33,95.00) | < 0.001 | |
| Group 2 | 20 | 70.42 ± 14.55 | 55.00 (40.00,95.00) | 0.003 | |
| Group 3 | 16 | 68.96 ± 10.38 | 31.67 (53.33,85.00) | 0.000 | |
| Group 4 | 12 | 58.33 ± 17.57 | 56.67 (30.00,86.67) | 0.001 | |
| Simple | AI | – | 93.33 | – | |
| Radiologists b | 80 | 87.5 ± 14.86 | 80.00 (20.00,100.00) | 0.253 | |
| Group 1 | 32 | 87.5 ± 11.33 | 40.00 (60.00,100.00) | 0.210 | |
| Group 2 | 20 | 94.33 ± 6.93 | 26.67 (73.33,100.00) | 0.267 | |
| Group 3 | 16 | 91.67 ± 8.25 | 20.00 (80.00,100.00) | 1.000 | |
| Group 4 | 12 | 70.56 ± 25.02 | 80.00 (20.00,100.00) | 0.009 | |
| Intermediate | AI | 86.11 | |||
| Radiologists b | 80 | 66.35 ± 15.6 | 61.11 (36.11,97.22) | < 0.001 | |
| Group 1 | 32 | 66.23 ± 15.39 | 58.33 (38.89,97.22) | < 0.001 | |
| Group 2 | 20 | 68.75 ± 17.47 | 58.33 (36.11,94.44) | < 0.001 | |
| Group 3 | 16 | 68.58 ± 12.25 | 47.23 (44.44,91.67) | < 0.001 | |
| Group 4 | 12 | 59.72 ± 16.81 | 52.78 (36.11,88.89) | < 0.001 | |
| Difficult | AI | 44.44 | |||
| Radiologists b | 80 | 33.19 ± 23.88 | 88.89 (0.00,88.89) | < 0.001 | |
| Group 1 | 32 | 31.25 ± 21.76 | 88.89 (0.00,88.89) | 0.001 | |
| Group 2 | 20 | 37.22 ± 27.99 | 88.89 (0.00,88.89) | 0.263 | |
| Group 3 | 16 | 32.64 ± 22.40 | 66.67 (0.00,66.67) | 0.052 | |
| Group 4 | 12 | 32.41 ± 26.15 | 77.78 (11.11,88.89) | 0.227 |
SD: standard deviation; AI: artificial intelligence.
Comparison between AI and radiologists.
Group 1: “Residents” with 2 to 5 years of experience; Group 2: “Attending” with 6 to 10 years of experience; Group 3: “Chief” with more than 10 years of experience; and Group 4: “Other” for those (interns or students) with less than 2 years of experience.
The heatmap representing the areas of focus for the AI during prediction is illustrated in Figure 5. Figure 5(A) shows the nodules in the right thyroid gland, alongside an enlarged grayscale image of the same region. Figure 5(B) provides the heatmap extracted from the trained CNN model, indicating the areas of attention during model prediction. Figure 5(C) represents the overlap of images from Figure 5(A) and (B). The highlighted area in Figure 5(B) and (C) show the main characteristics the AI model relied upon to identify malignant nodules. By comparing Figure 5(A) and (C), it is evident that the core area is characterized by calcification and solid echo signals, indicating a high degree of hardness. Furthermore, the model focused on the three flanks of the nodule area, which represent the relatively blurred portions of the nodule.
Figure 5.

AI Prediction Heatmap Analysis: A) Grayscale depiction of nodules in the right thyroid gland, B) Heatmap from the CNN model, showing areas of focus during prediction, and C) Combined overlay of A and B, highlighting regions of attention.
Discussion
The advent of AI has offered interdisciplinary opportunities to enhance the speed and accuracy of imaging interpretation and medical diagnostics. Deep learning, an evolution of machine learning, is a multilayered artificial neural network (ANN) mimicking the human visual cortex. 20 The initial layers of this network identify and process simple morphometric features (e.g. line and edge), which are then integrated by subsequent layers for higher-level pattern recognition. 14 A particular form of deep learning algorithm, the CNN, conceptually mimics the human visual pathway and demonstrates the capability for image recognition and classification. 21
Despite the advantages of CNN, challenges persist, including complex labeling, model intricacies, and extensive computational and memory requirements. 22 Constructing a CNN model demands vast data, considerable human effort, and complex calculations. In this study, we rigorously trained the CNN model using 2096 ultrasound images of 655 distinct thyroid nodules. To prevent over-fitting, we computed the neural network model via 10-fold cross-validation. Our study is distinct in that it incorporated a panel of 80 radiologists to verify the AI diagnoses. 14 The diagnostic accuracy of our AI system was found to be 73%, comparable with other computational models. 23 Recent studies have demonstrated the effectiveness of AI models. Savala et al. 24 revealed a rigorously tested ANN model capable of diagnosing follicular adenoma and follicular carcinoma cases on cytology slides with 100% accuracy. Similarly, Choi et al. 25 utilized a computer-aided diagnosis (CAD) system for differentiating malignant thyroid nodules from benign ones, achieving a diagnostic accuracy comparable to an experienced radiologist (90.7%, P > 0.99), though with slightly lower specificity (74.6%, P = 0.002).
In our study, due to the challenging nature of these thyroid cases (TI-RADS categories 3–6) and fewer experienced/senior radiologists in the panel, the overall performance of the panel in our study exhibited extremely low sensitivity (66.67% ± 13.79) and specificity (57.31% ± 13.84). While the AI system demonstrated a stable diagnostic capacity, the diagnostic accuracy of radiologists was greatly influenced by their training and experiences. Only the two experienced senior radiologists reached a similar diagnostic accuracy level as the AI did (76% vs 73%). Furthermore, the AI system exhibited better diagnostic efficiency. The time AI needed for diagnosis (514 s) was significantly shorter than the two senior radiologists (909 s and 1156 s). Due to its high efficiency and accuracy, the AI diagnostics has become an appealing technology in medical applications.20,26
Both AI and radiologists make similar mistakes when differentiating benign and malignant thyroid neoplasms. For example, sometimes ultrasound images exhibited radiographic features typical for thyroid malignancy (e.g. ill-defined border, low echo or ultra-low echo, and intra-nodular calcifications), but the histopathology evaluation demonstrated a benign finding (e.g. mummified nodules); or radiographically benign thyroid nodules turn out to be a thyroid carcinoma. The smaller the thyroid nodules are, the more challenging the differentiation is on the ultrasound images.2,4 This clinical challenge also motivates all radiologists to improve diagnostic accuracy.
The heatmap enables radiologists to have a more intuitive understanding of the diagnosis of benign and malignant thyroid nodules by the ultrasonic AI model. The heatmap reflects the shape, calcification, boundary, and other characteristics of the nodule to a certain extent. The heatmap serves as a visual reinforcement of AI’s assessment and enhances the credibility of the AI model, which makes this ultrasonic AI model more acceptable for radiologists. The visual cues from the heatmap, especially the calcification, morphology, and borders of the thyroid nodules, align with the key features that radiologists traditionally rely on. This not only ensures that the AI’s analysis is consistent with the well-established TI-RADS system but also aids in bridging the trust gap between radiologists and AI systems.
Despite these findings, there are limitations. First, the AI system’s algorithm could function as a “black box,” obscuring relationships between input and output and making acceptance of unexplainable AI conclusions difficult for doctors and patients. Second, the study would benefit from large-scale, multi-institutional image data for robust training of the deep learning framework.
In conclusion, our study suggests that deep learning could serve as a valuable diagnostic tool, with similar efficacy to experienced senior radiologists in distinguishing benign and malignant thyroid nodules. Further research is necessary to refine diagnostic accuracy and ultimately integrate AI technology as an auxiliary diagnostic tool in clinical practice.
Supplemental Material
Supplemental material, sj-docx-1-ebm-10.1177_15353702231220664 for Deep learning diagnostic performance and visual insights in differentiating benign and malignant thyroid nodules on ultrasound images by Yujiang Liu, Ying Feng, Linxue Qian, Zhixiang Wang and Xiangdong Hu in Experimental Biology and Medicine
Supplemental material, sj-docx-2-ebm-10.1177_15353702231220664 for Deep learning diagnostic performance and visual insights in differentiating benign and malignant thyroid nodules on ultrasound images by Yujiang Liu, Ying Feng, Linxue Qian, Zhixiang Wang and Xiangdong Hu in Experimental Biology and Medicine
Acknowledgments
The authors thank the Chinese Scholarship Council (CSC) for their financial support for studying abroad.
Footnotes
Authors’ Contributions: All authors participated in the design, interpretation of the studies, analysis of the data, and review of the article. YL, XH, YF, and ZW conducted the experiments and wrote the article. LQ helped with the building of the data set and provided administrative support. All authors read and approved the final article.
The author(s) declared no potential conflicts of interest with respect to the research, authorship, and/or publication of this article.
Ethical Approval: Ethics approval for this research was given by the review committee of Beijing Friendship Hospital, Capital Medical University.
Funding: The author(s) disclosed receipt of the following financial support for the research, authorship, and/or publication of this article: This work was supported by the Minimally invasive ablation versus surgical resection of benign symptomatic thyroid nodules: a multicenter controlled study. Capital Medical Development Research Fund of Beijing [grant no. 2022-1-2022].
ORCID iD: Ying Feng  https://orcid.org/0000-0001-9900-5546
Supplemental Material: Supplemental material for this article is available online.
References
- 1. Durante C, Grani G, Lamartina L, Filetti S, Mandel SJ, Cooper DS. The diagnosis and management of thyroid nodules: a review. JAMA 2018;319:914–24 [DOI] [PubMed] [Google Scholar]
- 2. Alexander EK, Doherty GM, Barletta JA. Management of thyroid nodules. Lancet Diabetes Endocrinol 2022;10:540–8 [DOI] [PubMed] [Google Scholar]
- 3. Fisher SB, Perrier ND. The incidental thyroid nodule. CA Cancer J Clin 2018;68:97–105 [DOI] [PubMed] [Google Scholar]
- 4. Alexander EK, Cibas ES. Diagnosis of thyroid nodules. Lancet Diabetes Endocrinol 2022;10:533–9 [DOI] [PubMed] [Google Scholar]
- 5. Haugen BR, Alexander EK, Bible KC, Doherty GM, Mandel SJ, Nikiforov YE, Pacini F, Randolph GW, Sawka AM, Schlumberger M, Schuff KG, Sherman SI, Sosa JA, Steward DL, Tuttle RM, Wartofsky L. 2015 American Thyroid Association management guidelines for adult patients with thyroid nodules and differentiated thyroid cancer: the American Thyroid Association guidelines task force on thyroid nodules and differentiated thyroid cancer. Thyroid 2016;26:1–133 [DOI] [PMC free article] [PubMed] [Google Scholar]
- 6. Liu S, Yang L, Yuan Y, Li H, Tian J, Lu S, Wang N, Ji J. Cancer incidence in Beijing, 2014. Chin J Cancer Res 2018;30:13–20 [DOI] [PMC free article] [PubMed] [Google Scholar]
- 7. Fletcher KH. Matter with a mind; a neurological research robot. Research 1951;4:305–7 [PubMed] [Google Scholar]
- 8. Pesapane F, Codari M, Sardanelli F. Artificial intelligence in medical imaging: threat or opportunity? Radiologists again at the forefront of innovation in medicine. Eur Radiol Exp 2018;2:35. [DOI] [PMC free article] [PubMed] [Google Scholar]
- 9. Saw SN, Ng KH. Current challenges of implementing artificial intelligence in medical imaging. Phys Med 2022;100:12–7 [DOI] [PubMed] [Google Scholar]
- 10. LeCun Y, Bengio Y, Hinton G. Deep learning. Nature 2015;521:436–44 [DOI] [PubMed] [Google Scholar]
- 11. Kumar Y, Koul A, Singla R, Ijaz MF. Artificial intelligence in disease diagnosis: a systematic literature review, synthesizing framework and future research agenda. J Ambient Intell Humaniz Comput 2023;14:8459–86 [DOI] [PMC free article] [PubMed] [Google Scholar]
- 12. Cruz-Roa AA, Arevalo Ovalle JE, Madabhushi A, González Osorio FA. A deep learning architecture for image representation, visual interpretability and automated basal-cell carcinoma cancer detection. Med Image Comput Comput Assist Interv 2013;16:403–10 [DOI] [PubMed] [Google Scholar]
- 13. Feng Y, Wang Z, Cui R, Xiao M, Gao H, Bai H, Delvoux B, Zhang Z, Dekker A, Romano A, Wang S, Traverso A, Liu C, Zhang Z. Clinical analysis and artificial intelligence survival prediction of serous ovarian cancer based on preoperative circulating leukocytes. J Ovarian Res 2022;15:64. [DOI] [PMC free article] [PubMed] [Google Scholar]
- 14. Ma J, Wu F, Zhu J, Xu D, Kong D. A pre-trained convolutional neural network based method for thyroid nodule diagnosis. Ultrasonics 2017;73:221–30 [DOI] [PubMed] [Google Scholar]
- 15. Mazurowski MA. Artificial intelligence in radiology: some ethical considerations for radiologists and algorithm developers. Acad Radiol 2020;27:127–9 [DOI] [PubMed] [Google Scholar]
- 16. Zeiler MD, Fergus R. Visualizing and understanding convolutional networks. In: Fleet D, Pajdla T, Schiele B, Tuytelaars T. (eds) Computer vision—ECCV 2014 (ECCV 2014), vol. 8689 (Lecture notes in computer science). Cham: Springer, 2014, pp.818–33 [Google Scholar]
- 17. Aghaei N, Akbarizadeh G, Kosarian A. GreyWolfLSM: an accurate oil spill detection method based on level set method from synthetic aperture radar imagery. Eur J Remote Sens 2022;55:181–98 [Google Scholar]
- 18. Zhou B, Khosla A, Lapedriza A, Oliva A, Torralba A. Learning deep features for discriminative localization. In: Proceedings of the 2016 IEEE conference on computer vision and pattern recognition (CVPR), Las Vegas, NV, 27–30 June 2016, pp.2921–29. New York: IEEE [Google Scholar]
- 19. Selvaraju RR, Cogswell M, Das A, Vedantam R, Parikh D, Batra D. Grad-CAM: visual explanations from deep networks via gradient-based localization. In: Proceedings of the 2017 IEEE international conference on computer vision (ICCV), Venice, 22–29 October 2017, pp.618–26. New York: IEEE [Google Scholar]
- 20. Kahn CE., Jr. From images to actions: opportunities for artificial intelligence in radiology. Radiology 2017;285:719–20 [DOI] [PubMed] [Google Scholar]
- 21. Rani P, Kotwal S, Manhas J, Sharma V, Sharma S. Machine learning and deep learning based computational approaches in automatic microorganisms image recognition: methodologies, challenges, and developments. Arch Comput Methods Eng 2022;29:1801–37 [DOI] [PMC free article] [PubMed] [Google Scholar]
- 22. Bejnordi BE, Zuidhof G, Balkenhol M, Hermsen M, Bult P, van Ginneken B, Karssemeijer N, Litjens G, Van der Laak J. Context-aware stacked convolutional neural networks for classification of breast carcinomas in whole-slide histopathology images. J Med Imaging 2017;4:044504. [DOI] [PMC free article] [PubMed] [Google Scholar]
- 23. Gao L, Liu R, Jiang Y, Song W, Wang Y, Liu J, Wang J, Wu D, Li S, Hao A, Zhang B. Computer-aided system for diagnosing thyroid nodules on ultrasound: a comparison with radiologist-based clinical assessments. Head Neck 2018;40:778–83 [DOI] [PubMed] [Google Scholar]
- 24. Savala R, Dey P, Gupta N. Artificial neural network model to distinguish follicular adenoma from follicular carcinoma on fine needle aspiration of thyroid. Diagn Cytopathol 2018;46:244–9 [DOI] [PubMed] [Google Scholar]
- 25. Choi YJ, Baek JH, Park HS, Shim WH, Kim TY, Shong YK, Lee JH. A computer-aided diagnosis system using artificial intelligence for the diagnosis and characterization of thyroid nodules on ultrasound: initial clinical assessment. Thyroid 2017;27:546–52 [DOI] [PubMed] [Google Scholar]
- 26. Park SH, Han K. Methodologic guide for evaluating clinical performance and effect of artificial intelligence technology for medical diagnosis and prediction. Radiology 2018;286:800–9 [DOI] [PubMed] [Google Scholar]
Associated Data
This section collects any data citations, data availability statements, or supplementary materials included in this article.
Supplementary Materials
Supplemental material, sj-docx-1-ebm-10.1177_15353702231220664 for Deep learning diagnostic performance and visual insights in differentiating benign and malignant thyroid nodules on ultrasound images by Yujiang Liu, Ying Feng, Linxue Qian, Zhixiang Wang and Xiangdong Hu in Experimental Biology and Medicine
Supplemental material, sj-docx-2-ebm-10.1177_15353702231220664 for Deep learning diagnostic performance and visual insights in differentiating benign and malignant thyroid nodules on ultrasound images by Yujiang Liu, Ying Feng, Linxue Qian, Zhixiang Wang and Xiangdong Hu in Experimental Biology and Medicine