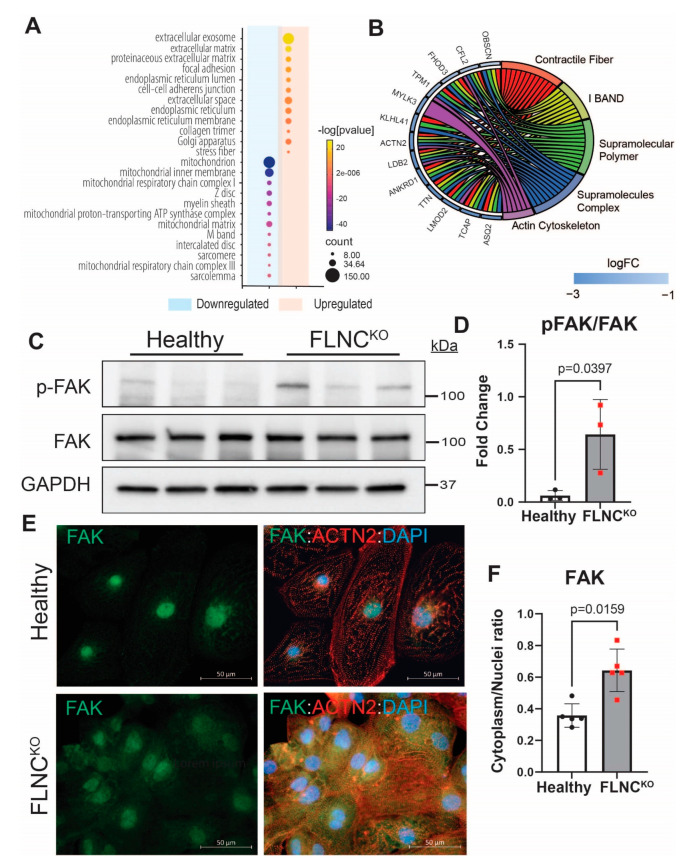
Figure 5.
FAK activation in FLNCKO hiPSC-CMs. (A) GO cellular component analysis in FLNC knockout and isogenic control iPSC-CMs shows the activation of focal adhesion signaling pathway (hsa04510). (B) Downregulation of genes involved in sarcomere cytoskeleton formation in FLNCKO iPSC-CMs. (C) Increased expression levels of p-FAK (Y397) in FLNCKO compared to wildtype iPSC-CMs as assessed by IB. (D) Quantitative representation of the blots in B. (E) IF stanning of FAK in FLNCKO compared to isogenic control iPSC-CMs. (F) Quantitative representation of the fluorescence signal of FAK in cytoplasm and nucleus.

