Abstract
In this work, two stilbene derivatives with different substituents on the phenolic core (phenyl and dimethoxyphenyl) were prepared. The fluorosolvatochromic response of their N-propylated derivatives was studied in a solution of twelve different solvents using UV–Vis absorption and fluorescence emission spectra. Both stilbazolium dyes showed a significant negative solvatochromic effect, with a hypsochromic shift in the visible absorption band of approximately 232 nm and 265 nm for phenyl and the dimethoxyphenyl derivative, respectively, when the solvent was changed from water to pyridine. The stilbene derivatives were subsequently N-alkylated with (3-iodopropyl)trimethoxysilane and covalently anchored to the silica surface. The fluorosolvatochromic response of the prepared silicas compared to N-propylated dyes was then evaluated colorimetrically under daylight and UV illumination. The fluorosolvatochromic behaviour of the anchored dyes was preserved on the silica surface; therefore, the modified silicas could be used for the visual detection of colourless liquids.
Keywords: fluorosolvatochromism, solvatochromic dyes, modified silicas, colorimetric sensors
1. Introduction
Solvatochromism is the phenomenon observed when the colour of a solution significantly changes when the solute, i.e., the solvatochromic compound, is dissolved in different solvents. In addition, fluorosolvatochromic compounds display a different fluorescence emission when dissolved in different solvents [1]. For decades, the solvatochromic phenomenon has been known and utilised for many applications, such as studying the polarity of solvents [2], detecting polar additives in gasoline [3,4], determining the water content in organic solvents [5] or the pH in nonaqueous solutions [6], or detecting various ions in solution [7,8,9,10].
However, using solvatochromic compounds in solution involves several disadvantages, as the solvatochromic compounds are consumed and the studied solution is contaminated. Therefore, novel materials that can transfer the solvatochromic phenomenon to a solid surface are being developed. The published solvatochromic materials include various polymers [11,12,13,14,15,16,17], silicas [18,19,20,21], organosilanes [22,23], resins [10], organic frameworks [24,25,26] and nanomaterials [27,28,29,30,31]. In this work, we focused on preparing solvatochromic silicas, as silica is a common material used in various industrial and research applications owing to its unique properties, such as chemical inertness, high surface area, porosity, and thermal stability [32].
Various approaches can be used to modify silica surfaces with solvatochromic compounds to form sensing materials. The solvatochromic compound can be bound to the silica surface through chemical bonds or noncovalent interactions. However, covalent binding is preferred because the noncovalent binding of the compound enables leakage [33,34,35].
The process by which organic compounds covalently bind to a silica surface usually includes several steps, such as functionalization of the compound, activation of the silica surface, and their interconnection. Organic compounds can be attached to silica surfaces through various functional groups, depending on the desired application of targeted silica-based materials. A common method to perform covalent silica modifications is to react silanol groups on the surface of silica with an organosilane coupling agent present in the molecule of the organic compound [36].
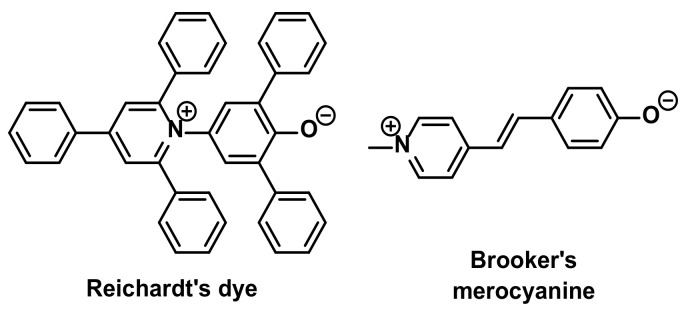
In 1995, Crowther and Liu pioneered the covalent attachment of a solvatochromic compound to a silica surface while retaining its solvatochromic properties [18]. For the solvatochromic compound, the researchers used the famous Reichardt’s dye (Figure 1) [37], also known as ET 30. The compound was modified with an amino group, which was subsequently covalently attached to variously modified silicas. The first material was prepared from isothiocyanatopropyl-modified silica, i.e., connected through a thiourea linker. The second material was prepared from carboxypropyl-modified silica, i.e., connected through an amide linker [18]. The reported work was followed by several others that aimed to use the solvatochromic silicas to construct optical chemical sensors with immobilised dye as a transducer. These sensors should be applicable to the detection of colourless analytes in gaseous and liquid phases [18,19,20,21].
Figure 1.
Molecular structures of Reichardt’s dye and Brooker’s merocyanine.
In addition to Reichardt’s dye, Brooker’s merocyanine (Figure 1) is another well-known solvatochromic compound [38,39]. Brooker’s merocyanine dye exhibits one of the largest negative solvatochromic effects, with a hypsochromic shift in the visible absorption band of approximately 137 nm when the solvent is changed from chloroform to methanol [38]. Brooker’s merocyanine is advantageous over Reichardt’s dye because the dye is easy and inexpensive to prepare and maintains a highly pronounced solvatochromic response. In this work, we present a four-step method to prepare silicas modified with two different fluorosolvatochromic derivatives of Brooker’s merocyanine. The method utilizes readily available and cost-effective chemicals, allowing for the large-scale modification of simple chromatography-grade silica without surface activation.
We believe that the modified silicas could be used to construct simple colorimetric sensors that can be evaluated by the naked eye, i.e., autonomous devices, such as public sensors for environmental pollution and chemical hazards, and devices that utilise a flow-through arrangement to monitor the quality of colourless liquids, such as spirits or fuels. Moreover, the silicas could be applied in fields such as construction, art, or cosmetics as chemoresponsive powders, due to the growing interest in the use of smart materials.
2. Results and Discussion
2.1. Preparation of Model Stilbazolium Dyes 5
To compare the fluorosolvatochromic behaviour of the dyes in solution and on the solid surface of silica, model compounds N-alkylated with a simple propyl group were prepared for fluorosolvatochromic studies in solution.
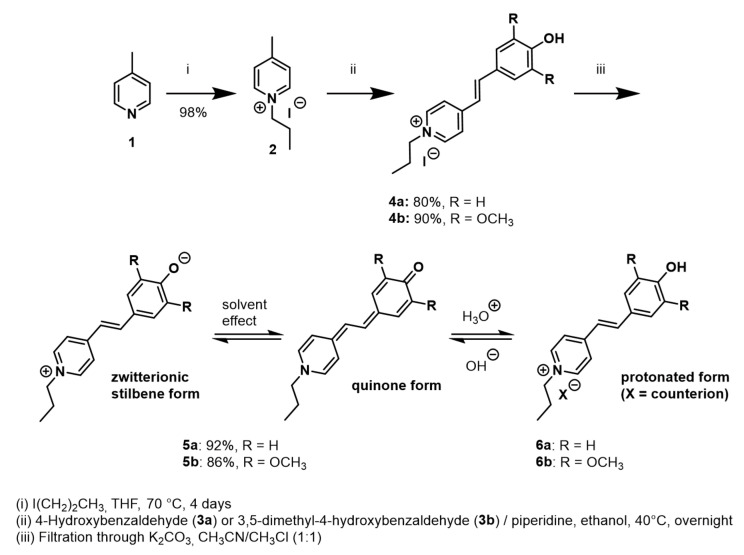
Model compounds were prepared in three reaction steps (Scheme 1). In the first step, 4-methylpyridine (1) was alkylated with 1-iodopropane in tetrahydrofuran to give a 98% yield of pyridinium salt 2 [40]. In the following step, pyridinium salt 2 was treated with 4-hydroxybenzaldehyde (3a), or 4-hydroxy-3,5-dimethoxybenzaldehyde (3b), and piperidine as a catalyst in ethanol to yield 80% of stilbazolium salt 4a and 90% of stilbazolium salt 4b, respectively. In the last step, stilbazolium salts 4 were transformed to the corresponding fluorosolvatochromic form 5 by reaction with potassium carbonate in a mixture of acetonitrile and chloroform to yield 92% of stilbazolium dye 5a and 86% of stilbazolium dye 5b.
Scheme 1.
The preparation of model fluorosolvatochromic compounds, stilbazolium dyes 5, for fluorosolvatochromic studies in solution. The scheme also shows the resonance structures of stilbazolium dyes 5 and their corresponding non-solvatochromic protonated forms 6.
2.2. Fluorosolvatochromic Behaviour of Stilbazolium Dyes 5 in Solution
The fluorosolvatochromic behavior of the prepared model compounds, stilbazolium dyes 5, was demonstrated by their dissolution in several solvents with different polarities. However, stilbazolium dyes 5 were insoluble in nonpolar solvents, so only a variety of polar solvents were studied.
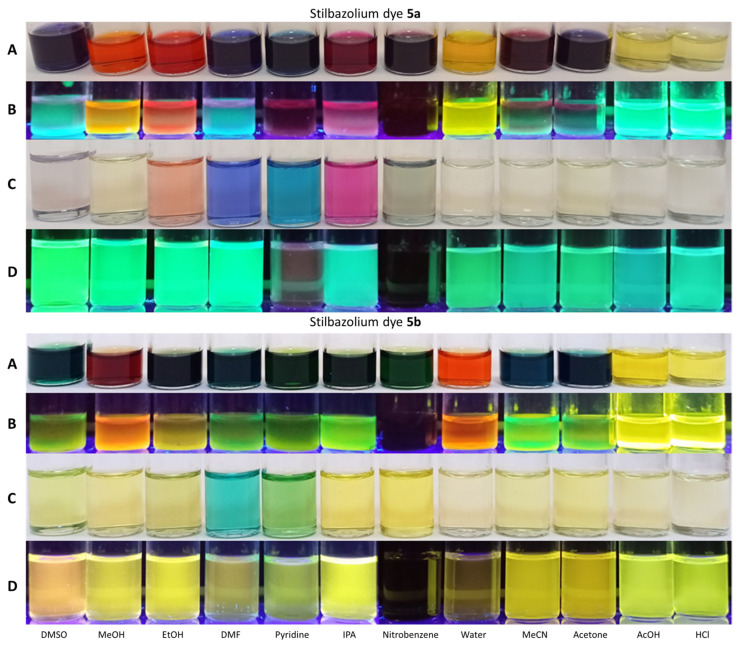
First, the fluorosolvatochromic response was studied by simple colorimetric evaluation under daylight and UV illumination (λex = 366 nm). The colours of the stock solutions and measured solutions of both compounds are shown in Figure 2. Both stilbazolium dyes showed strong fluorosolvatochromic responses. In the case of stilbazolium dye 5a, the colour of the solutions ranged from bright yellow (HCl, protonated form 6a) to shades of red/orange (water, MeOH, zwitterionic form 5a) to shades of blue/purple (DMF, pyridine, quinone form 5a). In the case of stilbazolium dye 5b, the colour of the solutions ranged from bright yellow (HCl, protonated form 6b) to shades of red/orange (water, MeOH, zwitterionic form 5b) to shades of blue/green (DMF, pyridine, quinone form 5b).
Figure 2.
Fluorosolvatochromic response of model compounds 5 to different solvents. (Top): The colors of the stock solutions of stilbazolium dye 5a (c = 0.9402 mmol·L−1) under daylight (A) and under UV illumination ((B), λex = 366 nm) and the measured solutions of 5a (c = 20.38 μmol·L−1) under daylight (C) and under UV illumination ((D), λex = 366 nm). (Bottom): The colors of the stock solutions of stilbazolium dye 5b (c = 0.9453 mmol·L−1) under daylight (A) and under UV illumination ((B), λex = 366 nm) and the measured solutions of 5a (c = 20.44 μmol·L−1) under daylight (C) and under UV illumination ((D), λex = 366 nm).
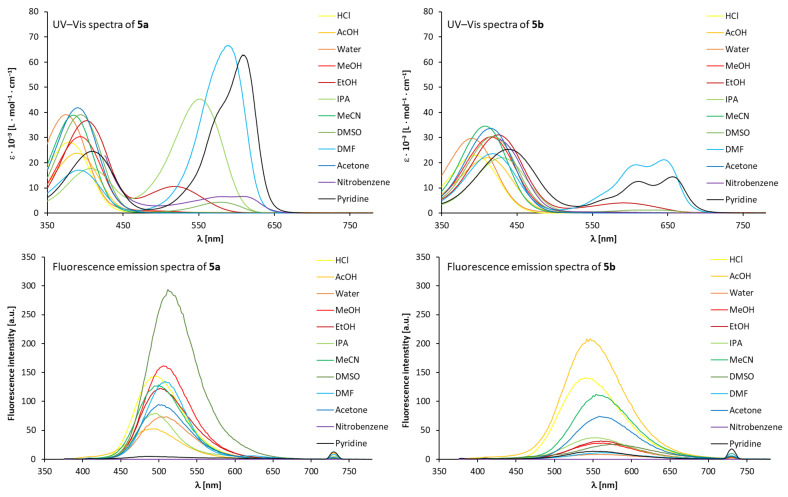
Next, the spectral properties of both stilbazolium dyes 5 were studied using UV–Vis and fluorescence emission spectra of the prepared solutions (Figure 3). An overview of the wavelengths of the maxima of the absorption and emission bands of stilbazolium dyes 5 measured in solvents with different polarities is given in Table 1.
Figure 3.
UV–Vis and fluorescence emission (λex = 366 nm) spectra of stilbazolium dyes 5. Top: UV–Vis spectra of stilbazolium dyes 5a (left) and 5b (right) measured in different solvents. Bottom: Fluorescence emission spectra of stilbazolium dyes 5a (left) and 5b (right) measured in different solvents. The low-intensity band at 732 nm in the fluorescence emission spectra is a second-order band, which is the result of higher-order scattering from the monochromator and is twice the excitation wavelength of 366 nm.
Table 1.
Overview of the wavelengths of the maxima of the absorption and fluorescence emission (λex = 366 nm) bands of stilbazolium dyes 5 measured in different solvents.
| Stilbazolium Dye 5a | Stilbazolium Dye 5b | |||||||||
|---|---|---|---|---|---|---|---|---|---|---|
| Solvent a | λmax,1 [nm] |
λmax,2 [nm] |
λmax,3 [nm] |
λem [nm] |
Stokes shift [nm] |
λmax,1 [nm] |
λmax,2 [nm] |
λmax,3 [nm] |
λem [nm] |
Stokes Shift [nm] |
| Hydrochloric acid | 378 | - | - | 496 | 130 | 391 | - | - | 540 | 174 |
| Acetic acid | 387 | - | - | 490 | 124 | 410 | - | - | 546 | 180 |
| Water | 375 | - | - | 510 | 144 | 390 | - | - | 560 | 194 |
| Methanol | 393 | - | - | 506 | 140 | 417 | - | - | 562 | 196 |
| Ethanol | 402 | 516 | - | 502 | 136 | 426 | 592 | - | 560 | 194 |
| Isopropyl alcohol | 406 | 552 | - | 496 | 130 | 430 | - | - | 554 | 188 |
| Acetonitrile | 385 | - | - | 500 | 134 | 408 | - | - | 554 | 188 |
| Dimethyl sulfoxide | 395 | - | 581 | 512 | 146 | 416 | - | - | 580 | 214 |
| N,N-Dimethylformamide | 391 | - | 591 | 508 | 142 | 419 | 607 | 644 | 562 | 196 |
| Acetone | 390 | - | - | 500 | 134 | 415 | - | - | 558 | 192 |
| Nitrobenzene | - b | - | 607 | - | - | - b | - | - | - | - |
| Pyridine | 499 | 577 | 607 | - | - | 439 | 610 | 656 | 550 | 184 |
The UV–Vis spectra of both stilbazolium dyes 5 exhibit strong hypsochromic shifts (blue shifts) with increasing solvent polarity, i.e., negative solvatochromism. This finding corresponds with the published spectra of Brooker’s merocyanine [38]. In the case of stilbazolium dye 5a, the wavelength of the absorption band maxima ranged from 375 nm to 607 nm. The absorption bands at 516–607 nm are prominent in solvents, in which the quinone form of the molecule predominates [38,39]. In the case of stilbazolium dye 5b, the wavelength of the absorption band maxima ranged from 390 nm to 656 nm. Thus, the spectra of 5b are redshifted (bathochromic shift) in comparison to those of 5a. The absorption bands at 592–656 nm are prominent in solvents in which the quinone form of the molecule predominates [38,39].
Moreover, both dyes 5 exhibited fluorosolvatochromism. In the case of stilbazolium dye 5a, the wavelength of the fluorescence emission band maxima ranged from 490 nm to 512 nm. No fluorescence was observed for nitrobenzene or pyridine. In the case of stilbazolium dye 5b, the wavelength of the fluorescence emission band maxima ranged from 540 nm to 580 nm. Thus, the fluorosolvatochromic response was stronger for 5b (40 nm shift) than for 5a (22 nm shift).
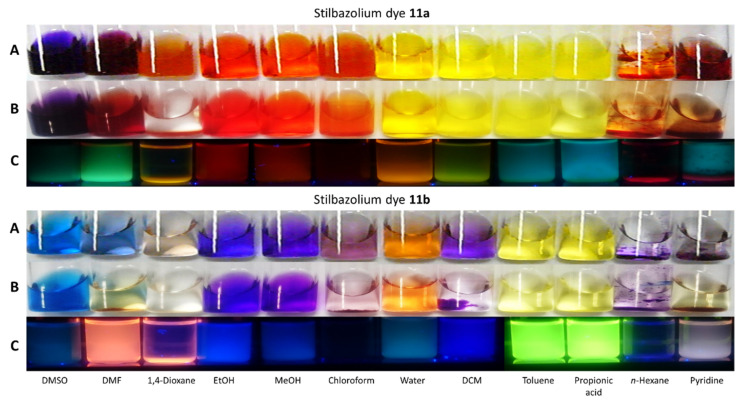
We also studied model compounds N-alkylated with a silane anchor, i.e., stilbazolium dyes 11. The preparation of stilbazolium dyes 11a and 11b is given in the Supplementary Materials. Solutions of stilbazolium dyes 11 in methanol were tested for fluorosolvatochromic behavior without further purification because of the poor stability of the prepared compounds. In the vials, 50 μl of the prepared stilbazolium dyes 11 solution was mixed with 3 mL of the studied solvent. The colour change of stilbazolium dyes 11a and 11b depending on the solvent used can be seen in Figure 4. It follows that the prepared stilbazolium dyes show fluorosolvatochromic behavior. However, the resulting colour of the solutions of both dyes is influenced by impurities from the preparation of both compounds, i.e., methanol, sodium hydroxide, sodium iodide, sodium acetate, and (3-iodopropyl)trimethoxysilane. The figure also shows that the prepared salts were not soluble in some solvents (n-hexane, pyridine). Even in these solvents, however, the colour of the dye varied. Their fluorescence (λex = 366 nm) was most pronounced in solutions of N,N-dimethylformamide, toluene, and propionic acid.
Figure 4.
Fluorosolvatochromic response of model compounds 11a (top) and 11b (bottom) to different solvents under visible light ((A): freshly prepared solutions, (B): solutions after 24 h) and under UV illumination ((C): λex = 366 nm).
However, the solutions of the prepared compounds were not stable. In Figure 4, freshly prepared solutions are compared with solutions after 24 h. The figure shows that in some cases there was a slight colour change, and in other cases there was a separation of the dye particles and the solvent taking place, whereby the separated particles could not be re-dissolved by stirring the solution. In most cases, aggregation of microparticles in the solution, their settling at the bottom, or excretion on the walls of the vial were observed. The particles of the compounds were separated to form a suspension within minutes to hours (depending on the solvent used). The figure shows that in the case of 11b, the N,N-dimethylformamide solvent, there was a significant colour change, which can be explained by the separation of the N,N-dimethylformamide and methanol phases since the colour of the solid at the bottom of the N,N-dimethylformamide flask corresponds to the colour of the solution of dye 11b in methanol. Thus, degradation of compounds occurred, probably due to hydrolysis of the silane anchor. Stilbazolium dyes 11 were therefore not suitable as model compounds and were excluded from our investigation.
2.3. Preparation of Fluorosolvatochromic Silicas 10
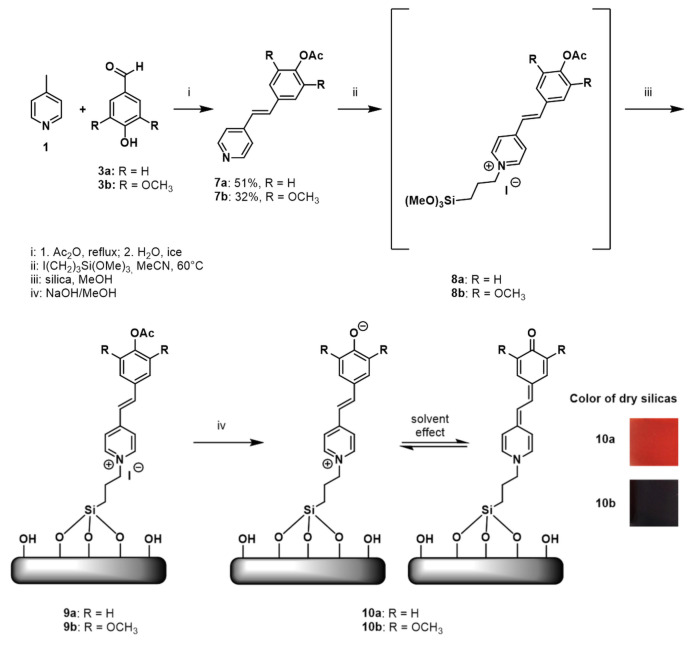
The preparation of modified silicas took place in four reaction steps (Scheme 2). In the first step, the aldol condensation of 4-methylpyridine (1) and the corresponding benzaldehyde derivative 3 yielded 51% of stilbazole 7a and 32% of stilbazole 7b, respectively. In the second step, stilbazoles 7 were N-alkylated with (3-iodopropyl)trimethoxysilane to yield stilbazolium salts 8, which were used without isolation due to the poor stability of the trimethoxysilane anchor. In the third step, stilbazolium salts 8 were covalently attached to the solid surface of chromatography-grade silica via a trimethoxysilyl group in a mixture of dichloromethane and methanol (19:5 v/v). The suspension was left to stand for 12 h with occasional mixing. After the solvent was evaporated, modified silicas 9 bearing acetylated stilbazolium dyes were obtained. The prepared silicas were dried under reduced pressure, washed on frit with water and methanol, and dried again. In the fourth step, the phenolic groups of the attached stilbazolium dyes were deacetylated in a basic solution of 0.5 M sodium hydroxide in methanol, resulting in the formation of fluorosolvatochromic silicas 10. The prepared silicas were washed on frit with water and various organic solvents, subsequently washed with diethyl ether, dried by air, and then dried under reduced pressure to dryness. The colour of the dry silicas is shown in Scheme 2.
Scheme 2.
The preparation of modified silicas 10. The scheme also shows the resonance structures of the anchored stilbazolium dyes and the colour of the dry modified silicas 10.
The covalent attachment of the compounds to the silica surface was demonstrated by the absence of any coloured substance being washed out of the silicas when the samples were rinsed on the frit with various solvents, including chloroform, dimethyl sulfoxide, and water. We further characterised the prepared silicas using elemental analysis (see the Supplementary Materials). We determined the amount of bound stilbazolium dye using the measured amount of nitrogen. For silica 10a, the modification yield was determined to be 5.0 μmol, and for silica 10b, the modification yield was 5.8 μmol of stilbazolium dye bound on the surface. The amount of dye bound to the surface was therefore very low in both cases, demonstrating the robustness of the colour response of both dyes. Moreover, with such a small amount of indicator, the preparation of the silicas is inexpensive. Importantly, we attempted to prepare another batch of modified silicas, and the method, including the fluorosolvatochromic response, was reproducible.
Since we used acetylated stilbazoles to modify the silicas, we wanted to further verify that deacetylation occurs quantitatively under the given conditions. Furthermore, we wanted to compare the fluorosolvatochromic response of stilbazolium salts before and after acetyl deprotection using UV–Vis spectra (Figures S66 and S67). For this comparison, we used a model system in solution. The details of the experiments, including the preparation of the compounds and the UV–Vis spectra, are given in the Supplementary Materials. The results confirmed that complete deacetylation occurred under the given reaction conditions. The experiments further showed that deacetylation partially occurs in basic solvents, such as N,N-dimethylformamide.
2.4. Fluorosolvatochromic Properties of the Prepared Silicas
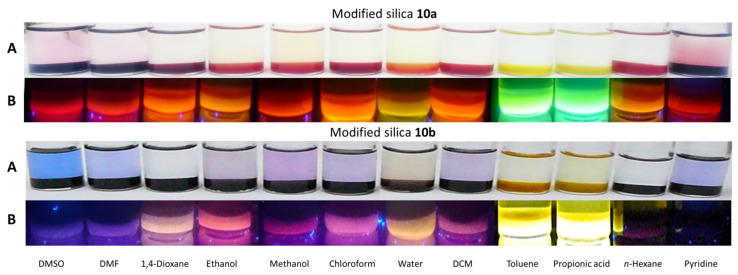
The fluorosolvatochromic behaviour of the prepared silicas 10 was studied in twelve different solvents. Approximately 200 mg of the prepared silica was weighed into each vial, and 3 mL of the tested solvent was added. The resulting colour change in modified silicas 10 caused by the added solvent is shown in Figure 5.
Figure 5.
Fluorosolvatochromic response of modified silicas 10a (top) and 10b (bottom) at the bottom of the vials in solvents of different polarities under daylight (A) and UV illumination ((B), λex = 366 nm).
The modified silicas showed rapid and significant colour changes depending on the solvent added. Therefore, the solvatochromic response of the anchored dyes was preserved after they were covalently attached to the surface of silica.
Figure 5 further shows that both modified silicas exhibited strong fluorosolvatochromic behaviour. Their fluorescence under UV illumination (λex = 366 nm) was most pronounced in toluene and propionic acid solutions. Fluorescence in the presence of acid is not surprising since fluorescence of the protonated form was also observed for model compounds 5. However, the fluorescence in the presence of toluene was surprising. The similarity between toluene and acid is, in our opinion, peculiar since the two solvents differ dramatically in their molecular structure, pKa, polarity, and other properties. Since model compounds 5 are not soluble in toluene, this solvent cannot be used for comparison.
Therefore, to compare with the solid phase, we also aimed to study aromatic solvents, in which stilbazolium dyes 5 were not soluble. We studied the effects of both solvents by measuring their UV–Vis and fluorescence emission spectra in solvents (benzene and toluene) mixed with solutions of the studied stilbazolium dyes 5 in dimethyl sulfoxide (less polar) or in methanol (more polar). For further information about the experiments, including UV–Vis and fluorescence emission spectra and colorimetric evaluation, see the Supplementary Materials. Experiments showed that fluorescence was significantly suppressed in the presence of aromatic solvents when dimethyl sulfoxide was introduced; however, fluorescence was preserved in the presence of methanol. Therefore, we believe that free hydroxyl groups on the surface of silica play a significant role in the observed fluorescence of silicas 10 in the presence of aromatic solvents.
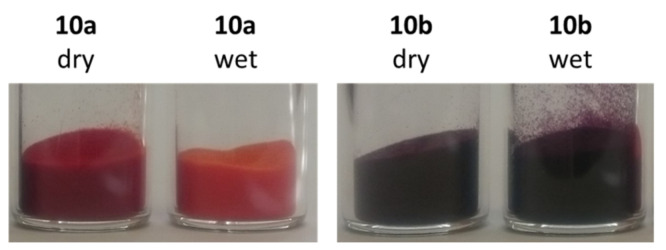
Next, we investigated the response of modified silica 10a in a flow-through arrangement. We fixed a layer of 10a in a glass tube using glass wool. With this arrangement, we washed the tube with a series of solvents. The colour response was continuous and observable with the naked eye (see Supplementary Materials, Figure S68). Finally, in addition to the fluorosolvatochromic response, both silicas also exhibited a fluorovapochromic response. The response of solvatochromic silicas 10 to changes in humidity was evaluated colorimetrically. Figure 6 shows photos of freshly dried silicas and silicas after 24 h exposure to the air. It can be seen from the figure that in both cases, the sorption of atmospheric moisture took place, as the colour of the materials corresponds to their colour in suspension with water. The materials can therefore be used for several applications, such as simple indicators of relative humidity.
Figure 6.
Solvatochromic response of silicas 10 to change in humidity.
3. Materials and Methods
3.1. Chemicals and Materials
All reagents were purchased from commercial providers and used without further purification. For the modification of silicas, chromatography grade silica with a 60 Å pore size and 40–63 μm particle size (Material Harvest, Cambridge, UK) was used.
3.2. Nuclear Magnetic Resonance
NMR spectra were recorded with a JNM-ECZ500R NMR spectrometer (JEOL Resonance, Tokyo, Japan) operating at 500.16 MHz for 1H and 125.77 MHz for 13C. The 1H NMR and 13C NMR spectra were referenced to the residual solvent signal of DMSO-d6 (1H NMR: 2.50 ppm; 13C NMR: 39.52 ppm). The chemical shifts (δ) are given in ppm. The coupling constants (J) are given in Hz. All the spectra were measured at 25 °C.
3.3. High-Resolution Mass Spectrometry
Mass spectrometry was performed with an LTQ Orbitrap Velos mass spectrometer (Thermo Scientific, Waltham, MA, USA), a hybrid Ion trap-Orbitrap spectrometer with an Ion Max ion source, and an H-ESI II probe. The conditions for MS detection were as follows: ionization, ESI+; spray voltage, 3.0 kV; source temperature, 250 °C; capillary temperature, 300 °C; measurement mode, FTMS; resolution (FWHM), 30,000; lock mass, 413.2662 Da (diisooctyl phthalate); and scan range, 150–2000 Da. The samples were dosed under direct injection conditions (FIA) using an Accela 600 (Thermo Scientific) pump. The conditions for the injection were as follows: sample dosage, 5 μL (injection loop, Rheodyne valve); mobile phase, methanol; and flow rate of the mobile phase, 150 μL/min.
3.4. Elemental Analysis
Elemental analyses were performed on an Elementar Vario EL Cube CHNS elemental analyser (Elementar, Langenselbold, Germany). The precision was determined by the manufacturer to simultaneously analyse 5 mg of the standard of 4-aminobenzene sulfonic acid in the CHNS module to be <0.1% absolute (homogeneous substance), depending on sample type, analysis mode, and configuration for each element.
3.5. UV–Vis Spectroscopy
Absorption spectra were measured in 1 cm optical quartz cuvettes (Aireka Cells, Hong Kong, China) at ambient temperature on a Cary 60 UV–Vis spectrometer (Agilent Technologies, Santa Clara, CA, USA). The spectra were measured over the spectral range of 190–1100 nm. The spectrum of the measured solvent was used for baseline correction. The molar absorption coefficients of the measured substances were determined via linear regression from dilution experiments. The measured spectra are shown as plots of the molar absorption coefficients versus wavelength. The given spectra were obtained by dividing the measured spectra from the dilution experiments by the measured concentrations. For spectra measured in a single solvent, the spectra obtained were averaged. When solvent (e.g., nitrobenzene) absorption was high, the relevant parts of the spectrum were clipped. The preparation of the samples for the measurements and the resulting measured concentrations are given in the Supplementary Materials.
3.6. Fluorescence Spectroscopy
Fluorescence emission spectra were measured in a 1 cm optical quartz cuvette (Aireka Cells, Hong Kong, China) on a Cary Eclipse fluorescence spectrometer (Agilent Technologies). Fluorescence emission spectra were evaluated without blank subtraction. The excitation wavelength used was 366 nm, unless stated otherwise. The spectra were measured in the spectral range of 376–900 nm, unless stated otherwise. Other parameters were set as follows: excitation slit, 5 nm; emission slit, 5 nm; scan rate, 1200 nm/min; averaging time, 0.1 s; and data interval, 2.0 nm. More information, the preparation of samples for measurement, and the resulting concentrations are given in the Supplementary Materials.
3.7. Optical Images
Optical images were captured using an ordinary mobile phone with a M2003J15SC camera (Xiaomi, Beijing, China). The camera settings and parameters of the images taken were as follows: photo dimensions in pixels: 4000 × 2992; horizontal and vertical resolution, 96 dpi; bit depth, 24; sRGB colour resolution; aperture shutter, f/1.8; ISO 108; exposure duration, 1/100 s; exposure metre mode with centre emphasis; focal distance, 5 mm; without flash; and automatic white balance. The images were processed only by cropping, and no other adjustments (brightness, contrast, etc.) were made. The images were taken under constant lighting. A manual UV lamp with a power of 4W and λex = 366 nm was used for UV illumination.
4. Conclusions
In this work, we prepared two novel silica-based solids covalently modified with fluorosolvatochromic stilbazolium dyes, which enabled colour changes based on the characteristics of their microenvironment. The ability of the prepared silicas to distinguish organic solvents colorimetrically was demonstrated for twelve different solvents. We showed that stilbazolium dyes exhibit solvatochromic and fluorosolvatochromic behaviours when covalently bound to the silica surface. The prepared compounds and silicas showed significantly different colour responses to UV-grade methanol and ethanol, which could be applied for routine analyses of the quality of colourless spirits. Moreover, we found peculiar fluorescence in the presence of aromatic compounds, similar to the response to acids. We observed a colour response toward moisture, and we demonstrated the analysis in a flow-through arrangement. We believe that the following research on fluorosolvatochromic silicas will lead to the development of cheap colorimetric sensors and sensor arrays for a wide range of applications, including routine detection of chemicals by a nonprofessional eye.
Acknowledgments
All the measurements were conducted at the Department of Analytical Chemistry of the University of Chemistry and Technology, Prague.
Supplementary Materials
The supporting information can be downloaded at: https://www.mdpi.com/article/10.3390/molecules29030673/s1, The Electronic Supporting Information contains detailed preparations of all compounds and modified silicas, supporting experiments, selected NMR, UV–Vis, and fluorescence emission spectra, and optical images (PDF). Refs. [43,44,45] are cited in the Supplementary Materials.
Author Contributions
Conceptualization, B.D. and T.N.; methodology, T.N.; formal analysis, T.N.; investigation, T.N. and M.H.; resources, T.N. and B.D.; data curation, T.N.; writing—original draft preparation, T.N.; writing—review and editing, M.H., A.T., K.H. and B.D.; visualization, T.N.; supervision, M.H. and B.D.; project administration, T.N.; funding acquisition, T.N. and B.D. All authors have read and agreed to the published version of the manuscript.
Institutional Review Board Statement
Not applicable.
Informed Consent Statement
Not applicable.
Data Availability Statement
All data used to support the findings of this study are included in the article and Supplementary Materials. Spectra in raw data format are available upon request.
Conflicts of Interest
The authors declare no conflicts of interest.
Funding Statement
This work was supported by the grant of Specific university research—grant No. A2_FCHI_2023_008 and by the Czech Science Foundation (grant 22 15511S).
Footnotes
Disclaimer/Publisher’s Note: The statements, opinions and data contained in all publications are solely those of the individual author(s) and contributor(s) and not of MDPI and/or the editor(s). MDPI and/or the editor(s) disclaim responsibility for any injury to people or property resulting from any ideas, methods, instructions or products referred to in the content.
References
- 1.Marini A., Muñoz-Losa A., Biancardi A., Mennucci B. What is Solvatochromism? J. Phys. Chem. B. 2010;114:17128–17135. doi: 10.1021/jp1097487. [DOI] [PubMed] [Google Scholar]
- 2.Reichardt C. Solvatochromic Dyes as Solvent Polarity Indicators. Chem. Rev. 1994;94:2319–2358. doi: 10.1021/cr00032a005. [DOI] [Google Scholar]
- 3.Budag R., Giusti L.A., Machado V.G., Machado C. Quality analysis of automotive fuel using solvatochromic probes. Fuel. 2006;85:1494–1497. doi: 10.1016/j.fuel.2005.12.023. [DOI] [Google Scholar]
- 4.Gotor R., Bell J., Rurack K. Tailored fluorescent solvatochromic test strips for quantitative on-site detection of gasoline fuel adulteration. J. Mater. Chem. C. 2019;7:2250–2256. doi: 10.1039/C8TC04818E. [DOI] [Google Scholar]
- 5.Schäfer K., Ihmels H. Ratiometric Detection of Water in Acetonitrile with 9-Hydroxybenzo[b]Quinolizinium as Fluorosolvatochromic Probe. J. Fluoresc. 2017;27:1221–1224. doi: 10.1007/s10895-017-2107-1. [DOI] [PubMed] [Google Scholar]
- 6.Gaines G.L. Solvatochromic compound as an acid indicator in nonaqueous media. Anal. Chem. 1976;48:450–451. doi: 10.1021/ac60366a047. [DOI] [Google Scholar]
- 7.Mitewa M., Mateeva N., Antonov L., Deligeorgiev T. Spectrophotometric Investigation of the Complex Formation of Aza-15-Crown-5 Containing Styryl Dyes with Ba2+ and Ca2+ Cations. Dyes Pigm. 1995;27:219–225. doi: 10.1016/0143-7208(94)00060-F. [DOI] [Google Scholar]
- 8.Malins C., Doyle A., MacCraith B.D., Kvasnik F., Landl M., Simon P., Kalvoda L., Lukas R., Pufler K., Babusik I. Personal ammonia sensor for industrial environments. J. Environ. Monit. 1999;1:417–422. doi: 10.1039/a904846d. [DOI] [PubMed] [Google Scholar]
- 9.Citterio D., Omagari M., Kawada T., Sasaki S., Suzuki Y., Suzuki K. Chromogenic betaine lariates for highly selective calcium ion sensing in aqueous environment. Anal. Chim. Acta. 2004;504:227–234. doi: 10.1016/j.aca.2003.10.050. [DOI] [Google Scholar]
- 10.Stock R.I., Dreyer J.P., Nunes G.E., Bechtold I.H., Machado V.G. Optical Chemosensors and Chemodosimeters for Anion Detection Based on Merrifield Resin Functionalized with Brooker’s Merocyanine Derivatives. ACS Appl. Polym. Mater. 2019;1:1757–1768. doi: 10.1021/acsapm.9b00314. [DOI] [Google Scholar]
- 11.Hubert C., Fichou D., Valat P. A solvatochromic dye doped polymer for detection of polar additives in hydrocarbon blends. Polymer. 1995;36:2663–2666. doi: 10.1016/0032-3861(95)91215-S. [DOI] [Google Scholar]
- 12.Koopmans C., Ritter H. Color Change of N-Isopropylacrylamide Copolymer Bearing Reichardts Dye as Optical Sensor for Lower Critical Solution Temperature and for Host–Guest Interaction with β-Cyclodextrin. J. Am. Chem. Soc. 2007;129:3502–3503. doi: 10.1021/ja068959v. [DOI] [PubMed] [Google Scholar]
- 13.Lee J., Chang H.T., An H., Ahn S., Shim J., Kim J.-M. A protective layer approach to solvatochromic sensor. Nat. Commun. 2013;4:2461. doi: 10.1038/ncomms3461. [DOI] [PMC free article] [PubMed] [Google Scholar]
- 14.Nandi L.G., Nicoleti C.R., Bellettini I.C., Machado V.G. Optical Chemosensor for the Detection of Cyanide in Water Based On Ethyl(hydroxyethyl)cellulose Functionalized with Brooker’s Merocyanine. Anal. Chem. 2014;86:4653–4656. doi: 10.1021/ac501233x. [DOI] [PubMed] [Google Scholar]
- 15.Lee J., Pyo M., Lee S.-H., Kim J., Ra M., Kim W.-Y., Park B.J., Lee C.W., Kim J.-M. Hydrochromic conjugated polymers for human sweat pore mapping. Nat. Commun. 2014;5:3736. doi: 10.1038/ncomms4736. [DOI] [PMC free article] [PubMed] [Google Scholar]
- 16.Nordhaus M.A., Krongauz V.V., Hai T.T. Synthesis of solvatochromic merocyanine dyes and their immobilization to polymers. J. Appl. Polym. Sci. 2017;134:1–14. doi: 10.1002/app.44451. [DOI] [Google Scholar]
- 17.Pasch P., Papadopoulos J., Goralczyk A., Hofer M.L., Tabatabai M., Müller T.J.J., Hartmann L. Highly Fluorescent Merocyanine and Cyanine PMMA Copolymers. Macromol. Rapid Commun. 2018;39:1800277. doi: 10.1002/marc.201800277. [DOI] [PubMed] [Google Scholar]
- 18.Crowther D., Liu X.M. Covalent lmmobilisation of Solvatochromic Dyes. J. Chem. Soc. Chem. Commun. 1995;23:2445. doi: 10.1039/c39950002445. [DOI] [Google Scholar]
- 19.Fiorilli S., Onida B., Barolo C., Viscardi G., Brunel D., Garrone E. Tethering of Modified Reichardt’s Dye on SBA-15 Mesoporous Silica: The Effect of the Linker Flexibility. Langmuir. 2007;23:2261–2268. doi: 10.1021/la062829i. [DOI] [PubMed] [Google Scholar]
- 20.Descalzo A.B., Marcos M.D., Monte C., Martínez-Máñez R., Rurack K. Mesoporous silica materials with covalently anchored phenoxazinone dyes as fluorescent hybrid materials for vapour sensing. J. Mater. Chem. 2007;17:4716–4723. doi: 10.1039/b707473e. [DOI] [Google Scholar]
- 21.Wintzheimer S., Oppmann M., Dold M., Pannek C., Bauersfeld M.-L., Henfling M., Trupp S., Schug B., Mandel K. Indicator Supraparticles for Smart Gasochromic Sensor Surfaces Reacting Ultrafast and Highly Sensitive. Part. Part. Syst. Charact. 2019;36:1900254. doi: 10.1002/ppsc.201900254. [DOI] [Google Scholar]
- 22.Gvishi R., Narang U., Bright F.V., Prasad P.N. Probing the Microenvironment of Polymer-Impregnated Composite Glass Using Solvatochromic Dye. Chem. Mater. 1995;7:1703–1708. doi: 10.1021/cm00057a020. [DOI] [Google Scholar]
- 23.Imai Y., Chujo Y. Solvatochromic Characterization of Organic–Inorganic Polymer Hybrids with Pyridinium N-Phenolate Betaine Dyes. Macromolecules. 2000;33:3059–3064. doi: 10.1021/ma9901846. [DOI] [Google Scholar]
- 24.Lu Z.-Z., Zhang R., Li Y.-Z., Guo Z.-J., Zheng H.-G. Solvatochromic behavior of a nanotubular metal organic framework for sensing small molecules. J. Am. Chem. Soc. 2011;133:4172–4174. doi: 10.1021/ja109437d. [DOI] [PubMed] [Google Scholar]
- 25.Ascherl L., Evans E.W., Hennemann M., Nuzzo D.D., Hufnagel A.G., Beetz M., Friend R.H., Clark T., Bein T., Auras F. Solvatochromic covalent organic frameworks. Nat. Commun. 2018;9:3802. doi: 10.1038/s41467-018-06161-w. [DOI] [PMC free article] [PubMed] [Google Scholar]
- 26.Liu H., Zhang Z., Zhao Y., Zhou Y., Xue B., Han Y., Wang Y., Mu X., Zang S., Zhou X., et al. A water-soluble two-dimensional supramolecular organic framework with aggregation-induced emission for DNA affinity and live-cell imaging. J. Mater. Chem. B. 2019;7:1435–1441. doi: 10.1039/C8TB03206H. [DOI] [PubMed] [Google Scholar]
- 27.Li Y., Wang L., Yin X., Ding B., Sun G., Ke T., Chen J., Yu J. Colorimetric strips for visual lead ion recognition utilizing polydiacetylene embedded nanofibers. J. Mater. Chem. A. 2014;2:18304–18312. doi: 10.1039/C4TA04547E. [DOI] [Google Scholar]
- 28.Nakabayashi K., Takahashi T., Sugawara R., Lo C.-T., Mori H. Benzothiadiazole-based donor–acceptor nanoparticles with solvatochromic and thermoresponsive properties. React. Funct. Polym. 2018;131:350–360. doi: 10.1016/j.reactfunctpolym.2018.08.011. [DOI] [Google Scholar]
- 29.Arshad F., Pal A., Rahman M.A., Ali M., Khan J.A., Sk M.P. Insights on the solvatochromic effects in N-doped yellow orange emissive carbon dots. New J. Chem. 2018;42:19837–19843. doi: 10.1039/C8NJ03698E. [DOI] [Google Scholar]
- 30.Pramanik A., Biswas S., Kumbhakar P. Solvatochromism in highly luminescent environmental friendly carbon quantum dots for sensing applications: Conversion of bio-waste into bio-asset. Spectrochim. Acta Part A. 2018;191:498–512. doi: 10.1016/j.saa.2017.10.054. [DOI] [PubMed] [Google Scholar]
- 31.Baranowska-Korczyc A., Stelmach E., Paterczyk B., Maksymiuk K., Michalska A. Ultrasmall self-assembly poly(N-isopropylacrylamide-butyl acrylate) (polyNIPAM-BA) thermoresponsive nanoparticles. J. Colloid Interface Sci. 2019;542:317–324. doi: 10.1016/j.jcis.2019.02.004. [DOI] [PubMed] [Google Scholar]
- 32.Nayl A.A., Abd-Elhamid A.I., Aly A.A., Bräse S. Recent progress in the applications of silica-based nanoparticles. RSC Adv. 2022;12:13706–13726. doi: 10.1039/D2RA01587K. [DOI] [PMC free article] [PubMed] [Google Scholar]
- 33.Marcus Y. Preferential solvation. Part 3.—Binary solvent mixtures. J. Chem. Soc. Faraday Trans. 1989;85:381–388. doi: 10.1039/f19898500381. [DOI] [Google Scholar]
- 34.Li X.C., King T.A., Pallikari-Viras F. Characteristics of composites based on PMMA modified gel silica glasses. J. Non-Cryst. Solids. 1994;170:243–249. doi: 10.1016/0022-3093(94)90053-1. [DOI] [Google Scholar]
- 35.Onida B., Fiorilli S., Borello L., Viscardi G., Macquarrie D., Garrone E. Mechanism of the Optical Response of Mesoporous Silica Impregnated with Reichardt’s Dye to NH3 and Other Gases. J. Phys. Chem. B. 2004;108:16617–16620. doi: 10.1021/jp037094u. [DOI] [Google Scholar]
- 36.Szkop M., Kliszcz B., Kasprzak A.A. A simple and reproducible protocol of glass surface silanization for TIRF microscopy imaging. Anal. Biochem. 2018;549:119–123. doi: 10.1016/j.ab.2018.03.020. [DOI] [PubMed] [Google Scholar]
- 37.Reichardt C. Über Pyridinium-N-phenol-betaine und ihre Verwendung zur Charakterisierung der Polarität von Lösungsmitteln, VI1) Erweiterung der Lösungsmittelpolaritätsskala durch Bestimmung neuer molarer Übergangsenergien (ET-Werte) Justus Liebigs Ann. Chem. 1971;752:64–67. doi: 10.1002/jlac.19717520109. [DOI] [Google Scholar]
- 38.Morley J.O., Morley R.M., Docherty R., Charlton M.H. Fundamental Studies on Brooker’s Merocyanine. J. Am. Chem. Soc. 1997;119:10192–10202. doi: 10.1021/ja971477m. [DOI] [Google Scholar]
- 39.Brooker-1951 Brooker L.G.S., Keyes G.H., Heseltine D.W. Color and Constitution. XI.1 Anhydronium Bases of p-Hydroxystyryl Dyes as Solvent Polarity Indicators. J. Am. Chem. Soc. 1951;73:5350–5356. doi: 10.1021/ja01155a097. [DOI] [Google Scholar]
- 40.Garcia-Guzman C., Fernandez A., Avlonitis N., Bradley M., Vendrell M. Red-Fluorescent Activatable Probes for the Detection of Hydrogen Peroxide in Living Cells. Comb. Chem. High Throughput Screen. 2016;19:353–361. doi: 10.2174/1386207319666160408151313. [DOI] [PubMed] [Google Scholar]
- 41.Dutkiewicz M. Classification of Organic Solvents based on Correlation between Dielectric β Parameter and Empirical Solvent Polarity Parameter . J. Chem. Soc. Faraday Trans. 1990;86:2237–2241. doi: 10.1039/ft9908602237. [DOI] [Google Scholar]
- 42.Reichardt C., Harbusch-Görnert E. Über Pyridinium-N-phenolat-Betaine und ihre Verwendung zur Charakterisierung der Polarität von Lösungsmitteln, X. Erweiterung, Korrektur und Neudefinition der ET Lösungsmittelpolaritätsskala mit Hilfe eines lipophilen penta-tert-butyl-substituierten Pyridinium N-phenolat-Betainfarbstoffes. Liebigs Ann. Chem. 1983;5:721–896. doi: 10.1002/jlac.198319830502. [DOI] [Google Scholar]
- 43.Lippert E., Lüder W., Moll F., Nägele W., Boos H., Prigge H., Seibold-Blankenstein I. Umwandlung von Elektronenanregungsenergie. Angew. Chem. 1961;73:695–706. doi: 10.1002/ange.19610732103. [DOI] [Google Scholar]
- 44.Dennis K.J., Luong T., Reshwan M.L., Minch M.J. Isomerizable N-alkylmerocyanine dyes as probes of micellar solubilization sites. J. Phys. Chem. 1993;97:8328–8335. doi: 10.1021/j100133a032. [DOI] [Google Scholar]
- 45.Kumar U., Kato T., Frechet J.M.J. Use of intermolecular hydrogen bonding for the induction of liquid crystallinity in the side chain of polysiloxanes. J. Am. Chem. Soc. 1992;114:6630–6639. doi: 10.1021/ja00043a004. [DOI] [Google Scholar]
Associated Data
This section collects any data citations, data availability statements, or supplementary materials included in this article.
Supplementary Materials
Data Availability Statement
All data used to support the findings of this study are included in the article and Supplementary Materials. Spectra in raw data format are available upon request.


