

ABSTRACT
This study aimed to develop a computed tomography (CT)-based radiomics model capable of precisely predicting hyperprogression and pseudoprogression (PP) in patients with non-small cell lung cancer (NSCLC) treated with immunotherapy. We retrospectively analyzed 105 patients with NSCLC, from three institutions, treated with immune checkpoint inhibitors (ICIs) and categorized them into training and independent testing set. Subsequently, we processed CT scans with a series of image-preprocessing techniques, and 6008 radiomic features capturing intra- and peritumoral texture patterns were extracted. We used the least absolute shrinkage and selection operator logistic regression model to select radiomic features and construct machine learning models. To further differentiate between progressive disease (PD) and hyperprogressive disease (HPD), we developed a new radiomics model. The logistic regression (LR) model showed optimal performance in distinguishing PP from HPD, with areas under the receiver operating characteristic curve (AUC) of 0.95 (95% confidence interval [CI]: 0.91-0.99) and 0.88 (95% CI: 0.66-1) in the training and testing sets, respectively. Additionally, the support vector machine model showed optimal performance in distinguishing PD from HPD, with AUC of 0.97 (95% CI: 0.93-1) and 0.87 (95% CI: 0.72-1) in the training and testing sets, respectively. Kaplan‒Meier survival curves showed clear stratification between PP predicted by the radiomics model and true progression (HPD and PD) (hazard ratio = 0.337, 95% CI: 0.200–0.568, p < 0.01) in overall survival. Our study demonstrates that radiomic features extracted from baseline CT scans are effective in predicting PP and HPD in patients with NSCLC treated with ICIs.
KEYWORDS: Computed tomography, hyperprogression, immunotherapy, non-small cell lung cancer, pseudoprogression, radiomics
Introduction
The introduction of immune checkpoint inhibitors (ICIs) has transformed the treatment paradigm for various malignancies, including non-small cell lung cancer (NSCLC). Immunotherapy, distinct from other therapeutic modalities, elicits atypical responses, including pseudoprogression (PP) and hyperprogressive disease (HPD). This has led to the development of immune-related response evaluation criteria, including the immune-related Response Criteria (irRC),1 immune-related Response Evaluation Criteria in Solid Tumors (irRECIST),2 and immune-based Response Evaluation Criteria in Solid Tumors (iRECIST).3 Pseudoprogression, characterized by a transient increase in the tumor burden due to delayed tumor shrinkage, should be distinguished from true tumor progression, encompassing hyperprogression and progression. Accurate identification of pseudoprogression is critical because it directly affects clinical decision making in patients who may benefit from ICI therapy. The incidence of pseudoprogression ranges from 0.6% to 9.96%,1,4–6 depending on tumor type and the criteria employed for assessment. HPD is characterized by an accelerated rate of tumor growth, which typically results in the deterioration of the patient’s condition after immunotherapy.7 The incidence of HPD varies from 5.0% to 37.0%,8–11 with variations attributed to tumor histology and the applied diagnostic criteria.
The underlying biological and clinical causes of PP development in response to ICIs are poorly understood. Based on published findings, PP can be linked to the presence of immune cells, such as CD103+ tissue-resident memory cells and T cells.12,13 Another mechanism could involve the delayed establishment of an adaptive immune response, resulting in sustained tumor growth until a sufficient immune response is mounted.14 The pathogenesis of HPD may be associated with the amplification of EGFR or MDM2/4,15 while IFNγ signaling might also contribute to tumor hyperprogression.16 Various molecular changes, such as circulating tumor DNA (ctDNA),17 Interleukin-8 (IL-8),18 CXC motif chemokine ligand 2 (CXCL2),19 and neutrophil-to-lymphocyte ratio (NLR)20,21 can serve as potential indicators for evaluating atypical responses. However, these approaches have not been consistently replicated in all studies. Biopsy is an important diagnostic tool for pseudoprogression. Accumulating evidence indicates that pseudoprogression may result from lymphocyte infiltration into the tumor, leading to a transient increase in tumor size instead of actual neoplastic cell growth.6 However, biopsies are frequently limited by inadequate tissue samples, spatial heterogeneity, and procedural risks.
Computed tomography (CT) is a routine examination tool that provides a large amount of valuable information. CT imaging-based radiomics is the process of separating a region of interest (ROI), extracting quantitative features using artificial intelligence algorithms, and conducting subsequent data analysis to provide decision support.22 Radiomic features have been applied to guide clinical decision-making, including differential diagnosis23,24 and treatment response prediction for various cancers.25,26 However, investigations utilizing radiomic features to predict atypical responses to cancer immunotherapy are lacking. Studies have demonstrated the efficacy of 18F-fluoro-ethyl-tyrosine PET imaging in accurately identifying the progression disease (PD) and PP of brain metastases in patients with NSCLC undergoing immunotherapy and radiotherapy.27 Baseline CT scans can serve as a predictive tool for assessing the risk of HPD in patients with NSCLC treated with immunotherapy.28 However, differentiating between PP and HPD in patients with NSCLC post-immunotherapy lacks investigation, necessitating a noninvasive and instant predictive method.
This study aimed to develop and evaluate a radiomics model capable of accurately predicting PP and HPD in patients with NSCLC.
Materials and methods
Study design
This retrospective observational study adhered to the principles outlined in the Declaration of Helsinki and 2008 Declaration of Istanbul. The study was approved by the Ethics Committee for Clinical Research of the Shandong Cancer Hospital and Institute (SDTHEC2023010013), and the requirement for informed consent was waived.
Patients
We retrospectively collected data from 1,146 patients with NSCLC who were treated with ICIs between May 2019 and October 2022. Subsequently, radiomics models were constructed using datasets from three distinct hospitals: the training set from Shandong Cancer Hospital and the external testing set from both Shandong Provincial Hospital and Shandong Proton Center. The inclusion criteria included (1) all tumors pathologically confirmed as NSCLC, (2) at least two cycles of ICIs administered, and (3) age ˃18 years. The exclusion criteria were (1) no previous, baseline, or follow-up CT scans; (2) CT showing inflammatory lung cancer or non-measurable lesions; (3) obvious artifacts on CT images; and (4) variable response to treatment. Finally, 105 patients were included in the study. The overall work design is illustrated in Figure 1.
Figure 1.
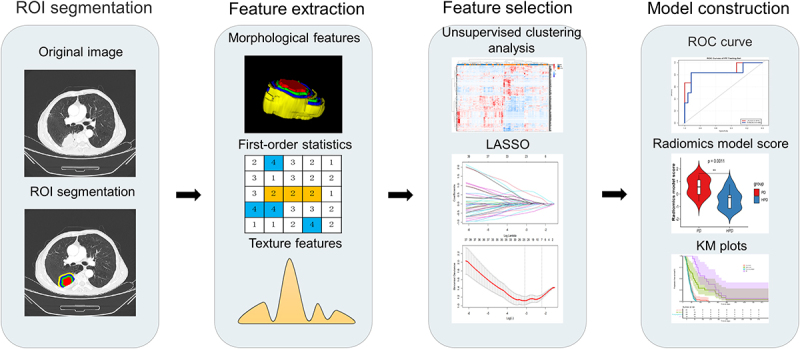
Workflow and pipeline overview. Tumor identification and annotation were performed before immunotherapy using the PyRadimocs package based on python (version 3.7.1) to extract intra-tumoral and peri-tumoral radiomic features. Subsequently, LASSO regression was employed to select relevant features from the training set, followed by the construction of radiomics models using LR and SVM classifiers. These models were validated using an independent testing set.
CT image acquisition
All patients underwent standard contrast-enhanced computed tomography (CECT). CT examinations were conducted using various devices, including Philips, Siemens, Toshiba, and GE CT scanners. The adopted scanning protocol utilized a tube voltage of 120 kV, a tube current ranging from 160–300 mA, an in-plane pixel resolution between 0.68–0.87 mm, and operated in the helical scanning mode.
Identifying PP, HPD, and PD
Patient responses were assessed by two thoracic radiologists with 10 and 8 years of clinical experience, respectively. These radiologists were blinded to the patients’ clinical histories and performed evaluations based on baseline and post-immunotherapy CT scans (within 6 months) in accordance with RECIST version 1.1. PP was defined as a ≥ 25% increase in tumor burden at week 12 that was not confirmed as a progressive disease at the next assessment29 (Figure 2(a)). Meanwhile, in order to determine the HPD, we defined HPD as the first evaluation of tumor progression following immunotherapy, characterized by a rate of progression exceeding twice the baseline and a tumor size greater than 50% (Figure 2(c)). The criterion for PD was defined as a minimum increase of ≥ 20% in the total sum of tumor target diameters (Figure 2(b)).
Figure 2.

CECT scans: (a) Pseudoprogression, (b) Progression, and (c) Hyperprogression. Baseline CECT was performed when the patient was receiving immunotherapy, pre-treatment CT was performed more than 2 weeks before immunotherapy, and the first and second evaluations were within 6 months.
Segmentation and feature extraction
Two expert thoracic radiologists separately mapped the ROI on the tumor’s contour in pretreatment CECT images using ITK-SNAP software (version 3.8.0, available at https://www.itksnap.org). Subsequently, an expanded morphological approach was employed to delineate a 5 mm-wide ring that extended radially from 0 to 15 mm beyond the tumor nodule, enabling comprehensive characterization of peritumoral features while excluding adjacent healthy tissues or organs. To evaluate consistency, both intra- and interobserver reliabilities were tested by having the two radiologists repeat the segmentation for 30 randomly chosen patients after 1-month interval. We employed specific preprocessing steps in our imaging analysis, focusing on voxel resampling and gray-intensity normalization. Voxel resampling standardized the pixel spacing across all images to ensure consistent voxel dimensions of 1 × 1 × 1 mm. Additionally, we implemented gray intensity normalization to standardize the range of intensity values, reducing variations unrelated to tissue properties. The PyRadiomics package in Python (version 3.7.1) was used to extract 1502 radiomic features from each region.30 In total, 6008 radiomic features were extracted from the peritumoral (0–5 mm, 5–10 mm, and 10–15 mm) and intratumoral areas. The Z-score normalization method was employed to standardize radiomic features in the training set, and the same method was used to normalize features in the testing set using the mean and standard deviation values derived from the training set.
Radiomics model building
To evaluate and analyze patients in the dataset, unsupervised clustering of radiomic features was performed using heat maps to distinguish between patients with different treatment responses.
Intra-class correlation coefficient (ICC) was computed to assess both intra- and inter-observer consistency. Features demonstrating strong intra- and inter-observer reliability (ICC >0.8) were selected for further analysis. The Mann‒Whitney U test or t-test was employed to identify radiomic features with P-value ˂0.05. To eliminate redundant variables, Spearman’s correlation analysis was applied, removing features displaying a high correlation (Spearman’s coefficient > 0.90) from the dataset.
A synthetic minority oversampling technique (SMOTE) was implemented to address class imbalance in the training set. This expanded the sample size of the patients with PP, achieving a more balanced dataset. Subsequently, the least absolute shrinkage and selection operator (LASSO) regression algorithm was employed with 10-fold cross-validation to identify the top-performing features with nonzero coefficients (Figure S1). Machine learning-based models were developed using classifiers, such as support vector machine (SVM) and logistic regression (LR), and evaluated on an independent testing set. The same radiomics modeling strategy was employed for the HPD group to distinguish between HPD and PD. The model’s predictive efficacy was assessed using various metrics, including the area under the receiver operating curve (AUC) with a 95% confidence interval (CI), accuracy (ACC), sensitivity (SEN), specificity (SPE), positive predictive value (PPV), negative predictive value (NPV), and F1 score.
In our radiomics model, employing SVM and LR algorithms, the cutoff value for distinguishing between low- and high-score cases is determined by the natural decision thresholds inherent in these models.31 Progression-free survival (PFS) and overall survival (OS) were compared between the two groups. PFS was defined as the duration from the initiation of ICIs treatment to either disease progression or death due to any cause, and OS was defined as the duration between the initiation of ICIs treatment and death. To assess PFS and OS, we employed the Kaplan‒Meier method and evaluated the differences in Kaplan‒Meier curves using the log-rank test.
Statistical analyses
Statistical analyses were performed using SPSS (version 26.0; IBM Corp., Armonk, NY, USA) and R software (version 4.2.2). Blood variables did not follow a normal distribution and were reported as medians (interquartile ranges). The Kruskal‒Wallis test was used to compare blood variables across different groups. Associations between radiomic features and clinical variables were assessed using the unpaired, two-tailed chi-square test or Fisher’s exact test for categorical variables and the Student’s t-test or Mann–Whitney U-test for continuous variables. Statistical significance was defined as a two-sided p<0.05.
Results
Patient dataset
We retrospectively collected data of 1146 patients who underwent immunotherapy, of whom 105 met the predefined inclusion criteria, with 16 exhibiting PP, 44 exhibiting HPD, and 45 exhibiting PD. The distribution of patients in the training and testing sets is presented in Table S1. Table 1 summarizes the clinicopathological characteristics of the patients. The patients who received immunochemotherapy demonstrated a significantly lower incidence of HPD compared to those treated with ICIs monotherapy (P<0.001). No statistically significant differences (P>0.05) were observed in sex, age, smoking history, ECOG performance status, number of prior lines of systemic cancer therapy, combined targeted therapy, histology, PD-L1 expression status, EGFR mutation status, liver metastasis, or number of metastases among the three groups. Moreover, no statistically significant differences were observed in lymphocytes, neutrophils, LDH (lactate dehydrogenase), NLR, dNLR (derived neutrophil-to-lymphocyte ratio), and SII (Systemic Immune Inflammation Index) (Table S2).
Table 1.
Clinical characteristics of the dataset.
| ALL | HPD | PD | PP | P value (χ2) |
|
|---|---|---|---|---|---|
| Number of patients | 105(100) | 44(41.9) | 45(42.9) | 16(15.2) | |
| Sex | |||||
| Female | 22(21.0) | 11(25.0) | 7(15.6) | 4(25.0) | 0.497 |
| Male | 83(79.0) | 33(75.0) | 38(84.4) | 12(75.0) | |
| AGE | |||||
| >60 | 41(39.0) | 22(50.0) | 15(33.3) | 4(25.0) | 0.137 |
| ≤60 | 64(61.0) | 22(50.0) | 30(66.7) | 12(75.0) | |
| Smoking | |||||
| Never | 51(48.6) | 24(54.5) | 21(46.7) | 6(37.5) | 0.505 |
| Current/former | 54(51.4) | 20(45.5) | 24(53.3) | 10(62.5) | |
| ECOGa | |||||
| 0–1 | 100(95.2) | 41(93.2) | 43(95.6) | 16(100.0) | 0.737 |
| ≥2 | 5(4.8) | 3(6.8) | 2(4.4) | 0(0) | |
| Number of lines of prior systemic cancer therapy | |||||
| >2 | 26(24.8) | 15(34.1) | 8(17.8) | 3(18.8) | 0.203 |
| ≤2 | 79(75.2) | 29(65.9) | 37(82.2) | 13(81.2) | |
| Combine chemotherapy | |||||
| With | 87(82.9) | 29(65.9) | 43(95.6) | 15(93.8) | 0.001* |
| Without | 18(17.1) | 15(34.1) | 2(4.4) | 1(6.2) | |
| Combine targeting | |||||
| With | 20(19.0) | 9(20.5) | 6(13.3) | 5(31.3) | 0.294 |
| Without | 85(81.0) | 35(79.5) | 39(86.6) | 11(68.7) | |
| Histology | |||||
| Non-SCC | 73(69.5) | 34(77.3) | 31(68.9) | 8(50) | 0.116 |
| SCCb | 32(30.5) | 10(22.7) | 14(31.1) | 8(50) | |
| TNM stage | |||||
| III | 24(22.9) | 11(25.0) | 8(17.8) | 5(31.3) | 0.493 |
| IV | 81(77.1) | 33(75.0) | 37(82.2) | 11(68.8) | |
| PDL1 | |||||
| Positive | 17(16.2) | 3(6.8) | 9(20.0) | 5(31.3) | 0.089 |
| Negative | 17(16.2) | 8(18.2) | 8(17.8) | 1(6.2) | |
| Unknown | 71(67.6) | 33(75.0) | 28(62.2) | 10(62.5) | |
| EGFR | |||||
| Positive | 14(13.3) | 8(18.2) | 5(11.1) | 1(6.3) | 0.547 |
| Negative | 41(39.1) | 16(36.4) | 20(44.4) | 5(31.3) | |
| Unknown | 50(47.6) | 20(45.4) | 20(44.4) | 10(62.5) | |
| Liver metastasis | |||||
| With | 15(14.3) | 7(15.9) | 7(15.6) | 1(6.3) | 0.612 |
| Without | 90(85.7) | 37(84.1) | 38(84.4) | 15(93.8) | |
| Metastasis | |||||
| >3 | 46(43.8) | 24(54.5) | 18(40.0) | 4(25.0) | 0.105 |
| ≤3 | 59(56.2) | 20(45.5) | 27(60.0) | 12(75.0) |
aECOG, Eastern Cooperative Oncology Group. b SCC, squamous cell carcinoma.
PP radiomics model development and testing
A heatmap analysis of intratumoral and 0–5 mm peritumoral radiomic features revealed that cluster 1 encompassed 81.3% of patients with PP (Figure 3(a)). Similarly, heatmap analysis of 5–15 mm peritumoral radiomic features demonstrated clustering of patients with PP (Figure 3(b)), potentially indicating that these specific patient groups had distinct radiomic features than that of patients with true progression.
Figure 3.

Radiomic feature selection. (a) Heat maps of unsupervised clustering analysis for intratumoral and 0–5 mm peritumoral radiomic features with 81.3% PP clustered together in cluster 1. (b) Heat maps of unsupervised clustering analysis for 5–15 mm peritumoral radiomic features of the PP group. (c) Heat maps of unsupervised clustering analysis for intratumoral and 0–5 mm peritumoral radiomic features with 65.9% HPD clustered together in cluster 2. (d) Heat maps of unsupervised clustering analysis for 5–15 mm peritumoral radiomic features of the HPD group.
Seven radiomic features, including four intratumoral and three peritumoral (Table S3), were selected using LASSO regression analysis. The selected radiomic features did not exhibit any significant correlation with clinical variables, as determined by Pearson’s correlation coefficient. (Figure S2A).
The LR model exhibited a superior performance. The radiomics model score was significantly higher in the PP group than in the true progression group, both in the training (mean, 0.84 ± 0.17 vs. 0.15 ± 0.27, p<0.0005) and testing (mean, 0.79 ± 0.40 vs. 0.10 ± 0.28, p<0.05) sets (Figure 5(a,b)). In the training set (n = 75), the LR radiomics model achieved an AUC of 0.95 (95% CI, 0.91–0.99) (Figure 4(a)) and demonstrated a predictive accuracy of 0.88 for distinguishing PP from other response patterns, with sensitivity and specificity of 0.92 and 0.86, respectively. In the independent testing set (n = 30), the LR model exhibited an AUC of 0.88 (95% CI, 0.66–1) (Figure 4(b)), with a model accuracy, sensitivity, and specificity of 0.90, 0.83, and 0.92, respectively; the F1 score was observed to be 0.77, while the positive and negative predictive rates were 0.71 and 0.96, respectively (Table S5).
Figure 5.

Prognostic performance of radiomics models for predicting response to immunotherapy. The difference in radiomics model scores between the training set (a) and the testing set (b) in the PP group, and between the training set (c) and the testing set (d) in the HPD group. (e) Kaplan – Meier analysis of progression-free survival was performed according to the binary radiomics model score for patients with PP and true progression. (f) Kaplan – Meier analysis of progression-free survival was performed according to the binary radiomics model score for patients with HPD and PD. (g) Kaplan – Meier analysis of overall survival was performed according to the binary radiomics model score for patients with PP and true progression. (f) Kaplan – Meier analysis of overall survival was performed according to the binary radiomics model score for patients with HPD and PD.
Figure 4.

Performance analysis of the models. The ROC curve of LR and SVM model in the PP training set (a) and the testing set (b). The ROC curve of LR and SVM model in the HPD training set (c) and the testing set (d).
HPD radiomics model development and testing
Our results indicated that patients with HPD were more likely to cluster together in the unsupervised clustering analysis of patients with true progression (PD and HPD), suggesting that they had a distinct radiomic signature compared to those with PD (Figure 3(c,d)). Subsequently, LASSO regression analysis was performed on the radiomic features, resulting in the selection of seven features: four intratumoral and three peritumoral (Table S3). Pearson’s correlation analysis was conducted on the selected radiomic and clinical features; however, no significant correlations were identified (Figure S2B).
The SVM radiomics model demonstrated optimal classifier performance. In the training (0.87 ± 0.47 vs −0.74 ± 0.62, p<0.0005) and testing (0.58 ± 0.70 vs. 0.44 ± 0.71, p<0.005) sets (Figure 5(c,d)), the radiomics model scores of the PD group were higher than those of the HPD group. In the training set, the AUC for distinguishing HPD responders was 0.97 (95% CI, 0.93–1) (Figure 4(c)), with an accuracy of 0.92 and a sensitivity and specificity of 0.88 and 0.97, respectively. In the testing set, the model achieved an AUC of 0.87 (95% CI, 0.72–1) (Figure 4(d)), with an accuracy of 0.83, and a sensitivity and specificity of 0.92 and 0.75, respectively. The F1 score is 0.85 (Table S5).
In the univariate analysis, patients receiving immunotherapy without chemotherapy demonstrated a significantly higher risk of HPD than that of those receiving combination chemotherapy (p = 0.03) (Table S4). By incorporating this factor into the radiomics model score, a clinical-radiomic model was created, demonstrating enhanced predictive capability on both the training and testing sets, achieving AUCs of 0.97 and 0.90, respectively (Figure S3).
Radiomics model to predict the outcome of NSCLC immunotherapy
Patients with PP demonstrated significantly prolonged PFS than that of patients with true progression (hazard ratio [HR] = 0.246, 95% CI: 0.167–0.362, p<0.01) (Figure 5(e)). Furthermore, patients with PD had a significantly longer PFS than that of patients with HPD (HR = 0.397, 95% CI: 0.250–0.631; p<0.01) (Figure 5(f)). The radiomics model for PP revealed that patients with high scores in the model experienced extended PFS that that of patients with low scores (HR = 0.430, 95% CI: 0.291–0.635, p<0.01) (Figure 5(e)). Similarly, the HPD radiomics model also indicated that patients with high scores had a longer PFS than that of patients with low scores (HR = 0.458, 95% CI: 0.291–0.721; p<0.01) (Figure 5(f)).
Furthermore, we conducted a comprehensive analysis of the OS. We observed that patients with PP had a significantly longer OS than that of patients with true progression (HR = 0.280, 95% CI: 0.161–0.486, p<0.01) (Figure 5(g)). Similarly, patients with PD had a markedly longer OS than those with HPD (HR = 0.412, 95% CI: 0.244–0.696, p<0.01) (Figure 5(h)). In the predictive model for PP, patients with high scores demonstrated a substantially longer OS than those with low scores (HR = 0.337, 95% CI: 0.200–0.568, p<0.01) (Figure 5(g)). A parallel trend was observed in the HPD predictive model, where patients with high scores also exhibited a significantly extended OS compared to those with low scores (HR = 0.506, 95% CI: 0.300-0.853, p<0.01) (Figure 5(h)).
Discussion
The utilization of a noninvasive and widely employed technique to prognosticate the risk of PP and HPD after immunotherapy holds paramount significance, while CT radiomics models exhibit inadequate development and validation for predicting the risk of PP and HPD. We developed CT radiomics models based on machine learning for noninvasive prediction of PP and HPD in patients with NSCLC undergoing immunotherapy, specifically using SVM and LR models known for their strong generalization capabilities. In the PP group, the LR model outperformed, achieving an AUC of 0.95 and 0.88 in the training and testing sets, respectively. The SVM model demonstrated a slightly lower efficacy, with AUCs of 0.95 and 0.84 for the training and testing sets, respectively. In the HPD group, the SVM model outperformed, achieving an AUC of 0.97 and 0.87 in the training and testing sets, respectively, whereas the LR model showed comparatively lower performance with AUCs of 0.96 and 0.80 for the training and testing sets, respectively.
The incidence of pseudoprogressive disease was 1.7%, aligning with the findings of previous studies.6 Existing literature demonstrates promising diagnostic potential for differentiating PP using NLR, ctDNA, IL-8, and CXCL2,17–20 although these tests, conducted only on small sample sizes, require further validation through larger-scale studies. Repeated pathological examinations of the primary or metastatic site can similarly facilitate an accurate diagnosis; however, biopsies carry inherent invasiveness and associated risks. Radiomics has emerged as a significant digital biopsy method for predicting the biological features of tumors and has demonstrated potential for noninvasive assessment of immunotherapy efficacy.32 Tian et al. used radiomic features to predict the expression of PDL1 in NSCLC and inferred the clinical outcome of immunotherapy.33 Existing evidence suggests that the pattern of PP may be attributed to immune cell infiltration, such as T lymphocytes and CD103+ tissue-resident memory cells, which exhibit distinct CT radiomic features compared to tumor cells, leading to a transient increase in tumor burden.1,12,13,34–36 Additionally, the underlying pathogenesis of PP is linked to delayed activation of the adaptive immune system14,29 and vascular changes surrounding the tumor.37,38 Both factors are intricately linked to the tumor microenvironment (TME), and numerous studies have shown that the TME exerts a profound influence on tumor response following treatment. The peritumoral area plays a crucial role in the TME,39–41 Sun et al. predicted CD8 cells with peritumoral radiomic features and used these features to predict the immunotherapy response.41 He et al. demonstrated that the selection of the largest lesion as a measure for assessing treatment response offers enhanced accuracy and convenience,42 thus, we selected the largest lesion for delineation. Our analysis revealed excellent performance of the radiomics model, incorporating intratumoral and peritumoral radiomic features, in predicting PP and true progression.
In this study, the incidence of HPD was 5%, consistent with previous reports.11,43 Several reports have indicated a potential association between HPD and various factors, such as age, sex, EGFR, and metastatic burden;44,45 however, findings are mostly contradictory across studies. In our study, compared to patients receiving ICIs monotherapy, those receiving immunochemotherapy exhibited a significantly lower incidence of HPD, suggesting that combination chemotherapy may mitigate the risk of developing HPD after ICIs treatment.43,46 The pathogenesis of HPD is closely associated with the TME, and several studies have demonstrated that the interaction between the immune checkpoint antibodies, Fc/FcR, and macrophages serves as a mechanism of HPD following PD-1/PD-L1 blockade. An imbalance between effector and regulatory T cells within the TME is also implicated in HPD after PD-1 blockade.47 Furthermore, the main mechanism underlying ICI-related HPD involves the immunogenicity, metabolism, and cancer pathways through the IFNγ PKM2-β-catenin cascade in preclinical models.16 The pathogenesis of HPD is closely associated with TME, and the predictive performance of intratumoral and peritumoral radiomics models surpasses that of a single peritumoral model.48 Therefore, we extracted the intratumoral and peritumoral radiomic features to construct the radiomics model that demonstrated excellent performance in our analysis.
Deep learning, an advanced subset of machine learning, excels in autonomously extracting hierarchical features from raw data, showing remarkable proficiency and diagnostic versatility. This is exceptionally relevant in oncology because of its critical role in cancer diagnosis, monitoring treatment response, and predicting patient outcomes.49–52 By using deep learning, we can substantially increase the accuracy of predictive models for PP and HPD through comprehensive analysis of complex, high-dimensional datasets that integrate radiomics, genomic, and clinical data, optimizing patient outcomes and minimizing ineffective therapies. Although our current research employed traditional machine-learning techniques owing to dataset limitations, the accumulation of larger datasets allows us to transition to deep-learning techniques for a more sophisticated analysis. This application of deep learning is set to transform our predictive capabilities, offering a nuanced understanding of the relationship between radiomic changes and immune response, thus enabling a more precise identification of patients requiring an alternative therapeutic approach for HPD compared to those with PP, where continued immunotherapy may be beneficial.
This study has several limitations. First, the retrospective nature of the study and low incidence of PP and HPD resulted in a limited number of cases available for analysis. Second, as this was a multicenter study, CT parameters varied across different institutions; therefore, we standardized the images before feature extraction. Finally, although PDL1 and EGFR expression have demonstrated predictive values for PP and HPD in other studies, their absence from our clinical factors hindered our ability to fully assess their predictive power.
Conclusion
In conclusion, our study used a radiomics model to predict PP and HPD following immunotherapy in NSCLC. Intratumoral and peritumoral radiomic features based on noninvasive CT can be used to detect atypical tumor responses before immunotherapy, aiding clinicians in effectively managing patients and tailoring personalized treatment options.
Supplementary Material
Funding Statement
The work was supported by grants from the Academic Promotion Program of Shandong First Medical University under Grant number 2019ZL002; Research Unit of Radiation Oncology, Chinese Academy of Medical Sciences under Grant number 2019RU071; the National Natural Science Foundation of China under Grant numbers 81627901, 81972863, and 82030082; and the Natural Science Foundation of Shandong under Grant number ZR201911040452.
Disclosure statement
No potential conflict of interest was reported by the author(s).
Supplementary material
Supplemental data for this article can be accessed online at https://doi.org/10.1080/2162402X.2024.2312628.
References
- 1.Wolchok JD, Hoos A, O’Day S, Weber JS, Hamid O, Lebbé C, Maio M, Binder M, Bohnsack O, Nichol G. et al. Guidelines for the evaluation of immune therapy activity in solid tumors: immune-related response criteria. Clin Cancer Res. 2009;15(23):7412–10. doi: 10.1158/1078-0432.CCR-09-1624. [DOI] [PubMed] [Google Scholar]
- 2.Nishino M, Giobbie-Hurder A, Gargano M, Suda M, Ramaiya NH, Hodi FS. Developing a common language for tumor response to immunotherapy: immune-related response criteria using unidimensional measurements. Clin Cancer Res. 2013;19(14):3936–3943. doi: 10.1158/1078-0432.CCR-13-0895. [DOI] [PMC free article] [PubMed] [Google Scholar]
- 3.Seymour L, Bogaerts J, Perrone A, Ford R, Schwartz LH, Mandrekar S, Lin NU, Litière S, Dancey J, Chen A. et al. iRECIST: guidelines for response criteria for use in trials testing immunotherapeutics. Lancet Oncol. 2017;18(3):e143–e152. doi: 10.1016/S1470-2045(17)30074-8. [DOI] [PMC free article] [PubMed] [Google Scholar]
- 4.Borghaei H, Paz-Ares L, Horn L, Spigel DR, Steins M, Ready NE, Chow LQ, Vokes EE, Felip E, Holgado E. et al. Nivolumab versus Docetaxel in Advanced Nonsquamous Non-Small-Cell Lung Cancer. N Engl J Med. 2015;373(17):1627–1639. doi: 10.1056/NEJMoa1507643. [DOI] [PMC free article] [PubMed] [Google Scholar]
- 5.Chiou VL, Burotto M. Pseudoprogression and Immune-Related Response in Solid Tumors. J Clin Oncol. 2015;33(31):3541–3543. doi: 10.1200/JCO.2015.61.6870. [DOI] [PMC free article] [PubMed] [Google Scholar]
- 6.Chen MY, Zeng YC. Pseudoprogression in lung cancer patients treated with immunotherapy. Crit Rev Oncol Hematol. 2022;169:103531. doi: 10.1016/j.critrevonc.2021.103531. [DOI] [PubMed] [Google Scholar]
- 7.Champiat S, Dercle L, Ammari S, Massard C, Hollebecque A, Postel-Vinay S, Chaput N, Eggermont A, Marabelle A, Soria J-C. et al. Hyperprogressive disease is a new pattern of progression in cancer patients treated by anti-PD-1/PD-L1. Clin Cancer Res. 2017;23(8):1920–1928. doi: 10.1158/1078-0432.CCR-16-1741. [DOI] [PubMed] [Google Scholar]
- 8.Ferrara R, Mezquita L, Texier M, Lahmar J, Audigier-Valette C, Tessonnier L, Mazieres J, Zalcman G, Brosseau S, Le Moulec S. et al. Hyperprogressive disease in patients with advanced non–small cell lung cancer treated with PD-1/PD-L1 inhibitors or with single-agent chemotherapy. JAMA Oncol. 2018;4(11):1543–1552. doi: 10.1001/jamaoncol.2018.3676. [DOI] [PMC free article] [PubMed] [Google Scholar]
- 9.Kim CG, Kim KH, Pyo KH, Xin CF, Hong MH, Ahn BC, Kim Y, Choi SJ, Yoon HI, Lee JG. et al. Hyperprogressive disease during PD-1/PD-L1 blockade in patients with non-small-cell lung cancer. Ann Oncol. 2019;30(7):1104–1113. doi: 10.1093/annonc/mdz123. [DOI] [PubMed] [Google Scholar]
- 10.Ruiz-Patiño A, Arrieta O, Cardona AF, Martín C, Raez LE, Zatarain-Barrón ZL, Barrón F, Ricaurte L, Bravo-Garzón MA, Mas L. et al. Immunotherapy at any line of treatment improves survival in patients with advanced metastatic non-small cell lung cancer (NSCLC) compared with chemotherapy (quijote-CLICaP). Thorac Cancer. 2020;11(2):353–361. doi: 10.1111/1759-7714.13272. [DOI] [PMC free article] [PubMed] [Google Scholar]
- 11.Sehgal K. Hyperprogression in patients with cancer receiving immune checkpoint inhibitors. JAMA Netw Open. 2021;4(3):e211839. doi: 10.1001/jamanetworkopen.2021.1839. [DOI] [PubMed] [Google Scholar]
- 12.Ito K, Hataji O, Katsuta K, Kobayashi T, Gabazza EC, Yatabe Y, Taguchi O, Yamamoto N. “Pseudoprogression” of pulmonary pleomorphic carcinoma during nivolumab therapy. J Thorac Oncol. 2016;11(10):e117–e119. doi: 10.1016/j.jtho.2016.05.002. [DOI] [PubMed] [Google Scholar]
- 13.Rocha P, Hardy-Werbin M, Naranjo D, Taus Á, Rodrigo M, Zuccarino F, Roth R, Wood O, Ottensmeier CH, Arriola E. CD103+CD8+ lymphocytes characterize the immune infiltration in a case with pseudoprogression in squamous NSCLC. J Thorac Oncol. 2018;13(10):e193–e196. doi: 10.1016/j.jtho.2018.05.008. [DOI] [PubMed] [Google Scholar]
- 14.Gainor JF, Longo DL, Chabner BA. Pharmacodynamic biomarkers: falling short of the mark? Clin Cancer Res. 2014;20(10):2587–2594. doi: 10.1158/1078-0432.Ccr-13-3132. [DOI] [PubMed] [Google Scholar]
- 15.Kato S, Goodman A, Walavalkar V, Barkauskas DA, Sharabi A, Kurzrock R. Hyperprogressors after immunotherapy: analysis of genomic alterations associated with accelerated growth rate. Clin Cancer Res. 2017;23(15):4242–4250. doi: 10.1158/1078-0432.CCR-16-3133. [DOI] [PMC free article] [PubMed] [Google Scholar]
- 16.Li G, Choi JE, Kryczek I, Sun Y, Liao P, Li S, Wei S, Grove S, Vatan L, Nelson R. et al. Intersection of immune and oncometabolic pathways drives cancer hyperprogression during immunotherapy. Cancer Cell. 2023;41(2):304–322.e307. doi: 10.1016/j.ccell.2022.12.008. [DOI] [PMC free article] [PubMed] [Google Scholar]
- 17.Stadler JC, Belloum Y, Deitert B, Sementsov M, Heidrich I, Gebhardt C, Keller L, Pantel K. Current and future clinical applications of ctDNA in immuno-oncology. Cancer Res. 2022;82(3):349–358. doi: 10.1158/0008-5472.Can-21-1718. [DOI] [PMC free article] [PubMed] [Google Scholar]
- 18.Sanmamed MF, Perez-Gracia JL, Schalper KA, Fusco JP, Gonzalez A, Rodriguez-Ruiz ME, Oñate C, Perez G, Alfaro C, Martín-Algarra S. et al. Changes in serum interleukin-8 (IL-8) levels reflect and predict response to anti-PD-1 treatment in melanoma and non-small-cell lung cancer patients. Ann Oncol. 2017;28(8):1988–1995. doi: 10.1093/annonc/mdx190. [DOI] [PMC free article] [PubMed] [Google Scholar]
- 19.Matsuo N, Azuma K, Hattori S, Ohtake J, Kawahara A, Ishii H, Tokito T, Yamada K, Shibata Y, Shimokawaji T. et al. Association between soluble immune mediators and tumor responses in patients with nonsmall cell lung cancer treated with anti-PD-1 inhibitor. Int J Cancer. 2019;144(5):1170–1179. doi: 10.1002/ijc.31923. [DOI] [PubMed] [Google Scholar]
- 20.Kiriu T, Yamamoto M, Nagano T, Hazama D, Sekiya R, Katsurada M, Katsurada N, Tachihara M, Kobayashi K, Nishimura Y. Pseudo-progression and the neutrophil-to-lymphocyte ratio in non-small cell lung cancer treated with immune checkpoint inhibitors: a case-control study. Onco Targets Ther. 2019;12:10559–10568. doi: 10.2147/OTT.S228138. [DOI] [PMC free article] [PubMed] [Google Scholar]
- 21.Choi WM, Kim JY, Choi J, Lee D, Shim JH, Lim YS, Lee HC, Yoo C, Ryu MH, Ryoo BY. et al. Kinetics of the neutrophil-lymphocyte ratio during PD-1 inhibition as a prognostic factor in advanced hepatocellular carcinoma. Liver Int. 2021;41(9):2189–2199. doi: 10.1111/liv.14932. [DOI] [PubMed] [Google Scholar]
- 22.Guiot J, Vaidyanathan A, Deprez L, Zerka F, Danthine D, Frix AN, Lambin P, Bottari F, Tsoutzidis N, Miraglio B. et al. A review in radiomics: making personalized medicine a reality via routine imaging. Med Res Rev. 2022;42(1):426–440. doi: 10.1002/med.21846. [DOI] [PubMed] [Google Scholar]
- 23.Khorrami M, Bera K, Thawani R, Rajiah P, Gupta A, Fu P, Linden P, Pennell N, Jacono F, Gilkeson RC. et al. Distinguishing granulomas from adenocarcinomas by integrating stable and discriminating radiomic features on non-contrast computed tomography scans. Eur J Cancer. 2021;148:146–158. doi: 10.1016/j.ejca.2021.02.008. [DOI] [PMC free article] [PubMed] [Google Scholar]
- 24.Li Y, Liu J, Yang X, Wang A, Zang C, Wang L, He C, Lin L, Qing H, Ren J. et al. An ordinal radiomic model to predict the differentiation grade of invasive non-mucinous pulmonary adenocarcinoma based on low-dose computed tomography in lung cancer screening. Eur Radiol. 2023;33(5):3072–3082. doi: 10.1007/s00330-023-09453-y. [DOI] [PubMed] [Google Scholar]
- 25.Jazieh K, Khorrami M, Saad A, Gad M, Gupta A, Patil P, Viswanathan VS, Rajiah P, Nock CJ, Gilkey M. et al. Novel imaging biomarkers predict outcomes in stage III unresectable non-small cell lung cancer treated with chemoradiation and durvalumab. J Immunother Cancer. 2022;10(3):e003778. doi: 10.1136/jitc-2021-003778. [DOI] [PMC free article] [PubMed] [Google Scholar]
- 26.Zhu Z, Chen M, Hu G, Pan Z, Han W, Tan W, Zhou Z, Wang M, Mao L, Li X. et al. A pre-treatment CT-based weighted radiomic approach combined with clinical characteristics to predict durable clinical benefits of immunotherapy in advanced lung cancer. Eur Radiol. 2023;33(6):3918–3930. doi: 10.1007/s00330-022-09337-7. [DOI] [PMC free article] [PubMed] [Google Scholar]
- 27.Akhoundova D, Hiltbrunner S, Mader C, Förster R, Kraft J, Schwanhäusser B, Bankel L, Kollias S, Treyer V, Rushing EJ. et al. 18F-FET PET for diagnosis of pseudoprogression of brain metastases in patients with non-small cell lung cancer. Clin Nucl Med. 2020;45(2):113–117. doi: 10.1097/RLU.0000000000002890. [DOI] [PubMed] [Google Scholar]
- 28.Vaidya P, Bera K, Patil PD, Gupta A, Jain P, Alilou M, Khorrami M, Velcheti V, Madabhushi A. Novel, non-invasive imaging approach to identify patients with advanced non-small cell lung cancer at risk of hyperprogressive disease with immune checkpoint blockade. J Immunother Cancer. 2020;8(2). doi: 10.1136/jitc-2020-001343. [DOI] [PMC free article] [PubMed] [Google Scholar]
- 29.Hodi FS, Hwu W-J, Kefford R, Weber JS, Daud A, Hamid O, Patnaik A, Ribas A, Robert C, Gangadhar TC. et al. Evaluation of immune-related response criteria and RECIST v1.1 in patients with advanced melanoma treated with Pembrolizumab. J Clin Oncol. 2016;34(13):1510–1517. doi: 10.1200/JCO.2015.64.0391. [DOI] [PMC free article] [PubMed] [Google Scholar]
- 30.Mu W, Schabath MB, Gillies RJ. Images are data: challenges and opportunities in the clinical translation of radiomics. Cancer Res. 2022;82(11):2066–2068. doi: 10.1158/0008-5472.Can-22-1183. [DOI] [PMC free article] [PubMed] [Google Scholar]
- 31.Zhou Z-H. Machine learning. Singapore: Springer Nature; 2021. [Google Scholar]
- 32.Chen Q, Zhang L, Mo X, You J, Chen L, Fang J, Wang F, Jin Z, Zhang B, Zhang S. Current status and quality of radiomic studies for predicting immunotherapy response and outcome in patients with non-small cell lung cancer: a systematic review and meta-analysis. Eur J Nucl Med Mol Imaging. 2021;49(1):345–360. doi: 10.1007/s00259-021-05509-7. [DOI] [PubMed] [Google Scholar]
- 33.Tian P, He B, Mu W, Liu K, Liu L, Zeng H, Liu Y, Jiang L, Zhou P, Huang Z. et al. Assessing PD-L1 expression in non-small cell lung cancer and predicting responses to immune checkpoint inhibitors using deep learning on computed tomography images. Theranostics. 2021;11(5):2098–2107. doi: 10.7150/thno.48027. [DOI] [PMC free article] [PubMed] [Google Scholar]
- 34.Di Giacomo AM, Danielli R, Guidoboni M, Calabrò L, Carlucci D, Miracco C, Volterrani L, Mazzei MA, Biagioli M, Altomonte M. et al. Therapeutic efficacy of ipilimumab, an anti-CTLA-4 monoclonal antibody, in patients with metastatic melanoma unresponsive to prior systemic treatments: clinical and immunological evidence from three patient cases. Cancer Immunol Immunother. 2009;58(8):1297–1306. doi: 10.1007/s00262-008-0642-y. [DOI] [PMC free article] [PubMed] [Google Scholar]
- 35.Tanizaki J, Hayashi H, Kimura M, Tanaka K, Takeda M, Shimizu S, Ito A, Nakagawa K. Report of two cases of pseudoprogression in patients with non-small cell lung cancer treated with nivolumab-including histological analysis of one case after tumor regression. Lung Cancer. 2016;102:44–48. doi: 10.1016/j.lungcan.2016.10.014. [DOI] [PubMed] [Google Scholar]
- 36.Dercle L, Sun S, Seban RD, Mekki A, Sun R, Tselikas L, Hans S, Bernard-Tessier A, Mihoubi Bouvier F, Aide N. et al. Emerging and evolving concepts in cancer immunotherapy imaging. Radiology. 2023;306(1):32–46. doi: 10.1148/radiol.210518. [DOI] [PubMed] [Google Scholar]
- 37.Digernes I, Grøvik E, Nilsen LB, Saxhaug C, Geier O, Reitan E, Sætre DO, Breivik B, Reese T, Jacobsen KD. et al. Brain metastases with poor vascular function are susceptible to pseudoprogression after stereotactic radiation surgery. Adv Radiat Oncol. 2018;3(4):559–567. doi: 10.1016/j.adro.2018.05.005. [DOI] [PMC free article] [PubMed] [Google Scholar]
- 38.Walker AJ, Ruzevick J, Malayeri AA, Rigamonti D, Lim M, Redmond KJ, Kleinberg L. Postradiation imaging changes in the CNS: how can we differentiate between treatment effect and disease progression? Future Oncol (London, England). 2014;10(7):1277–1297. doi: 10.2217/fon.13.271. [DOI] [PMC free article] [PubMed] [Google Scholar]
- 39.Baxevanis CN, Fortis SP, Perez SA. The balance between breast cancer and the immune system: challenges for prognosis and clinical benefit from immunotherapies. Semin Cancer Biol. 2021;72:76–89. doi: 10.1016/j.semcancer.2019.12.018. [DOI] [PubMed] [Google Scholar]
- 40.Perrone M, Raimondi E, Costa M, Rasetto G, Rizzati R, Lanza G, Gafà R, Cavallesco G, Tamburini N, Maniscalco P. et al. Inflammatory microenvironment in early non-small cell lung cancer: exploring the predictive value of radiomics. Cancers Basel. 2022;14(14). doi: 10.3390/cancers14143335. [DOI] [PMC free article] [PubMed] [Google Scholar]
- 41.Sun R, Limkin EJ, Vakalopoulou M, Dercle L, Champiat S, Han SR, Verlingue L, Brandao D, Lancia A, Ammari S. et al. A radiomics approach to assess tumour-infiltrating CD8 cells and response to anti-PD-1 or anti-PD-L1 immunotherapy: an imaging biomarker, retrospective multicohort study. Lancet Oncol. 2018;19(9):1180–1191. doi: 10.1016/S1470-2045(18)30413-3. [DOI] [PubMed] [Google Scholar]
- 42.He LN, Chen T, Fu S, Jiang Y, Zhang X, Chen C, Du W, Luo L, Li A, Wang Y. et al. Tumor response assessment by measuring the single largest lesion per organ in advanced non-small cell lung cancer patients treated with PD-1/PD-L1 inhibitor. Ther Adv Med Oncol. 2023;15:17588359231200463. doi: 10.1177/17588359231200463. [DOI] [PMC free article] [PubMed] [Google Scholar]
- 43.Li LX, Cappuzzo F, Matos I, Socinski MA, Hopkins AM, Sorich MJ. Low risk of hyperprogression with first-line chemoimmunotherapy for advanced non-small cell lung cancer: pooled analysis of 7 clinical trials. Oncologist. 2023;28(4):e205–e211. doi: 10.1093/oncolo/oyad043. [DOI] [PMC free article] [PubMed] [Google Scholar]
- 44.Lin M, Vanneste BGL, Yu Q, Chen Z, Peng J, Cai X. Hyperprogression under immunotherapy: a new form of immunotherapy response?-a narrative literature review. Transl Lung Cancer Res. 2021;10(7):3276–3291. doi: 10.21037/tlcr-21-575. [DOI] [PMC free article] [PubMed] [Google Scholar]
- 45.Liu J, Wu Q, Wu S, Xie X. Investigation on potential biomarkers of hyperprogressive disease (HPD) triggered by immune checkpoint inhibitors (ICIs). Clinical & translational oncology: official publication of the Federation of Spanish oncology societies and of the national cancer institute of Mexico. 2021;23(9):1782–1793. doi: 10.1007/s12094-021-02579-9. [DOI] [PubMed] [Google Scholar]
- 46.Li J, Zhang H, Zhu H, Li H. Clinical outcomes and immunological evaluation of toripalimab combination for cancer treatment: a systematic review and meta-analysis of randomized controlled trials. Int Immunopharmacol. 2023;125(Pt B):111176. doi: 10.1016/j.intimp.2023.111176. [DOI] [PubMed] [Google Scholar]
- 47.Wakiyama H, Kato T, Furusawa A, Okada R, Inagaki F, Furumoto H, Fukushima H, Okuyama S, Choyke PL, Kobayashi H. Treg-dominant tumor microenvironment is responsible for hyperprogressive disease after PD-1 blockade therapy. Cancer Immunol Res. 2022;10(11):1386–1397. doi: 10.1158/2326-6066.Cir-22-0041. [DOI] [PMC free article] [PubMed] [Google Scholar]
- 48.Jiang T, Song J, Wang X, Niu S, Zhao N, Dong Y, Wang X, Luo Y, Jiang X. Intratumoral and peritumoral analysis of mammography, Tomosynthesis, and multiparametric MRI for predicting ki-67 level in breast cancer: a radiomics-based study. Mol Imaging Biol. 2022;24(4):550–559. doi: 10.1007/s11307-021-01695-w. [DOI] [PubMed] [Google Scholar]
- 49.Tran KA, Kondrashova O, Bradley A, Williams ED, Pearson JV, Waddell N. Deep learning in cancer diagnosis, prognosis and treatment selection. Genome Med. 2021;13(1):152. doi: 10.1186/s13073-021-00968-x. [DOI] [PMC free article] [PubMed] [Google Scholar]
- 50.Painuli D, Bhardwaj S, Köse U. Recent advancement in cancer diagnosis using machine learning and deep learning techniques: A comprehensive review. Comput Biol Med. 2022;146:105580. doi: 10.1016/j.compbiomed.2022.105580. [DOI] [PubMed] [Google Scholar]
- 51.Feng Z, Li H, Liu Q, Duan J, Zhou W, Yu X, Chen Q, Liu Z, Wang W, Rong P. CT radiomics to predict macrotrabecular-massive subtype and immune status in hepatocellular carcinoma. Radiology. 2023;307(1):e221291. doi: 10.1148/radiol.221291. [DOI] [PubMed] [Google Scholar]
- 52.Huang S, Yang J, Shen N, Xu Q, Zhao Q. Artificial intelligence in lung cancer diagnosis and prognosis: Current application and future perspective. Semin Cancer Biol. 2023;89:30–37. doi: 10.1016/j.semcancer.2023.01.006. [DOI] [PubMed] [Google Scholar]
Associated Data
This section collects any data citations, data availability statements, or supplementary materials included in this article.