

Abstract
Inhibition of cholesterol de novo synthesis (DNS) by statins has controversial effects on the treatment of hepatocellular carcinoma (HCC). High fatty acid conditions have been reported to limit the effect of statins on metabolism diseases. Whether high fatty acid conditions interfere with the effect of statins on HCC remains unclear. Here, we reported that inhibiting cholesterol DNS with atorvastatin promoted the oncogenic capabilities of diethylnitrosamine (DEN) in mice fed high fatty acid diets (HFD). The combined analysis of metabolomics and transcriptomics revealed that arachidonic acid (AA) metabolism was the most significant changed pathway between mice with and without atorvastatin treatment. In vitro, in the presence of AA precursor linoleic acid (LA), atorvastatin promoted the proliferation and migration ability of HCC cell lines. However, in the absence of LA, these phenomena disappeared. TCGA and tissue microarray examination revealed that prostaglandin e synthase 2 (PTGES2), a key enzyme in AA metabolism, was associated with the poor outcome of HCC patients. Overexpression of PTGES2 promoted the proliferation and migration of HCC cell lines, and knockdown of PTGES2 inhibited the proliferation and migration of cells. Additionally, atorvastatin upregulated PTGES2 expression by enhancing Sterol‐regulatory element binding protein 2 (SREBP2)‐mediated transcription. Knockdown of PTGES2 reversed the proliferation and migration ability enhanced by atorvastatin. Overall, our study reveals that a high fatty acid background is one of the possible conditions limiting the application of statins in HCC, under which statins promote the progression of HCC by enhancing SREBP2‐mediated PTGES2 transcription.
Keywords: arachidonic acid metabolism, cholesterol DNS, HCC, PTGES2, statin
Inhibition of cholesterol DNS promotes nuclear transposition of SREBP2, which activates the transcription of PTGES2. In the presence of high fatty acids, LA or AA provides abundant substrate for PTGES2, which catalyzes the production of PGE2. The upregulated PGE2 is a well‐studied risk factor that promotes the proliferation and metastasis of HCC.

Abbreviations
- AA
arachidonic acid
- DEGs
differential expression genes
- DEN
diethylnitrosamine
- DNS
de novo synthesis
- H&E
hematoxylin and eosin
- HCC
Hepatocellular carcinoma
- HFD
high fatty acid diets
- LA
linoleic acid
- PGE2
Prostaglandin E2
- PGH2
prostaglandin H2
- PTGES2
Prostaglandin E Synthase 2
- SREBP2
Sterol‐regulatory element binding protein 2
1. INTRODUCTION
Hepatocellular carcinoma (HCC) is the sixth most common cancer and the fourth leading cause of cancer‐related death worldwide. 1 The incidence of HCC continues to rise, with more than one million new cases expected in 2025. 2 Although multiple systemic therapies have been applied to treat HCC, patients still face undesirable outcomes, with 5‐year survival below 20%. 3 Therefore, understanding the mechanisms of HCC progression and seeking new therapeutic targets are critical for public health.
Cholesterol is an essential neutral lipid that maintains the membrane's physical properties and synthesizes the bile acid and steroid hormones. 4 The upregulated cholesterol de novo synthesis (DNS) has been found in HCC. 5 Previous studies indicated that the upregulated cholesterol synthesis was associated with cellular inflammation and fibrosis, which promoted the oncogenesis and progression of HCC. However, the effect of inhibiting cholesterol DNS by statins in HCC is controversial. Some clinical studies indicated that statins reduced the risk of HCC. 6 In contrast, a recent prospective study with 8.4 follow‐up years declared that inhibiting cholesterol synthesis with statins did not affect the risk of HCC occurrence. 7 A mice study also revealed that inhibiting cholesterol synthesis at a late stage promoted oncogenesis of HCC in aging mice. 8 These studies indicated that inhibition of cholesterol DNS might have different effects under different backgrounds.
Inhibiting cholesterol DNS with statins has been recommended as the first‐line strategy to treat hypercholesteremia and atherosclerosis. However, clinical studies revealed that statins failed to improve the pro‐atherogenic alterations in combined hyperlipidemia patients with high triglyceride levels. 9 The risk of diabetes was also increased in combined hyperlipidemia patients treated with statins. 10 , 11 These results suggested that the fatty acid metabolism might affect the role of statin in treating metabolic disease. Whether high fatty acid conditions affect the role of statin in HCC remains unclear.
Here, we inhibited cholesterol DNS with atorvastatin and provided sufficient fatty acid with high‐fat diets (HFD) in a diethylnitrosamine (DEN)‐induced HCC mice model. We found that inhibiting cholesterol DNS promoted HCC progression in the presence of high fatty acids. Additionally, metabolomics and transcriptomics analysis revealed that the enhanced arachidonic acid (AA) metabolism might participate in the effect of promoting HCC progression induced by statin in the presence of high fatty acid. More importantly, PTGES2 upregulated by SREBP2 was a key factor connecting cholesterol synthesis and arachidonic acid metabolism in HCC progression.
2. MATERIALS AND METHODS
2.1. Mice and hepatocellular carcinoma induction
Fourteen‐days‐old C57BL/6 mice were intraperitoneally injected with DEN (Sigma, Germa, N0756) at a dose of 20 mg/kg. Age‐ and gender‐matched mice were randomly divided into HFD and HFD + atorvastatin groups. Four weeks later, all mice were fed HFD diets. Atorvastatin (Pfizer) (2 mg/kg/day) was orally administered to the mice in HFD + atorvastatin groups. All mice were kept in sterile cages at a temperature of 24°C with a 12 h light/dark cycle. The mice were killed 7 months later.
2.2. Cell culture
HUH‐7, SK‐HEP1, and HepG2 cells were previously owned by our laboratory. All cells were cultured with DMEM added with 1% penicillin–streptomycin (Beyotime Biotechnology, China, C0222) and 10% FBS (NATORCO, Argentina). Linoleic acid (LA) (Sigma, Germa, L5900) and atorvastatin were applied to treat cells according to the experimental condition.
2.3. Hepatocellular carcinoma tissue microarray
Hepatocellular carcinoma patients who had undergone hepatectomy in the department of hepatobiliary surgery of the Second Affiliated Hospital of Chongqing Medical University in 2015–2016 were recruited for this study. The clinical data of the recruited patients are shown in Table S1.
2.4. Metabolomics analysis
Sample preparation, HILIC UHPLC‐Q‐TOF MS, and data analysis were performed by Shang Applied Protein Technology (http://www.aptbiotech.com/). Metabolites with VIP >1 and p‐values of univariate analysis <0.05 were regarded as having significant differences.
2.5. Transcriptome sequencing
Sample preparation, sequencing, and bioinformatics were performed by Novogene (https://cntest.novogene.com/). Genes with fold change >1.3 and p‐value <0.05 were regarded as having significant differences.
2.6. Histologic analysis and immunohistochemical staining
Protocols provided for the H&E staining kit (Beyotime Biotechnology, China C0105M) were followed for H&E staining. For immunohistochemical (IHC) staining, the procedures of the commercial kit (ZsBio, Beijing, China, SP‐9001) were followed. The primary antibodies applied for IHC were as follows: anti‐Ki67 (Abcam, ab16667) and anti‐PTGES2 (Proteintech, 10,881‐1‐AP). The IHC score was calculated based on the degree of staining (0 ~ 3 divided into negative staining, light yellow, light brown, dark brown) and positive range (0~5 divided into 0, 0%–1%, 1%–10%, 10%–33%, 33%–66%, 66%–100%).
2.7. EdU staining
The EdU probe kit was purchased from RiboBio (C10310‐1). Procedures were consistent with the protocols provided by RIBOBIO.
2.8. Cell Counting Kit‐8 assay
Cell Counting Kit‐8 kits were purchased from MCE (HY‐K0301, USA). Cells were seeded in 96‐well plates with culture medium overnight. Then, cells were treated with a conditional medium as described above; 100 μL Cell Counting Kit‐8 (CCK‐8) working buffer was applied to culture cells for 1.5 h when cells were treated with conditional medium for 12, 24, and 48 h. The absorbance was measured at 450 nm with a microplate reader.
2.9. Wound healing assay
SK‐HEP1 and HuH‐7 cells were seeded into six‐well plates. When cells were cultured to 90% confluence, a uniform scratch was made by a 10‐μL sterile pipette tip on monolayer cells. The scratch was photographed at 0, 12, and 24 h. The wound distance was measured with Adobe Photoshop 2020 software.
2.10. Transwell assay
Ten thousand SK‐HEP1 cells or 20,000 HuH‐7 cells were plated into the upper compartment. Six hours later, the medium in the upper compartment was replaced with medium without FBS. After 24 h, cells in the lower compartment were fixed with 4% paraformaldehyde for 10 min and stained with 0.1% crystal violet for 30 min.
2.11. Western blot
The normalized samples were separated through SDS‐PAGE electrophoresis and electroblotted onto PVDF membrane (Millipore, IPVH00010). After that, membranes were blocked with 5% BSA at 37°C for 1.5 h following incubation with primary antibody at 4°C overnight. Then blots were incubated with HRP‐conjugated secondary antibody. Finally, ECL substrate (Bio‐RAD) was applied to visualize the protein brands. The following primary antibodies were applied in our study: by proliferating cell nuclear antigen (PCNA) (CST, #13110), PTGES2 (Proteintech, 10,881‐1‐AP), and β‐actin (ZSGB‐BIO, TA‐09).
2.12. RT‐PCR
Total RNA was extracted with RNAiso Plus (Takara, 9109). Total RNA was reversibly transcribed to cDNA by the PrimeScript RT Reagent Kit with gDNA Eraser (TaKaRa, RR047A). cDNA was amplified with the QuantiFast SYBR Green RT‐PCR Kit (Qiagen, 204,156). The primer sequences used in this study are shown in Table S2.
2.13. Dual‐luciferase reporter assay
HEK293 cells were co‐transfected with PTGES2 luciferase reporter plasmid, pRL‐TK‐Renilla‐luciferase plasmid, and SREBP2 overexpression plasmid or negative control plasmid (GeneChem). After transfection for 24 h, promoter activity was analyzed using a dual luciferase assay kit (Promega) according to the manufacturer's instructions.
2.14. Statistical analysis
The differences in the measurement data between the two groups were analyzed with a t‐test. The differences in the measurement data among more than two groups were analyzed with one‐way ANOVA. Bioinformatic analyses were performed with R 4.0.3 software. Statistical analyses were performed with GraphPad Prism 9.0; p < 0.05 was considered statistically significant.
3. RESULTS
3.1. Inhibiting cholesterol de novo synthesis promoted the proliferation and metastasis of hepatocellular carcinoma in the presence of high fatty acid
To study the effect of inhibiting cholesterol DNS in vivo, C57BL/6 mice feeding with HFD were treated with atorvastatin for 7 months. The serum lipid profile of mice is exhibited in Figure S1. Compared with mice fed with HFD, atorvastatin‐treated mice exhibited more liver tumors and a higher lung metastasis rate (Figure 1A–C). The tumors in the liver and lung were verified by H&E staining (Figure 1D). As stained by PCNA, tumors from atorvastatin‐treated mice showed more proliferated cells (Figure 1E).
FIGURE 1.

Inhibiting cholesterol de novo synthesis (DNS) increased hepatocellular carcinoma (HCC) tumor numbers and lung metastasis under a high fatty acid background. (A) The liver and lung images of mice with high fatty acid diets (HFD) and HFD + atorvastatin. (B) The tumor numbers/liver of mice with HFD and HFD + atorvastatin. (C) The lung metastasis rates of mice with HFD and HFD + atorvastatin. (D) The H&E staining of the liver and lung of mice with HFD and HFD + atorvastatin. (E) Immunohistochemical staining detected the PCNA expression in mice with HFD and HFD + atorvastatin. p < 0.05, n = 8.
3.2. Inhibiting cholesterol de novo synthesis activated arachidonic acid metabolism
Metabolomics analyses were performed to explore the mechanism by which atorvastatin promoted the metastasis of HCC. Fifty‐eight differential metabolites were detected (Figure 2A). Then, KEGG enrichment analysis revealed that acid arachidonic metabolism was changed most significantly under the stimulation of statin (Figure 2B).
FIGURE 2.

Inhibiting cholesterol de novo synthesis (DNS) activated arachidonic metabolism under a high‐fat diet. Mice were treated with high fatty acid diets (HFD) or HFD + atorvastatin. (A) Heat map showing the differential metabolites. (B) The bubble graph shows the enriched pathways of the differential metabolites. (C) The volcano plot shows the differential expression genes (DEGs) (D) The bubble graph shows the enriched pathways of the DEGs. (E) Differential genes in the arachidonic acid metabolism pathway. (F) Integrated differential genes and metabolites in the arachidonic acid metabolism pathway. The upregulated metabolites are marked in yellow. The upregulated genes are marked in red, and the downregulated genes are marked in green.
Following this line, transcriptomics analysis found 3493 differential expression genes (DEGs) between HFD and HFD + atorvastatin‐treated mice (Figure 2C). Then, KEGG enrichment analysis also found that DEGs could be enriched in arachidonic acid metabolism (Figure 2D). In the arachidonic acid metabolism pathway, 10 genes (Pla2g5, Cyp2c40, Gpx3, Cyp2b13, Ptgis, Cyp2c70, Cyp2b9, Cyp2c68, Ptges2, Gbf1) were upregulated and five genes (Cbr1, Pla2g6, Cyp2u1, Ptges, Gpx2) were downregulated significantly in mice treated with atorvastatin (Figure 2E). The changed metabolites and genes in the arachidonic metabolism pathway were integrated (see Figure 2F).
3.3. Inhibiting cholesterol de novo synthesis promoted the proliferation and migration of hepatocellular carcinoma cells in the presence of arachidonic acid precursor
Because arachidonic acid is an essential fatty acid formed from dietary LA, we applied 25 μM LA to mimic the high LA condition in vitro. Atorvastatin increased the positive rates of EdU staining (Figure 3A). The proliferation rates detected by the CCK‐8 proliferation assay were also increased in cells treated with atorvastatin in the presence of LA. (Figure 3B). As demonstrated by the wound healing assay, atorvastatin promoted cellular migration rates of sk‐hep1 and HuH‐7 cells in the presence of LA (Figure 3C). Transwell assay exhibited the same effects of atorvastatin on cellular migration as the wound healing assay in SK‐HEP1 and HuH‐7 cells (Figure 3D). However, atorvastatin failed to promote CCK‐8 proliferation rates and wound healing rates in the absence of LA (Figure 3E,F, Figure S2). Collectively, these data indicate that arachidonic acid metabolism plays a key role in promoting HCC proliferation and metastasis induced by inhibiting cholesterol synthesis.
FIGURE 3.

Inhibiting cholesterol de novo synthesis (DNS) promoted the proliferation and migration of SK‐HEP 1 and HuH‐7 cells in the presence of linoleic acid (LA). (A) EdU staining detected the proliferation ability of SK‐HEP1 and HuH‐7 cells. *p < 0.05, n = 5. **p < 0.01, n = 5. (B) Cell Counting Kit‐8 (CCK‐8) assay detected the proliferation ability of SK‐HEP1 and HuH‐7 cells. *p < 0.05, n = 5. **p < 0.01, n = 5. (C) Wound healing assay detected the migration ability of SK‐HEP1 and HuH‐7 cells. *p < 0.05, n = 9. **p < 0.01, n = 9. (D) Transwell assay detected the migration ability of SK‐HEP1 and HuH‐7 cells. *p < 0.05, n = 4. **p < 0.01, n = 4. (E) Wound healing assay detected the migration ability of SK‐HEP1 and HuH‐7 cells treated with atorvastatin in the absence of LA. *p < 0.05, n = 9. **p < 0.01, n = 9. (F) Transwell assay detected the migration ability of SK‐HEP1 and HuH‐7 cells treated with atorvastatin in the absence of LA. *p < 0.05, n = 4. **p < 0.01, n = 4.
3.4. PTGES2 associated with arachidonic acid metabolism was related to the poor outcomes of patients
The expression of DEGs of AA metabolism was examined in TCGA database. Cyp2b9, Cyp2c68, Cyp2b13, Cyp2c70, Cyp2c40, and Cyp2u1 are especially expressed in mice. Thus, we failed to analyze the expression of these six genes in HCC patients. Among the remaining nine DEGs, PTGES2, CBR1, PLA2G6, GPX3, GPX2, PTGES, and GBF1 were upregulated in HCC patients, and PTGIS was downregulated. PLA2G5 showed no different expression between HCC and normal subjects (Figure 4A). Collectively, PTGES2, PLA2G6, GPX3, and GBF1 were upregulated in statin‐treated mice and HCC patients consistently.
FIGURE 4.
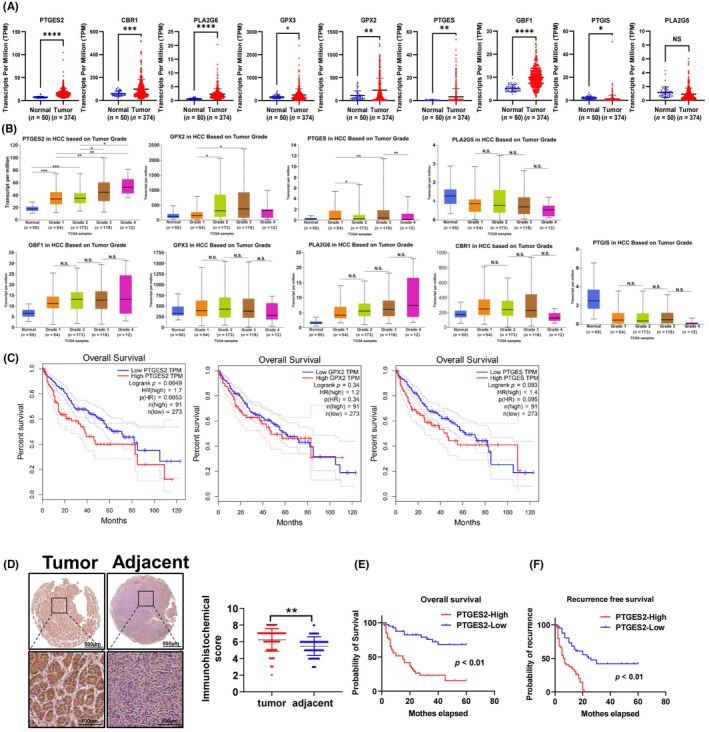
Prostaglandin e synthase 2 (PTGES2) is a risk factor for the poor prognosis of hepatocellular carcinoma (HCC). (A) Differential gene expression in TCGA database. (B) The expression of differential genes of patients with different clinical grades. (C) The overall survival of patients with high and low PTGES2, PTGES, and GPX2 expression. (D) Immunochemical staining detected the expression of PTGES2 in tissue array; **p < 0.01, n = 86. (E) The overall survival of patients with high and low expression of PTGES2 in the Chongqing cohort; p < 0.01, n = 43. (F) The recurrence‐free survival of patients with high and low expression of PTGES2 in the Chongqing cohort; p < 0.01, n = 43.
We explored the role of DEGs in HCC outcomes. The expression of PTGES2 and GPX2 increased with the grade of HCC going up (Figure 4B). The expression of PTGES increased in Grade 1 and Grade3 patients but decreased in Grade 2 and Grade 4 patients. PLA2G6, CBR1, GPX3, GBF1, PTGIS, and PLA2G5 showed no different expression in different HCC grades (Figure 4B). Additionally, patients with higher PTGES2 showed poorer survival probability. The survival probability in patients with higher PTGES and GPX2 was not significantly different from patients with lower PTGES and GPX2 expression (Figure 4C). These data indicate that PTGES2 is a key arachidonic acid metabolism gene associated with the poor outcomes of HCC patients.
Furthermore, as detected by tissue microarray, HCC tumor tissue exhibited higher PTGES2 expression than the paired adjacent tissue (Figure 4D). Additionally, patients with high PTGES2 expression showed poorer overall survival and recurrence‐free survival rates (Figure 4E,F). Taken together, these data indicate that PTGES2 might involve the promoting HCC effects of inhibiting cholesterol synthesis.
3.5. PTGES2 promotes the proliferation and migration of hepatocellular carcinoma
In HCC lines, the expression of PTGS2 increased with the enhancing malignancy of cell lines. HuH‐7 and SK‐HEP1 cells exhibited the highest expression, and HepG2 cells exhibited the lowest expression of PTGES2 (Figure 5A). Then, we overexpressed PTGES2 in HepG2 cells. Overexpression of PTGES2 increased positive EdU staining (Figure 5B) and CCK‐8 detected cellular proliferation (Figure 5C). Transwell assay also revealed that overexpression of PTGES2 promoted the cellular migration ability (Figure 5D).
FIGURE 5.

Prostaglandin e synthase 2 (PTGES2) promoting the proliferation and migration ability of hepatocellular carcinoma (HCC) cell lines. (A) The PTGES2 expression in HCC cell lines. * means vs L02, p < 0.05, n = 3; # means vs Chang liver, p < 0.05, n = 3. (B) EdU staining detected the proliferation ability of HepG2 cells with overexpression of PTGES2 or negative control. *p < 0.05, n = 5. (C) Cell Counting Kit‐8 (CCK‐8) assay detected the proliferation ability of HepG2 cells with overexpression of PTGES2 or negative control. *p < 0.05, n = 5. (D) Transwell assay detected the migration ability of HepG2 cells with overexpression of PTGES2 or negative control. *p < 0.05, n = 4. (E) EdU staining detected the proliferation ability of SK‐HEP1 and HuH‐7 cells with si‐PTGES2 or negative control; *p < 0.05, n = 5. (F) CCK‐8 assay detected the proliferation ability of SK‐HEP1 and HuH‐7 cells with si‐PTGES2 or negative control. *p < 0.05, n = 5. (G) Wound healing assay detected the migration ability of SK‐HEP1 and HuH‐7 cells with si‐PTGES2 or negative control. *p < 0.05, n = 9. (H) Transwell assay detected the migration ability of SK‐HEP1 and HuH‐7 cells with si‐PTGES2 or negative control. *p < 0.05, n = 4.
Following this line, PTGES2 was inhibited in SK‐HPE1 and HuH‐7 cells, which exhibited high PTGES2 expression. As detected by EdU staining and CCK‐8 assay, inhibiting PTGES2 expression decreased the cellular proliferation both in SK‐HEP1 and HuH‐7 cells (Figure 5E,F). Wound healing and Transwell assay revealed that inhibiting PTGES2 expression decreased the cellular migration ability (Figure 5G,H).
3.6. PTGES2 is essential for hepatocellular carcinoma proliferation and migration promoted by inhibiting cholesterol de novo synthesis
In vivo, mice treated with atorvastatin showed higher PTGES2 expression (Figure 6A). In vitro, atorvastatin promoted the protein and mRNA expression of PTGES2 in a dose‐dependent manner both in SK‐HEP1 and HuH‐7 cells (Figure 6B–E). Atorvastatin increased PGE2 concentration in cellular supernatant in the presence of LA (Figure 6F). While the generation of PGE2 could be attenuated by si‐PTGES2 (Figure 6G).
FIGURE 6.

Inhibiting cholesterol synthesis increased the expression of prostaglandin e synthase 2 (PTGES2) both in vivo and in vitro. (A) Immunochemical staining detected the expression of PTGES2 in the liver of mice fed with high fatty acid diets (HFD) or HFD + atorvastatin. *p < 0.05, n = 8. (B, C) Western blot detected the protein expression of PTGES2 in SK‐HEP1 and HuH‐7 cells treated with atorvastatin inhibiting cholesterol synthesis. *p < 0.05, n = 3. (D, E) qPCR detected the gene expression of PTGES2 in SK‐HEP1 and HuH‐7 cells treated with atorvastatin inhibiting cholesterol synthesis. *p < 0.05, n = 3; “ns” p > 0.05, n = 3. (F, G) ELISA detected the concentration of PTGES2 in the supernatant. ns, p > 0.05, n = 3; *p < 0.05, n = 3.
Moreover, si‐PTGES2 decreased the positive EdU staining (Figure 7A) and CCK‐8 detected cellular proliferation under the condition of LA + atorvastatin (Figure 7B). Wound healing and Transwell assay revealed that inhibiting PTGES2 suppressed the migration ability of SK‐HEP1 and HuH‐7 cells compared with the cells treated with atorvastatin (Figure 7C,D). Consistently, celecoxib, the inhibitor of PTGES2/PGE2, inhibited the proliferation and migration of HCC lines induced by atorvastatin (Figure S3).
FIGURE 7.

Inhibiting PTGES2 expression with small interfering RNAsi‐PTGES2 reversed the effects of statin on the proliferation and migration of SK‐HEP1 and HuH‐7 cell lines. SK‐HEP1 and HuH‐7 cells were treated with linoleic acid (LA) + atorvastatin. (A) EdU staining detected the proliferation ability of SK‐HEP 1 and HuH‐7 cells treated with si‐PTGES2 or negative control. ***p < 0.001, n = 5. (B) Cell Counting Kit‐8 (CCK‐8) assay detected the proliferation ability of SK‐HEP1 and HuH‐7 cells treated with si‐PTGES2 or negative control. *p < 0.05, n = 5. (C) Wound healing assay detected the migration ability of SK‐HEP 1 and HuH‐7 cells treated with si‐PTGES2 or negative control. *p < 0.05, n = 9. (D) Transwell assay detected the migration ability of SK‐HEP 1 and HuH‐7 cells treated with si‐PTGES2 or negative control. *p < 0.05, n = 4.
3.7. The transcription of PTGES2 is upregulated by inhibiting cholesterol de novo synthesis in a SREBP2‐dependent manner
SREBP2 is a well‐known transcription factor regulated by statin. In the present study, SREPB2 was activated by atorvastatin (Figure S4). Two potential binding sites of SREBP2 on the PTGES2 promoter sequence were predicted in the JASPAR database (Table S3 and Figure S5). Dual‐luciferase report assay verified that SREBP2 promoted the PTGES2 transcription (Figure 8A). Both in SK‐HEP1 and HuH‐7 cells, overexpression of SREBP2 promoted the mRNA expression (Figure 8B) and protein expression (Figure 8C). Inhibiting SREBP2 reversed the upregulation of PTGES2 induced by atorvastatin (Figure 8D). The overexpression and knockdown efficiency of SREBP2 are exhibited in Figure S6. The graphic abstract of this study is shown in Figure 8E.
FIGURE 8.

Inhibiting cholesterol synthesis upregulated prostaglandin e synthase 2 (PTGES2) in a SREBP2‐dependent manner. (A) Dual‐luciferase assay detected the ability of SREBP2 to activate the transcription of PTGES2; ***p < 0.01, n = 3. (B) qPCR detected the gene expression of PTGES2 in SK‐HEP1 and HuH‐7 cells treated with oe‐PTGES2, si‐PTGES2, or negative control. *p < 0.05, n = 3. (C, D) Western blot detected the protein expression of PTGES2 in SK‐HEP1 and HuH‐7 cells treated with oe‐PTGES2, si‐PTGES2, or negative control. *p < 0.05, n = 3. (E) Graphic abstract: Inhibition of cholesterol DNS promotes nuclear transposition of SREBP2, which activates the transcription of PTGES2. In the presence of high fatty acids, linoleic acid (LA) or arachidonic acid (AA) provides abundant substrate for PTGES2, which catalyzes the production of PGE2 promoting the proliferation and metastasis of hepatocellular carcinoma (HCC).
4. DISCUSSION
Lipid metabolism reprogramming has been recognized as a hallmark of HCC progression. Although enhanced cholesterol synthesis has been observed in numerous kinds of carcinomas, the effect of inhibiting cholesterol synthesis in HCC progression remains controversial. Some meta‐analysis and case‐control studies declared promising results of inhibiting cholesterol synthesis with statin in reducing risk and improving outcomes of HCC. 12 , 13 However, some studies also declared that long‐term application of statin may have some side effects, such as impairing liver mitochondrial function and increasing transaminase. 14 Studies also reported that statin failed to benefit HCC in mice and patients. 15 , 16
In the present study, inhibiting cholesterol synthesis with atorvastatin increased tumor numbers and lung metastasis in an HFD‐fed DEN‐induced HCC mouse model. Then, integrative metabolomics and transcriptomic analysis showed that arachidonic metabolism was the most significantly changed pathway in mice treated with atorvastatin.
Arachidonic acid is an essential fatty acid formed from the dietary LA. Under the catalysis of prostaglandin G/H synthase, arachidonate generates prostaglandin G and prostaglandin H2 (PGH2). Furthermore, prostaglandin E synthase catalyzes PGH2 to convert into the more stable PGE2. The enhanced arachidonic acid metabolism has been reported to promote the progression of HCC. 17 Previous studies have revealed that the upregulated arachidonic acid metabolism resulted in accumulated prostaglandins and leukotrienes in the liver, promoting the proliferation of HCC by activating ERK. 18 We speculated that under the condition of high fatty acid, due to the abundant substrate to synthesize arachidonic acid, the metabolism of arachidonic acid was activated and hence promoted HCC progression.
Then, we treated SK‐HEP1 and HuH‐7 cells with 25 μM LA, the precursor of arachidonic acid, to mimic the high fatty acid condition in vivo. In the presence of LA, inhibiting cholesterol synthesis promoted the proliferation and migration of HCC, which was consistent with our in vivo data. In the absence of LA, inhibiting cholesterol synthesis suppressed the proliferation and migration of HCC, which was consistent with a previous study. 19 These data indicated that inhibiting cholesterol DNS by statin played different roles in HCC progression under different nutrition states and the activated arachidonic acid metabolism was essential for the role of statin in promoting HCC progression.
There are several key enzymes participating in arachidonic acid metabolism. Combining our transcriptomics data with survival analysis in TCGA database, PTGES2 was the only differential gene consistently negatively associated with the overall survival of HCC. Furthermore, tissue microarray analysis indicates that PTGES2 protein was upregulated in HCC tissue. Patients with higher PTGES2 expression exhibited poor overall survival and recurrence‐free survival time. Moreover, overexpression of PTGES2 promoted cellular proliferation and migration in HepG2 cells, which showed a small amount of PTGES2 background expression. Consistently, knockdown PTGES2 inhibited cellular proliferation and migration in HuH‐7 and SK‐HEP1 cells, which showed a considerable amount of PTGES2 background expression. These data demonstrated that PTGES2 was an oncogene promoting HCC progression.
PTGES2 is a synthase generating PGE2. Kim and colleagues revealed that the increased PGE2 and upregulated PTGSE2 promoted the progression of breast cancer and was closely associated with the poor overall survival of patients. 20 PGE2 was also found to be associated with the progression of HCC. On the one hand, PGE2 promoted the proliferation and migration of HCC cells by activating the YAP pathway and enhancing lipogenesis. 21 , 22 On the other hand, secreted PGE2 changed the microenvironment to achieve immune escape and tumorigenesis. For example, the accumulation of PGE2 secreted by tumor cells could convert tumor‐suppressive M1 macrophages into cancer‐promoting M2 macrophages. 23 Therefore, enhanced PGE2 production mediated by PTGES2 is an important reason for HCC progression.
In this study, the arachidonic acid metabolites, 20‐HETE, lecithin, arachidonate, PGF2, and PGH2 were increased in mice treated with atorvastatin. An increase in PGE2 was also observed in supernatants of cells treated with LA and atorvastatin. The upregulated PTGES2 was also found in statin‐treated mice and cells under the conditions of high fatty acid. Inhibiting PTGES2 reversed the effects of statin in promoting proliferation and migration under the high fatty acid condition. A PGE2 generation inhibitor, celecoxib, also weakened the proliferation and migration enhanced by statin. These results demonstrated that inhibiting cholesterol synthesis promoted the proliferation and migration of HCC cells in a PTGES2‐dependent manner.
Following this line, we explored the mechanism that inhibiting cholesterol synthesis regulated PTGES2. As shown by RT‐PCR and western blot analysis, inhibiting cholesterol synthesis increased both the mRNA and protein expression of PTGES2, suggesting that inhibiting cholesterol synthesis might affect the transcription of PTGES2.
SREBP2 is a classical transcription factor controlling the feedback regulation of cholesterol DNS. Under normal conditions, SREBP2 resides within the endoplasmic reticulum (ER). When cholesterol synthesis is inhibited by statin, SREBP2 translocates from the ER to the Golgi and releases the active NH2‐terminal bHLH transcription factor domain. Then, the active domain travels to nuclear and promotes the transcription of downstream target genes. 24 , 25 As predicted by the JASPAR database, there are two binding SREBP2 binding sites on the promoter of PTGES2. The dual luciferase reporter assay verified that SREBP2 promoted the transcription of PTGES2. Furthermore, inhibiting SREBP2 decreased the expression of PTGES2 upregulated by inhibiting cholesterol DNS. These data indicated that inhibiting cholesterol DNS promoted PTGES2 expression in a SREBP2‐dependent manner.
Collectively, we provide the first evidence that inhibiting cholesterol DNS promotes HCC progression with high fatty acid loading. A high‐fat diet provides abundant essential metabolic substrates for the synthesis of arachidonic acid. With this background, inhibiting cholesterol synthesis upregulates the SREBP2–PTGES2 pathway, which further promotes HCC progression. Therefore, upregulation of arachidonic acid metabolism might be an obstacle to antitumor application of statins. Our results shed light on the crosstalk between cholesterol synthesis and arachidonic acid metabolism in HCC progression. These data remind us of the necessity of combining the inhibition of cholesterol metabolism and arachidonic acid metabolism in HCC therapy.
Regrettably, we failed to obtain the medication history and clinic serum lipid value of patients recruited in the tissue microarray. The effect of statin in patients who have high TG/LA levels needs to be further studied to verify the crosstalk between cholesterol synthesis and arachidonic acid metabolism in HCC progression. Besides SREBP2, other transcription factors binding the PTGES2 promoter region were predicted on the JASPAR database (FigureS6). Whether these transcription factors could be regulated by statin will be explored in our future research.
AUTHOR CONTRIBUTIONS
Zhibo Zhao: Conceptualization; investigation; writing – original draft; writing – review and editing. Xinyi Liu: Investigation. Yue Xiang: Investigation. Zhengping Hou: Investigation. Kun He: Investigation. Guochao Zhong: Funding acquisition. Jiejun Hu: Data curation. Dong Cai: Validation. Yan Liu: Funding acquisition. Jihua Ren: Supervision. Jianping Gong: Supervision. Lei Zhao: Conceptualization; funding acquisition; supervision.
Supporting information
Figure S1.
Figure S2.
Figure S3.
Figure S4.
Figure S5.
Figure S6.
Table S1.
Table S2.
Table S3.
ACKNOWLEDGMENTS
We appreciate Professor Ruan Xiongzhong and Chen Yaxi for sharing their experimental platform.
FUNDING INFORMATION
This study was funded by the National Natural Science Foundation of China (No. 81970510, No.82100604, and No.82203391); the Natural Science Foundation of Chongqing (No. cstc2019jcyj‐msxmX0869 and No.CSTB2023NSCQ‐BHX0163); the Scientific and Technological Research Program of Chongqing Municipal Education Commission (No. KJQN201900404); and the Talent Project of Chongqing (CQYC2019050790).
CONFLICT OF INTEREST STATEMENT
The authors have no conflicts of interest to declare.
ETHICS STATEMENT
Approval of the research protocol by an Institutional Reviewer Board: Medical Ethical Committee of the Second Affiliated Hospital of Chongqing Medical University (2018, No. 60).
Informed Consent: N/A.
Registry and the Registration No. of the study/trial: N/A.
Animal Studies: Ethical Committee of the Experimental Animal Ethics Committee of the Second Affiliated Hospital of Chongqing Medical University (2021, No. 156).
Zhao Z, Liu X, Xiang Y, et al. Inhibiting cholesterol de novo synthesis promotes hepatocellular carcinoma progression by upregulating prostaglandin E synthase 2‐mediated arachidonic acid metabolism under high fatty acid conditions. Cancer Sci. 2024;115:477‐489. doi: 10.1111/cas.16035
Zhibo Zhao, Xinyi Liu contribute equally to this work.
Jihua Ren, Jianping Gong and Lei Zhao contribute equally this work.
Contributor Information
Jihua Ren, Email: renjihua2016@cqmu.edu.cn.
Jianping Gong, Email: gongjianping@cqmu.edu.cn.
Lei Zhao, Email: zhaolei@cqmu.edu.cn.
REFERENCES
- 1. Bray F, Ferlay J, Soerjomataram I, Siegel RL, Torre LA, Jemal A. Global cancer statistics 2018: GLOBOCAN estimates of incidence and mortality worldwide for 36 cancers in 185 countries. CA Cancer J Clin. 2018;68:394‐424. [DOI] [PubMed] [Google Scholar]
- 2. Llovet JM, Kelley RK, Villanueva A, et al. Hepatocellular carcinoma. Nat Rev Dis Primers. 2021;7:6. [DOI] [PubMed] [Google Scholar]
- 3. Bobolts L. Hepatocellular carcinoma: considerations for managed care professionals. Am J Manag Care. 2020;26:S220‐S226. [DOI] [PubMed] [Google Scholar]
- 4. Maxfield FR, Tabas I. Role of cholesterol and lipid organization in disease. Nature. 2005;438:612‐621. [DOI] [PubMed] [Google Scholar]
- 5. Zhou F, Sun X. Cholesterol metabolism: a double‐edged sword in hepatocellular carcinoma. Front Cell Dev Biol. 2021;9:762828. [DOI] [PMC free article] [PubMed] [Google Scholar]
- 6. Zou B, Odden MC, Nguyen MH. Statin use and reduced hepatocellular carcinoma risk in patients with nonalcoholic fatty liver disease. Clin Gastroenterol Hepatol. 2022;21:435‐444.e436. [DOI] [PubMed] [Google Scholar]
- 7. Yi SW, Kim SH, Han KJ, Yi JJ, Ohrr H. Higher cholesterol levels, not statin use, are associated with a lower risk of hepatocellular carcinoma. Br J Cancer. 2020;122:630‐633. [DOI] [PMC free article] [PubMed] [Google Scholar]
- 8. Cokan KB, Urlep Z, Lorbek G, et al. Chronic disruption of the late cholesterol synthesis leads to female‐prevalent liver cancer. Cancer. 2020;12:3302. [DOI] [PMC free article] [PubMed] [Google Scholar]
- 9. Puig N, Minambres I, Benitez S, et al. Familial combined hyperlipidemia (FCH) patients with high triglyceride levels present with worse lipoprotein function than FCH patients with isolated hypercholesterolemia. Biomedicine. 2020;8:6. [DOI] [PMC free article] [PubMed] [Google Scholar]
- 10. Skoumas J, Liontou C, Chrysohoou C, et al. Statin therapy and risk of diabetes in patients with heterozygous familial hypercholesterolemia or familial combined hyperlipidemia. Atherosclerosis. 2014;237:140‐145. [DOI] [PubMed] [Google Scholar]
- 11. Skoumas I, Ioakeimidis N, Vlachopoulos C, et al. Statin therapy and risk of diabetes mellitus in aging patients with heterozygous familial hypercholesterolemia or familial combined hyperlipidemia: a 10‐year follow‐up. Angiology. 2018;69:242‐248. [DOI] [PubMed] [Google Scholar]
- 12. Islam M, Poly T, Walther B, Yang H, Jack Li Y. Statin use and the risk of Hepatocellular Carcinoma: a meta‐analysis of observational studies. Cancers. 2020;12:671. [DOI] [PMC free article] [PubMed] [Google Scholar]
- 13. Li X, Liu L, Hu Y. Statin use and the prognosis of patients with hepatocellular carcinoma: a meta‐analysis. Biosci Rep. 2020;40:BSR20200232. [DOI] [PMC free article] [PubMed] [Google Scholar]
- 14. Christiansen LB, Dohlmann TL, Ludvigsen TP, et al. Atorvastatin impairs liver mitochondrial function in obese Gottingen Minipigs but heart and skeletal muscle are not affected. Sci Rep. 2021;11:2167. [DOI] [PMC free article] [PubMed] [Google Scholar]
- 15. Braeuning A, Bucher P, Hofmann U, Buchmann A, Schwarz M. Chemically induced mouse liver tumors are resistant to treatment with atorvastatin. BMC Cancer. 2014;14:766. [DOI] [PMC free article] [PubMed] [Google Scholar]
- 16. Jeon CY, Goodman MT, Cook‐Wiens G, Sundaram V. Statin use and survival with early‐stage hepatocellular carcinoma. Cancer Epidemiol Biomarkers Prev. 2016;25:686‐692. [DOI] [PubMed] [Google Scholar]
- 17. Chiu AP, Tschida BR, Sham TT, et al. HBx‐K130M/V131I promotes liver cancer in transgenic mice via AKT/FOXO1 signaling pathway and arachidonic acid metabolism. Mol Cancer Res. 2019;17:1582‐1593. [DOI] [PMC free article] [PubMed] [Google Scholar]
- 18. Shan C, Xu F, Zhang S, et al. Hepatitis B virus X protein promotes liver cell proliferation via a positive cascade loop involving arachidonic acid metabolism and p‐ERK1/2. Cell Res. 2010;20:563‐575. [DOI] [PubMed] [Google Scholar]
- 19. Higashi T, Hayashi H, Kitano Y, et al. Statin attenuates cell proliferative ability via TAZ (WWTR1) in hepatocellular carcinoma. Med Oncol. 2016;33(11):123. 10.1007/s12032-016-0845-6 [DOI] [PubMed] [Google Scholar]
- 20. Kim S, Lee E, Lee E, et al. Targeted eicosanoids profiling reveals a prostaglandin reprogramming in breast cancer by microRNA‐155. J Exp Clin Cancer Res. 2021;40:43. [DOI] [PMC free article] [PubMed] [Google Scholar]
- 21. Chiu A, Tschida B, Sham T, et al. HBx‐K130M/V131I promotes liver cancer in transgenic mice via AKT/FOXO1 signaling pathway and arachidonic acid metabolism. Mol Cancer Res. 2019;17:1582‐1593. [DOI] [PMC free article] [PubMed] [Google Scholar]
- 22. Liu Y, Ren H, Zhou Y, et al. The hypoxia conditioned mesenchymal stem cells promote hepatocellular carcinoma progression through YAP mediated lipogenesis reprogramming. J Exp Clin Cancer Res. 2019;38:228. [DOI] [PMC free article] [PubMed] [Google Scholar]
- 23. Xun X, Zhang C, Wang S, et al. Cyclooxygenase‐2 expressed hepatocellular carcinoma induces cytotoxic T lymphocytes exhaustion through M2 macrophage polarization. Am J Transl Res. 2021;13:4360‐4375. [PMC free article] [PubMed] [Google Scholar]
- 24. Brown M, Radhakrishnan A, Goldstein J. Retrospective on cholesterol homeostasis: the central role of Scap. Annu Rev Biochem. 2018;87:783‐807. [DOI] [PMC free article] [PubMed] [Google Scholar]
- 25. Radhakrishnan A, Goldstein J, McDonald J, Brown M. Switch‐like control of SREBP‐2 transport triggered by small changes in ER cholesterol: a delicate balance. Cell Metab. 2008;8:512‐521. [DOI] [PMC free article] [PubMed] [Google Scholar]
Associated Data
This section collects any data citations, data availability statements, or supplementary materials included in this article.
Supplementary Materials
Figure S1.
Figure S2.
Figure S3.
Figure S4.
Figure S5.
Figure S6.
Table S1.
Table S2.
Table S3.