

Abstract
NR0B1 is frequently activated in hepatocellular carcinoma (HCC). However, the role of NR0B1 is controversial in HCC. In this study, we observed that NR0B1 was an independent poor prognostic factor, negatively correlated with the overall survival of HCC and the relapse‐free survival of patients treated with sorafenib. Meanwhile, NR0B1 promoted the proliferation, migration, and invasion of HCC cells, inhibited sorafenib‐induced apoptosis, and elevated the IC50 of sorafenib in HCC cells. NR0B1 was further displayed to increase sorafenib‐induced autophagic vesicles and activate Beclin1/LC3‐II‐dependent autophagy pathway. Finally, NR0B1 was revealed to transcriptionally suppress GSK3β that restrains AMPK/mTOR‐driven autophagy and increases BAX‐mediated apoptosis. Collectively, our study uncovered that the ectopic expression of NR0B1 augmented sorafenib‐resistance in HCC cells by activating autophagy and inhibiting apoptosis. Our findings supported that NR0B1 was a detrimental factor for HCC prognosis.
Keywords: apoptosis, autophagy, hepatocellular carcinoma (HCC), NR0B1, sorafenib resistance
Our bioinformatic analysis firstly suggested that the ectopic expression of NR0B1 was negatively correlated with the relapse‐free survival (RFS) of patients treated with sorafenib. We found that NR0B1 promotes proliferation, migration, and invasion of hepatocellular carcinoma (HCC) cells and augments sorafenib resistance in HCC cells. We further revealed that NR0B1 inhibited sorafenib‐induced apoptosis and promoted autophagy through transcriptionally repressing GSK3β expression. The downregulated GSK3β activity enhanced the autophagic pathway of AMPK/mTOR/Beclin1/LC3‐II whereas suppressed the BAX‐apoptosis pathway. Importantly, our study proposed that the nuclear factor of NR0B1 was a detrimental factor for HCC prognosis and a new target related to sorafenib resistance.

Abbreviations
- 3‐MA
3‐methyladenine
- ETC
electron transport chain
- GSEA
Gene Set Enrichment Analysis
- HBV
hepatitis B virus
- HCC
hepatocellular carcinoma
- HCV
hepatitis C virus
- NR0B1
nuclear receptor subfamily 0, group B, member 1, gene
- OS
overall survival
- RCD
regulated cell death
- RFS
relapse‐free survival
- ROS
reactive oxygen species
- TCA
tricarboxylic acid
- TCGA
The Cancer Genome Atlas
1. INTRODUCTION
Hepatocellular carcinoma (HCC) is a primary liver malignancy in patients with chronic liver disease and cirrhosis, 1 with a globally increasing incidence due to hepatitis viruses (HBV and HCV) infection and alcohol use. 2 In the past few decades, although the management of HCC has been improved significantly with curative options including hepatic resection, liver transplantation, targeted chemotherapy, and systemic therapies, the five‐year overall survival rate of HCC is about 50%–70%. 3 , 4 Sorafenib has been considered one of the first‐line treatment options for patients with advanced HCC, although the combination treatment of atezolizumab–bevacizumab or durvalumab–tremelimumab has recently been proposed to provide superior survival benefit compared with sorafenib. 5 , 6 However, sorafenib resistance is a commonly recognized clinical problem that arises in association with epigenetics, exosomes, apoptosis, autophagy, ferroptosis, glucose metabolism, lactate metabolism, and tumor microenvironment. 7 Nevertheless, extensively exploring the molecular mechanisms of drug resistance in HCC and finding more therapeutic targets are crucial to improve the outcome of HCC patients.
The nuclear receptor subfamily 0, group B, member 1 (NR0B1) gene, encoding an atypical orphan nuclear receptor, 8 normally regulates the synthesis and secretion of steroid hormones in testis and adrenal gland. Duplication of NR0B1 causes male‐to‐female inversion, 9 and NR0B1 inactivation leads to X‐linked adrenal hypoplasia congenita. 10 , 11 , 12 Meanwhile, NR0B1 plays a critical role in the transcriptional network for maintaining the pluripotency of embryonic stem cells. 13 Notably, NR0B1 is often ectopically activated in many cancers including liver cancer. 14 , 15 , 16 , 17 , 18 However, the role of NR0B1 in the progression of liver cancers is controversial. NR0B1 was firstly suggested to act as a tumor suppressor which restrains the growth of liver cancer through inhibition of β‐catein. 19 Conversely, recent reports suggested that NR0B1 was a poor prognostic factor for HCC patients. 20 , 21 Especially, NR0B1 has been revealed to protect against drug effects such as acetaminophen‐induced hepatotoxicity 22 and topotecan antitumor activity. 23 Moreover, our preliminary bioinformatic analysis suggested that the expression of NR0B1 was negatively correlated with the relapse‐free survival (RFS) of HCC patients treated with sorafenib, indicating that NR0B1 might be involved in sorafenib resistance in HCC. However, the mechanism of NR0B1‐mediated chemical resistance is unclear.
In this study, we investigated the role of NR0B1 in sorafenib‐induced apoptosis and autophagy in HCC cells. We revealed that NR0B1 enhanced sorafenib resistance through enhancing autophagy‐mediated homeostasis and suppressing apoptosis in HCC cells.
2. MATERIALS AND METHODS
2.1. Bioinformatic analysis
RNA‐seq data and corresponding clinical information of HCC tumors were obtained from The Cancer Genome Atlas database (TCGA, https://cancergenome.nih.gov/). Cox multivariate analysis was used to investigate the correlation of NR0B1‐expression and the characteristics of HCC patients including gender, tumor size in tumor pathological stage TNM (pT_stage), lymph node dissemination (pN_stage), and tumor metastasis (pM_stage). The difference of OS and RFS was assessed between patients with NR0B1‐positive and ‐negative HCC by log‐rank test (https://kmplot.com). 24
2.2. Cell culture and chemical treatment
To investigate the impact of NR0B1 on HCC progression, we selected three cell lines that have been demonstrated to be highly representative of HCC, 25 including hepatoblastoma‐derived HepG2 and HCC‐derived HuH7 and HuH1. HepG2 cell lines were originally purchased from the American Type Culture Collection (ATCC) and maintained in our laboratory. HuH7 and HuH1 were purchased from Meisen CTCC. All cells were cultured in the Dulbecco's Modified Eagle Medium (Hyclone) containing 10% fetal bovine serum (Hyclone) in a humidified cell incubator at 37°C and 5% CO2. Cells were treated separately or simultaneously with sorafenib (Selleck Chemicals) and 3‐methyladenine (3‐MA, Selleck Chemicals).
2.3. Cell model construction
In order to construct the NR0B1‐overexpressed HCC cells, full‐length cDNAs encoding NR0B1 were synthesized and cloned into the lentiviral vector of pEZ‐Lv201 (GeneCopoeia). Simultaneously, the specific shRNAs targeting NR0B1 (shNR0B1) with the sequence “GGGAACTCAGCAAATACTCAGTGAA” were synthesized and inserted into the vectors psi‐LVRU6GP (GeneCopoeia) in order to construct the NR0B1‐downregulated Huh1 cell. After construction of the plasmids, the lentiviral particles were produced and used to infect each HCC cell. Then, stable cell lines with NR0B1 overexpression (OE) and NR0B1 knockdown (KD) were respectively selected using culture medium containing 2 μg/mL puromycin (Hyclone).
2.4. Cell viability assay
For cell viability assay, 2 × 10³ cells/well were seeded into 96‐well plates overnight. After treatment with sorafenib and/or 3‐MA, cell viability was examined with Cell Counting Kit‐8 (CCK‐8, Vazyme). Briefly, 10 μL CCK‐8 solution was added into each well, and the plates were incubated for 3 h at 37°C before the optical densities were measured at 450 nm by a microplate reader (ThermoForma).
2.5. Colony formation assay
For colony formation assay, cells were seeded into six‐well plates with a density of 600 cells per well. After culturing for 14 days, cells were washed by PBS, fixed with formaldehyde, and stained with crystal violet for 15 min at room temperature. Colonies with more than 50 cells were counted manually and photographed.
2.6. Flow cytometry assay
For cell cycle analysis, cells were seeded in six‐well plates in DMEM without serum for 48 h and then stimulated with 10% FBS for 24 h. After harvesting and fixing with 70% ethanol for 24 h at 4°C, cells were stained with propidium iodide (PI, Solarbio). Then, cells were analyzed using flow cytometry (Beckman Coulter). After treatment with sorafenib, apoptosis of cells was assessed according to the instructions of the Annexin V‐FITC/PI apoptosis detection kit (BD Pharmacy). Apoptotic cells were identified as both annexin V‐FITC+/PI− and annexin V‐FITC+/PI+.
2.7. Wound‐healing assay
Cells were seeded in 12‐well plates until 100% confluency. Using a sterile pipette tip, a vertical wound was formed on the cell monolayer. After adding fresh medium, the cells were imaged under an inverse microscope (Olympus) at 24, 48, 72, and 96 h.
2.8. Transwell assay
For cell invasion assay, 2 × 10⁵ cells were cultured in serum‐free medium for 24 h and then added into the upper transwell filter chamber. DMEM supplemented with 20% FBS was added into the lower chamber as a chemoattractant to draw cell movement for 24 h. After fixing with methanol and staining with crystal violet (Selleck Chemicals), invaded cells were photographed and counted under an inverse microscope (Olympus).
2.9. Western blot analysis
Cells were harvested in a lysis buffer with a protease inhibitor cocktail (Roche). After assay of protein concentration using the BCA protein assay kit (Bioteke), equal amounts of protein were denatured, separated through SDS‐PAGE electrophoresis. Then, proteins were transferred onto polyvinylidene difluoride membranes. Afterward, the membranes were blocked, incubated with primary and secondary antibodies (Table S1), and finally visualized using a chemiluminescence imager (BIO‐RAD).
2.10. Quantitative real‐time PCR
RNA was extracted with an ultra‐pure RNA extraction kit (BioTeke). Reverse transcription was performed using RevertAid First‐Strand cDNA Synthesis Kit (Yeasen), and real‐time PCR was carried out using qPCR SYBR Green Master Mix (Yeasen) on a Bio‐Rad CFX96 RT‐PCR machine (BIO‐RAD). Fold changes were calculated using the comparative C t method (ΔΔC t ). The GAPDH gene was used for normalization. Sequences of primers are listed in Table S2.
2.11. Immunofluorescence analysis
For immunofluorescence analysis of LC3‐II proteins, cells were cultivated in a confocal culture dish for 24 h and then treated with sorafenib. After rinsing with PBS, cells were fixed in 4% paraformaldehyde (Sigma‐Aldrich) for 30 min. Thereafter, cells were blocked with 5% BSA and incubated with rabbit anti‐human LC3‐II primary antibodies (ZenBio) at 4°C for 12 h. After washing with PBS, cells were incubated with goat anti‐rabbit IgG‐HRP (1:200, Bioss Antibodies) secondary antibody. Finally, cells were observed under a confocal laser scanning microscope (Nikon), and the number of LC3 puncta was measured using Image J Software 1.48.
2.12. Transmission electron microscopy (TEM) imaging
For TEM imaging, cells were harvested and fixed in 3% glutaraldehyde prepared in PBS buffer at 4°C overnight. After rinsing with PBS, cells were postfixed in 1% osmium tetroxide for 1 h. Following gradient ethanol dehydration, cells were successively embedded, sectioned, and double‐stained with uranyl acetate and lead citrate. Finally, the autophagosomes of osteoblasts were observed under a transmission electron microscope of JEM‐1400FLASH (JEOL). The number of autophagosomes was determined using Image J Software 1.48.
2.13. Statistical analysis
GraphPad prism 8.0 was used for statistical analysis. Student's t‐test was used to compare the statistical difference between indicated groups. Pearson analysis was used to analyze the correlation between the expression levels of NR0B1 and other genes. A p‐value of less than 0.05 was considered significant.
3. RESULTS
3.1. Ectopic expression of NR0B1 is negatively correlated with the prognosis of HCC
Through analyzing the RNA‐sequencing data of HCC (n = 371) and normal liver tissues (n = 50) from TCGA, we observed that the expression of NR0B1 was frequently activated in HCC tumors and almost not in normal liver tissues (Figure 1A, Figure S1A). For exploring the clinical significance of NR0B1 in HCC progression, we further investigated the effect of NR0B1 expression on mortality rate and overall survival (OS) of HCC. Significantly, the results showed that the mortality rate was higher in NR0B1‐positive HCC patients compared with NR0B1‐negative HCC patients (41.46% vs. 31.19%, Figure S1B). Kaplan–Meier analysis indicated that patients with NR0B1‐postive HCC demonstrated poor OS rate (HR = 1.84, 95% CI = 1.3–2.59, p = 0.00047, Figure 1B). Cox multivariate analysis showed that NR0B1 might be an independent prognostic factor of HCC (HR = 1.50084, 95% CI = 1.2575–1.79127, p = 0.00001, Figure 1C). NR0B1 was detrimental to RFS in HCC patients treated with sorafenib (HR = 3.01, 95% CI = 1.02–8.92, p = 0.04; Figure 1D). Taken together, these results suggested that the ectopic activation of NR0B1 was negatively correlated with the prognosis of HCC.
FIGURE 1.
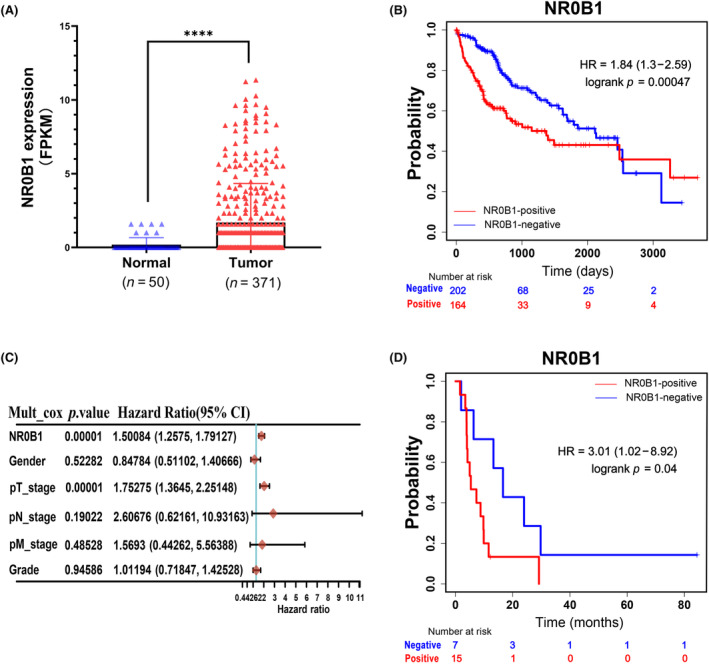
NR0B1 expression was negatively correlated with the prognosis of hepatocellular carcinoma (HCC). (A) Frequent ectopic expression of NR0B1 in HCC tumors (****p < 0.0001, p < 0.001, data extracted from TCGA database). (B) Kaplan–Meier survival curve showing the negative correlation between NR0B1 activation and overall survival (OS) of HCC (n = 366). (C) Cox multivariate analyses of NR0B1 and various clinicopathological indexes in HCC. (D) Kaplan–Meier survival curve showing the negative correlation between NR0B1 activation and relapse‐free survival (RFS) of HCC patients treated with sorafenib (n = 29).
3.2. NR0B1 promotes proliferation, clone formation, cycle transition, migration, and invasiveness of HCC cells
According to the expression profile of NR0B1 in the three cells of HepG2, HuH7, and HuH1, we constructed two NR0B1‐overexpressed HepG2 and Huh7 cells and one NR0B1‐downregulated Huh1 cell (Figure S2). Then, we examined the cellular characteristics of the constructed HCC cells such as proliferation, clone formation, cycle, migration, and invasiveness. We observed that NR0B1 OE resulted in promoted cell proliferation (Figure 2A) and colony formation (Figure 2B) in Huh7 and HepG2 cells, while NR0B1 KD inhibited cell proliferation and colony formation in Huh1 cells (Figure 2C,D). We also found that NR0B1 OE decreased the cell ratio of the G1/G0 phase and increased that of the S and G2/M phases (Figure 2E), while the opposite result was observed for NR0B1 KD (Figure 2F). These results indicated that NR0B1 promoted the phase transition from G1 to S in HCC cells. Furthermore, we detected that NR0B1 OE enhanced the migration and invasion ability of Huh7 and HepG2 cells (Figure 2G,H), and conversely, NR0B1 KD attenuated the migration and invasion ability of Huh1 cells (Figure 2I,J). Taken together, these findings suggested that NR0B1 played an important role in the malignant development of HCC.
FIGURE 2.
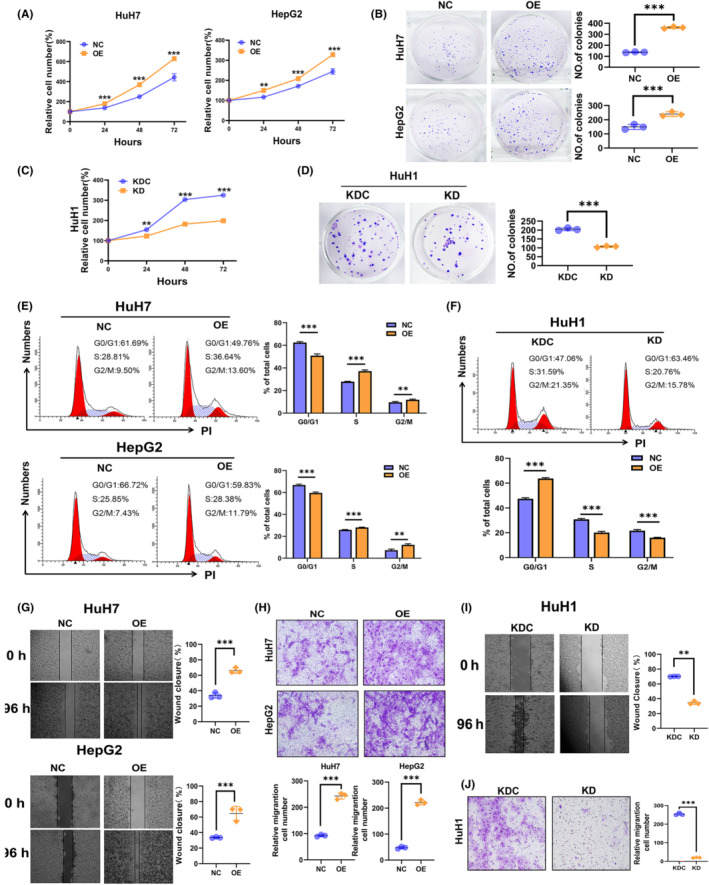
Promotion of cell proliferation, cell cycle transition, cell invasiveness, and inhibition of cell apoptosis by NR0B1 in hepatocellular carcinoma (HCC) cells. (A) CCK8 assays showed that NR0B1 overexpression (OE) enhanced the proliferation of HuH7 and HepG2 cells. Relative proliferation was presented as fold change, which was calculated based on the absorbance and was normalized to a control value (n = 3). (B) Colony formation assays showed that NR0B1 OE increased the colony numbers in HuH7 and HepG2 cells. Colony counts were analyzed using ImageJ software (n = 3). (C) NR0B1 knockdown (KD) decreased the proliferation of HuH1 cells. (D) NR0B1 KD reduced the colony numbers in HuH1 cells. (E, F) Cell cycle assays showed that NR0B1 OE promoted G1/S phase transition in HuH7 and HepG2 cells (E), and NR0B1 KD increased the cell ratio of G1 phase in HuH1 cells (F). (G) Scratch‐wound‐healing assays showed that NR0B1 OE promoted the migration of HuH7 and HepG2 cells. (H) Transwell assays showed that NR0B1 OE accelerated the invasion of HuH7 and HepG2 cells. (I) Scratch‐wound‐healing assays showed that NR0B1 KD inhibited the migration of HuH1 cells. (J) Transwell assays showed that NR0B1 KD inhibited the invasion of HuH1 cells. Original magnification, ×400. All data are presented as the mean ± standard deviation (**p < 0.01, ***p < 0.001).
3.3. NR0B1 augments sorafenib resistance in HCC cells
Given that NR0B1 was associated with poor prognosis among HCC patients treated with sorafenib, we further investigated the role of NR0B1 in HCC cells treated with sorafenib. We observed that sorafenib seriously decreased the proliferation of HCC cells and that NR0B1 OE significantly negated whereas the NR0B1 KD distinctly aggravated the sorafenib‐induced decline of cell proliferation (Figure 3A–C). Then, we found that the IC50 of sorafenib increased about 30%–50% in the NR0B1 OE HCC cells compared with the negative control. Meanwhile, the IC50 of sorafenib reduced about 20%–30% in the NR0B1 KD HCC cells (Figure 3D–F). All of these results indicated that NR0B1 reduced the sensitivity of HCC cells toward sorafenib treatment and augmented sorafenib resistance in HCC cells.
FIGURE 3.
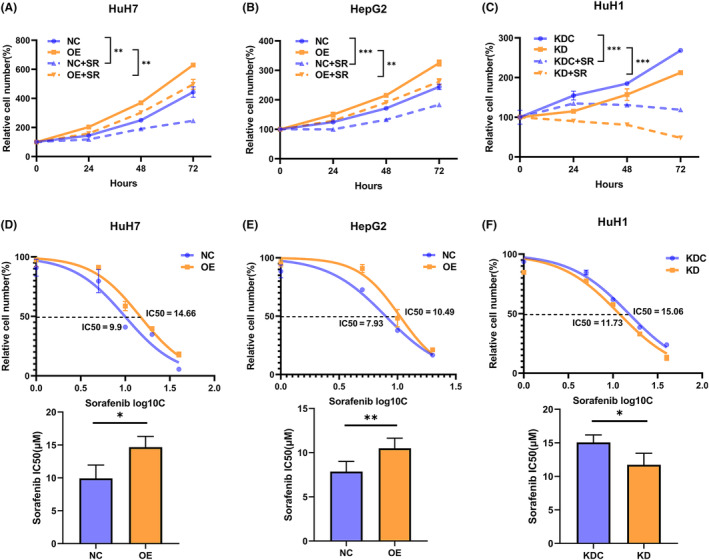
NR0B1 overexpression (OE) decreases the sensitivity of hepatocellular carcinoma (HCC) cells to sorafenib.(A, B) CCK8 assays showed that sorafenib inhibited the proliferation in HCC cells, and NR0B1 OE reversed the decline of proliferation in HuH7 (A) and HepG2 (B) cells treated with 10 μM sorafenib (SR, n = 5). (C) NR0B1 knockdown (KD) aggravated the decline of proliferation in HuH1 cells treated with 10 μM sorafenib (SR, n = 5). (D, E) NR0B1 OE increased the IC50 of sorafenib in HuH7 (D) and HepG2 (E) cells (n = 3). (F) NR0B1 KD decreased the IC50 of sorafenib in HuH1 cells (n = 3). All data are displayed as the mean ± standard deviation (*p < 0.05, **p < 0.01, ***p < 0.001).
3.4. NR0B1 inhibits sorafenib‐induced apoptosis in HCC cells
Previous studies have reported that regulated cell death (RCD) including apoptosis, autophagy, and ferroptosis are involved in sorafenib resistance in HCC. 7 To further explore the molecular mechanism in which NR0B1 is involved to enhance sorafenib resistance in HCC, we firstly investigated the effect of NR0B1 on sorafenib‐induced apoptosis in HCC cells. We found that apoptosis increased after treatment with different concentrations of sorafenib in HCC cells and that NR0B1 OE decreased while NR0B1 KD further increased the ratio of apoptosis in HCC cells (Figure 4A–C). Consistent with these findings, we also observed that NR0B1 OE reduced the level of cleaved‐caspase 9, ‐caspase 3, and ‐PARP1 proteins, whereas NR0B1 KD led to opposite effects (Figure 4D–F). These results suggested that NR0B1 may enhance cellular resistance to sorafenib through suppressing sorafenib‐induced apoptosis in HCC cells.
FIGURE 4.
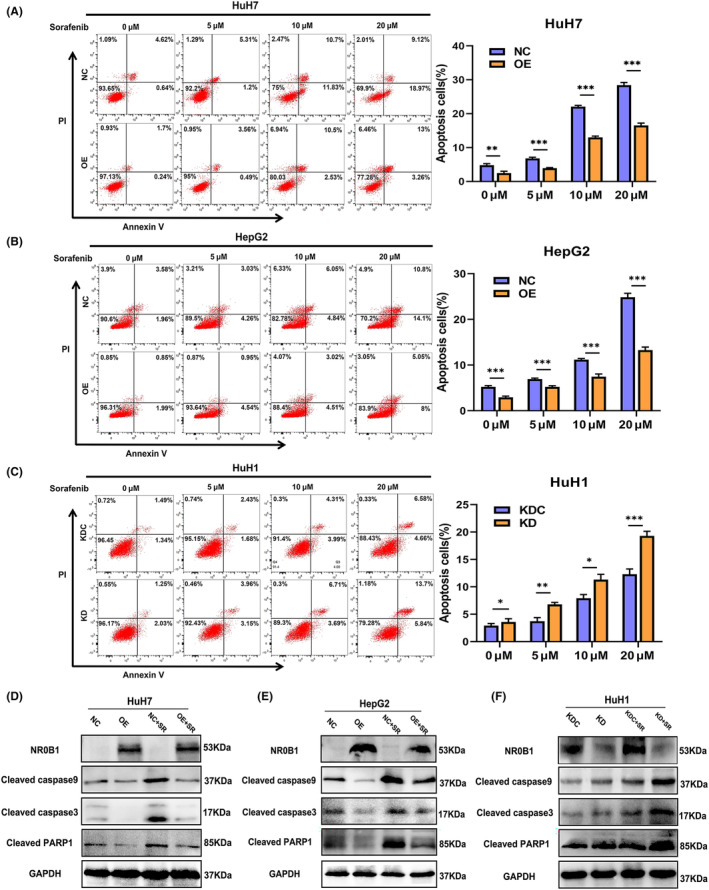
NR0B1 inhibits sorafenib‐induced apoptosis in hepatocellular carcinoma (HCC) cells. (A, B) NR0B1 overexpression (OE) inhibiting sorafenib‐induced apoptosis in HuH7 (A) and HepG2 (B). (C) NR0B1 knockdown (KD) promoting sorafenib‐induced apoptosis in HuH1 cells. (D–F) Alteration of apoptosis‐related protein expression level in the NR0B1‐OE cells of HuH7 (D) and HepG2 (E) and in the NR0B1‐KD cells of HuH1 (F); sorafenib (SR) concentration = 10 μM. All data are displayed as the mean ± standard deviation (n = 3, *p < 0.05, **p < 0.01, ***p < 0.001).
3.5. NR0B1 promotes autophagy in HCC cells
Using the transcriptomic data in TCGA database, we firstly found that the expression level of NR0B1 was positively correlated with that of the autophagy‐related genes containing ATG3, ATG5, ATG7, ATG10, ATG12, Beclin1, LC3B, and ULK1 (p < 0.05) (Figure S3A–H). Then, we examined whether and how NR0B1 is involved in sorafenib‐induced autophagy in HCC cells. Firstly, we confirmed that NR0B1 OE increased while NR0B1 KD decreased the levels of autophagy‐related proteins, including Beclin1 and LC3‐II/‐I in HCC cells, regardless of whether these cells were treated with sorafenib or not (Figure 5A–C). Conversely, NR0B1 expression was negatively correlated with p62 protein level in HCC cells (Figure 5A–C). p62, acting as a marker for autophagic vesicle turnover, 26 is constantly degraded by autophagy. 27 Our results indicated NR0B1‐induced autophagy caused p62 degradation. Meanwhile, we measured the fluorescence spots of LC3‐II proteins and found a significantly increased number in the NR0B1 OE HCC cells (Figure 5D,E) and, conversely, a reduced number of spots in the NR0B1 KD HCC cells (Figure 5F). Furthermore, using TEM, we also observed that NR0B1 OE increased the number of autophagosomes (Figure 5G,H) whereas NR0B1 KD decreased it in HCC cells (Figure 5I). Taken together, these results revealed that NR0B1 promoted the autophagy of HCC cells.
FIGURE 5.
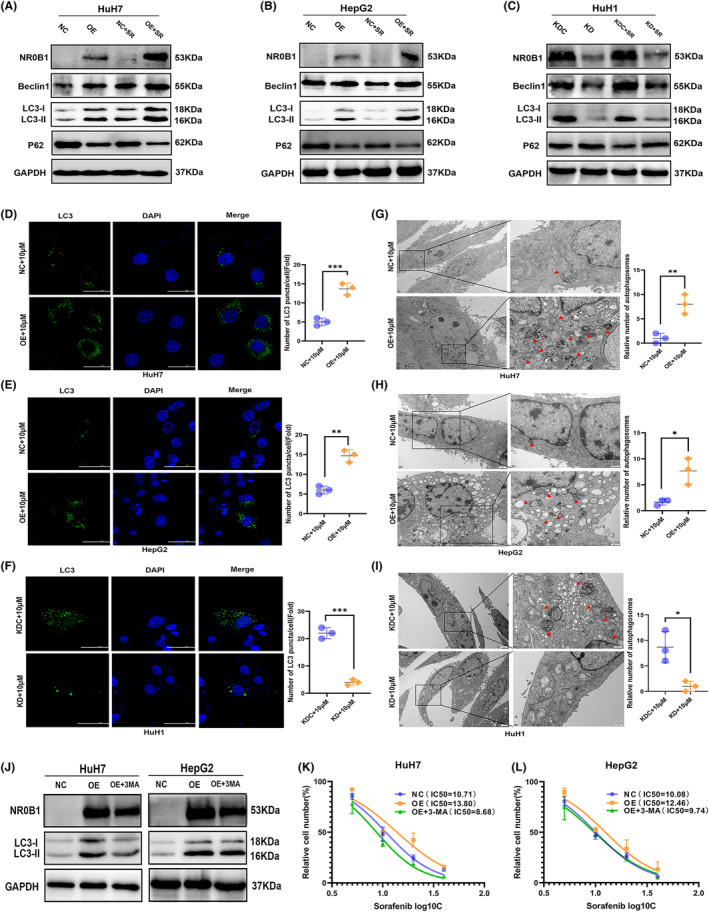
NR0B1 promotes autophagy in hepatocellular carcinoma (HCC) cells. (A–C) Alteration of autophagy‐related protein expression level in the NR0B1 overexpression (OE) cells of HuH7 (A) and HepG2 (B) and in the NR0B1 knockdown (KD) cells of HuH1 (C); sorafenib (SR) concentration = 10 μM. (D–F) Immunofluorescence analysis showing the increment of LC3‐II proteins in the NR0B1 OE cells of HuH7 (D) and HepG2 (E) and the decline of LC3‐II puncta in the NR0B1 KD cells of HuH1 (F). Scale size = 50 μm. (G–I) Transmission electron microscopy (TEM) images showing the increment of autophagosomes in the NR0B1 OE cells of HuH7 (G) and HepG2 (H) and the decline of autophagosomes in the NR0B1 KD cells of HuH1 (I). Red arrowheads indicating autophagosomes. Scale size = 2 μm (original) and 500 nm (magnification). (J) Protein levels of LC3‐II in HuH7 and HepG2 cells treated with 3‐MA (5 mM). (K, L) IC50 assays of sorafenib in NR0B1‐OE HuH7 (K) and HepG2 (L) cells treated with 3‐MA (5 mM). All data are displayed as the mean ± standard deviation (n = 3, *p < 0.05, **p < 0.01, ***p < 0.001).
Moreover, considering that the PI3K inhibitor 3‐MA can act as an autophagy inhibitor by decreasing LC3‐II/‐I expression and autophagosome formation, we used 3‐MA to inhibit sorafenib‐induced autophagy in HCC cells and observed that when autophagy was restrained (Figure 5J), the IC50 of sorafenib was dramatically reduced in NR0B1 OE HCC cells (Figure 5K,L), indicating that the inhibition of autophagy may rescue sorafenib sensitivity in NR0B1 OE HCC cells. These results further suggested that NR0B1 enhanced sorafenib resistance by promoting autophagy in HCC cells.
3.6. NR0B1 transcriptionally represses GSK3β to activate AMPK/mTOR‐derived autophagy and restrain BAX‐mediated apoptosis in HCC cells
NR0B1 has been reported to transcriptionally repress the expression of GSK3β in cervical cancer, 28 and inhibition of GSK3β activity activates the adenosine monophosphate‐activated protein kinase (AMPK)/mammalian target of rapamycin (mTOR) signaling pathway, 29 resulting in the activation of autophagic molecules. 30 , 31 In this case, we speculated that NR0B1 may regulate autophagy through controlling the GSK3β‐targeted molecules in HCC cells. Then, we confirmed that NR0B1 OE clearly decreased GSK3β expression in the levels of mRNA and protein (Figure 6A,B), whereas NR0B1 KD increased its expression (Figure 6C). Following that, we observed an increased level of phosphorylated AMPK (p‐AMPK), Beclin1, and LC3‐II/‐I and a decreased level of phosphorylated mTOR (p‐mTOR) in the NR0B1 OE HCC cells (Figure 6D,E) and an opposite level of each protein in the NR0B1 KD cells (Figure 6F). These results indicated that NR0B1 activated the autophagy‐related signaling pathway including p‐AMPK, p‐mTOR, Beclin1, and LC3‐II/‐I through transcriptionally repressing GSK3β expression.
FIGURE 6.
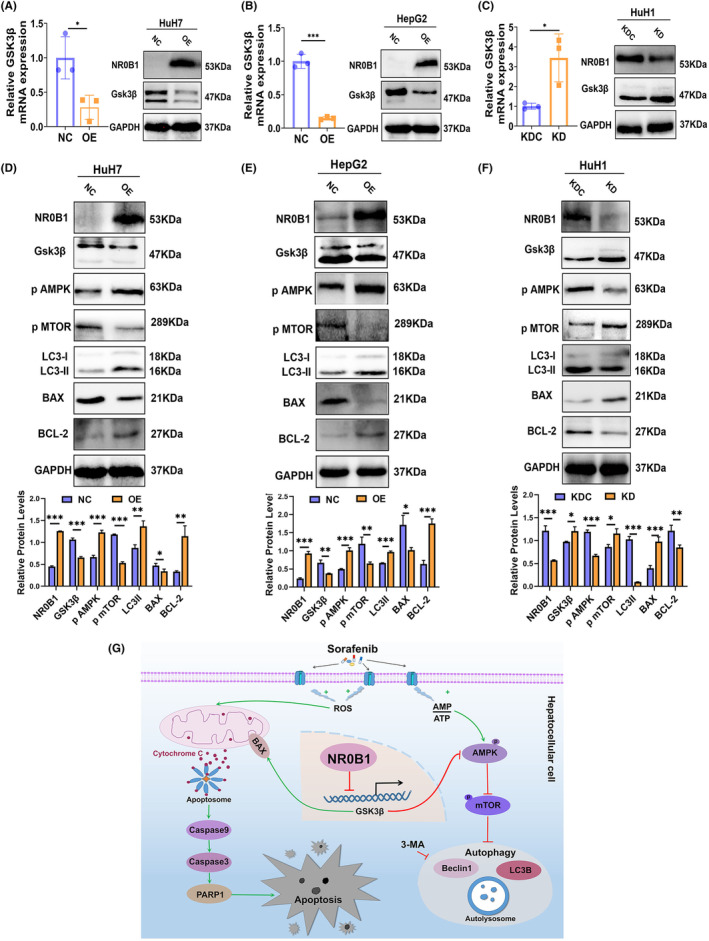
NR0B1 regulates autophagy and apoptosis through suppressing GSK3β expression in hepatocellular carcinoma (HCC) cells. (A, B) NR0B1 overexpression (OE) suppressed GSK3β expression in the levels of mRNA and protein in HuH7 (A) and HepG2 (B) cells. (C) NR0B1 knockdown (KD) increased GSK3β expression in the levels of mRNA and protein in HuH1 cells. (D, E) The level alteration of proteins involved in GSK3β‐targeted autophagy and apoptosis pathway in NR0B1 OE cells of HuH7 (D) and HepG2 (E) and NR0B1 KD cells of HuH1 (F). All data are displayed as the mean ± standard deviation (n = 3, *p < 0.05, **p < 0.01, ***p < 0.001). (G) Proposed working model for NR0B1‐mediated sorafenib resistance in HCC cells.
Moreover, BAX and BCL‐2 are, respectively, apoptotic and antiapoptotic proteins, and the BCL‐2/BAX ratio indicates apoptosis process. GSK3β has previously been reported to induce apoptosis through promoting the expression of the proapoptotic protein BAX. 32 , 33 We observed that the inhibition of GSK3β obviously decreased the BAX level while upregulated the BCL‐2 level, leading to an increased BCL‐2/BAX ratio in the NR0B1‐OE HCC cells (Figure 6D,E). Meanwhile, we found a converse result of BAX and BCL‐2 levels in the NR0B1‐KD cells (Figure 6F). These results indicated that NR0B1 inhibited sorafenib‐induced apoptosis by repressing GSK3β‐mediated BAX activity. In summary, these findings suggested that NR0B1 promoted autophagy and inhibited apoptosis by transcriptionally repressing GSK3β expression, leading to the activation of the AMPK/mTOR/Beclin1/LC3‐II autophagic pathway and suppression of the BAX/Caspase 9/Caspase 3/PARP1 apoptosis pathway in HCC cells (Figure 6G).
4. DISCUSSION
Autophagy, acting as a double‐edged sword in cancer cells, is one of the classical mechanisms by which sorafenib resistance arises during HCC treatment. Cellular autophagy can maintain homeostasis 34 , 35 in cells under some environmental stresses, including chemical treatments, through degrading the damaged organelles, although excessive autophagic activation attacks and phagocytoses cells, 36 evoking autophagic RCD. Recent studies uncovered many molecules including proteins and noncoding RNAs that contribute to sorafenib resistance by activating autophagy 37 in HCC. In the present study, we found that NR0B1 was negatively correlated with the RFS of HCC patients treated with sorafenib and revealed that NR0B1 inhibited sorafenib‐induced cell death and increased the IC50 of sorafenib in HCC cells. Furthermore, we observed that NR0B1 promoted basal and sorafenib‐induced autophagy in HCC cells, and the inhibition of autophagy by 3‐MA would induce cell death. Thus, we demonstrated that NR0B1‐induced autophagy served as a protective effect that inhibits apoptosis, which ultimately promoted sorafenib resistance in HCC cells.
In this study, TEM showed that autophagic vesicles were almost encapsulated in mitochondria, indicating that NR0B1 might promote mitochondrial autophagy in HCC cells. Mitochondrial autophagy is a selective autophagy that engulfs sorafenib‐damaged mitochondria and converts them into bioenergy to maintain cellular homeostasis, thus promoting cancer cells’ survival and enhancing their drug resistance. 38 , 39 , 40 , 41 Meanwhile, structural changes such as swelling of cellular mitochondria and reduction of mitochondrial cristae may be related to the increase of reactive oxygen species (ROS) produced by sorafenib‐targeted mitochondrial electron transport chain (ETC) complexes. 42 ROS is one of main markers of ferroptosis, another RCD involved in sorafenib resistance in HCC. In the present study, using Gene Set Enrichment Analysis (GSEA) in the LinkedOmics database (http://linkedomics.org/admin.php), we found that NR0B1 was correlated with the genes that are involved in the tricarboxylic acid (TCA) cycle, mitochondrial respiratory chain complex assembly, peroxisome organization, and oxidoreductase complex activity (Figure S4A–D). Our additional study also revealed that NR0B1 restrained ferroptosis in lung cancer cells (data not shown). Therefore, combined with the fact that mitochondrial autophagy also inhibits ferroptosis in cancer cells, 43 we suggested that NR0B1 may augment sorafenib resistance in HCC cells by promoting mitochondrial autophagy and inhibiting ROS production during ferroptosis.
In conclusion, NR0B1 promotes proliferation, migration, and invasion of HCC cells and augments sorafenib resistance in HCC cells through promoting autophagy by the GSK3β/AMPK/mTOR/Beclin1/LC3‐II pathway and inhibiting apoptosis by the GSK3β/BAX/Caspase 9/Caspase 3/PARP1 pathway. Our findings supported that NR0B1 was a poor prognostic factor for HCC.
AUTHOR CONTRIBUTIONS
Xiao lan Tan: Data curation; investigation; visualization; writing – original draft. Zhaokun Wang: Data curation; investigation; visualization; writing – review and editing. Shunyao Liao: Formal analysis; funding acquisition; writing – review and editing. Ming Yi: Data curation; methodology; visualization. Dachang Tao: Methodology; resources. Xinyue Zhang: Methodology; resources. Xiangyou Leng: Methodology; resources. Jiaying Shi: Methodology; resources. Shengyu Xie: Methodology; resources. Yuan Yang: Formal analysis; funding acquisition; investigation; writing – review and editing. Yun qiang Liu: Conceptualization; formal analysis; funding acquisition; investigation; methodology; project administration; supervision; validation; visualization; writing – original draft; writing – review and editing.
FUNDING INFORMATION
This work was supported by Grants from the National Natural Science Foundation of China (81773159 and 81871203), and the Sichuan Science and Technology Program (2022NSFSC0679).
CONFLICT OF INTEREST STATEMENT
The authors declare no conflict of interest.
ETHICS STATEMENT
Approval of the research protocol by an Institutional Reviewer Board: N/A.
Informed Consent: N/A.
Registry and the Registration No. of the study/trial: N/A.
Animal Studies: N/A.
Supporting information
Appendix S1..
ACKNOWLEDGMENTS
We thank the staff of the Research Core Facility, West China Hospital, Sichuan University, China, for their assistance in flow cytometry and TEM assays. We also appreciate the financial supports from the National Natural Science Foundation of China (81773159 and 81871203) and the Sichuan Science and Technology Program (2022NSFSC0679).
Tan Xl, Wang Z, Liao S, et al. NR0B1 augments sorafenib resistance in hepatocellular carcinoma through promoting autophagy and inhibiting apoptosis. Cancer Sci. 2024;115:465‐476. doi: 10.1111/cas.16029
Xiao lan Tan and Zhaokun Wang contributed equally to this work.
REFERENCES
- 1. Villanueva A. Hepatocellular Carcinoma. N Engl J Med. 2019;380:1450‐1462. [DOI] [PubMed] [Google Scholar]
- 2. Siegel RL, Miller KD, Jemal A. Cancer statistics, 2019. CA Cancer J Clin. 2019;69:7‐34. [DOI] [PubMed] [Google Scholar]
- 3. Yang JD, Hainaut P, Gores GJ, Amadou A, Plymoth A, Roberts LR. A global view of hepatocellular carcinoma: trends, risk, prevention and management. Nat Rev Gastroenterol Hepatol. 2019;16:589‐604. [DOI] [PMC free article] [PubMed] [Google Scholar]
- 4. Kudo M. Treatment of advanced hepatocellular carcinoma with emphasis on hepatic arterial infusion chemotherapy and molecular targeted therapy. Liver Cancer. 2012;1:62‐70. [DOI] [PMC free article] [PubMed] [Google Scholar]
- 5. Maria R, Alejandro F, Jordi R, et al. BCLC strategy for prognosis prediction and treatment recommendation: the 2022 update. J Hepatol. 2022;76:681‐693. [DOI] [PMC free article] [PubMed] [Google Scholar]
- 6. Singal AG, Llovet JM, Yarchoan M, et al. AASLD practice guidance on prevention, diagnosis, and treatment of hepatocellular carcinoma. Hepatology. 2023;78:1922‐1965. doi: 10.1097/HEP.0000000000000466 [DOI] [PMC free article] [PubMed] [Google Scholar]
- 7. Tang W, Chen Z, Zhang W, et al. The mechanisms of sorafenib resistance in hepatocellular carcinoma: theoretical basis and therapeutic aspects. Signal Transduct Target Ther. 2020;5:87. [DOI] [PMC free article] [PubMed] [Google Scholar]
- 8. Evans RM. The steroid and thyroid hormone receptor superfamily. Science. 1988;240:889‐895. [DOI] [PMC free article] [PubMed] [Google Scholar]
- 9. Swain A, Lovell‐Badge R. Mammalian sex determination: a molecular drama. Genes Dev. 1999;13:755‐767. [DOI] [PubMed] [Google Scholar]
- 10. Lalli E, Bardoni B, Zazopoulos E, et al. A transcriptional silencing domain in DAX‐1 whose mutation causes adrenal hypoplasia congenita. Mol Endocrinol. 1997;11:1950‐1960. [DOI] [PubMed] [Google Scholar]
- 11. Muscatelli F, Strom TM, Walker AP, et al. Mutations in the DAX‐1 gene give rise to both X‐linked adrenal hypoplasia congenita and hypogonadotropic hypogonadism. Nature. 1994;372:672‐676. [DOI] [PubMed] [Google Scholar]
- 12. Reutens AT, Achermann JC, Ito M, et al. Clinical and functional effects of mutations in the DAX‐1 gene in patients with adrenal hypoplasia congenita. J Clin Endocrinol Metab. 1999;84:504‐511. [DOI] [PubMed] [Google Scholar]
- 13. He J, Cheng Y, Ruan Y, et al. Pluripotency‐state‐dependent role of Dax1 in embryonic stem cells self‐renewal. Stem Cells Int. 2021;2021:5522723. [DOI] [PMC free article] [PubMed] [Google Scholar]
- 14. Simon DP, Hammer GD. Adrenocortical stem and progenitor cells: implications for adrenocortical carcinoma. Mol Cell Endocrinol. 2012;351:2‐11. [DOI] [PMC free article] [PubMed] [Google Scholar]
- 15. Aylwin SJ, Welch JP, Davey CL, et al. The relationship between steroidogenic factor 1 and DAX‐1 expression and in vitro gonadotropin secretion in human pituitary adenomas. J Clin Endocrinol Metab. 2001;86:2476‐2483. [DOI] [PubMed] [Google Scholar]
- 16. Mendiola M, Carrillo J, Garcia E, et al. The orphan nuclear receptor DAX1 is up‐regulated by the EWS/FLI1 oncoprotein and is highly expressed in Ewing tumors. Int J Cancer. 2006;118:1381‐1389. [DOI] [PubMed] [Google Scholar]
- 17. Nakamura Y, Suzuki T, Arai Y, Sasano H. Nuclear receptor DAX1 in human prostate cancer: a novel independent biological modulator. Endocr J. 2009;56:39‐44. [DOI] [PubMed] [Google Scholar]
- 18. Oda T, Tian T, Inoue M, et al. Tumorigenic role of orphan nuclear receptor NR0B1 in lung adenocarcinoma. Am J Pathol. 2009;175:1235‐1245. [DOI] [PMC free article] [PubMed] [Google Scholar]
- 19. Jiang HL, Xu D, Yu H, et al. DAX‐1 inhibits hepatocellular carcinoma proliferation by inhibiting β‐catenin transcriptional activity. Cell Physiol Biochem. 2014;34:734‐742. [DOI] [PubMed] [Google Scholar]
- 20. Gu X, Guan J, Xu J, et al. Model based on five tumour immune microenvironment‐related genes for predicting hepatocellular carcinoma immunotherapy outcomes. J Transl Med. 2021;19:26. [DOI] [PMC free article] [PubMed] [Google Scholar]
- 21. Wang M, Huang S, Chen Z, et al. Development and validation of an RNA binding protein‐associated prognostic model for hepatocellular carcinoma. BMC Cancer. 2020;20:1136. [DOI] [PMC free article] [PubMed] [Google Scholar]
- 22. Li S, Dai W, Mo W, et al. By inhibiting PFKFB3, aspirin overcomes sorafenib resistance in hepatocellular carcinoma. Int J Cancer. 2017;141:2571‐2584. [DOI] [PubMed] [Google Scholar]
- 23. Abeni E, Salvi A, Marchina E, Traversa M, Arici B, De Petro G. Sorafenib induces variations of the DNA methylome in HA22T/VGH human hepatocellular carcinoma‐derived cells. Int J Oncol. 2017;51:128‐144. [DOI] [PMC free article] [PubMed] [Google Scholar]
- 24. Lánczky A, Győrffy B. Web‐based survival analysis tool tailored for medical research (KMplot): development and implementation. J Med Internet Res. 2021;23:e27633. [DOI] [PMC free article] [PubMed] [Google Scholar]
- 25. Ao L, Guo Y, Song X, et al. Evaluating hepatocellular carcinoma cell lines for tumour samples using within‐sample relative expression orderings of genes. Liver Int. 2017;37:1688‐1696. [DOI] [PubMed] [Google Scholar]
- 26. Klionsky DJ, Abeliovich H, Agostinis P, et al. Guidelines for the use and interpretation of assays for monitoring autophagy in higher eukaryotes. Autophagy. 2008;4:151‐175. [DOI] [PMC free article] [PubMed] [Google Scholar]
- 27. Bjørkøy G, Lamark T, Brech A, et al. p62/SQSTM1 forms protein aggregates degraded by autophagy and has a protective effect on huntingtin‐induced cell death. J Cell Biol. 2005;171:603‐614. [DOI] [PMC free article] [PubMed] [Google Scholar]
- 28. Liu XF, Li XY, Zheng PS, Yang WT. DAX1 promotes cervical cancer cell growth and tumorigenicity through activation of Wnt/β‐catenin pathway via GSK3β. Cell Death Dis. 2018;9:339. [DOI] [PMC free article] [PubMed] [Google Scholar]
- 29. Fang G, Zhang P, Liu J, et al. Inhibition of GSK‐3β activity suppresses HCC malignant phenotype by inhibiting glycolysis via activating AMPK/mTOR signaling. Cancer Lett. 2019;463:11‐26. [DOI] [PubMed] [Google Scholar]
- 30. Guo H, Ruan C, Zhan X, Pan H, Luo Y, Gao K. Crocetin protected human hepatocyte LO2 cell from TGF‐β‐induced oxygen stress and apoptosis but promoted proliferation and autophagy via AMPK/m‐TOR pathway. Front Public Health. 2022;10:909125. [DOI] [PMC free article] [PubMed] [Google Scholar]
- 31. Weiskirchen R. Commentary: crocetin protected human hepatocyte LO2 cell from TGF‐β‐induced oxygen stress and apoptosis but promoted proliferation and autophagy via AMPK/m‐TOR pathway. Front Public Health. 2022;10:1002484. [DOI] [PMC free article] [PubMed] [Google Scholar]
- 32. Zhang ZY, Dong SM, Liu YH, et al. Enhanced anticancer activity by the combination of vinpocetine and sorafenib via PI3K/AKT/GSK‐3β signaling axis in hepatocellular carcinoma cells. Anticancer Drugs. 2021;32:727‐733. [DOI] [PubMed] [Google Scholar]
- 33. Song CL, Tang H, Ran LK, et al. Sirtuin 3 inhibits hepatocellular carcinoma growth through the glycogen synthase kinase‐3β/BCL2‐associated X protein‐dependent apoptotic pathway. Oncogene. 2016;35:631‐641. [DOI] [PubMed] [Google Scholar]
- 34. Kroemer G, Jäättelä M. Lysosomes and autophagy in cell death control. Nat Rev Cancer. 2005;5:886‐897. [DOI] [PubMed] [Google Scholar]
- 35. Kondo Y, Kanzawa T, Sawaya R, Kondo S. The role of autophagy in cancer development and response to therapy. Nat Rev Cancer. 2005;5:726‐734. [DOI] [PubMed] [Google Scholar]
- 36. Gozuacik D, Kimchi A. Autophagy and cell death. Curr Top Dev Biol. 2007;78:217‐245. [DOI] [PubMed] [Google Scholar]
- 37. Lu S, Yao Y, Xu G, et al. CD24 regulates sorafenib resistance via activating autophagy in hepatocellular carcinoma. Cell Death Dis. 2018;9:646. [DOI] [PMC free article] [PubMed] [Google Scholar]
- 38. Fan S, Price T, Huang W, et al. PINK1‐dependent mitophagy regulates the migration and homing of multiple myeloma cells via the MOB1B‐mediated hippo‐YAP/TAZ pathway. Adv Sci (Weinh). 2020;7:1900860. [DOI] [PMC free article] [PubMed] [Google Scholar]
- 39. Wu H, Wang T, Liu Y, et al. Mitophagy promotes sorafenib resistance through hypoxia‐inducible ATAD3A dependent Axis. J Exp Clin Cancer Res. 2020;39:274. [DOI] [PMC free article] [PubMed] [Google Scholar]
- 40. Yan C, Luo L, Guo CY, et al. Doxorubicin‐induced mitophagy contributes to drug resistance in cancer stem cells from HCT8 human colorectal cancer cells. Cancer Lett. 2017;388:34‐42. [DOI] [PubMed] [Google Scholar]
- 41. Yao J, Wang J, Xu Y, et al. CDK9 inhibition blocks the initiation of PINK1‐PRKN‐mediated mitophagy by regulating the SIRT1‐FOXO3‐BNIP3 axis and enhances the therapeutic effects involving mitochondrial dysfunction in hepatocellular carcinoma. Autophagy. 2022;18:1879‐1897. [DOI] [PMC free article] [PubMed] [Google Scholar]
- 42. Zhang C, Liu Z, Bunker E, et al. Sorafenib targets the mitochondrial electron transport chain complexes and ATP synthase to activate the PINK1‐parkin pathway and modulate cellular drug response. J Biol Chem. 2017;292:15105‐15120. [DOI] [PMC free article] [PubMed] [Google Scholar]
- 43. Qiu YH, Zhang TS, Wang XW, et al. Mitochondria autophagy: a potential target for cancer therapy. J Drug Target. 2021;29:576‐591. [DOI] [PubMed] [Google Scholar]
Associated Data
This section collects any data citations, data availability statements, or supplementary materials included in this article.
Supplementary Materials
Appendix S1..