

Abstract
Centralities determined from Residue Interaction Networks (RIN) in proteins have been used to predict aspects of their structure and dynamics. Here, we correlate the Eigenvector Centrality (Ec) with the rate constant for thermal denaturation (kden) of the HisF protein from Thermotoga maritima based on 12 single alanine substitution mutants. The molecular basis for this correlation was further explored by studying a mutant containing a replacement of a high Ec residue, Y182A, which displayed increased kden at 80 °C. The crystallographic structure of this mutant showed few changes, mostly in two flexible loops. The 1H-15N -HSQC showed only subtle changes of cross peak positions for residues located near the mutation site and scattered throughout the structure. However, the comparison of the RIN showed that Y182 is the vertex of a set of high centrality residues that spreads throughout the HisF structure, which is lacking in the mutant. Cross-correlation displacements of Cα calculated from a molecular dynamics simulation at different temperatures showed that the Y182A mutation reduced the correlated movements in the HisF structure above 70 °C. 1H-15N NMR chemical shift covariance using temperature as perturbation were consistent with these results. In conclusion the increase in temperature drives the structure of the mutant HisF-Y182A into a less connected state, richer in non-concerted motions, located predominantly in the C-terminal half of the protein where Y182 is placed. Conversely, wild-type HisF responds to increased temperature as a single unit. Hence the replacement of a high Ec residue alters the distribution of thermal energy through HisF structure.
Keywords: Residue interaction network, Centrality, Protein stability, NMR, Molecular dynamics
1. Introduction
The native structure and properties of proteins depends on thousands of non-covalent interactions involving hundreds of amino acid residues, with differential contributions to the folded structure (Capra and Singh, 2007; Shanthirabalan et al., 2018). Thus, unraveling their individual contributions is a complex task, which is far from solved. Among the different perspectives developed to tackle this question, the Protein Residue Interaction Networks (RIN) is an interesting approach that deserves attention. Protein RIN has been applied to identify functional residues in protein structures (Amitai et al., 2004; del Sol et al., 2006; Böde et al., 2007; Li et al., 2011; Niknam et al., 2016; Mallik and Kundu, 2017), to find residues that act as nucleation points in the protein folding process (Vendruscolo et al., 2002), to map dynamic allosteric pathways (Atilgan et al., 2004; Szalay et al., 2013; Fokas et al, 2016; Negre et al, 2018), and to detect traits linked to thermostability (Brinda and Vishveshwara, 2005; Vijayabaskar and Vishveshwara, 2010; Souza et al., 2016).
Protein Residue Interaction Networks are constructed using Cα atoms as nodes in the network and non-covalent interactions between pairs of residues as edges. Thus, the three-dimensional protein structure can be mapped into a graph representation, in which the individual roles of each residue in the overall network features is measurable within the context of the entire set of non-covalent interactions. These networks assume a “small world” topology, which has a short path length connecting any pair of residues and a high clustering coefficient (Watts and Strogatz, 1998; Greene and Higman, 2003). This means that proteins contain residues with long range edges that act as shortcuts between nodes that would normally be distant from each other, so these residues serve as hubs connecting the whole structure. Indeed, these ‘hub’ residues tend to have high centrality, a parameter that addresses the importance of a node to the navigation through the network.
The concept of the Residue Interaction Networks is centered on the importance of residues-to-residue connections and how this connection influences the communication between any two points of the protein structure, suggesting that this protein RIN could be particularly informative toward the identification of information flow through the protein structure. This notion has been confirmed by its utility for the mapping of allosteric routes in the enzyme imidazole glycerol phosphate synthase (IGPS) (Rivalta et al., 2012; Lisi et al., 2017; Negre et al., 2018). Given that the thermostability also depends on these same non-covalent interactions, protein RIN should be important for the identification of residues of importance in the resistance to denaturation, which involves the flow of heat through the protein structure. Prior work has demonstrated that proteins from thermophilic organisms have higher centrality characteristics in comparison with mesophilic counterparts (Brinda and Vishveshwara, 2005; Vijayabaskar and Vishveshwara, 2010), suggesting that these high centrality residues could be hubs linking different clusters of residues that accomodates increments of thermal energy within their non-covalent bonds. Based on these observations, we aim at to test the potential of the Residue Interaction Networks to understand protein thermostability.
Here we calculate the Eigenvector Centrality (Ec) of the enzyme HisF and then use single-point mutations, i.e., alanine replacements, to investigate how the Ec correlates with the rate constant of HisF thermal denaturation. Eigenvector Centrality (Ec) is the sum of the product of the number of connections of a given residue to the connections of its partners. We identified twelve residues with a range of Ec values that were replaced by alanine to disrupt their native side chain contacts thereby reducing their Ec value. The impact of these Ec change on the kinetics of thermal denaturation of these mutant HisF enzymes was quantified. Next, considering that Ec reflects the relevance of a node to the flow through the network because a high Ec indicates that a node has numerous connections to nodes that also present many connections (Negre et al., 2018), we then analyze in depth the temperature effect on the dynamics of a mutant HisF upon replacement of a high Ec residue as an approximation of the heat distribution through the protein structure. For these experiments we used the enzyme HisF from the thermophilic bacteria Thermotoga maritima, a 253 residues protein with a (β/α)8 barrel folding that combines with the enzyme HisH to form the heterodimer Imidazole Glycerol Phosphate Synthase (IGPS) (Beismann-Driemeyer and Sterner, 2001). The IGPS complex is present in bacteria, archaea, lower eukaryotes and plants (Kulis-Horn et al., 2014) as part of the histidine and purine pathways. It has been identified as a promising target for antibiotics (Lunardi et al., 2013), and the HisF subunit was also reported as being involved in the persistence of pneumonia infection (Beceiro and Martínez-Guitián, 2019). Importantly, the HisF monomer is stable in isolation and has been studied extensively in monomeric form by Matthews and coworkers (Gangadhara et al., 2013). Moreover, the structure of HisF and its dynamics had been previously characterized, revealing that molecular motions in the millisecond timescale are involved in the allosteric communication with HisH (Lang et al., 2000; Lipchock and Loria, 2009; Rivalta et al., 2012; Lisi et al., 2017; Lisi et al., 2018). Groups of residues forming the allosteric pathway were mapped using Residue Interaction Network analysis and NMR experiments (Rivalta et al., 2012; Lisi et al., 2017; Negre et al., 2018). The effect of temperature on these residues and their correlated motions were also described, showing that the HisF conformational dynamics increases at high temperature (Lisi et al., 2018). Finally, clusters of aliphatic side chain residues confer stability to HisF native structure (Gangadhara et al., 2013). Therefore, HisF represents an ideal candidate for this study as it thermostable, possesses a well-known TIM-barrel fold, is small enough to be accessible to NMR experiments, and is also amenable to crystallography.
2. Materials and Methods
2.1. Residue Interaction Network construction and centrality measurements
The construction of the unweighted undirected Residue Interaction Network of HisFwt was based on the coordinates from PDB file 1THF, the monomeric HisF structure, (Lang et al., 2000) using the software Cytoscape 3.5.1 (Shannon et al., 2003) and the extension StructureViz (Morris et al., 2007). Each of the 253 residues was represented as a node and edges were inserted if the distance between any heavy atom of two different residues was shorter than 5 Å. This cutoff distance represents the upper limit of a non-covalent interaction (Greene and Higman, 2003; Atilgan et al., 2004). Self-loops and duplicated edges were removed. Eigenvector centralities (Ec) were calculated for each residue using the extension CytoNCA (Tang et al., 2015) and expressed as a z-score, indicating their difference from the average Ec (Ec av) in number of standard deviations (σ). Ec z-score = (Ec – Ec av)/ σ.
2.2. Eigenvector centrality weighting
Previous studies have shown that residues surrounding a high centrality node participate in the propagation of mutational effects through the Residue Interaction Network (Souza et al., 2016; Souza et al., 2018). In addition, the centralities of the residues around the mutation site (i.e., replaced by alanine) are very different (Supplementary Table 1). Thus, to investigate how the Eigenvector Centrality (Ec) correlates with the rate constant of HisF thermal denaturation at 80 °C (kden; see below for more details), we weighted the Ec z-score values of the mutated residues by using the combined Ec of their neighboring residues up to 2 contacts away. Because substitution by alanine removes side chain contacts, the centrality of the mutated residue and adjacent ones is differently altered for each mutation. Thus, the calculation of the combined Ec depends on the construction of the Residue Interaction Network for each one of the twelve mutant HisF proteins for which structural data are not available. To overcome such limitation, we introduced in silico alanine substitutions in HisFwt with the software Pymol 2.3 and then using the software Cytoscape 3.5.1 we designed the Residue Interaction Network for those mutant HisF proteins. Subsequently, we calculated the sum of the Ec z-score of the nodes surrounding each mutated residue considering the combined distance of 1 and 2 contacts away from the mutation. Such an aggregated centrality measure was calculated before (WT) and after the alanine substitution (mutant) (Supplementary Table 1). The ratio (WT/mutant) of the aggregated Ec z-score was multiplied by the original Ec z-score value of each mutated residue (Supplementary Table 1) resulting in the Weighted Eigenvector Centrality.
2.3. Plasmids for expression of the HisFwt and mutants
The DNA segment coding for HisF from Thermotoga maritima (Uniprot ID: Q9X0C6) was commercially acquired from Genscript. It was inserted into the vector pET28a between NdeI and EcoRI cleavage sites, maintaining a N-terminal His-tag for purification. Site directed mutants were constructed using QuickChange Lightning Site Directed Mutagenesis kit (Agilent Technologies) following the manufacturer’s instructions and using the wild-type plasmid as template. The reaction product of the site-directed mutagenesis experiment was used to transform XL1-blue E. coli and the correct insertion of the mutation was confirmed by DNA sequencing.
2.4. HisFwt and mutants expression and purification
Vectors coding for HisFwt and mutants were transformed into E. coli BL21(DE3) cells by heat-shock (30 min in ice, 40 s at 42 °C and 3 min in ice). A single colony was selected to inoculate an overnight culture at 37 °C in Luria Broth medium (LB) with 50 μg/mL kanamycin. The overnight culture was used to inoculate fresh LB (500 mL) with 50 μg/mL kanamycin and shaken at 37 °C, 200 rpm until an OD600nm of 0.9 was reached. Then, protein expression was induced by the addition of 0.5 mM IPTG followed by incubation for 16 h at 30 °C. Cells were pelleted at 6,000 rpm for 20 min. The cell pellets were resuspended in Lysis Buffer (10 mM sodium phosphate pH 7, 100 mM NaCl, 20 mM imidazole). Lysis was performed by sonication using a Branson 450 sonifier (5 pulses of 15 s at output 3 with 3 min interval between pulses) in an ice bath. Next, the lysate was incubated at 55 °C for 20 min (70 °C for the samples containing Hiswt), and then centrifuged at 16,000 rpm for 1 h. The supernatant was applied to a Ni-NTA agarose resin (Qiagen) and pure HisF was eluted with 500 mM imidazole buffer. Purification was confirmed by SDS-PAGE (Laemmli, 1970). Buffer exchanges were performed using desalting PD mini-trap G-10 (GE Healthcare) columns, except for NMR studies, in which buffer exchange was achieved by dialysis. Determination of soluble protein concentration was performed using the molar extinction coefficient for HisF (Gill and von Hippel, 1989) and absorbance at 280 nm in 20 mM potassium phosphate buffer pH 7 containing 6 M guanidinium chloride.
2.5. Evaluation of the HisFwt and mutants structure using circular dichroism
To evaluate the wild-type and mutant HisF secondary structure circular dichroism (CD) spectra were collected on a Jasco-815 spectropolarimeter. Samples consisted of 10 μM protein in 20 mM potassium phosphate buffer at pH 7.0. Spectra were collected over a range of 260 nm to 190 nm with scan speed of 20 nm/min and 8 accumulations to increase the signal-to-noise ratio. The molar ellipticity was calculated as previously described (Kelly et al., 2005).
2.6. Evaluation of the HisFwt and mutants structure using tryptophan fluorescence quenching by acrylamide
Tryptophan fluorescence spectra were collected at 30 °C with excitation at 295 nm and the emission range set between 305 and 400 nm using a F7000 fluorimeter (Hitachi) with slit opening of 2.5/2.5 nm (excitation/emission), scanning speed of 240 nm/min and 1 s integration time. Spectra were collected in the presence of increasing acrylamide concentrations up to 0.5 M. The quenching effect was determined as the ratio of fluorescence intensities at the emission maxima in the absence and in the presence of acrylamide (F0/F) plotted as a function of the acrylamide concentration. The Sterner-Volmer constant (Ksv) was calculated based on the slope of those linear graphs, as previously described (Eftink and Ghiron, 1987).
2.7. Kinetics of protein denaturation
The kinetics of protein denaturation at 80 °C was followed by monitoring the increase in the fluorescence of Sypro Orange dye. HisF samples were incubated for 120 min in a F7000 fluorimeter (Hitachi) and fluorescence readings were obtained using excitation at 472 nm and emission at 570 nm. Samples consisted of 10 μM protein in 20 mM potassium phosphate buffer at pH 7. A first order kinetic equation (given below) was fitted to the experimental data using the Origin 6.0 software (OriginLab Corp.).
in which It is the fluorescence intensity at time t, I0 is the initial fluorescence intensity, Imax is the maximum fluorescence intensity and kden is the rate constant of denaturation at 80 °C. The kden determined for the HisFwt and mutant HisF were correlated with the weighted eigenvector centrality as described above.
2.8. Determination of the crystallographic structure of the HisF-Y182A mutant
Purified HisF-Y182A mutant enzyme was concentrated to 15 mg/mL in 20 mM potassium phosphate buffer at pH 8 using an Amicon Ultra-4 10 K centrifugal filter (Merck). Crystals were obtained using a sitting drop crystallization plate in 100 mM Tris-HCl pH 8.0 with 20 mM potassium phosphate and 23 % PEG-3350 at 18 °C. X-ray diffraction data were obtained using synchrotron radiation in the W01B-MX2 beam line at Brazilian Synchrotron Light Laboratory (LNLS). Initial phases were estimated by molecular replacement using Phaser (McCoy et al., 2007) within the Phenix 14.3.260 software package (Adams et al., 2010) using chain A of PDB 1GPW as template. Refinement cycles were done using Phenix and WinCoot 0.8.9.1 (Emsley and Cowtan, 2004). The final structure was deposited in the Protein Databank under the ID 6VDG.
2.9. Molecular dynamics simulations
Molecular dynamics simulations of the HisFwt and HisF-Y182A mutant were performed to probe the temperature effect on the protein dynamics as an indicator of the role of the mutated residue in the heat distribution through their structures. These dynamics were performed using Gromacs 5.1.4 (Lindahl et al., 2015). Starting models corresponded to the PDB 1THF for HisFwt and the crystallographic structure of the HisF-Y182A mutant at 5 different temperatures: 15, 30, 45, 70 and 85 °C. Simulations were done in quadruplicate for 200 ns using the Amber99sb-ildn force field (Lindorff-Larsen et al., 2010) and tip3p water model (Jorgensen et al., 1983). Periodic boundary conditions were calculated assuming a cubic box (20 Å), the system was neutralized with NaCl and the ionic strength was adjusted to 150 mM. The RMSD (all atoms, taking the initial structure as reference) along the trajectory was calculated to assess the system thermalization (Supplementary Fig. 14). Subsequently, from the final trajectories, frames were extracted every 100 ps of the last 100 ns in each temperature replicate for the analysis. Most analyses were executed using Gromacs commands and the NMRbox resources (Maciejewski et al., 2017). Considering that interacting residues exert mutual influence, we calculated cross-correlation matrices of Cα displacement to probe the effect of the mutation Y182A in the connectivity of the HisF protein. Cross-correlation matrices were calculated and analyzed using the Bio3D package (Grant et al., 2006). Pairs of Cα showing displacement cross-correlation were compared between trajectories of wild-type and mutant HisF at the same temperature. Hence the same conditions and limitations of elevated temperature MD simulations apply to both proteins.
2.10. NMR studies
For the 1H-15N-HSQC experiments, HisFwt and HisF-Y182A were expressed in fully deuterated M9 minimal media using 15NH4Cl as the only nitrogen source and purified as described above. After purification, protein samples were dialyzed into 10 mM MES pH 6.8, 50 mM KCl and 1 mM EDTA and concentrated to 900 μM. 10% 2H2O and DSS were added to the sample for locking and referencing, respectively. Spectra were collected on a Varian Inova NMR spectrometer operating at 800 MHz at 30 °C. The NMR spectra processing was performed with NMRPipe (Delaglio et al., 1995) and analyzed using CcpNMR (Skinner et al., 2016) and Sparky (Lee et al., 2015). Resonance assignments were transferred from BMRB entry 15,741 (Lipchock and Loria, 2008). Chemical shift perturbations upon mutation (Grzesiek et al., 1996) were calculated using
Interacting residues may feel similar changes in their chemical environment upon temperature increments due their mutual influence. Thus, an inventory of the chemical shift covariances along a temperature range may be an indicator of the mutation Y182A on the HisF structure connectivity. For temperature dependent NMR measurements, the procedure was as described above, except HisF samples were at 500 μM. The temperature dependent spectra were collected on a Varian Inova NMR spectrometer operating at 600 MHz over a temperature range of 20 to 50 °C with a 5 °C increment. Shifts in combined 1H-15N peak position caused due to the temperature change were used to calculate Pearson correlation coefficients and their p-value for pairs of residues.
2.11. Statistical analysis
Statistical analysis specified in the text were carried in GraphPad Prism 7.0.0. (GraphPad Software).
3. Results
3.1. Residue centralities and denaturation rate constant
The Residue Interaction Network for HisFwt was constructed (Supplementary Fig. 1) and Eigenvector Centrality (Ec) values for the residues were determined (Fig. 1A). Ec z-scores ranged from −1.1 (G20) to + 4.7 (F210), and significantly high Ec residues (>2) were found clustered in the C-terminal half of the protein, especially in α-helix 7 (Fig. 1B). Interestingly, the Eigenvector Centrality distribution among residues in HisF follows a power law, in which a few residues exhibit significantly high centrality, whereas most residues have low centrality. Such a profile has been previously shown for proteins of several diverse folds including the (β/α)8 barrels (Greene and Higman, 2003). These observations suggest that Ec can potentially be used to identify residues with a significant role in the HisF Residue Interaction Network. We therefore created a series of alanine substitution mutants at positions with low to high Ec values (red dots in Fig. 1A). These mutations encompassed residues with side chains of different sizes and physical characteristics distributed throughout the HisFwt structure (Supplementary Fig. 2).
Fig. 1.

A) Eigenvector Centrality (Ec) represented as the number of standard deviations from the mean (z-score). Red dots are residues that were mutated in this study. Identification is shown for residues with z-score > 2. The insert shows the frequency of different z-score classes. B) Structure of HisFwt (PDB 1THF) colored according to Ec (z-score) from blue (−1) to red (5). C) Rate constant of denaturation at 80 °C (kden) for HisFwt and mutants containing alanine substitutions. kden was calculated from curves shown in Supplementary Fig. 6. Comparisons between the wild-type and mutant HisF were made with one-way ANOVA and Bonferroni correction. *p < 0.001; +p < 0.05. D) Correlation between kden and weighted Eigenvector Centrality. R2 = 0.78. For more details about the weighting procedure, see Material and Methods and Supplementary Material. Error bars are standard deviations from triplicate experiments.
These mutant HisF proteins were recombinantly produced and purified (Supplementary Fig. 3). Circular dichroism (CD) spectra and acrylamide quenching data of tryptophan fluorescence showed that they were properly folded (Supplementary Fig. 4 and 5). We then evaluated the kinetics of thermal denaturation of the mutants at 80 °C (Supplementary Fig. 6).
Designed mutations caused a statistically significant increase in the denaturation rate constant at 80 °C for 7 of 12 mutants analyzed. The greatest increases were observed for the Y182A and F210A mutations. Y182 is located in a loop between the β-strand 6 and α-helix 6, and F210 is located in α-helix7. Interestingly, these two residues are in close contact in the HisFwt structure (Supplementary Fig. 7). Y182 and F210 also exhibited high Ec (Fig. 1A). We also mutated Y182 to phenylalanine to remove only the −OH group from the side chain. That mutation caused no change in kden, showing that most of the destabilization effects of the mutation Y182A are due to the absence of the aromatic ring (Fig. 2 and Supplementary Fig. 8). In addition, the insertion of an −OH group in the sidechain of F210 (mutation F210Y) caused destabilization, whereas mutation to leucine (F210L) caused a lower, but still significant reduction in thermal stability (Fig. 2 and Supplementary Fig. 8). These results confirm that Y182 and F210 participate in interactions that contribute strongly to HisF thermal stability.
Fig. 2.

Rate constant of denaturation at 80 °C (kden) for HisFwt and mutants containing replacements of residues Y182 and F210. kden was calculated from curves shown in Supplementary Figs. 6 and 8. Data for mutants Y182A and F210A were the same presented in Fig. 1. They were added for comparison purpose. Error bars are standard deviations from triplicate experiments.
Conversely, even though F227 and I232 have Ec values close to the average (z-scores of 0.35 and 0.77, respectively), the replacement of these residues resulted in a significant decrease in the thermal stability, probably because of the loss of their side chain interactions with F210 (Supplementary Fig. 7). Interestingly, mutations Y182A, F210A, F227A and I232A that reduced the thermal stability of HisF are localized in the last two βα repetitions, a region previously identified as having a cluster of branched aliphatic side chains, which serves as a nucleus of stability for this protein (Gangadhara et al., 2013).
Mutations in the core of the β-barrel produced varied results, in which I7A, E167A and L222A caused no changes in kden, while V48A, V126A and L169A resulted in significant increases in the denaturation rate constant. Mutations of residues far from the cluster of high centrality nodes (K13A and V140A) resulted in no changes in thermal stability.
In search for a general trend, we observe that kden and Ec present a reasonable linear correlation (R2 = 0.58, Supplementary Fig. 9), which is improved (R2 = 0.78; Fig. 1D) when the Ec of the mutated residue is weighted based on the aggregated Ec of its close neighbors (see Material and Methods and Supplementary Materials for details of the weighting procedure). This weighting criterium was chosen based on previous studies that have shown that residues surrounding a high centrality node participate in the propagation of mutational effects through the Residue Interaction Network (Souza et al., 2016; Souza et al., 2018). In addition, the aggregated Ec of the residues around the mutated ones are highly diverse (Supplementary Table 1), showing that the mutations were not inserted in similar context, which reinforce our choice for a weighting criterium (above) that took a residue neighborhood into account. Notably, such similarly significant correlations are not observed for other weighted centrality parameters (i.e., Closeness, Betweenness and Characteristic Pathway Variation; Supplementary Fig. 10).
This result suggests that Ec could be a predictor of trends in protein thermal stability upon alanine substitutions. However, some additional points must be considered. The centrality of the residues in close contact with the mutation site should be used to weight the Ec values resulting in a mixed centrality parameter. The kden increase observed for mutations F227A and I232A (Fig. 1) is a concrete demonstration that mutations of residues interacting with a high Ec residue can cause as much reduction to the stability as a mutation to the high centrality node itself (Souza et al., 2016; Souza et al., 2018). Additionally, residues that mostly interact through backbone contacts may not experience considerable Ec changes upon mutation, as we observed for mutation L222A (Fig. 1). Finally, attempts to draw general linear correlations involving residue centralities have an intrinsic limitation in which highly central residues are somewhat rare in comparison to non-central residues, which are common (Fig. 1A, insert) resulting in an uneven data distribution.
Protein stability has been previously been associated with the Residue Interaction Network. For instance the edge/node ratio, the number of high centrality residues (hubs) and the number of edges of the interaction network of thermophilic proteins are higher than in the mesophilic counterparts (Brinda and Vishveshwara, 2005). Here, by analyzing a series of mutant HisF proteins we have identified a reasonable correlation between Ec and kden, suggesting that particularly Ec is, to a first approximation, a depiction of the likelihood that a mutation might alter the thermal stability of the HisF structure. To gain additional insight we next characterized of one of those mutants (Y182A) in greater detail to understand the basis of the Ec and kden correlation.
3.2. Structure of the HisF-Y182A mutant
The structure of the mutant HisF with the highest increase in kden, HisF-Y182A, was solved by X-ray crystallography (PDBID: 6VDG). Data collection and refinement parameters are shown in Supplementary Table 3. The first two and last three residues and parts of loop 1 (residues 19–29) have low electron density, likely due to enhanced flexibility in these regions. Thus, they were not included in the deposited structure but kept for analysis here (the structure in PDB format is supplied in supplementary material). Indeed, several HisF and variant structures present poor agreement between the density map and the final structure in those same regions (PDBIDs: 2A0N:A, 1VH7:A, 2WJZ:E, 3ZR4:A and 4EWN:D. Supplementary Fig. 11). indicating an enhanced propensity for molecular motions.
A heatmap showing the differences in all C α – C α intramolecular distances (Pettersen et al., 2004) when comparing HisFwt to the mutant HisF-Y182A suggests that most of the structural changes are in loop regions, especially loop 1 (residues 19–30; RMSD 3.84 Å) and loop 3 (residues 51–57; RMSD 2.06 Å) (Fig. 3). Interestingly, these loops are at least at 18 Å away from the mutation site. Nevertheless, these changes might be caused by an enhanced flexibility of these structural elements. Indeed, the B-factors observed for residues in these loops (104 to 174 Å2 and 79 to 94 Å2, respectively) are in the highest quartile of B-factors for this protein. In addition, Cα of N25, which is part of the loop 1, was shown to move up to 27 Å when inorganic phosphate is bound to HisF active site (Douangamath et al., 2002; Lipchock and Loria, 2009). Finally, analysis of NMR spin-relaxation rates indicated that residues T21 and A54, located in the loops 1 and 3, respectively, exhibit significant conformational exchange motion (Lipchock and Loria, 2009). In contrast few structural differences were observed in residues close to Y182. In fact, the RMSD of residues up to 5 Å from Y182 is 0.22 Å, lower than the global deviation (0.47 Å). Most of the contacts between residues present in the wild-type protein remained in the mutant (Fig. 3C), and the differences are spread through their structures, including the site of mutation (Fig. 3D and E).
Fig. 3.

A) Heat map for differences in the distance between equivalent Cα pairs in HisFwt and HisF-Y182A. This map was made using the software Chimera (Pettersen et al., 2004). Differences in the Cα pairs distance (Å) correspond to the distance in the HisFwt subtracted from the one in the HisF-Y182A mutant. B) structural superposition of HisFwt (magenta) and HisF-Y182A (green) produced using the PyMol 2.3.4. software C) Contacts between residues within the structure of both HisFwt and HisF-Y182A mutant represented in the wild-type structure. D) Contacts that are exclusive to the wild-type structure. E) Contacts only present in the HisF-Y182A mutant. Y182 is represented in orange spheres in C and D, whereas in E the same rendering is applied to A182. Contacts are considered present when any heavy atom of a residue is<5 Å from any heavy atom of another residue in the structure. Contacts were detected using the software CMView 1.1.1.
Continuing the comparison between structures, 1H-15N TROSY HSQC experiments were performed at 30 °C for HisFwt and HisF-Y182A (Fig. 4). Out of the 244 peaks previously assigned in the HisFwt spectra (Lipchock and Loria, 2008), 170 were transferred by superposition to the HisF-Y182 spectra. A comparative analysis of these HSQC spectra revealed that the mutation caused only subtle chemical shifts perturbations (1 or 2 standard deviations above the mean), most of them in residues at the C-terminal half of the protein, where the mutation is located (Fig. 4). The highest change in chemical shift observed was 0.2 ppm (E208), while the remaining shifts were below 0.13 ppm, with an average of 0.027 ppm. These values are relatively small compared to chemical shifts perturbations observed when HisFwt binds to the protein HisH, which can be as large as 0.55 ppm (Lipchock and Loria, 2009). Only 4 of the 17 residues (S180, E183, F210 and L222) showing chemical shift changes were in close contact, using a 5 Å cutoff, with Y182. In fact, changes in chemical shift for residues surrounding the mutation site were expected due to the removal of the bulky and amphipathic Y182 side chain. Otherwise, changes in chemical shifts of residues at large distances from the mutation point (12 to 20 Å away) were mostly in the loop regions, including residues G20, I44, A54, A165 and T194.
Fig. 4.

A) 15N HSQC of HisFwt (red) and HisF-Y182A (blue). B) Residues showing chemical shift perturbations 1 or 2 standard deviations (SD) above the mean are marked in magenta and blue spheres, respectively. In grey are residues that could not be identified in the spectrum. Residue Y182 is shown in gray sticks. C): Chemical shift differences between HisFwt and HisF-Y182A residues.
In summary, the comparison of the crystallographic structure and the NMR spectra indicates that the overall structure of the HisF-Y182A mutant is remarkably similar to HisFwt with the exception of conformational differences restricted to two loops, which are known to be flexible, and subtle alterations in the chemical environment of a few residues in the C-terminal half of the protein. Notably, these slight changes are not predictive of the significant alteration in the kinetic thermal stability of the mutant HisF. Actually, this effect is more readily noted from changes in the RIN, as analyzed below.
3.3. Residue Interaction Network of the HisF-Y182A mutant
The Y182A mutation had no effect on the Clustering Coefficient (C = 0.42 versus 0.39) and Characteristic Path Length (L = 4.7 versus 4.9) of the Residue Interaction Network. Nevertheless, the Residue Interaction Network of HisF-Y182A has 46 fewer edges than HisFwt. Only 10 of these missing edges are directly mapped to the mutated residue. In fact, out of the 253 nodes in the Residue Interaction Network, 106 had a decrease in the number of edges, 85 experienced no change and 62 had an increase (Supplementary Fig. 12). Thus, although the coarse view of the Residue Interaction Network, reflected in the C and L, remained unchanged, the mutation indeed impacted the Residue Interaction Network. The residue centrality parameters captured that effect. A comparison of Ec showed a significant centrality decrease around the mutation site (especially in the loop 7 and α -helix 7; residues 202 – 215) and on the opposite side of the structure, in α -helix 3 (residues 88–92) (Fig. 5; Supplementary Fig. 15). Interestingly, the residues between these two lower Ec regions, particularly α -helices 1 and 5 and β -strands 1 and 2, showed an increase in the Ec. Therefore, the Ec analysis indicates that the mutation Y182A significantly changed the connection between residues within HisF structure.
Fig. 5.

A) Differences in Ec of HisFwt and HisF-Y182A mutant expressed in number of standard deviations from the average (z-score). B) Ec differences are represented in HisFwt structure. Positive numbers (red) indicate a decrease in the centrality. Y182 is shown as a red Van der Waals surface.
The impact of this mutation is even clearer when the Residue Interaction Network was represented centering on residue 182 (Fig. 6). It should be noted that the Residue Interaction Networks shown on Fig. 6 are normal networks, residue 182 was simply moved to the center followed by the layers of residues 1, 2, 3 and 4 contacts away from it. Nonetheless, in HisFwt the residue Y182 is surrounded by two layers enriched in significantly high Ec residues, of which at least 25% present Ec z-score above 1.5 (Fig. 6C). Moreover, the mean Ec of the layers forms a gradient with Y182 as the highest vertex (Ec z-score = 3.5), the next two layers with values significantly above average and then this value fades away. Hence Y182 and the two first layers around it form a set of particularly well-connected residues exhibiting the potential to influence the whole network. Conversely, in the mutant HisF-Y182A the average centrality of the residue layers around A182 is the same and <25% of these residues exceed an Ec z-score of 1 (Fig. 6D). Additionally, the mean Ec z-score of those layers is approximately 0 showing that they do not have any special connection to the rest of the protein.
Fig. 6.
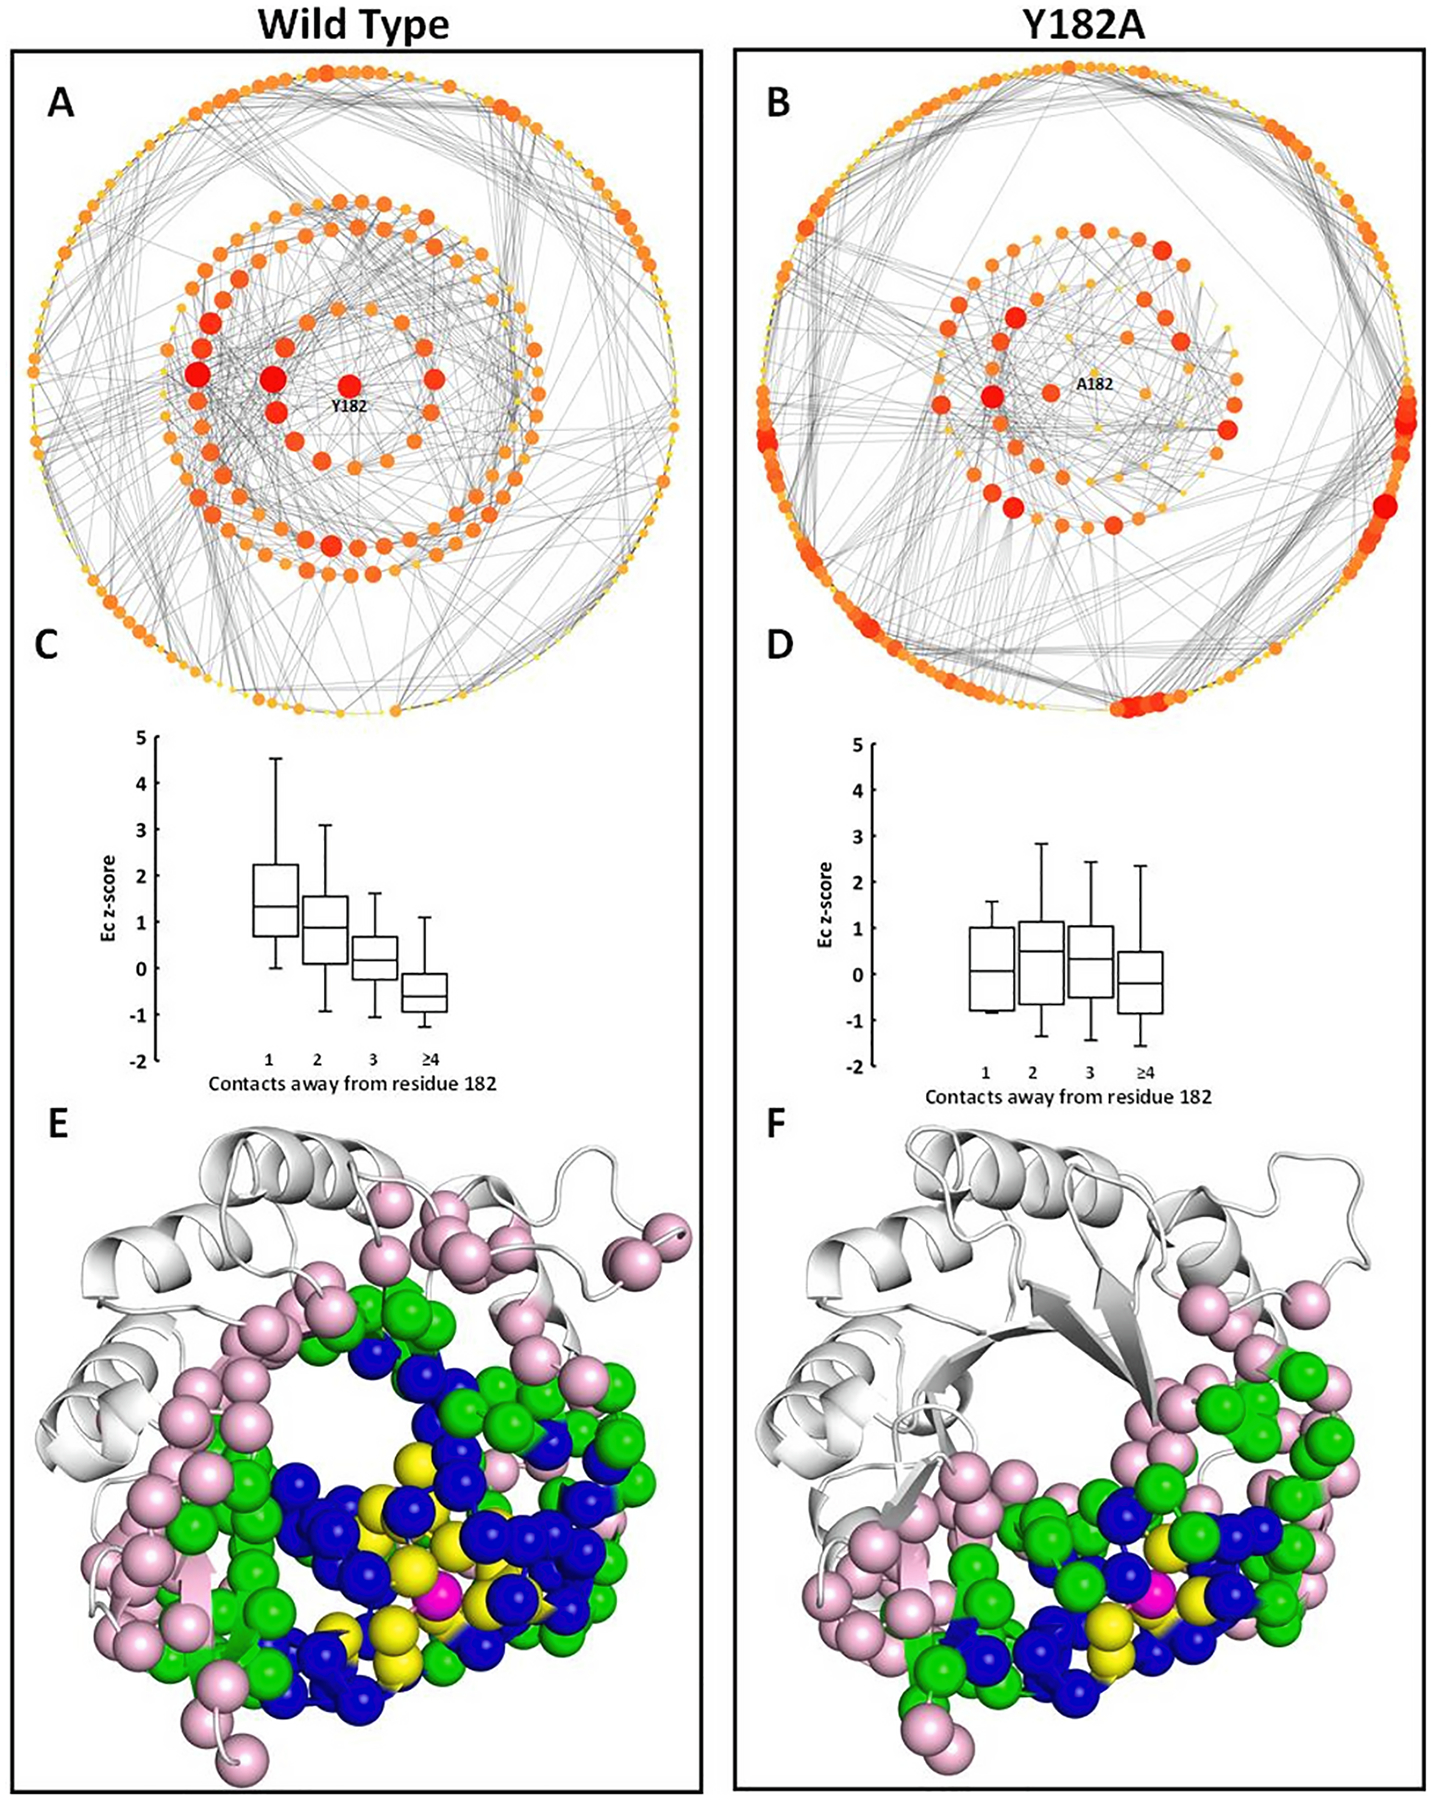
Residue Interaction Network for HisFwt (A) and HisF-Y182A (B) colored by Ec with residue 182 placed in the center. Average Ec of the residues in direct contact with residue 182 and 2, 3 and 4 contacts away for HisFwt (C) and HisF-Y182A (D). Error bars represent standard deviations. Crystal structure of HisFwt (E) and HisF-Y182A (F) with residue 182 colored in magenta, residues in direct contact with it in yellow, 2 contacts away in blue, 3 contacts in green and 4 contacts away in light pink.
Lastly, the layers of high centrality residues connected to Y182 spread over the HisFwt structure covering the entire β -barrel, whereas in the mutant the average centrality residues around A182 are restricted to one side of the protein. In brief, Y182 sits in the top of a centrality gradient forming a wave that propagates over the HisF structure, a feature that is totally lacking in the mutant.
This observation supports the view that highly central residues connect distant parts of the protein structure, hence a perturbation to those central residues may cause disruption even in spatially distant residues, in this case likely due to disruption of the optimal sidechain packing in the wild-type protein. A similar observation was made by Brinda and Vishveshwara, who identified that in thermophilic proteins, exclusive central residues bring together in a single cluster a large fraction of the protein residues (Brinda and Vishveshwara, 2005). The disturbance caused by the mutation Y182A, disassembling the set of well-connected residues distributed throughout HisF structure (Fig. 6), is reminiscent of the effect of attacks directed to hubs, which fragment networks into small and unrelated sets of nodes (Albert et al., 2000).
An extensive and steady network of hydrogen bonds within the central β -barrel associated with two buried clusters of aliphatic side chain residues confer stability to HisFwt folding intermediates and native state. Cluster 1 is found in the α7(β α7)8(β α)1–2 region, whereas cluster 2 encompasses the α2(β α)3–6 β7 region. These two clusters meet at the α -helix 2, but a gap between them is observed in the β7and β8 strands (Gangadhara et al., 2013). Interestingly Y182 and its first two shells of immediate neighbors, which present significantly high Ec values (Fig. 6), are located in that gap and permeate into those stabilizing regions, i.e., the clusters and the β -barrel (Supplementary Fig. 13). Moreover, we speculate that the numerous non-covalent interactions within the β -barrel and the aliphatic clusters, which are distributed throughout the HisF structure, could buffer the increments of thermal energy to resist unfolding.
Therefore, the substantial increase of the thermal denaturation rate due to the mutation Y182A seems to arise from a drastic alteration in the distribution of thermal energy through the mutant HisF structure, which lacks an important hub residue that connects discrete stabilizing regions. The covariant response of the protein residues to the temperature increase was analyzed to test this hypothesis.
3.4. Chemical shift covariance
Connected residues may be similarly affected upon temperature increments, which may be correspond to similar changes in their chemical environment. Thus, chemical shift covariances along a temperature range may be an indicator of the effect of the mutation Y182A on the HisF structure connectivity. Chemical shift covariance analysis is widely used to find clusters of structural variations, usually in allosteric events, often revealing networks of coupled residues (Selvaratnam et al., 2011). Here we analyzed the covariance of 1H-15N chemical shift changes of every pair of residues along a temperature series (20 to 50 °C) (Fig. 7) as a proxy for differences in the heat distribution through the wild-type and mutant HisF. HisFwt showed low chemical shift covariance for a few pairs involving residues in the N-terminal half of the protein. For the HisF-Y182A mutant, in addition to a significant covariance decrease in pairs involving the first 80 residues of the protein, pairs involving residues close to the site of mutation (residues 167 to 186) also exhibited low chemical shift covariance. In addition, we analyzed the significance of each covariance by assigning a p-value for each residue pair (Fig. 7B). We identified 1600 pairs with p-value < 0.01 for HisFwt and 1073 for HisF-Y182A. This reduction in the number of significant covariant pairs in the mutant suggests a decrease in the mutual influence between residues within the protein structure.
Fig. 7.
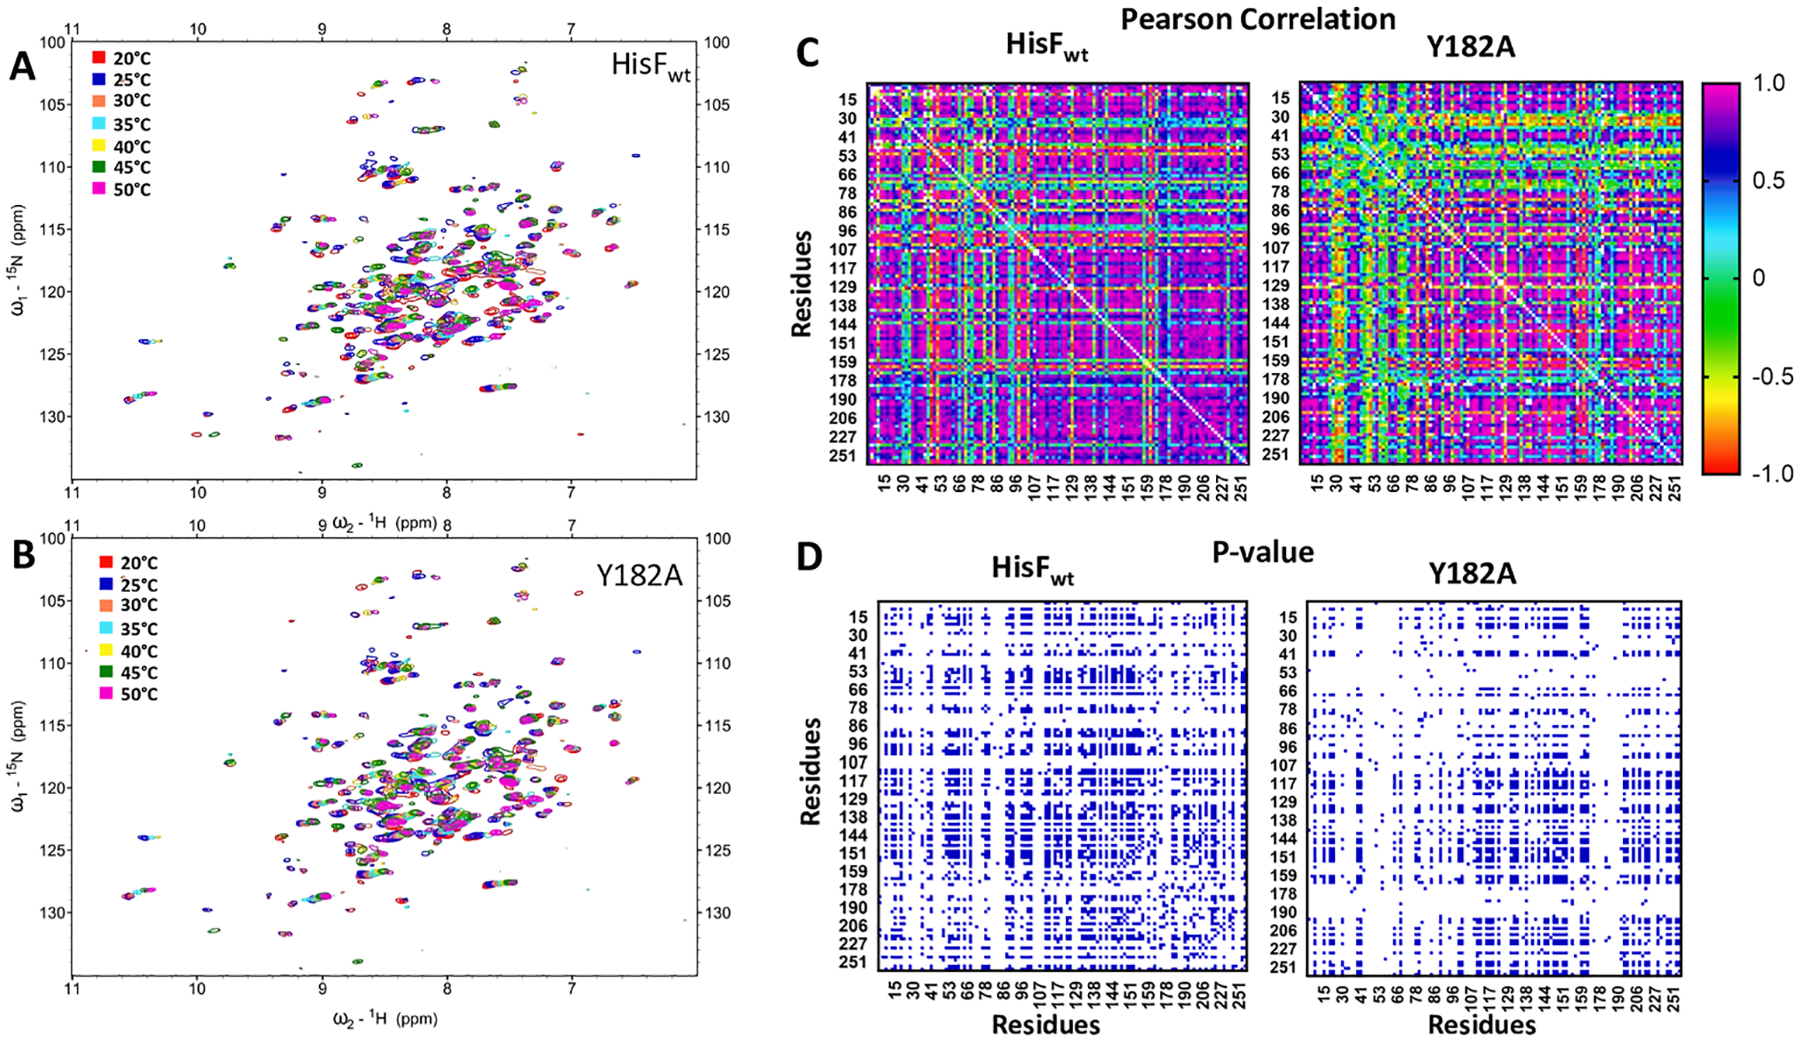
NMR 1H-15N HSQC for A) HisFwt and B) HisF-Y182A at different temperatures. C) Matrices of the Pearson correlation coefficients based on combined 1H-15N chemical shift changes caused by the temperature increase. D) Matrices of the p-value for the correlation between residues pairs in the HisFwt and mutant HisF-Y182A. In blue, p-value < 0.01.
3.5. Cross-correlation matrices for Cα displacements
Residues showing correlated displacement over time often have some type of interaction or are associated with the same dynamical process within a protein. Thus, correlated residue displacements may illustrate how a protein structure responds to temperature perturbation.
We analyzed the Cα displacement covariance between residue pairs along molecular dynamic trajectories carried out at different temperatures for the HisFwt and HisF-Y182A mutant. We recognize the potential issues surrounding high temperature MD runs but reasoned that any deficiencies in the force fields used would be similar for wild-type and mutant HisF minimally impacting our semi-quantitative analysis described below. The correlation coefficients were calculated for every residue pair in the protein structure and plotted as a cross-correlation matrix (Fig. 8). As we are interested in discrete and transient interactions between residues, a cutoff of 0.2 was assumed for the covariance coefficient.
Fig. 8.

A) Cα displacement cross-correlation matrices for the HisFwt and HisF-Y182A mutant. The molecular dynamics of these proteins were simulated at different temperatures. Blue dots mean positive correlation above 0.2 and red dots indicate negative correlation below −0.2. B) Average number of the positive, negative and total correlations shown in each cross-correlation matrix. Analyses were based on the average of 4 independent molecular dynamic simulations at each temperature. *p < 0.05; +p < 0.1.
The HisFwt presents a significantly greater number of residue pairs with correlated motions than the HisF-Y182A at higher temperatures (70 and 85 °C; Fig. 8; Supplementary Table 4). In addition, this difference holds for the correlated and anti-correlated motions. Conversely, below 70 °C no difference in the number of covariant motions is observed between these proteins. Thus, this observation suggests that the residues within the structure of HisF-Y182A are moving less coherently than HisFwt at higher temperatures.
Interestingly, a close inspection of the cross-correlation matrices at 70 and 85 °C reveals that the C-terminal half of HisF-Y182A has fewer correlated residue pairs than the wild-type protein, whereas the correlations within the N-terminal half are similar. These differences are not observed at lower temperatures (Fig. 9).
Fig. 9.

Average number of Cα displacement correlations within the N- and C-terminal halves (A and B, respectively) of HisFwt and the mutant HisF-Y182A. Statistical analysis was done using two-way ANOVA comparing the HisFwt to the mutant. ** p < 0.05.
3.6. Mutation Y182A decreased the protein connectivity altering heat distribution through the structure
Interaction networks connecting distant points may give rise to an efficient ability to distribute energy through the protein structure. In fact, there is much interest in elucidating thermal transport in proteins and understanding the relationship between heat flow and denaturation (Leitner, 2008). It is known that correlated motions in proteins are essential for numerous functions, including transduction of allosteric signals and energy transport (Lange and Grubmüller, 2006), and perhaps in maintaining protein stability.
Mutation to Y182A resulted in significant differences in the correlation of Cα displacements and chemical shift changes at high temperature (70 and 80 °C). In summary, the increase in temperature drives the structure of the mutant HisF-Y182 into a less connected state, richer in non-concerted motions. This phenomenon is most evident in the C-terminal half of the protein, which contains the site of mutation. Conversely, HisFwt responds more coherently, as a single unit. It could be said that when both proteins are at high temperature, the mutant HisF is further along the path to denaturation, in agreement with our proposal that the mutation Y182A altered the distribution of the thermal energy throughout the HisF structure.
4. Conclusion
Eigenvector Centrality, when weighted for the aggregate centrality of the neighborhood of residues, appears to be a good indicator of the importance of that residue for the thermal stability of a protein. Even though Y182A resulted in few structural changes, the single point mutation disassembled a cluster of high centrality residues, altering the connection and concerted motions of residues within the HisF structure. Such a disconnected and unconcerted state could result from a change in the heat distribution throughout the protein structure, explaining the increased rate of thermal denaturation of the mutant HisF-Y182A. These results highlight the importance of the Protein Residue Network as a tool to visualize trends of the mutational effects on the protein thermal stability.
Supplementary Material
Acknowledgements
This work was supported by FAPESP (Fundação de Amparo a Pesquisa do Estado de São Paulo; Grant numbers 2016/12899-6, 2017/25543-8, 2018/25952-8 and 2019/24112-9), CAPES (Coordenação de Aperfeiçoamento de Pessoal de Nível Superior; Finance Code 01; Grant numbers 8887.309511/2018-00 and 88882.332955/2010-01) CNPq (Conselho Nacional de Desenvolvimento Científico) and NIH (National Institute of Health; Grant number GM106121). JPL acknowledges support from NIH GM106121. Authors also acknowledge the analytical instrumentation facilities provided by Universidade de São Paulo – Instituto de Química and the computational resources provided by High Performance Computing of the Superintendência de Tecnologia da Informação – USP.
Abbreviations:
- RIN
Residue Interaction Network
- L
Characteristic path length
- C
Clustering coefficient
- Ec
Eigenvector centrality
- HisFwt
Wild-type HisF from Thermotoga maritima
- k den
Thermal denaturation rate constant
- IPTG
Isopropyl β-d-1-thiogalactopyranoside
Footnotes
CRediT authorship contribution statement
Vitor Medeiros Almeida: Investigation, Formal analysis, Writing - original draft, Visualization. Apala Chaudhuri: Investigation, Formal analysis, Writing - review & editing. Marcus Vinicius Cangussu Cardoso: Investigation, Formal analysis, Writing - review & editing. Bruno Yasui Matsuyama: Investigation, Formal analysis, Writing - review & editing. Gláucio Monteiro Ferreira: Investigation, Formal analysis, Writing - review & editing. Gustavo Henrique Goulart Trossini: Supervision, Writing - review & editing. Roberto Kopke Salinas: Investigation, Resources, Formal analysis, Supervision, Writing - review & editing. J. Patrick Loria: Resources, Formal analysis, Supervision, Writing - review & editing. Sandro Roberto Marana: Conceptualization, Resources, Formal analysis, Supervision, Writing - original draft.
Declaration of Competing Interest
The authors declare that they have no known competing financial interests or personal relationships that could have appeared to influence the work reported in this paper.
Appendix A. Supplementary data
Supplementary data to this article can be found online at https://doi.org/10.1016/j.jsb.2021.107773.
References
- Adams PD, Afonine PV, Bunkóczi G, Chen VB, Davis IW, Echols N, Headd JJ, Hung L-W, Kapral GJ, Grosse-Kunstleve RW, McCoy AJ, Moriarty NW, Oeffner R, Read RJ, Richardson DC, Richardson JS, Terwilliger TC, Zwart PH, 2010. PHENIX: a comprehensive Python-based system for macromolecular structure solution. Acta Crystallogr. D Biol. Crystallogr 66 (2), 213–221. 10.1107/S0907444909052925. [DOI] [PMC free article] [PubMed] [Google Scholar]
- Albert R, Jeong H, Barabási A-L, 2000. Error and attack tolerance of complex networks. Nature 406 (6794), 378–382. 10.1038/35019019. [DOI] [PubMed] [Google Scholar]
- Amitai G, Shemesh A, Sitbon E, Shklar M, Netanely D, Venger I, Pietrokovski S, 2004. Network analysis of protein structures identifies functional residues. J. Mol. Biol 344 (4), 1135–1146. 10.1016/j.jmb.2004.10.055. [DOI] [PubMed] [Google Scholar]
- Atilgan AR, Akan P, Baysal C, 2004. Small-World Communication of Residues and Significance for Protein Dynamics. Biophys. J 86 (1), 85–91. 10.1016/S0006-3495(04)74086-2. [DOI] [PMC free article] [PubMed] [Google Scholar]
- Martínez-Guitián M, Vázquez-Ucha JC, Álvarez-Fraga L, Conde-Pérez K, Lasarte-Monterrubio C, Vallejo JA, Bou G, Poza M, Beceiro A, 2019. Involvement of HisF in the persistence of Acinetobacter baumannii during a pneumonia infection. Front. Cell. Infect. Microbiol 9, 1–9. [DOI] [PMC free article] [PubMed] [Google Scholar]
- Beismann-Driemeyer S, Sterner R, 2001. Imidazole glycerol phosphate synthase from Thermotoga maritima. Quaternary structure, steady-state kinetics, and reaction mechanism of the bienzyme complex. J. Biol. Chem 276 (23), 20387–20396. 10.1074/jbc.M102012200. [DOI] [PubMed] [Google Scholar]
- Böde C, Kovács IA, Szalay MS, Palotai R, Korcsmáros T, Csermely P, 2007. Network analysis of protein dynamics. FEBS Lett 10.1016/j.febslet.2007.05.021. [DOI] [PubMed] [Google Scholar]
- Brinda KV, Vishveshwara S, 2005. A network representation of protein structures: implications for protein stability. Biophys. J 89 (6), 4159–4170. 10.1529/biophysj.105.064485. [DOI] [PMC free article] [PubMed] [Google Scholar]
- Capra JA, Singh M, 2007. Predicting functionally important residues from sequence conservation. Bioinformatics 10.1093/bioinformatics/btm270. [DOI] [PubMed] [Google Scholar]
- del Sol A, Fujihashi H, Amoros D, Nussinov R, 2006. Residues crucial for maintaining short paths in network communication mediate signaling in proteins. Mol. Syst. Biol 2 (2006), 0019. 10.1038/msb4100063. [DOI] [PMC free article] [PubMed] [Google Scholar]
- Delaglio F, Grzesiek S, Vuister GW, Zhu G, Pfeifer J, Bax A, 1995. NMRPipe: a multidimensional spectral processing system based on UNIX pipes. J. Biomol. NMR 6, 277–293. 10.1007/bf00197809. [DOI] [PubMed] [Google Scholar]
- Douangamath A, Walker M, Beismann-Driemeyer S, Vega-Fernandez MC, Sterner R, Wilmanns M, 2002. Structural evidence for ammonia tunneling across the (beta alpha)(8) barrel of the imidazole glycerol phosphate synthase bienzyme complex. Structure 10, 185–193. 10.1016/s0969-2126(02)00702-5. [DOI] [PubMed] [Google Scholar]
- Eftink MR, Ghiron CA, 1987. Does the fluorescence quencher acrylamide bind to proteins? Biochim. Biophys. Acta (BBA)/Protein Struct. Mol 916 (3), 343–349. 10.1016/0167-4838(87)90179-8. [DOI] [PubMed] [Google Scholar]
- Emsley P, Cowtan K, 2004. Coot: model-building tools for molecular graphics. Acta Crystallogr. D Biol. Crystallogr 60 (12), 2126–2132. 10.1107/S0907444904019158. [DOI] [PubMed] [Google Scholar]
- Fokas AS, Cole DJ, Ahnert SE, Chin AW, 2016. Residue geometry networks: a rigidity-based approach to the amino acid network and evolutionary rate analysis. Sci. Rep 6, 1–15. [DOI] [PMC free article] [PubMed] [Google Scholar]
- Gangadhara BN, Laine JM, Kathuria SV, Massi F, Matthews CR, 2013. Clusters of branched aliphatic side chains serve as cores of stability in the native state of the HisF TIM barrel protein. J. Mol. Biol 425 (6), 1065–1081. 10.1016/j.jmb.2013.01.002. [DOI] [PMC free article] [PubMed] [Google Scholar]
- Gill SC, von Hippel PH, 1989. Calculation of protein extinction coefficients from amino acid sequence data. Anal. Biochem 182 (2), 319–326. 10.1016/0003-2697(89)90602-7. [DOI] [PubMed] [Google Scholar]
- Grant BJ, Rodrigues APC, ElSawy KM, McCammon JA, Caves LSD, 2006. Bio3d: an R package for the comparative analysis of protein structures. Bioinformatics 22 (21), 2695–2696. 10.1093/bioinformatics/btl461. [DOI] [PubMed] [Google Scholar]
- Greene LH, Higman VA, 2003. Uncovering network systems within protein structures. J. Mol. Biol 334 (4), 781–791. 10.1016/j.jmb.2003.08.061. [DOI] [PubMed] [Google Scholar]
- Grzesiek S, Stahl SJ, Wingfield PT, Bax A.d., 1996. The CD4 determinant for downregulation by HIV-1 Nef directly binds to Nef. Mapping of the Nef binding surface by NMR. Biochemistry 35 (32), 10256–10261. 10.1021/bi9611164. [DOI] [PubMed] [Google Scholar]
- Jorgensen WL, Chandrasekhar J, Madura JD, Impey RW, Klein ML, 1983. Comparison of simple potential functions for simulating liquid water. J. Chem. Phys 79 (2), 926–935. [Google Scholar]
- Kelly SM, Jess TJ, Price NC, 2005. How to study proteins by circular dichroism. Biochim. Biophys. Acta - Proteins Proteomics 10.1016/j.bbapap.2005.06.005. [DOI] [PubMed] [Google Scholar]
- Kulis-Horn RK, Persicke M, Kalinowski J, 2014. Histidine biosynthesis, its regulation and biotechnological application in Corynebacterium glutamicum. Microb. Biotechnol 7, 5–25. 10.1111/1751-7915.12055. [DOI] [PMC free article] [PubMed] [Google Scholar]
- Laemmli UK, 1970. Cleavage of structural proteins during the assembly of the head of bacteriophage T4. Nature 227 (5259), 680–685. [DOI] [PubMed] [Google Scholar]
- Lang D, Thoma R, Henn-Sax M, Sterner R, Wilmanns M, 2000. Structural evidence for evolution of the beta/alpha barrel scaffold by gene duplication and fusion. Science (80-) 289, 1546–1550. 10.1126/science.289.5484.1546. [DOI] [PubMed] [Google Scholar]
- Lange OF, Grubmüller H, 2006. Generalized correlation for biomolecular dynamics. Proteins 62 (4), 1053–1061. 10.1002/prot.20784. [DOI] [PubMed] [Google Scholar]
- Lee W, Tonelli M, Markley JL, 2015. NMRFAM-SPARKY: enhanced software for biomolecular NMR spectroscopy. Bioinformatics 31, 1325–1327. 10.1093/bioinformatics/btu830. [DOI] [PMC free article] [PubMed] [Google Scholar]
- Leitner DM, 2008. Energy flow in proteins. Annu. Rev. Phys. Chem 59 (1), 233–259. 10.1146/annurev.physchem.59.032607.093606. [DOI] [PubMed] [Google Scholar]
- Li Y, Wen Z, Xiao J, Yin H, Yu L, Yang L.i., Li M, 2011. Predicting disease-associated substitution of a single amino acid by analyzing residue interactions. BMC Bioinform 12 (1) 10.1186/1471-2105-12-14. [DOI] [PMC free article] [PubMed] [Google Scholar]
- Abraham MJ, Murtola T, Schulz R, Páll S, Smith JC, Hess B, Lindahl E, 2015. GROMACS: High performance molecular simulations through multi-level parallelism from laptops to supercomputers. SoftwareX 1–2, 19–25. [Google Scholar]
- Lindorff-Larsen K, Piana S, Palmo K, Maragakis P, Klepeis JL, Dror RO, Shaw DE, 2010. Improved side-chain torsion potentials for the Amber ff99SB protein force field. Proteins Struct. Funct. Bioinforma 10.1002/prot.22711. [DOI] [PMC free article] [PubMed] [Google Scholar]
- Lipchock J, Loria JP, 2009. Millisecond dynamics in the allosteric enzyme imidazole glycerol phosphate synthase (IGPS) from Thermotoga maritima. J. Biomol. NMR 45 (1–2), 73–84. 10.1007/s10858-009-9337-8. [DOI] [PMC free article] [PubMed] [Google Scholar]
- Lipchock JM, Loria JP, 2008. 1H, 15N and 13C resonance assignment of imidazole glycerol phosphate (IGP) synthase protein HisF from Thermotoga maritima. Biomol. NMR Assign 2, 219–221. 10.1007/s12104-008-9125-5. [DOI] [PMC free article] [PubMed] [Google Scholar]
- Lisi GP, Currier AA, Loria JP, 2018. Glutamine hydrolysis by imidazole glycerol phosphate synthase displays temperature dependent allosteric activation. Front. Mol. Biosci 5, 4. 10.3389/fmolb.2018.00004. [DOI] [PMC free article] [PubMed] [Google Scholar]
- Lisi GP, East KW, Batista VS, Loria JP, 2017. Altering the allosteric pathway in IGPS suppresses millisecond motions and catalytic activity. Proc. Natl. Acad. Sci. U. S.A 114 (17), E3414–E3423. 10.1073/pnas.1700448114. [DOI] [PMC free article] [PubMed] [Google Scholar]
- Lunardi J, Nunes JE, Bizarro CV, Basso LA, Santos DS, Machado P, 2013. Targeting the histidine pathway in Mycobacterium tuberculosis. Curr Top Med Chem 13, 2866–2884. 10.2174/15680266113136660203. [DOI] [PubMed] [Google Scholar]
- Maciejewski MW, Schuyler AD, Gryk MR, Moraru II, Romero PR, Ulrich EL, Eghbalnia HR, Livny M, Delaglio F, Hoch JC, 2017. NMRbox: a resource for biomolecular NMR computation. Biophys. J 112 (8), 1529–1534. 10.1016/j.bpj.2017.03.011. [DOI] [PMC free article] [PubMed] [Google Scholar]
- Mallik S, Kundu S, 2017. Modular organization of residue-level contacts shapes the selection pressure on individual amino acid sites of ribosomal proteins. Genome Biol. Evol 10.1093/gbe/evx036. [DOI] [PMC free article] [PubMed] [Google Scholar]
- McCoy AJ, Grosse-Kunstleve RW, Adams PD, Winn MD, Storoni LC, Read RJ, 2007. Phaser crystallographic software. J. Appl. Crystallogr 40 (4), 658–674. 10.1107/S0021889807021206. [DOI] [PMC free article] [PubMed] [Google Scholar]
- Morris JH, Huang CC, Babbitt PC, Ferrin TE, 2007. structureViz: linking cytoscape and UCSF chimera. Bioinformatics 23 (17), 2345–2347. 10.1093/bioinformatics/btm329. [DOI] [PubMed] [Google Scholar]
- Negre CFA, Morzan UN, Hendrickson HP, Pal R, Lisi GP, Loria JP, Rivalta I, Ho J, Batista VS, 2018. Eigenvector centrality for characterization of protein allosteric pathways. Proc. Natl. Acad. Sci. U.S.A 115 (52), E12201–E12208. 10.1073/pnas.1810452115. [DOI] [PMC free article] [PubMed] [Google Scholar]
- Niknam N, Khakzad H, Arab SS, Naderi-Manesh H, 2016. PDB2Graph: A toolbox for identifying critical amino acids map in proteins based on graph theory. Comput. Biol. Med 10.1016/j.compbiomed.2016.03.012. [DOI] [PubMed] [Google Scholar]
- Rivalta I, Sultan MM, Lee N-S, Manley GA, Loria JP, Batista VS, 2012. Allosteric pathways in imidazole glycerol phosphate synthase. Proc. Natl. Acad. Sci. U.S.A 109 (22), E1428–E1436. 10.1073/pnas.1120536109. [DOI] [PMC free article] [PubMed] [Google Scholar]
- Selvaratnam R, Chowdhury S, VanSchouwen B, Melacini G, 2011. Mapping allostery through the covariance analysis of NMR chemical shifts. Proc. Natl. Acad. Sci. U.S.A 108 (15), 6133–6138. 10.1073/pnas.1017311108. [DOI] [PMC free article] [PubMed] [Google Scholar]
- Shannon P, Markiel A, Ozier O, Baliga NS, Wang JT, Ramage D, Amin N, Schwikowski B, Ideker T, 2003. Cytoscape: a software environment for integrated models of biomolecular interaction networks. Genome Res 13, 2498–2504. 10.1101/gr.1239303. [DOI] [PMC free article] [PubMed] [Google Scholar]
- Shanthirabalan S, Chomilier J, Carpentier M, 2018. Structural effects of point mutations in proteins. Proteins Struct. Funct. Bioinforma 10.1002/prot.25499. [DOI] [PubMed] [Google Scholar]
- Skinner SP, Fogh RH, Boucher W, Ragan TJ, Mureddu LG, Vuister GW, 2016. CcpNmr AnalysisAssign: a flexible platform for integrated NMR analysis. J. Biomol. NMR 66 (2), 111–124. 10.1007/s10858-016-0060-y. [DOI] [PMC free article] [PubMed] [Google Scholar]
- Souza VP, Ikegami CM, Arantes GM, Marana SR, Hofmann A, 2018. Mutations close to a hub residue affect the distant active site of a GH1 β-glucosidase. PLoS One 13 (6), e0198696. 10.1371/journal.pone.0198696. [DOI] [PMC free article] [PubMed] [Google Scholar]
- Souza VP, Ikegami CM, Arantes GM, Marana SR, 2016. Protein thermal denaturation is modulated by central residues in the protein structure network. FEBS J 283 (6), 1124–1138. 10.1111/febs.2016.283.issue-610.1111/febs.13659. [DOI] [PubMed] [Google Scholar]
- Szalay KZ, Csermely P, Perc M, 2013. Perturbation centrality and turbine: a novel centrality measure obtained using a versatile network dynamics tool. PLoS One 8 (10), e78059. 10.1371/journal.pone.0078059. [DOI] [PMC free article] [PubMed] [Google Scholar]
- Tang Y, Li M, Wang J, Pan Y, Wu FX, 2015. CytoNCA: a cytoscape plugin for centrality analysis and evaluation of protein interaction networks. Biosystems 127, 67–72. 10.1016/j.biosystems.2014.11.005. [DOI] [PubMed] [Google Scholar]
- Vendruscolo M, Dokholyan NV, Paci E, Karplus M, 2002. Small-world view of the amino acids that play a key role in protein folding. Phys. Rev. E Stat. Nonlin Soft Matter Phys 65, 61910. 10.1103/PhysRevE.65.061910. [DOI] [PubMed] [Google Scholar]
- Vijayabaskar MS, Vishveshwara S, 2010. Interaction energy based protein structure networks. Biophys. J 99 (11), 3704–3715. 10.1016/j.bpj.2010.08.079. [DOI] [PMC free article] [PubMed] [Google Scholar]
- Watts DJ, Strogatz SH, 1998. Collective dynamics of “small-world” networks. Nature 393 (6684), 440–442. 10.1038/30918. [DOI] [PubMed] [Google Scholar]
Associated Data
This section collects any data citations, data availability statements, or supplementary materials included in this article.