Abstract
Background
Nitrogen (N) metabolism-related key genes and conserved amino acid sites in key enzymes play a crucial role in improving N use efficiency (NUE) under N stress. However, it is not clearly known about the molecular mechanism of N deficiency-induced improvement of NUE in the N-sensitive rhizomatous medicinal plant Panax notoginseng (Burk.) F. H. Chen. To explore the potential regulatory mechanism, the transcriptome and proteome were analyzed and the three-dimensional (3D) information and molecular docking models of key genes were compared in the roots of P. notoginseng grown under N regimes.
Results
Total N uptake and the proportion of N distribution to roots were significantly reduced, but the NUE, N use efficiency in biomass production (NUEb), the recovery of N fertilizer (RNF) and the proportion of N distribution to shoot were increased in the N0-treated (without N addition) plants. The expression of N uptake- and transport-related genes NPF1.2, NRT2.4, NPF8.1, NPF4.6, AVP, proteins AMT and NRT2 were obviously up-regulated in the N0-grown plants. Meanwhile, the expression of CIPK23, PLC2, NLP6, TCP20, and BT1 related to the nitrate signal-sensing and transduction were up-regulated under the N0 condition. Glutamine synthetase (GS) activity was decreased in the N-deficient plants, while the activity of glutamate dehydrogenase (GDH) increased. The expression of genes GS1-1 and GDH1, and proteins GDH1 and GDH2 were up-regulated in the N0-grown plants, there was a significantly positive correlation between the expression of protein GDH1 and of gene GDH1. Glu192, Glu199 and Glu400 in PnGS1 and PnGDH1were the key amino acid residues that affect the NUE and lead to the differences in GDH enzyme activity. The 3D structure, docking model, and residues of Solanum tuberosum and P. notoginseng was similar.
Conclusions
N deficiency might promote the expression of key genes for N uptake (genes NPF8.1, NPF4.6, AMT, AVP and NRT2), transport (NPF1.2 and NRT2.4), assimilation (proteins GS1 and GDH1), signaling and transduction (genes CIPK23, PLC2, NLP6, TCP20, and BT1) to enhance NUE in the rhizomatous species. N deficiency might induce Glu192, Glu199 and Glu400 to improve the biological activity of GS1 and GDH, this has been hypothesized to be the main reason for the enhanced ability of N assimilation in N-deficient rhizomatous species. The key genes and residues involved in improving NUE provide excellent candidates for the breeding of medicinal plants.
Supplementary Information
The online version contains supplementary material available at 10.1186/s12870-024-04768-4.
Keywords: Nitrogen deficiency, Nitrogen metabolism, Nitrogen use efficiency, Molecular docking, Panax notoginseng
Background
Nitrogen (N) is a limiting factor for crop yield. To meet the increasing demand for food from the growing global population, over 110 Tg of N fertilizer is applied annually to improve crop yields [1]. However, less than 40% of applied N fertilizer is absorbed by crops, the remaining N fertilizer is lost to the environment through processes such as volatilization, leaching, surface runoff, or microbial consumption [2, 3]. Hence, N use efficiency (NUE) in plants has to be improved [4]. NUE is a complex trait influenced by both genetic and environmental factors [5]. NUE mainly depends on how plants uptake inorganic N from the soil, assimilate nitrate (NO3-) and ammonium (NH4+) [6]. A better understanding of N uptake, transportation and assimilation within the plant is crucial for breeding for crops with high NUE and for the development of sustainable agriculture.
The low-affinity transport system (LATS) and the high-affinity transport system (HATS) ensure an efficient uptake over a wide range of external NO3- concentrations [7]. Phosphorylation of a threonine residue, Thr101, lead to a switch of NRT1.1 from low- to high-affinity state [8]. The expression of NRT2/NPF initiates HATS in the N-deficient condition [9]. Overexpression of OsNRT2.1 and OsNRT2.3 in Oryza sativa has been found to improve NUE and yields under the N deficiency condition [10, 11]. NO3- are degraded to NH4+, then NH4+ form amino acid through catalysis by N metabolism-related enzyme, as reflected by nitrite reductase (NiR), glutamine synthetase (GS) and glutamate dehydrogenase (GDH) [9]. Overexpression of DvGS1/2 and OsGS1 is positively associated with the biomass and NUE in the N-deficient Dunaliella viridis, Arabidopsis thaliana and O. sativa [12–14]. Meanwhile, the enhanced NO3- signal-sensing and transduction pathways might promote N uptake and utilization, and thus improve NUE [15]. The increased expression of NRT1.1, NRT2.1, NIA, NIR1, and GS2 in NLP7-overexpressing A. thaliana cloud improve the biomass and NUE under N stress [16]. Extensive reports are available on N-mediated regulation of enzymes and genes involved in N metabolism [17–19]. Significantly, Pro492 and Ser487 residue of NRT1.1 is important for NO3- transport activity and NUE in A. thaliana [20]. Gln433 and Tyr512 residue play an important role in a comprehensive understanding of NPF genes for low N tolerance in Setaria italica [21]. Thus, dissecting the three-dimensional (3D) information and molecular docking models of key genes for N uptake, transportation and assimilation is important for improving plant NUE.
Panax notoginseng is a perennial rhizomatous medicinal plant and is also an N-sensitive species in the Araliaceae family. The application of N fertilizer in P. notoginseng cultivation can be as high as 337.5-450 kg·ha-1·year-1, which is two times the amount of crops like Zea mays and O. sativa, and four to five times the amount of Nicotiana tabacum. Excessive N fertilizer not only reduces NUE and increases production costs, but also causes continuous cropping barrier, severe field diseases, and quality decline in P. notoginseng [22]. NUE is significantly increased in two- and three-year-old P. notoginseng grown under the N deficient condition, and high N application significantly inhibits N uptake and NUE, and reduces biomass accumulation [23, 24]. It is worth noting that GS, GDH, and NR activity in the N-deficient P. notoginseng are higher than those in N-surplus groups (450 kg·ha-1), and the expression levels of GS1, GDH1, NIR, NIA, and NPF are up-regulated under the N deficiency levels [22]. However, it is still unknown about the molecular mechanisms underlying the low N tolerance in P. notoginseng. Although N uptake and NUE has been preliminarily studied in P. notoginseng under N regimes [22, 24], the underlying reason for the N regulation of NUE remain largely undetermined.
In this study, N uptake and utilization indicators and N metabolism-related enzymes and genes were analyzed in two-year-old P. notoginseng grown under N0 (without N addition), N7.5 (112.5 kg·ha-1, mild N deficiency), and N15 (225 kg·ha-1, normal N) condition. Key genes for N assimilation in response to N deficiency, coupled with the multi-omics analysis, 3D information and molecular docking models, were further identified. A systematic investigation was conducted on the expression of the genes and residues related to N uptake, transport, assimilation, NO3- signal-sensing and transduction in the N-deficient plants. The present study would provide a valuable information for selecting candidate genes to improve NUE and further for investigating the function of N assimilation-related enzymes in the medicinal plants, such as P. notoginseng.
Results
The effect of N levels on Carbon(C) and N contents in P. notoginseng
N content of leaf and stem was significantly increased in the N15-treated plants (Table 1). There was no significant difference in N content between the N7.5 and N15 treatments, except for the stem (Table 1). C content in all tissues showed no significant difference among treatments (Table 1).
Tabel 1.
Effects of nitrogen levels on N and organic carbon (C) content in Panax notoginseng
| Variables | Different tissues | Nitrogen levels | ||
|---|---|---|---|---|
| N0 | N7.5 | N15 | ||
| Nitrogen content (%) | Taproot | 0.61 ± 0.02 b | 1.37 ± 0.01 a | 1.37 ± 0.01 a |
| Rhizome | 0.95 ± 0.07 b | 2.01 ± 0.02 a | 1.88 ± 0.04 a | |
| Fibrous root | 1.30 ± 0.03 b | 2.07 ± 0.05 a | 2.04 ± 0.02 a | |
| Stem | 0.59 ± 0.01 c | 1.01 ± 0.01 b | 1.09 ± 0.03 a | |
| Leaf | 1.52 ± 0.03 b | 2.42 ± 0.05 a | 2.52 ± 0.01 a | |
| Organic carbon content (%) | Taproot | 43.66 ± 0.17 a | 42.27 ± 0.90 a | 43.99 ± 0.26 a |
| Rhizome | 42.93 ± 0.43 a | 41.03 ± 0.55 a | 44.65 ± 2.48 a | |
| Fibrous root | 40.55 ± 0.35 a | 38.66 ± 0.60 a | 39.06 ± 1.21 a | |
| Stem | 35.18 ± 0.35 a | 35.96 ± 0.51 a | 36.48 ± 1.48 a | |
| Leaf | 41.24 ± 0.37 a | 42.38 ± 0.49 a | 42.80 ± 0.57 a | |
Different letters in the same row indicate significant difference (P < 0.05), values are means ± SD (n = 3)
Responses of N uptake and utilization to N regimes
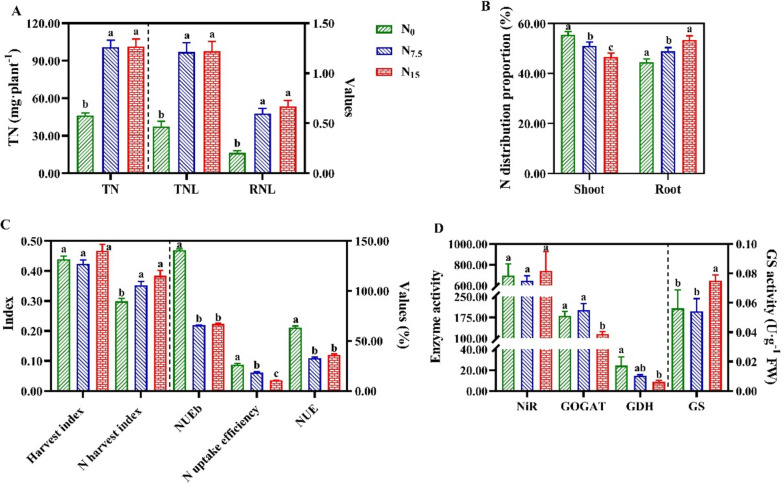
Total N uptake (TN), total N uptake per unit root length (TNL), and root N content per unit root length (RNL) were significantly decreased in the N0-grown plants compared with the N7.5- and N15-grown plants (Fig. 1A). A proportion of N distribution to shoot was decreased with increasing N supply, while the proportion of N distribution to root was increased (Fig. 1B). There was no significant difference in the harvest index among N regimes (Fig. 1C). The maximum values of N use efficiency in biomass production (NUEb), N uptake efficiency and NUE were recorded in the N0-grown plants (Fig. 1C). N partial factor productivity (NPFP) and N agronomic efficiency (NAE) were no significantly different between the N7.5 and N15 treatments (Table 2). N contribution rate (NCR) was significantly increased in the N15-treated plant, which the recovery of N fertilizer (RNF) was decreased (Table 2).
Fig. 1.
Effects of nitrogen levels on N uptake, use and N metabolism-related enzymes activity in Panax notoginseng. A TN is the total N uptake (mg·plant-1), TNL is the total N uptake per unit root length (mg·cm-1), RNL is the root N content per unit root length (mg·cm-1); B Proportion of N distribution to shoot and root (%); C Harvest index, N harvest index, NUEb is N use efficiency in biomass production (g·DW g-1·N), N uptake efficiency (kg·kg-1), NUE is the N use efficiency (kg·kg-1); D Nitrite reductase (NiR, μmol·h-1·g-1 FW), glutamine synthetase (GS, U·g-1 FW), glutamate synthetase (GOGAT, nmol Glu·min-1·g-1 FW), glutamate dehydrogenase (GDH, nmol·min-1·g-1 FW). Green represents N0, blue represents N7.5, red represents N15. Values for each point were means ± SD (n = 3). Significant differences are indicated by letters (ANOVA; P < 0.05)
Table 2.
Effects of N levels on N agronomic efficiency in P. notoginseng
| Variables | Nitrogen levels | ||
|---|---|---|---|
| N0 | N7.5 | N15 | |
| NPFP (kg·kg-1) | — | 8.86 ± 3.03 a | 4.88 ± 1.93 a |
| NAE (kg·kg-1) | — | 1.54 ± 3.46 a | 1.22 ± 2.15 a |
| NCR (%) | — | 4.31 ± 53.07 b | 10.34 ± 49.91 a |
| RNF (%) | — | 33.66 ± 8.72 a | 16.90 ± 4.86 b |
NPFP N partial productivity, NAE N agronomic efficiency, NCR N contribution rate, RNF Recovery of N fertilizer
Values followed by different letters are significantly different at P < 0.05
DIA-proteome quality control and differential protein analysis
A total of 53078 peptides and 8042 proteins were identified in the proteome (Figure S2A). The statistical analysis of the number of peptides per protein showed that most proteins had 1-5 or >10 peptide segments (Figure S2B). 7085, 3053, and 5902 proteins were annotated in the GO, KEGG KOG database among the 8042 proteins, respectively (Figure S3A). There were 65 up-regulated and 247 down-regulated proteins in the N0 vs N7.5 group, and 84 up-regulated and 269 down-regulated proteins in the N0 vs N15 group (|log2(1.5)| ≈ 0.58, Figure S3B). For GO enrichment analysis, The differentially expressed proteins were mainly annotated to processes such as "metabolic process", "cellular process", "cell part" and "response to stimulus" (Figure S4). KEGG pathway analysis revealed that the differentially expressed proteins in the N0 vs N7.5 and N0 vs N15 comparison groups were mainly enriched in metabolic pathways such as "biosynthesis of secondary metabolites "and "carotenoid biosynthesis", "N metabolism" (Figure S5). As shown in Figure S6, trend 1, trend 0, and trend 6 were the three largest clusters, with 270, 81, and 65 differentially expressed proteins, respectively. Trend 0 were significantly up-regulated under the N0 condition compared with the N7.5 and N15 conditions (Figure S6). The functions of Trend 0 mainly included pathways such as "metabolic pathways", "starch and sucrose metabolism", and "N metabolism" (Figure S7).
Responses of N uptake, transport, and assimilation to N regimes
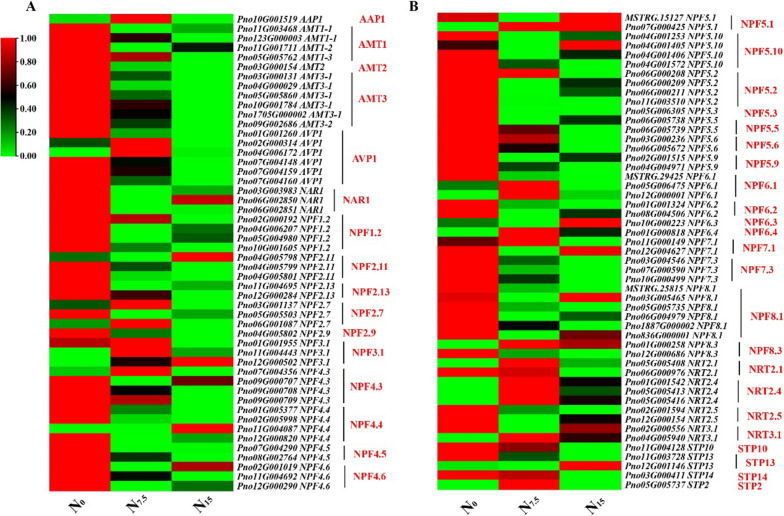
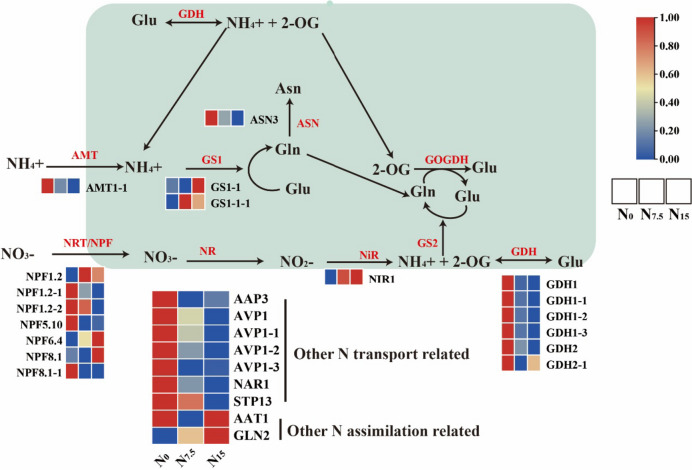
The expression of NH4+ transport-related genes AMT1-1, AMT1-2, AMT1-3, AMT2, AMT3-1, AMT3-2, AVR1 and protein AMT1-1 were up-regulated in the N0-grown plants compared with the N7.5- and N15-grown plants (Figs. 2 and 4). The expression of NO3- uptake and transport-related genes NPF1.2, NPF2.11, NPF2.13, NPF2.9, NFP4.5, NPF4.6, NPF5.2, NPF5.3, NPF5.5, NPF5.6, NPF5.9, NPF6.2, NPF7.3, NPF8.1, NRT2.5, STP10, STP14 and proteins NPF1.2, NPF5.10, NPF8.1, AAP3, AVP1, NAR1 and STP13 were significantly up-regulated under the N0 condition compared with the N7.5 and N15 conditions (Figs. 2 and 4). The expression of N uptake and transport-related genes were down-regulated in the N15-grown plants (Fig. 2). N assimilation-related genes (such as AAT1, ASN3, GDH1, and GS1-1) and proteins (such as GDH1, GDH2, ASN3 and AAT1) were up-regulated in the N0-grown plant compared with the N7.5- and N15-grown plants (Fig. 3), which protein GS and NiR were down-regulated (Fig. 4). The gene expression trends of AAT1, ASN3, GDH1, AMT2, AVP1, NPF1.2, NPF4.6, NPF8.1 and NPF 2.4 were verified by Real-time quantitative polymerase chain reaction (qRT-PCR) were consistent with the results of root RNA-seq data (Figures S8-S9).
Fig. 2.
Response of N uptake- and transport-related genes to N levels. Average genes intensity is color key scale according the scale in the middle upper part
Fig. 4.
Response of N uptake-, transport- and assimilation-related proteins to N levels. The pathway map was prepared by using KEGG PATHWAY Database. With each box, each column is different nitrogen treatment (from left to right: N0, N7.5 and N15) as shown in the middle upper part. Average proteins intensity is color key scale according the scale in the middle upper part
Fig. 3.
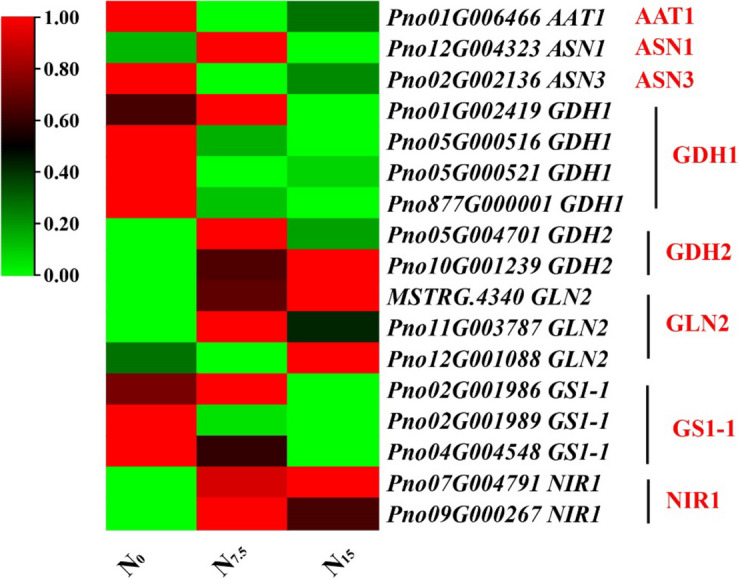
Response of N assimilation-related genes to N levels. Average genes intensity is color key scale according the scale in the middle upper part
Responses of N metabolism-related enzymes activity to N regimes
There was no significant difference in the activity of nitrite reductase (NiR) among N regimes (Fig. 1D). The maximum and minimum values of glutamine synthetase (GS) and glutamate synthetase (GOGAT) activity were recorded in the N15-grown plants, respectively (Fig. 1D). The activity of glutamate dehydrogenase (GDH) significantly decreased with increasing N supply (Fig. 1D).
Responses of NO3- signal-sensing and transduction to N regimes
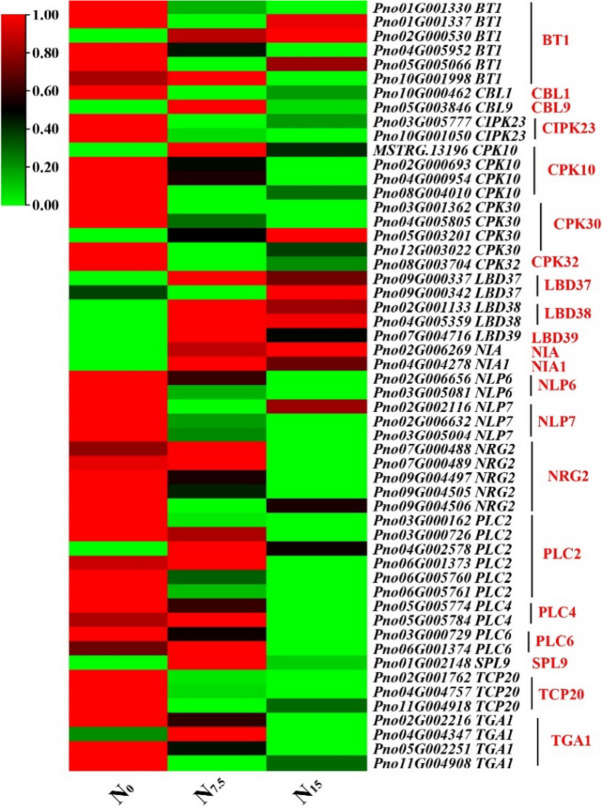
The expression of genes CBL9, CPK32, LBD37, LBD38, LBD32, NIA, NIA1 and SPL9 were significantly up-regulated in the N7.5-grown plants (Fig. 5). The expression of NO3- signal-sensing and transduction genes were down-regulated in the N0-grown plants compared with the N7.5- and N15-grown plants, including BT1, CBL1, CIPK23, CPK10, CPK30, NLP6, NLP7, NRG2, PLC2, PLC4, PLC6, TCP20, and TGA1, (Fig. 5). Meanwhile, the expression of proteins CIBK23, CBL1, PCL2, NLP6, BT1, and TCP20 were up-regulated in the N0-grown plants compared with the N7.5- and N15-grown plants (Fig. 6). 6 genes were selected for qRT-PCR verification. The expression trends of NO3- signal-sensing and transduction-related genes were consistent with the results of root RNA-seq data (Table S1, Figure S10).
Fig. 5.
Response of nitrate signal-sensing and transduction pathway-related genes to N levels. Average genes intensity is color key scale according the scale in the middle upper part
Fig. 6.
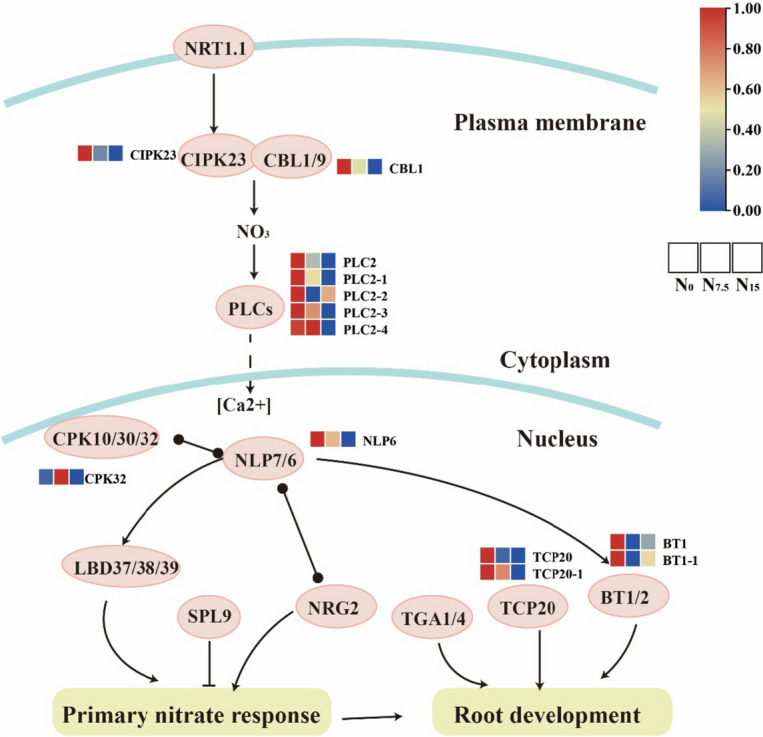
Response of nitrate signal-sensing and transduction pathway-related proteins to N levels. The pathway map was prepared by using KEGG PATHWAY Database. With each box, each column is different nitrogen treatment (from left to right: N0, N7.5 and N15) as shown in the middle upper part. Average proteins intensity is color key scale according the scale in the middle upper part
Combinatorial analysis of proteins and genes
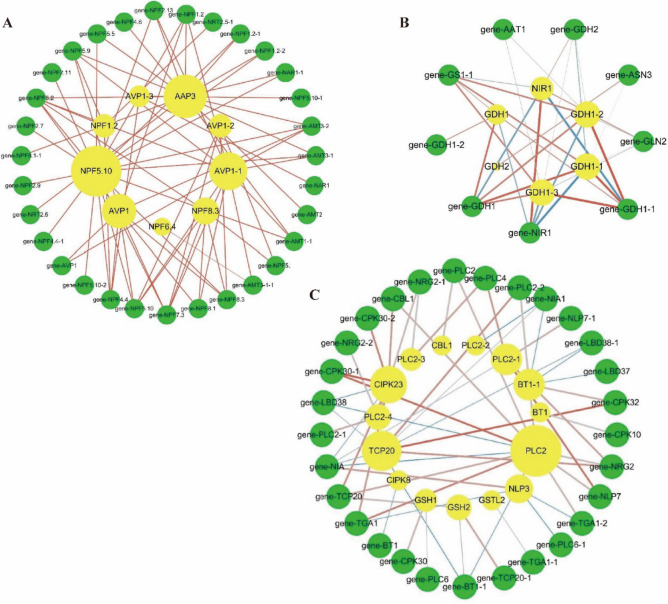
A network analysis of 31 genes and 9 proteins involved in N uptake and transport pathways was performed (Fig. 7A). Protein NPF5.10 (Pno04G001253), AVP1-1 (Pno02G000314), AVP1 (Pno01G001260), and AAP3 (Pno09G000064) were identified as interact with more than 10 genes (Fig. 7A). Network analysis of 9 genes and 6 proteins involved in N assimilation pathway was performed (Fig. 7B). Protein NIR1 (Pno07G004791) had a strong negative correlation with genes GDH1 (Pno05G000521) and GDH1-1 (Pno877G000001) (Fig. 7B). There was a strong positive correlation between protein GDH1 and gene GDH1 (Fig. 7B). 29 genes and 15 proteins were selected from the NO3- signal-sensing and transduction pathway for network analysis (Fig. 7C). There was a strong positive correlation between protein TCP20 and gene CPK32 (Pno08G003704). Gene CPK30-1 (Pno04G005805) was positively correlated with protein CIPK23 and PLC20 (Fig. 7C).
Fig. 7.
Co-expression analysis of key genes and proteins in the N uptake and transport pathway (A). Co-expression analysis of key genes and proteins in the N assimilation pathway (B). Co-expression analysis of key genes and proteins in the nitrate signal-sensing and transduction pathway (C). Yellow nodes represent proteins (larger sizes are associated with more genes), and green nodes indicates genes. Red edges represent positive correlations (PPC > 0.8) and blue edges represent negative correlations (correlations are stronger with thicker lines)
3D structure of the GS1 and GDH1 and their interaction with NH4+
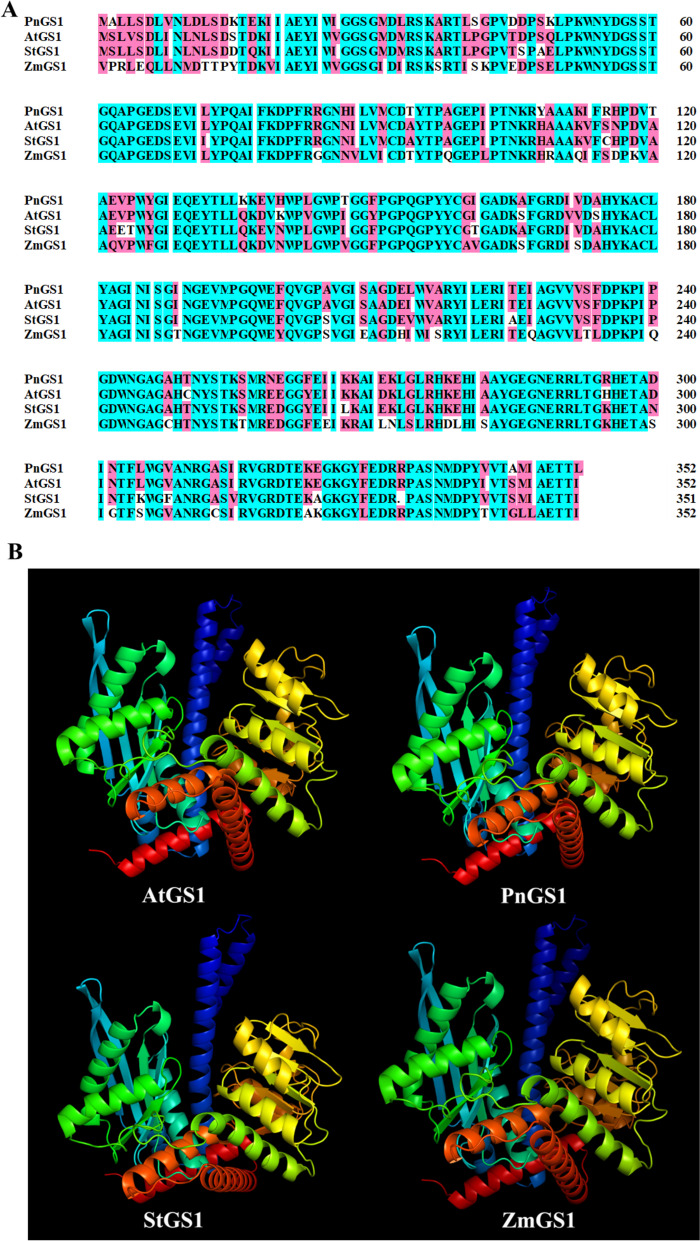
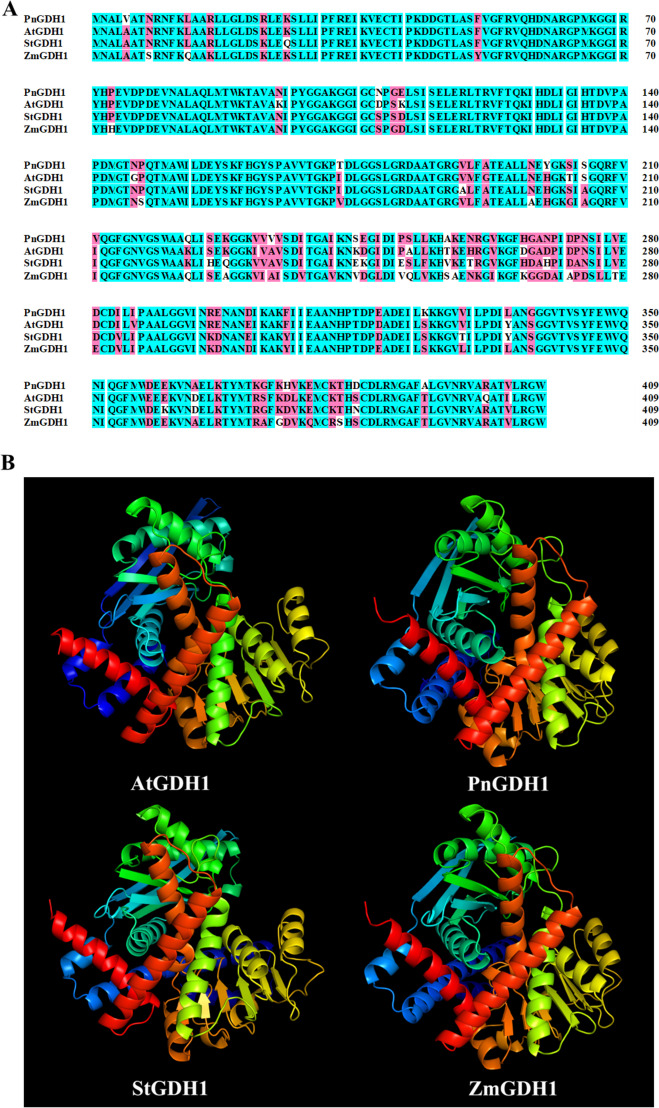
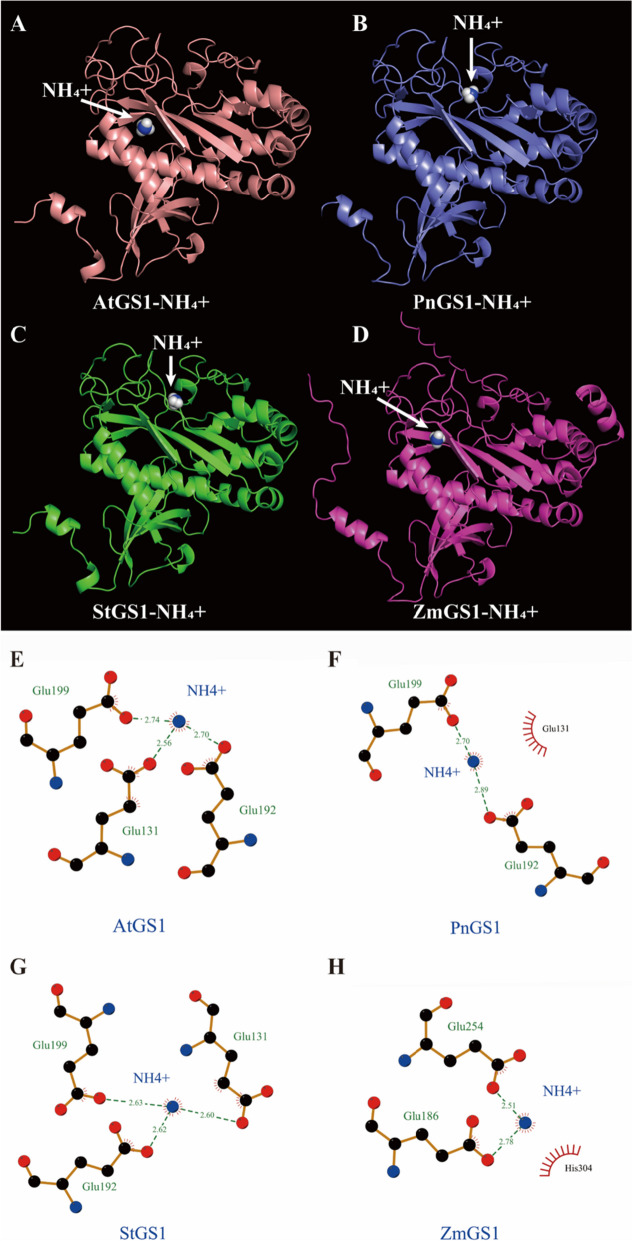
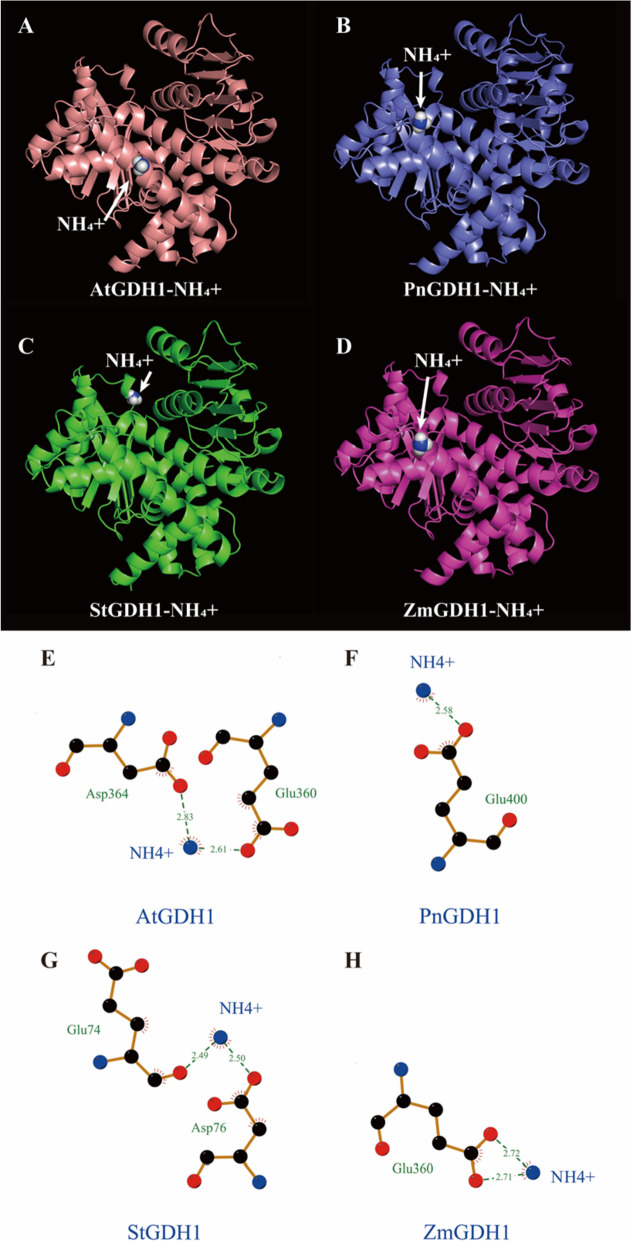
To identify the key amino acid residues in GS1 and GDH1 that affect the NUE and contribute to differences in enzyme activity in Z. mays, A. thaliana, Solanum tuberosum and P. notoginseng (Figs. 8B and 9B). 94.10%-99.02% of amino acids of GS1 and GDH1 were located in region where backbone dihedral angles were energetically favored, indicating that this predicted model of GS1 and GDH1 were high quality (Figure S11). As NH4+ is the major substrate of GS1 and GDH1, we evaluate the affinity of the GS1 and GDH1 with NH4+ by molecular docking (Figs. 10A-D; 11A-D). The docking sites of PnGS1 and StGS1 with NH4+ were similar (Figs. 10B, C; S12D). A total of 5 candidate amino acid residues (Glu199, Glu131, Glu192, Glu254 and Glu186) possibly involved in the reaction between NH4+ and AtGS1/StGS1/PnGS1/ZmGS1 were identified (Figs. 10E-H, S13; Table S2). The 2D PnGS1-NH4+ interaction analysis revealed that Glu192 and Glu199 directly binding to NH4+ (Fig. 10F). The docking sites of PnGDH1 and ZmGDH1 with NH4+ were comparable (Figs. 11B, D; S14B, D). A total of 6 candidate amino acid residues (Glu360, Asp364, Glu400, Glu74, Asp76 and Glu360) possibly involved in the reaction between NH4+ and AtGDH1/StGDH1/PnGDH1/ZmGDH1 were identified (Fig. 11E-H, Table S3). The 2D PnGDH1-NH4+ interaction analysis disclosed that Glu400 directly binding to NH4+ (Fig. 11F).
Fig. 8.
Amino acid sequence alignment and three-dimensional (3D) protein structure prediction of GS1 in Arabidopsis thaliana (AtGS1), P. notoginseng (PnGS1), Solanum tuberosum (StGS1) and Zea mays (ZmGS1). The AtGS1, PnGS1, StGS1 and AtGS1 nucleotide sequence was translated into protein sequence (A). Highly accurate protein structure prediction with AlphaFold2, save its PDB file and visualize it using PyMOL software, and the predicted 3D protein colored light purple is shown in cartoon representation (B)
Fig. 9.
Amino acid sequence alignment and 3D protein structure prediction of GDH1 in in A. thaliana (AtGDH1), P. notoginseng (PnGDH1), S. tuberosum (StGDH1) and Z. mays (ZmGDH1). The AtGDH1, PnGDH1, StGDH1 and AtGDH1 nucleotide sequence was translated into protein sequence (A). Highly accurate protein structure prediction with AlphaFold2, save its PDB file and visualize it using PyMOL software, and the predicted 3D protein colored light purple is shown in cartoon representation (B)
Fig. 10.
Binding model of GS1 to NH4+ by molecular docking. The 3D AtGS1-NH4+ interaction model (A). The 3D PnGS1-NH4+ interaction model (B). The 3D StGS1-NH4+ interaction model (C). The 3D ZmGS1-NH4+ interaction model (D). The 2D AtGS1-NH4+ interaction model (E). The 2D PnGS1-NH4+ interaction model (F). The 2D StGS1-NH4+ interaction model (G). The 2D ZmGS1-NH4+ interaction model (H). Dashed lines indicate a potential interaction between amino acid residues with NH4+. The black balls showed carbon atoms, the blue balls showed nitrogen atoms whereas the red balls showed the oxygen atoms. The residues involved in non-bonding interactions were shown as red bristles. The NH4+ had hydrophobic interactions with Glu131 and His304
Fig. 11.
Binding model of GDH1 to NH4+ by molecular docking. The 3D AtGDH1-NH4+ interaction model (A). The 3D PnGDH1-NH4+ interaction model (B). The 3D StGDH1-NH4+ interaction model (C). The 3D ZmGDH1-NH4+ interaction model (D). The 2D AtGDH1-NH4+ interaction model (E). The 2D PnGDH1-NH4+ interaction model (F). The 2D StGDH1-NH4+ interaction model (G). The 2D ZmGDH1-NH4+ interaction model (H). Dashed lines indicate a potential interaction between amino acid residues with NH4+. The black balls showed carbon atoms, the blue balls showed nitrogen atoms whereas the red balls showed the oxygen atoms. The residues involved in non-bonding interactions were shown as red bristles
Discussion
N deficiency reduces the occupation of N in root
An enhancement of N uptake efficiency and N use efficiency is a primary strategy to improve N efficiency [25]. The ability of plants to absorb N would be obviously weakened under the low N condition [26]. N uptake considerably affects N use efficiency [27]. Herein, N deficiency enhances NUE, NUEb and RNF (Fig. 1A, C; Table 2), and the proportion of N distribution to root was decreased. These results further confirm that the higher NUE under the low N might be closely linked to the occupation of N by root [28]. The RNL is commonly used to reflect the occupation of N by roots [29]. Our results demonstrated that N deficiency significantly reduces the occupation of N in roots (Fig. 1). It is worth noting that the proportion of N distribution to shoot was increased (Fig. 1B). We speculate that the limited N absorbed by the roots might be more extensively transported to the above-ground parts to maintain the survival under the N-deficient condition [26]. Overall, N deficiency reduces the occupation of N in root and thus changes NUE.
Low N promotes the efficiency of N uptake and transportation
The uptake of NO3- is mainly mediated by NO3- transport proteins (NRT/NFP) [9, 30]. NPF8.1, NPF4.6, and NRT2 family (the latter referring to NRT2.1, NRT2.2, NRT2.4, and NRT2.5) promote the uptake of NO3- in A. thaliana and Panicum miliaceum grown under the N-deficient condition [31, 32]. N deficiency enhances the expression of NO3- transporters genes (NPF8.1, NRT2.5, NRT2.1 and NRT2.2) (Fig. 2). It has been recorded that AtAVP1 over-expression has been demonstrated to enhance the expression of NRT2.1 and biomass accumulation in Romaine lettuce [33]. NO3- uptake-related genes (as referred to AVP1, NAR1, NPF2.11, NPF2.13, NPF4.3, NPF4.5, and NFP5) were up-regulated in the N-deficient plants (Fig. 2). Interestingly, a significant positive correlation between gene NRT2.5 and protein NPF5.10 and AVP1 was observed (Fig. 7). These results suggest that the uptake of NO3- is closely related to the increased expression levels of NO3- uptake-related genes and proteins under the N-deficient condition. Furthermore, the uptake of NH4+ is mainly mediated by NH4+ transport proteins AMT [9]. The up-regulation expression of OsAMT1.1 and OsAMT1.2 considerably increase NH4+ uptake and significantly improve NUE in the N-deficient O. sativa [34, 35]. In the present study, N deficiency increases the uptake of NH4+ by up-regulating AMT (Figs. 2 and 4). Furthermore, N deficiency up-regulated the expression of gene NPF1.2 related to NO3- transport from roots to shoots, but protein NPF1.2 expression was down-regulated. (Figs. 2 and 4) [36, 37]. In response to the inconsistency between mRNA and protein level, we speculate that NPF1.2 may have different post-translational modification states before and after N application [38]. In summary, NPF8.1, NPF4.6, AMT, AVP and NRT2 family genes play an important role in improving N uptake and transportation under the N-deficient condition.
The roles of Glu192, Glu199 and Glu400 in the N assimilation
N assimilation is a core process for N utilization in plants [39]. NUE can be enhanced by the expression of N assimilation-related gene OsNiR in the N-deficient O. sativa [40]. NiR enzyme activity was not significantly different among N regimes (Fig. 1D), but the expression of gene NIR1 and protein NIR1 up-regulated with increasing N supply (Figs. 3, 4 and 7B). Our results revealed that N supply might promote an increase in NiR quantity, but the structure and composition of NiR did not cause a change in the activity of nitrite (NO2-) being reduced to NH4+ under N regimes [27, 41]. Additionally, GS1-1 is the dominant gene induced by low N to synthesis NH4+ and glutamine into glutamate [42]. OsGS1;2 and DvGS1/2 over-expression has been shown to enhance the total protein content, NUE and biomass accumulation in the N-deficient plants [12–14]. We speculate that the expression of GS1-1 contributes to the synthesis of glutamate in the N-deficient plants as demonstrated by a number of investigation (Fig. 3) [43]. The expression of gene ASN3 and protein ASN3 were up-regulated in the N-deficient P. notoginseng and Lactuca sativa, indicating that more NH4+ is synthesized into amino acids (Figs. 3 and 4) [44]. A number of studies has demonstrated that the activity of GDH enzyme is increased under the low N condition [45–47]. In the present study, N deficiency up-regulates the expression and activity GDH, and there was a significantly positive correlation between protein GDH1 and gene GDH1 (Fig. 7B). N mediate post-translational phosphorylation modifications of GDH2, resulting in an inconsistent change at the gene and protein levels (Figs. 3 and 4) [48]. These results indicate that GDH1 might play an important role in response to N deficiency. As such, gene GS1-1 and protein GDH1 are suggested as the prospective key genes regulating the N deficiency-driven enhancement of N assimilation, and they contribute to the improvement of NUE under the low N condition.
The method of molecular docking is popular to study the biological activity of N affecting plant NUE [21]. PnGS1-NH4+ interaction analysis revealed that Glu192 and Glu199 were strictly conserved and located around the middle of the catalytic pocket (Fig. 10). Similar results have been reported in A. thaliana, Z. mays and Medicago truncatula GS proteins [49]. The strictly conserved amino acids Glu192 and Glu199 of GS in M. truncatula are positioned approximately in the middle of cavity, favorably located to mediate cation coordination [50, 51]. The gene expression of GS1 were up-regulated in the N0-grown plants (Fig. 3). We speculate that N deficiency induces the conserved residues Glu199 and Glu192 to bind more NH4+, consequently catalysing the synthesis of more glutamine from glutamate. Additionally, site-directed mutagenesis and 3D structure determination of glucoamylase has identified Glu400 as the general base catalyst, which is conducive to the synthesis of more amino acids [52, 53]. PnGDH1-NH4+ interaction analysis revealed that Glu400 directly binds to NH4+ (Fig. 11), and the expression and activity of GDH1 were up-regulated in the N0-treated plants (Figs. 1, 3 and 4). These results suggest that the high expression of GDH1 enhances the docking ability of Glu400 to NH4+ and promotes the synthesis of glutamate in the N-deficient plants. Similarly, the residues of conserved proline and T101 significantly enhance NO3- transport activity and NUE in the N-deficient A. thaliana [20]. Therefore, N deficiency induces Glu residues (as referred to Glu192, Glu199 and Glu400) to enhance the biological activity of GS1 and GDH1, thereby improving N assimilation. A review of previous studies on usea-urease docking complexes has suggested that different species (as reflected by Glycine max and M. truncatula) could share common interacting residues as well as may have some other uncommon residues at species-dependent way [54]. In the present study, Glu192 and Glu199 in P. notoginseng and S. tuberosum were identified as hotspot residues residing in GS1 (Figs. 10, S12). We speculate that the preference for NO3- is the main reason for the similar GS1 activity in the rhizomatous species P. notoginseng and S. tuberosum. Overall, the residues of Glu192, Glu199 and Glu400 are suggested as the prospective key hotspot residues regulating the N deficiency-driven enhancement of N assimilation in the rhizomatous species.
N deficiency induces NO3- signal-sensing and transduction
NO3- would regulate plant N uptake through signal transduction, thereby changing NUE [55]. The NO3- signal-sensing and transduction is regulated by the interaction of NRT1.1 and CIPK, in which gene CIPK23 specifically promotes NRT1.1 phosphorylation under the N deficiency condition, thus promoting high-affinity response [20]. N deficiency induces the sensing of NO3- signal by up-regulating gene CIPK23 and protein CIPK23 expression (Figs. 5 and 6). NO3- signals trigger downstream NO3- responses through calcium (Ca2+) -dependent and Ca2+-independent pathways, and the accumulation of Ca2+ requires the accumulation of phospholipase C (PLC) [55]. The upregulation of PLC-related genes and proteins in this study supports the view that N deficiency promotes the transduction of NO3- signal (Figs. 5 and 6, S10). Meanwhile, NLP6/7 (the main regulatory factor for primary NO3- response) and numerous transcription factors (LBD37/38/39, NRG2, TGA1/4, TCP20, and BT1/2) positively regulate the primary NO3- responses under the N-deficient condition [16, 55–57]. Proteins NLP6, TCP20, BT1, and genes NLP6, NLP7, LBD37, NRG2, TCP20, BT1 were generally up-regulated in the N0-grown plants (Figs. 5 and 6). These results indicate that the NO3- signal-sensing and transduction are enhanced in P. notoginseng under the N-deficient condition.
Conclusion
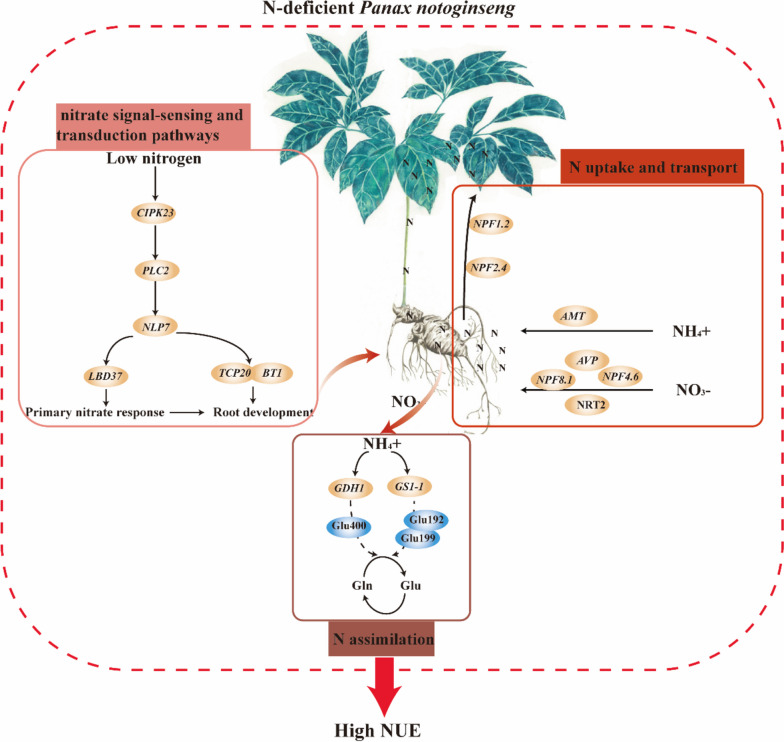
We have proposed a hypothetical genetic regulatory network (Fig. 12), and have suggested that N deficiency promotes the expression of key genes involved in N uptake, transport, assimilation, signaling and transduction, and thus enhance NUE in the rhizomatous medicinal plant P. notoginseng. NPF8.1, NPF4.6, AMT, AVP and NRT2 family genes might be considered as the key genes regulating the N deficiency-promoted N uptake. The genes of NPF1.2 and NRT2.4 might mediate N deficiency-induced N transport from roots to shoots. N deficiency would induce the residues of Glu192, Glu199 and Glu400 to enhance the biological activity and expression of GS1 and GDH1, thereby improving N assimilation. The expression of genes CIPK23, PLC2, NLP6, TCP20, and BT1, contributes to NO3- signal-sensing and transduction under the N-deficient condition. In summary, the genes and residues proposed as being involved in N metabolism would provide excellent candidates for further genetic improvement in the NUE of rhizomatous medicinal plants.
Fig. 12.
A regulatory mechanism of N deficiency-driven enhancement of NUE has been proposed in the rhizomatous species P. notoginseng
Materials and methods
Experiment design
A potted experiment was conducted from January to November 2021 in Kunming, Yunnan Province, southwestern China (longitude 102°45', latitude 25°08'). Seedlings were harvested from the plants of 1-year-old P. notoginseng (Burk.) F. H. Chen. that were cultivated at the experimental farm of Wenshan Miao Xiang P. notoginseng Industrial Co., Ltd., China. Healthy rhizome of P. notoginseng were selected in our experiments and transplanted to a plastic pot (35×40 cm) on January 2021. The pot experiment was conducted in a controlled environment growth chamber with a light intensity of about 10% [58]. The physicochemical properties of the soil are shown as following: pH 6.02, organic matter 11.04 g·kg-1, hydrolysable N 54.58 mg·kg-1, available phosphorus (P) 0.46 mg·kg-1, available potassium (K) 36.67 mg·kg-1, total N 0.10%, total phosphorus 0.10%, total potassium 0.79 g·kg-1.
In the present study, a completely randomized design was used with three replicates for each treatment, including three N addition levels (Figure S1): (i) without N addition (without N addition), N0; (ii) 112.5 kg·N·ha-1 (mild N deficiency), N7.5; (iii) 225 kg·N·ha-1 (normal N), N15. Each replicate consisted of 40 pots. In addition to N fertilizer, the application levels of phosphorus fertilizer (225 kg·P2O5·ha-1) and potassium fertilizer (450 kg·K2O·ha-1) were the same for all treatments. The fertilizers applied in the study were compound fertilizer (N:P:K = 32:4:0), calcium superphosphate (N:P:K = 0:52:34), and potassium sulfate (N:P:K = 0:0:52). Fertilization was applied four times in mid-May, June, July, and mid-August 2021. Conventional pesticides were used to control weeds, diseases, and pests. In November 2021, roots were collected under different N treatments, washed, and then flash-frozen in liquid N and stored at -80°C for transcriptome and metabolome analyse.
Determination of C and N content
Plant was separated into taproot, rhizome, fibrous roots, stem and leaf. The taproot, rhizome, fibrous roots, stem and leaf were dried at 60℃ to constant weight for 96 h. Dry matter was determined. The dried samples were ground and passed through a 100-mesh sieve for further analysis. The C and N content were determined using an elemental analyzer (Vario EL III; Elementar analysisysteme GmbH Hanau, Germany).
Calculation of N use efficiency
Based on biomass and N content, N uptake and utilization related parameters were calculated as described by Gupta et al. [59]: Total N uptake (TN, mg·plant-1) = above-ground N content + below-ground N content; Total N uptake per unit root length (TNL, mg·cm-1) = total N uptake per plant / total root length per plant; Root N content per unit root length (RNL, mg·cm-1) = Root N content / total root length per plant; Proportion of N distribution to shoot (%) = above-ground N content / total N uptake; Proportion of N distribution to root (%) = root N content / total N uptake; N use efficiency (NUE, kg·kg-1) = yield (below-ground dry weight) / total N uptake; N agronomic efficiency (NAE, kg·kg-1) = (yield with N application – yield without N application) / N application rate; Recovery of N fertilizer (RNF, %) = (above-ground N content with N application – above-ground N content without N application)/N application rate × 100; N contribution rate (NCR, %) = (yield with N application – yield without N application) / yield with N application × 100; N partial factor productivity (NPFP, kg·kg-1) = yield with N application / N application rate; N use efficiency in biomass production (NUEb, g·DW·g-1·N) = below-ground dry matter accumulation per plant / below-ground N accumulation per plant; Harvest index = root dry weight at harvest / plant dry weight at harvest; N harvest index = N uptake in roots at harvest / total N accumulation per plant; N uptake efficiency (kg·kg-1) = total N uptake per plant / N application rate.
Determination of enzyme activity
The activity of N metabolism-related enzymes was assayed according to Li [60]. The measurement of the activity of NiR (G0408F), NADH-GOGAT (G0403F), GS (G0401F), and NADH-GDH (G0405F) were carried out by kits from Suzhou Gores Biotechnology Co., Ltd.
RNA-Seq and annotation
The experimental process of transcriptome sequencing includes RNA extraction, RNA quality detection, library construction, and sequencing. Firstly, total RNA was extracted from the roots of P. notoginseng. The integrity of the sample RNA and the presence of DNA contamination were examined using an RNase-free agarose gel electrophoresis. Then, enriched mRNA fragments were fragmented into short fragments using a fragmentation buffer, and reverse transcribed into cDNA using Illumina's NEBNext Ultra RNA Library Prep Kit (NEB#7530, New England Biolabs, Ipswich, MA, USA). The purified double-stranded cDNA was end-repaired, A-tailed, and ligated with sequencing adapters. 200 bp cDNA was selected using AMPure XP beads, PCR amplified, and purified with AMPure XP beads again to obtain the library. Guangzhou Genedenovo Biotechnology Co., Ltd. sequenced the obtained cDNA library on the Illumina Novaseq6000 platform. Finally, 9 cDNA libraries representing three replicates and three N levels were constructed, and the transcriptome was sequenced on the Illumina Hiseq platform using P. notoginseng genome (PRJNA608068; http://herbalplant.ynau.edu.cn/) as the reference genome [61]. After obtaining the gene expression levels for each sample, differentially expressed genes (DEGs) among samples were analyzed. The input data for gene differential expression analysis were the reads count data obtained in the gene expression level analysis, and DESeq2 software was used for analysis. Based on the differential analysis results, genes with FDR (false discovery rate) < 0.05 and |log2FC| > 1were defined as significantly differentially expressed genes [62, 63]. After selecting differentially expressed genes according to the analysis purpose, a clustering heat map of different samples was generated for functional annotation, enrichment analysis, trend analysis, and other analyses of DEGs.
Determination and analysis of data-independent acquisition (DIA) proteomics
In November 2021, samples grown under different N treatments were collected and immediately washed, frozen in liquid N, and stored at -80℃ for DIA protein profiling analysis. DIA protein profiling analysis included processes such as protein extraction, denaturation, reduction, alkylation, enzymatic digestion, and desalting of peptides. The tissue samples were pre-processed using the iST sample pre-processing kit (PreOmics, Germany). After grinding the samples in liquid N, an appropriate amount of sample was taken and added to 50 µL of lysis buffer. The mixture was then heated at 95℃ with 1000 rpm for 10 min. After cooling to room temperature, the sample was incubated with trypsin digestion buffer at 37℃ and 500 rpm for 2 h. The reaction was then stopped by adding the stop buffer. Peptide desalting was carried out using the iST cartridge provided in the kit, with 2 × 100 µL wash buffer for elution. The eluted peptides were vacuum-dried and stored at -80℃. For analysis, each sample was mixed with 30 µL of solvent A (A: 0.1% formic acid aqueous solution) to form a suspension, and 9 µL of the mixture was taken and mixed with 1 µL of 10 × iRT peptides. The mixture was then separated using nano-LC and analyzed using online electrospray ionization tandem mass spectrometry. Before mass spectrometry detection, Biognosys iRT Kit was added to each sample as a quality control reagent, and the retention time (RT) of peptides in chromatography was calibrated using the QuiC (Biognosys) [64] software for quality control of the raw mass spectrometry data. The Pulsar [65] software was then used to build a database and analyze the DIA data results based on the DDA reference database to identify proteins. Qualitative results and quantitative results in all samples were output when a protein was detected.
The detected protein group was annotated using the GO, KEGG, and KOG databases [66], and the annotation results were statistically analyzed. Based on the expression results of each sample, PCA analysis was used to analyze and calculate the Pearson correlation coefficient between samples to understand the repeatability of the samples and help exclude outliers. Subsequently, proteins with significant differences between groups were selected based on the absolute value of FC greater than 1.5 (|log2(1.5)| ≈ 0.58, P < 0.05), and the differentially expressed proteins were subjected to GO, KEGG, GSEA, interaction network, and trend analysis.
Combined transcriptome and proteome analysis
Differently expressed genes and differentially expressed proteins are analyzed in combination The KEGG pathway was mapped to genes and proteins with changed transcriptomics and proteomics, and histograms were produced to show pathway enrichment with differential proteins and genes. Correlation analysis was performed for DEGs and proteins in each group. Pearson’s correlation coefficients (PCCs) were determined using the Cor tool in R (www.r-project.org). Genes and proteins with a |PPC| > 0.80 were created a network diagram to show correlation.
Sequence alignment and molecular docking
Full-length amino acid sequences of Z. mays, A. thaliana and S. tuberosum were downloaded from NCBI database (https://www.ncbi.nlm.nih.gov/). Multiple sequence alignment of GS1 and GDH1 in P. notoginseng, Z. mays, A. thaliana and S. tuberosum, respectively (Figs 8A and 9A). Multiple sequence alignment was visualized using DNAMAN software. 3D structure of the GS1 and GDH1 in P. notoginseng, Z. mays, A. thaliana and S. tuberosum were predicted using the AlpaFold2 software [67] following the instructions on the website https://github.com/deepmind/alphafold (Figs 8B and 9B). The protein model of GS1 and GDH1 were docked with NH4+ by AutoDock4 [68]. All model were visualized by PyMOL (http://www.pymol.org/) and Ligplot 2.2.4 [69]. The molecular docking figures were drawn by ourselves.
qRT-PCR verification
qRT-PCR was performed according to the method described by Xiong et al. [70]. YLS8 was used as the reference gene [22]. Primers of qRT-PCR are listed in Table S1. Three replicates were performed for each gene and sample. Results were calculated using the formula 2-ΔΔCt.
Statistical analysis
GraphPad Prism 8 (GraphPad Software Inc. USA) and IBM SPSS Statistics 20.0 (IBM Corp. USA) was used for statistical analyses. One-way analysis of variance (ANOVA) test was performed to compare the differences between N regimes. The integrative analysis was performed using the R software, and the co-expression networks were visualized using the Cytoscape (version 3.7.1).
Supplementary Information
Additional file 1: Figure S1. Panax notoginseng pot culture under different nitrogen (N) levels, cited from our research group (Cun et al., 2022). Figure S2. Protein (A) and peptide (B) identification. Figure S3. Annotated Venn diagrams of GO, KEGG, and KOG databases (A), comparison of differentially expressed proteins among N0, N7.5 and N15 (B). Red represents the up-regulated proteins, green represents the up-regulated proteins. Figure S4. GO analysis of differentially expressed proteins from two comparation group. (A) N0 vs N7.5, (B) N0 vs N15. Red represents the up-regulated proteins, green represents the down-regulated proteins. Figure S5. KEGG enrichment analysis for differentially expressed proteins. (A) N0 vs N7.5, (B) N0 vs N15. Red represents the up-regulated proteins, blue represents the down-regulated proteins. Figure S6. Cluster of proteins expression patterns in response to N regimes. Figure S7. Enrichment of functional categories of each cluster with the significantly enriched KEGG pathways plotted for differentially expressed proteins among N regimes. Figure S8. Real-time quantitative polymerase chain reaction (qRT-PCR) validation of key genes involved in N uptake and transport in P. notoginseng. The left Y-axis and histogram are candidate genes expression obtained via qRT-PCR, the right Y-axis and red line are gene expression level calculated as FPKM value. The relative expression obtained from real-time PCR calculated by 2−△△Ct method. Values for histogram were means ± SD (n = 3), and significant differences are indicated by letters (ANOVA; P < 0.05). The value of each red dot is the average of three biological replicates (n = 3). Figure S9. qRT-PCR validation of key genes involved in N assimilation in P. notoginseng by RNA-seq. The left Y-axis and histogram are candidate genes expression obtained via qRT-PCR, the right Y-axis and red line are gene expression level calculated as FPKM value. The relative expression obtained from real-time PCR calculated by 2−△△Ct method. Values for histogram were means ± SD (n = 3), and significant differences are indicated by letters (ANOVA; P < 0.05). The value of each red dot is the average of three biological replicates (n = 3). Figure S10. qRT-PCR validation of key genes involved in nitrate signal-sensing and transduction in P. notoginseng by RNA-seq. The left Y-axis and histogram are candidate genes expression obtained via qRT-PCR, the right Y-axis and red line are gene expression level calculated as FPKM value. The relative expression obtained from real-time PCR calculated by 2−△△Ct method. Values for histogram were means ± SD (n = 3), and significant differences are indicated by letters (ANOVA; P < 0.05). The value of each red dot is the average of three biological replicates (n = 3). Figure S11. The ramachandran plot paragraph of GS1 and GDH1. Arabidopsis thaliana (AtGS1, A), Panax notoginseng (PnGS1, B), Solanum tuberosum (StGS1, C), Zea mays (ZmGS1, D), AtGDH1 (E), PnGDH1 (F), StGDH1 (G) and AtGDH1 (H). Figure S12. Comparison of GS1-NH4+ interaction models among different species. PnGS1/AtGS1-NH4+ (A); PnGS1/StGS1-NH4+ (B); PnGS1/ZmGS1-NH4+ (C); PnGS1/AtGS1/StGS1/ZmGS1-NH4+ (D). The bule indicated PnGS1-NH4+ interaction models. White arrows represent NH4+ ligands that bind to PnGS1. Figure S13. Protein-ligand interaction plot of NH4+ bound to AtGS1 (A), PnGS1 (B), StGS1 (C) and ZmGS1 (D). The stick indicated the amino acid residue that interacts with the NH4+ at a distance of 4Å, and hydrophobic bonds were formed between the amino acid residues and the ligand. Figure S14. Comparison of GDH1-NH4+ interaction models among different species. PnGDH1/AtGDH1-NH4+ (A); PnGDH1/StGDH1-NH4+ (B); PnGDH1/ZmGDH1-NH4+ (C); PnGDH1/AtGDH1/StGDH1/ZmGDH1-NH4+ (D). The bule indicated PnGDH1-NH4+ interaction models. White arrows represent NH4+ ligands that bind to PnGDH1. Figure S15. Protein-ligand interaction plot of NH4+ bound to AtGDH1 (A), PnGDH1 (B), StGDH1 (C) and ZmGDH1 (D). The stick indicated the amino acid residue that interacts with the NH4+ at a distance of 4Å, and hydrophobic bonds were formed between the amino acid residues and the ligand.
Additional file 2: Tabel S1. List of primers used in qRT-PCR analysis.
Additional file 3: Tabel S2. Comparison of amino acid residue sites in docking different GS1-NH4+ models.
Additional file 4: Tabel S3. Comparison of amino acid residue sites in docking different GDH1-NH4+ models.
Acknowledgements
Not applicable in this study.
Abbreviations
- 3D
Three-dimensional
- DEGs
Differentially expressed genes
- DIA
Data-independent acquisition
- FC
Fold change
- FDR
False discovery rate
- GDH
Glutamate dehydrogenase
- GOGAT
Glutamate synthetase
- GS
Glutamine synthetase
- HATS
High-affinity transport system
- LATS
Low-affinity transport system
- N
Nitrogen
- NAE
N agronomic efficiency
- NCR
N contribution rate
- NH4+
Ammonium
- NiR
Nitrite reductase
- NO3-
Nitrate
- NPFP
N partial factor productivity
- NUE
N use efficiency
- NUEb
N use efficiency in biomass production
- PCCs
Pearson’s correlation coefficients
- PLC
Phospholipase C
- qRT-PCR
Real-time quantitative reverse transcription
- RNF
Recovery of N fertilizer
- RNL
Root N content per unit root length
- TN
Total N uptake
- TNL
Total N uptake per unit root length
Authors’ contributions
JWC conceived and designed the study. ZC analysed the data and written the paper. XL, JYZ and JH analysed the data and corrected the manuscript. JY, LLG and SYM participated in the construction of shade-house and pot experiments. All authors agree to the publication of this article.
Funding
This research was supported by the National Natural Science Foundation of China (32160248 and 81860676), the Major Special Science and Technology Project of Yunnan Province (202102AA310048), the National Key Research and Development Plan of China (2021YFD1601003), and the Innovative Research Team of Science and Technology in Yunnan Province (202105AE160016).
Availability of data and materials
All data generated or analysed during this study are included in this published article and its supplementary information files. The raw RNA-Seq data from this study have been deposited into the NCBI BioProject with the accession number PRJNA997624 (https://www.ncbi.nlm.nih.gov/sra/PRJNA997624). The molecular docking figures were drawn by ourselves.
Declarations
Competing interests
The authors declare no competing interests.
Ethics approval and consent to participate
Permission (ref: 232046) is granted by the Copyright holder: Kanehisa Laboratories to BMC Plant Biology of Springer Nature Ltd to publish both in print and digital under the CC BY 4.0 open access license the KEGG pathway map images in this article written by Zhu Cun and Jun-Wen Chen and colleagues.
Consent for publication
Not applicable in this study.
Competing interest
The authors declare that the research was conducted in the absence of any commercial or financial relationships that could be construed as a potential conflict of interest.
Footnotes
Publisher’s Note
Springer Nature remains neutral with regard to jurisdictional claims in published maps and institutional affiliations.
References
- 1.Schroeder JI, Delhaize E, Frommer WB, Guerinot ML, Harrison MJ, Herrera-Estrella L, Horie T, Kochian LV, Munns R, Nishizawa NK, Tsay YF, Sanders D. Using membrane transporters to improve crops for sustainable food production. Nature. 2013;497(7447):60–6. doi: 10.1038/nature11909. [DOI] [PMC free article] [PubMed] [Google Scholar]
- 2.Good AG, Beatty PH. Fertilizing nature: a tragedy of excess in the commons. PLoS Biol. 2011;9(8):e1001124. doi: 10.1371/journal.pbio.1001124. [DOI] [PMC free article] [PubMed] [Google Scholar]
- 3.Kant S, Bi YM, Rothstein SJ. Understanding plant response to nitrogen limitation for the improvement of crop nitrogen use efficiency. J Exp Bot. 2011;62(4):1499–509. doi: 10.1093/jxb/erq297. [DOI] [PubMed] [Google Scholar]
- 4.Gutiérrez RA. Systems biology for enhanced plant nitrogen nutrition. Science. 2012;336(6089):1673–5. doi: 10.1126/science.1217620. [DOI] [PubMed] [Google Scholar]
- 5.Zhang D, Yang K, Kan Z, Dang H, Feng S, Yang Y, Li L, Hou N, Xu L, Wang X, Malnoy M, Ma F, Hao Y, Guan Q. The regulatory module MdBT2-MdMYB88/MdMYB124-MdNRTs regulates nitrogen usage in apple. Plant Physiol. 2021;185(4):1924–1942. doi: 10.1093/plphys/kiaa118. [DOI] [PMC free article] [PubMed] [Google Scholar]
- 6.Masclaux-Daubresse C, Daniel-Vedele F, Dechorgnat J, Chardon F, Gaufichon L, Suzuki A. Nitrogen uptake, assimilation and remobilization in plants: challenges for sustainable and productive agriculture. Ann Bot. 2010;105(7):1141–57. doi: 10.1093/aob/mcq028. [DOI] [PMC free article] [PubMed] [Google Scholar]
- 7.Laugier E, Bouguyon E, Mauriès A, Tillard P, Gojon A, Lejay L. Regulation of high-affinity nitrate uptake in roots of Arabidopsis depends predominantly on posttranscriptional control of the NRT2.1/NAR2.1 transport system. Plant Physiol. 2012;158(2):1067–78. doi: 10.1104/pp.111.188532. [DOI] [PMC free article] [PubMed] [Google Scholar]
- 8.Parker JL, Newstead S. Molecular basis of nitrate uptake by the plant nitrate transporter NRT1.1. Nature. 2014;507(7490):68–72. doi: 10.1038/nature13116. [DOI] [PMC free article] [PubMed] [Google Scholar]
- 9.Goel P, Singh AK. Abiotic stresses downregulate key genes involved in nitrogen uptake and assimilation in Brassica juncea L. PLoS One. 2015;10(11):e0143645. doi: 10.1371/journal.pone.0143645. [DOI] [PMC free article] [PubMed] [Google Scholar]
- 10.Chen J, Zhang Y, Tan Y, Zhang M, Zhu L, Xu G, Fan X. Agronomic nitrogen-use efficiency of rice can be increased by driving OsNRT2.1 expression with the OsNAR2.1 promoter. Plant Biotechnol J. 2016;14(8):1705–15. doi: 10.1111/pbi.12531. [DOI] [PMC free article] [PubMed] [Google Scholar]
- 11.Fan X, Tang Z, Tan Y, Zhang Y, Luo B, Yang M, Lian X, Shen Q, Miller AJ, Xu G. Overexpression of a pH-sensitive nitrate transporter in rice increases crop yields. PNAS. 2016;113(26):7118–23. doi: 10.1073/pnas.1525184113. [DOI] [PMC free article] [PubMed] [Google Scholar]
- 12.Brauer EK, Rochon A, Bi YM, Bozzo GG, Rothstein SJ, Shelp BJ. Reappraisal of nitrogen use efficiency in rice overexpressing glutamine synthetase1. Physiol Plant. 2011;141(4):361–72. doi: 10.1111/j.1399-3054.2011.01443.x. [DOI] [PubMed] [Google Scholar]
- 13.Zhu C, Fan Q, Wang W, Shen C, Meng X, Tang Y, Mei B, Xu Z, Song R. Characterization of a glutamine synthetase gene DvGS2 from Dunaliella viridis and biochemical identification of DvGS2-transgenic Arabidopsis thaliana. Gene. 2014;536(2):407–15. doi: 10.1016/j.gene.2013.11.009. [DOI] [PubMed] [Google Scholar]
- 14.Zhu C, Fan Q, Wang W, Shen C, Wang P, Meng X, Tang Y, Mei B, Xu Z, Song R. Characterization of a glutamine synthetase gene DvGS1 from Dunaliella viridis and investigation of the impact on expression of DvGS1 in transgenic Arabidopsis thaliana. Mol Biol Rep. 2014;41(1):477–87. doi: 10.1007/s11033-013-2882-y. [DOI] [PubMed] [Google Scholar]
- 15.Gautrat P, Laffont C, Frugier F, Ruffel S. Nitrogen systemic signaling: from symbiotic nodulation to root acquisition. Trends Plant Sci. 2021;26(4):392–406. doi: 10.1016/j.tplants.2020.11.009. [DOI] [PubMed] [Google Scholar]
- 16.Yu LH, Wu J, Tang H, Yuan Y, Wang SM, Wang YP, Zhu QS, Li SG, Xiang CB. Overexpression of Arabidopsis NLP7 improves plant growth under both nitrogen-limiting and -sufficient conditions by enhancing nitrogen and carbon assimilation. Sci Rep. 2016;6:27795. doi: 10.1038/srep27795. [DOI] [PMC free article] [PubMed] [Google Scholar]
- 17.Xin W, Zhang L, Zhang W, Gao J, Yi J, Zhen X, Li Z, Zhao Y, Peng C, Zhao C. An integrated analysis of the rice transcriptome and metabolome reveals differential regulation of carbon and nitrogen metabolism in response to nitrogen availability. Int J Mol Sci. 2019;20(9):2349. doi: 10.3390/ijms20092349. [DOI] [PMC free article] [PubMed] [Google Scholar]
- 18.Kiba T, Krapp A. Plant Nitrogen acquisition under low availability: regulation of uptake and root architecture. Plant Cell Physiol. 2016;57(4):707–14. doi: 10.1093/pcp/pcw052. [DOI] [PMC free article] [PubMed] [Google Scholar]
- 19.Iqbal A, Jing N, Qiang D, Kayoumu M, Wang X, Gui H, Zhang H, Xiling Z, Meizhen S. Genotypic variation in carbon and nitrogen metabolism in the cotton subtending leaves and seed cotton yield under various nitrogen levels. J Sci Food Agric. 2023;103(5):2602–2617. doi: 10.1002/jsfa.12412. [DOI] [PubMed] [Google Scholar]
- 20.Ho CH, Lin SH, Hu HC, Tsay YF. CHL1 functions as a nitrate sensor in plants. Cell. 2009;138(6):1184–94. doi: 10.1016/j.cell.2009.07.004. [DOI] [PubMed] [Google Scholar]
- 21.Cheng J, Tan H, Shan M, Duan M, Ye L, Yang Y, He L, Shen H, Yang Z, Wang X. Genome-wide identification and characterization of the NPF genes provide new insight into low nitrogen tolerance in Setaria. Front Plant Sci. 2022;13:1043832. doi: 10.3389/fpls.2022.1043832. [DOI] [PMC free article] [PubMed] [Google Scholar]
- 22.Zhang JY, Cun Z, Wu HM, Chen JW. Integrated analysis on biochemical profiling and transcriptome revealed nitrogen-driven difference in accumulation of saponins in a medicinal plant Panax notoginseng. Plant Physiol Biochem. 2020;154:564–580. doi: 10.1016/j.plaphy.2020.06.049. [DOI] [PubMed] [Google Scholar]
- 23.Cun Z, Shuang SP, Zhang JY, Hong J, Wu HM, Yang J, Zhao HC, Gao LL, Chen JW. Suppression of leaf growth and photosynthetic capacity as an acclimation strategy to nitrogen deficiency in a nitrogen-sensitive and shade-tolerant plant Panax notoginseng. J Plant Interact. 2022;17(1):980–990. doi: 10.1080/17429145.2022.2141902. [DOI] [Google Scholar]
- 24.Cun Z, Wu HM, Zhang JY, Shuang SP, Hong J, An TX, Chen JW. High nitrogen inhibits biomass and saponins accumulation in a medicinal plant Panax notoginseng. PeerJ. 2023;11:e14933. doi: 10.7717/peerj.14933. [DOI] [PMC free article] [PubMed] [Google Scholar]
- 25.Qu JW. 2016. The variety differences and physiological mechanisms of nitrogen uptake and translocation for maize canopy-root-soil system. Inner Mongolia Agricultural University.
- 26.Song NN. Effects of rice root characters on root carbon and nitrogen costs and their relationships with nitrogen absorption and utilization efficiency. Huazhong Agricultural University; 2017.
- 27.Xia B, Liu QB, Deng ND. Review of genotype differences in nitrogen uptake and utilization efficiency in rice. Crop Res. 2008;22(4):288–292. doi: 10.16848/j.cnki.issn.1001-5280.2008.04.019. [DOI] [Google Scholar]
- 28.Li XL, Ji PT, Zhou BY, Zhang L, Yin BZ, Zhang YC. Response of root characteristics and nitrogen utilization to nitrogen fertilizer in maize with different low-nitrogen tolerance cultivars. J. Hebei Agricul. University 2019;42(6). 10.13320/j.cnki.jauh.2019.0114.
- 29.Jiang P, Xiong H, Zhang L, Zhu YC, Zhou XB, Liu M, Guo XY, Xu FX. Effects of N rate and planting density on nutrient uptake and utilization of hybrid rice under different ecological conditions. J Plant Nutrit Fertil. 2017;23(2):342–350. doi: 10.11674/zwyf.16280. [DOI] [Google Scholar]
- 30.Wang MY, Siddiqi MY, Ruth TJ, Glass A. Ammonium Uptake by Rice Roots (II. Kinetics of 13NH4+ Influx across the Plasmalemma) Plant Physiol. 1993;103(4):1259–1267. doi: 10.1104/pp.103.4.1259. [DOI] [PMC free article] [PubMed] [Google Scholar]
- 31.Kanno Y, Hanada A, Chiba Y, Ichikawa T, Nakazawa M, Matsui M, Koshiba T, Kamiya Y, Seo M. Identification of an abscisic acid transporter by functional screening using the receptor complex as a sensor. PNAS. 2012;109(24):9653–8. doi: 10.1073/pnas.1203567109. [DOI] [PMC free article] [PubMed] [Google Scholar]
- 32.Kanno Y, Kamiya Y, Seo M. Nitrate does not compete with abscisic acid as a substrate of AtNPF4.6/NRT1.2/AIT1 in Arabidopsis. Plant Signal Behav. 2013;8(12):e26624. doi: 10.4161/psb.26624. [DOI] [PMC free article] [PubMed] [Google Scholar]
- 33.Paez-Valencia J, Sanchez-Lares J, Marsh E, Dorneles LT, Santos MP, Sanchez D, Winter A, Murphy S, Cox J, Trzaska M, Metler J, Kozic A, Facanha AR, Schachtman D, Sanchez CA, Gaxiola RA. Enhanced proton translocating pyrophosphatase activity improves nitrogen use efficiency in Romaine lettuce. Plant Physiol. 2013;161(3):1557–69. doi: 10.1104/pp.112.212852. [DOI] [PMC free article] [PubMed] [Google Scholar]
- 34.Ranathunge K, El-Kereamy A, Gidda S, Bi YM, Rothstein SJ. AMT1;1 transgenic rice plants with enhanced NH4+ permeability show superior growth and higher yield under optimal and suboptimal NH4+ conditions. J Exp Bot. 2014;65(4):965–79. doi: 10.1093/jxb/ert458. [DOI] [PMC free article] [PubMed] [Google Scholar]
- 35.Lee S, Marmagne A, Park J, Fabien C, Yim Y, Kim SJ, Kim TH, Lim PO, Masclaux-Daubresse C, Nam HG. Concurrent activation of OsAMT1;2 and OsGOGAT1 in rice leads to enhanced nitrogen use efficiency under nitrogen limitation. Plant J. 2020;103(1):7–20. doi: 10.1111/tpj.14794. [DOI] [PMC free article] [PubMed] [Google Scholar]
- 36.Hsu PK, Tsay YF. Two phloem nitrate transporters, NRT1.11 and NRT1.12, are important for redistributing xylem-borne nitrate to enhance plant growth. Plant Physiol. 2013;163(2):844–56. doi: 10.1104/pp.113.226563. [DOI] [PMC free article] [PubMed] [Google Scholar]
- 37.Li X, Zeng R, Liao H. Improving crop nutrient efficiency through root architecture modifications. J Integr Plant Biol. 2016;58(3):193–202. doi: 10.1111/jipb.12434. [DOI] [PubMed] [Google Scholar]
- 38.Liu L, Chen J, Gu C, Wang S, Xue Y, Wang Z, Han L, Song W, Liu X, Zhang J, Li M, Li C, Wang L, Zhang X, Zhou Z. The exocyst subunit CsExo70B promotes both fruit length and disease resistance via regulating receptor kinase abundance at plasma membrane in cucumber. Plant Biotechnol. J. 2023. 10.1111/pbi.14189. [DOI] [PMC free article] [PubMed]
- 39.Liu X, Hu B, Chu C. Nitrogen assimilation in plants: current status and future prospects. J Genet Genomics. 2022;49(5):394–404. doi: 10.1016/j.jgg.2021.12.006. [DOI] [PubMed] [Google Scholar]
- 40.Yu J, Xuan W, Tian Y, Fan L, Sun J, Tang W, Chen G, Wang B, Liu Y, Wu W, Liu X, Jiang X, Zhou C, Dai Z, Xu D, Wang C, Wan J. Enhanced OsNLP4-OsNiR cascade confers nitrogen use efficiency by promoting tiller number in rice. Plant Biotechnol J. 2021;19(1):167–176. doi: 10.1111/pbi.13450. [DOI] [PMC free article] [PubMed] [Google Scholar]
- 41.Zhang Z, Xiong S, Wei Y, Meng X, Wang X, Ma X. The role of glutamine synthetase isozymes in enhancing nitrogen use efficiency of N-efficient winter wheat. Sci Rep. 2017;7(1):1000. doi: 10.1038/s41598-017-01071-1. [DOI] [PMC free article] [PubMed] [Google Scholar]
- 42.Kusano M, Tabuchi M, Fukushima A, Funayama K, Diaz C, Kobayashi M, Hayashi N, Tsuchiya YN, Takahashi H, Kamata A, Yamaya T, Saito K. Metabolomics data reveal a crucial role of cytosolic glutamine synthetase 1;1 in coordinating metabolic balance in rice. Plant J. 2011;66(3):456–66. doi: 10.1111/j.1365-313X.2011.04506.x. [DOI] [PubMed] [Google Scholar]
- 43.Yamaya T, Oaks A. 2004. Metabolic regulation of ammonium uptake and assimilation, in nitrogen acquisition and assimilation in higher plants. Springer, 35-63.
- 44.Giannino D, Nicolodi C, Testone G, Frugis G, Pace E, Santamaria P, Guardasole M, Mariotti D. The overexpression of asparagine synthetase A from E. coli affects the nitrogen status in leaves of lettuce (Lactuca sativa L.) and enhances vegetative growth. Euphytica. 2008;162:11–22. 10.1007/s10681-007-9506-3.
- 45.Lehmann T, Skrok A, Dabert M. Stress-induced changes in glutamate dehydrogenase activity imply its role in adaptation to C and N metabolism in lupine embryos. Physiol Plant. 2010;138(1):35–47. doi: 10.1111/j.1399-3054.2009.01294.x. [DOI] [PubMed] [Google Scholar]
- 46.Wu YW, Li Q, Dong P, Ma XJ, Yu DH, Luo YH, Kong FL, Yuan JC. Effects of nitrogen fertilizer on leaf chlorophyll content and enzyme activity at late growth stages in maize cultivars with contrasting tolerance to low nitrogen. Acta Prataculturae Sinica. 2017;26(10):188–197. doi: 10.11686/cyxb2017006. [DOI] [Google Scholar]
- 47.Zhou JC, Hu J, Bai YX, Peng SX, Zhang H, Zhu D, Goa HY. Effects of nitrogen fertilizer application rate and ratio of base fertilizer and topdressing on nitrogen metabolites and key enzymes of flue-cured tobacco. Mol Plant Breed. 2022. http://kns.cnki.net/kcms/detail/46.1068.S.20220113.1407.014.html.
- 48.Tarasenko VI, Garnik EY, Shmakov VN, Konstantinov YM. Induction of Arabidopsis gdh2 gene expression during changes in redox state of the mitochondrial respiratory chain. Biochemistry (Mosc) 2009;74(1):47–53. doi: 10.1134/s0006297909010076. [DOI] [PubMed] [Google Scholar]
- 49.Mondal R, Kumar A, Chattopadhyay SK. Structural property, molecular regulation, and functional diversity of glutamine synthetase in higher plants: a data-mining bioinformatics approach. Plant J. 2021;108(6):1565–1584. doi: 10.1111/tpj.15536. [DOI] [PubMed] [Google Scholar]
- 50.Kaushik JK, Iimura S, Ogasahara K, Yamagata Y, Segawa S, Yutani K. Completely buried, non-ion-paired glutamic acid contributes favorably to the conformational stability of pyrrolidone carboxyl peptidases from hyperthermophiles. Biochemistry. 2006;45(23):7100–12. doi: 10.1021/bi052610n. [DOI] [PubMed] [Google Scholar]
- 51.Torreira E, Seabra AR, Marriott H, Zhou M, Llorca Ó, Robinson CV, Carvalho HG, Fernández-Tornero C, Pereira PJ. 2014. The structures of cytosolic and plastid-located glutamine synthetases from Medicago truncatula reveal a common and dynamic architecture. Acta Crystallogr. D Biol. Crystallogr. 2014;70(Pt 4):981-93. 10.1107/S1399004713034718. [DOI] [PMC free article] [PubMed]
- 52.Fierobe HP, Mirgorodskaya E, McGuire KA, Roepstorff P, Svensson B, Clarke AJ. Restoration of catalytic activity beyond wild-type level in glucoamylase from Aspergillus awamori by oxidation of the Glu400—Cys catalytic-base mutant to cysteinesulfinic acid. Biochemistry. 1998;37(11):3743–52. doi: 10.1021/bi972231x. [DOI] [PubMed] [Google Scholar]
- 53.Zhai L, Feng L, Xia L, Yin H, Xiang S. Crystal structure of glycogen debranching enzyme and insights into its catalysis and disease-causing mutations. Nature Commun. 2016;7:11229. doi: 10.1038/ncomms11229. [DOI] [PMC free article] [PubMed] [Google Scholar]
- 54.Filiz E, Vatansever R, Ozyigit II. Molecular docking of Glycine max and Medicago truncatula ureases with urea; bioinformatics approaches. Mol Biol Rep. 2016;43(3):129–40. doi: 10.1007/s11033-016-3945-7. [DOI] [PubMed] [Google Scholar]
- 55.Wang YY, Cheng YH, Chen KE, Tsay YF. Nitrate transport, signaling, and use efficiency. Ann Rev Plant Biol. 2018;69:85–122. doi: 10.1146/annurev-arplant-042817-040056. [DOI] [PubMed] [Google Scholar]
- 56.Li CY, Kong XQ, Dong HZ. Nitrate uptake, transport and signaling regulation pathways. J Nucl Agricul Sci. 2020;34(5):0982–0993. doi: 10.11869/j.issn.100-8551.2020.05.0982. [DOI] [Google Scholar]
- 57.Castaings L, Camargo A, Pocholle D, Gaudon V, Texier Y, Boutet-Mercey S, Taconnat L, Renou JP, Daniel-Vedele F, Fernandez E, Meyer C, Krapp A. The nodule inception-like protein 7 modulates nitrate sensing and metabolism in Arabidopsis. Plant J. 2009;57(3):426–35. doi: 10.1111/j.1365-313X.2008.03695.x. [DOI] [PubMed] [Google Scholar]
- 58.Zhang JY, Xu XZ, Kuang SB, Cun Z, Chen JW. Constitutive activation of genes involved in triterpene saponins enhances the accumulation of saponins in three-year-old Panax notoginseng growing under moderate light intensity. Ind Crops Prod. 2021;171(36):113938. doi: 10.1016/j.indcrop.2021.113938. [DOI] [Google Scholar]
- 59.Gupta N, Gupta M, Akhatar J, Goyal A, Kaur R, Sharma S, Goyal P, Mukta A, Kaur N, Mittal M, Singh MP, Bharti B, Sardana VK, Banga SS. Association genetics of the parameters related to nitrogen use efficiency in Brassica juncea L. Plant Mol Biol. 2021;105(1–2):161–175. doi: 10.1007/s11103-020-01076-x. [DOI] [PubMed] [Google Scholar]
- 60.Li H. Principles and techniques of plant physiological and biochemical tests. Beijing: Higher Education Press; 2000. [Google Scholar]
- 61.Yang Z, Liu G, Zhang G, Yan J, Dong Y, Lu Y, Fan W, Hao B, Lin Y, Li Y, Li X, Tang Q, Xiang G, He S, Chen J, Chen W, Xu Z, Mao Z, Duan S, Jin S, Yang S. The chromosome-scale high-quality genome assembly of Panax notoginseng provides insight into dencichine biosynthesis. Plant Biotechnol J. 2021;19(5):869–871. doi: 10.1111/pbi.13558. [DOI] [PMC free article] [PubMed] [Google Scholar]
- 62.Robinson MD, McCarthy DJ, Smyth GK. edgeR: a Bioconductor package for differential expression analysis of digital gene expression data. Bioinformatics. 2010;26(1):139–40. doi: 10.1093/bioinformatics/btp616. [DOI] [PMC free article] [PubMed] [Google Scholar]
- 63.Love MI, Huber W, Anders S. Moderated estimation of fold change and dispersion for RNA-seq data with DESeq2. Genome Biol. 2014;15(12):550. doi: 10.1186/s13059-014-0550-8. [DOI] [PMC free article] [PubMed] [Google Scholar]
- 64.Chiva C, Sabidó E. HCD-only fragmentation method balances peptide identification and quantitation of TMT-labeled samples in hybrid linear ion trap/orbitrap mass spectrometers. J Proteomics. 2014;96:263–70. doi: 10.1016/j.jprot.2013.11.013. [DOI] [PubMed] [Google Scholar]
- 65.Kim YJ, Chambers AG, Cecchi F, Hembrough T. Targeted data-independent acquisition for mass spectrometric detection of RAS mutations in formalin-fixed, paraffin-embedded tumor biopsies. J Proteomics. 2018;189:91–96. doi: 10.1016/j.jprot.2018.04.022. [DOI] [PubMed] [Google Scholar]
- 66.Ishiguro-Watanabe M. KEGG for taxonomy-based analysis of pathways and genomes. Nucleic Acids Res. 2023;2023(51):D587–D592. doi: 10.1093/nar/gkac963. [DOI] [PMC free article] [PubMed] [Google Scholar]
- 67.Jumper J, Evans R, Pritzel A, Green T, Figurnov M, Ronneberger O, Tunyasuvunakool K, Bates R, Žídek A, Potapenko A, Bridgland A, Meyer C, Kohl SAA, Ballard AJ, Cowie A, Romera-Paredes B, Nikolov S, Jain R, Adler J, Back T, Petersen S, Reiman D, Clancy E, Zielinski M, Steinegger M, Pacholska M, Berghammer T, Bodenstein S, Silver D, Vinyals O, Senior AW, Kavukcuoglu K, Kohli P, Hassabis D. Highly accurate protein structure prediction with AlphaFold. Nature. 2021;596(7873):583–589. doi: 10.1038/s41586-021-03819-2. [DOI] [PMC free article] [PubMed] [Google Scholar]
- 68.Morris GM, Huey R, Lindstrom W, Sanner MF, Belew RK, Goodsell DS, Olson AJ. AutoDock4 and AutoDockTools4: Automated docking with selective receptor flexibility. J Comput Chem. 2009;30(16):2785–91. doi: 10.1002/jcc.21256. [DOI] [PMC free article] [PubMed] [Google Scholar]
- 69.Laskowski RA, Swindells MB. LigPlot+: multiple ligand-protein interaction diagrams for drug discovery. J Chem Inf Model. 2011;51(10):2778–86. doi: 10.1021/ci200227u. [DOI] [PubMed] [Google Scholar]
- 70.Xiong R, He T, Wang Y, Liu S, Gao Y, Yan H, Xiang Y. Genome and transcriptome analysis to understand the role diversification of cytochrome P450 gene under excess nitrogen treatment. BMC Plant Biol. 2021;21(1):447. doi: 10.1186/s12870-021-03224-x. [DOI] [PMC free article] [PubMed] [Google Scholar]
Associated Data
This section collects any data citations, data availability statements, or supplementary materials included in this article.
Supplementary Materials
Additional file 1: Figure S1. Panax notoginseng pot culture under different nitrogen (N) levels, cited from our research group (Cun et al., 2022). Figure S2. Protein (A) and peptide (B) identification. Figure S3. Annotated Venn diagrams of GO, KEGG, and KOG databases (A), comparison of differentially expressed proteins among N0, N7.5 and N15 (B). Red represents the up-regulated proteins, green represents the up-regulated proteins. Figure S4. GO analysis of differentially expressed proteins from two comparation group. (A) N0 vs N7.5, (B) N0 vs N15. Red represents the up-regulated proteins, green represents the down-regulated proteins. Figure S5. KEGG enrichment analysis for differentially expressed proteins. (A) N0 vs N7.5, (B) N0 vs N15. Red represents the up-regulated proteins, blue represents the down-regulated proteins. Figure S6. Cluster of proteins expression patterns in response to N regimes. Figure S7. Enrichment of functional categories of each cluster with the significantly enriched KEGG pathways plotted for differentially expressed proteins among N regimes. Figure S8. Real-time quantitative polymerase chain reaction (qRT-PCR) validation of key genes involved in N uptake and transport in P. notoginseng. The left Y-axis and histogram are candidate genes expression obtained via qRT-PCR, the right Y-axis and red line are gene expression level calculated as FPKM value. The relative expression obtained from real-time PCR calculated by 2−△△Ct method. Values for histogram were means ± SD (n = 3), and significant differences are indicated by letters (ANOVA; P < 0.05). The value of each red dot is the average of three biological replicates (n = 3). Figure S9. qRT-PCR validation of key genes involved in N assimilation in P. notoginseng by RNA-seq. The left Y-axis and histogram are candidate genes expression obtained via qRT-PCR, the right Y-axis and red line are gene expression level calculated as FPKM value. The relative expression obtained from real-time PCR calculated by 2−△△Ct method. Values for histogram were means ± SD (n = 3), and significant differences are indicated by letters (ANOVA; P < 0.05). The value of each red dot is the average of three biological replicates (n = 3). Figure S10. qRT-PCR validation of key genes involved in nitrate signal-sensing and transduction in P. notoginseng by RNA-seq. The left Y-axis and histogram are candidate genes expression obtained via qRT-PCR, the right Y-axis and red line are gene expression level calculated as FPKM value. The relative expression obtained from real-time PCR calculated by 2−△△Ct method. Values for histogram were means ± SD (n = 3), and significant differences are indicated by letters (ANOVA; P < 0.05). The value of each red dot is the average of three biological replicates (n = 3). Figure S11. The ramachandran plot paragraph of GS1 and GDH1. Arabidopsis thaliana (AtGS1, A), Panax notoginseng (PnGS1, B), Solanum tuberosum (StGS1, C), Zea mays (ZmGS1, D), AtGDH1 (E), PnGDH1 (F), StGDH1 (G) and AtGDH1 (H). Figure S12. Comparison of GS1-NH4+ interaction models among different species. PnGS1/AtGS1-NH4+ (A); PnGS1/StGS1-NH4+ (B); PnGS1/ZmGS1-NH4+ (C); PnGS1/AtGS1/StGS1/ZmGS1-NH4+ (D). The bule indicated PnGS1-NH4+ interaction models. White arrows represent NH4+ ligands that bind to PnGS1. Figure S13. Protein-ligand interaction plot of NH4+ bound to AtGS1 (A), PnGS1 (B), StGS1 (C) and ZmGS1 (D). The stick indicated the amino acid residue that interacts with the NH4+ at a distance of 4Å, and hydrophobic bonds were formed between the amino acid residues and the ligand. Figure S14. Comparison of GDH1-NH4+ interaction models among different species. PnGDH1/AtGDH1-NH4+ (A); PnGDH1/StGDH1-NH4+ (B); PnGDH1/ZmGDH1-NH4+ (C); PnGDH1/AtGDH1/StGDH1/ZmGDH1-NH4+ (D). The bule indicated PnGDH1-NH4+ interaction models. White arrows represent NH4+ ligands that bind to PnGDH1. Figure S15. Protein-ligand interaction plot of NH4+ bound to AtGDH1 (A), PnGDH1 (B), StGDH1 (C) and ZmGDH1 (D). The stick indicated the amino acid residue that interacts with the NH4+ at a distance of 4Å, and hydrophobic bonds were formed between the amino acid residues and the ligand.
Additional file 2: Tabel S1. List of primers used in qRT-PCR analysis.
Additional file 3: Tabel S2. Comparison of amino acid residue sites in docking different GS1-NH4+ models.
Additional file 4: Tabel S3. Comparison of amino acid residue sites in docking different GDH1-NH4+ models.
Data Availability Statement
All data generated or analysed during this study are included in this published article and its supplementary information files. The raw RNA-Seq data from this study have been deposited into the NCBI BioProject with the accession number PRJNA997624 (https://www.ncbi.nlm.nih.gov/sra/PRJNA997624). The molecular docking figures were drawn by ourselves.


