Abstract
Performance monitoring that supports ongoing behavioral adjustments is often examined in the context of either choice confidence for perceptual decisions (i.e., “did I get it right?”) or reward expectation for reward-based decisions (i.e., “what reward will I receive?”). However, our understanding of how the brain encodes these distinct evaluative signals remains limited because they are easily conflated, particularly in commonly used two-alternative tasks with symmetric rewards for correct choices. Previously we used a motion-discrimination task with asymmetric rewards to identify neural substrates of forming reward-biased perceptual decisions in the caudate nucleus (part of the striatum in the basal ganglia) and the frontal eye field (FEF, in prefrontal cortex). Here we leveraged this task design to partially decouple estimates of accuracy and reward expectation and examine their impacts on subsequent decisions and their representations in those two brain areas. We identified distinguishable representations of these two evaluative signals in individual caudate and FEF neurons, with regional differences in their distribution patterns and time courses. We observed that well-trained monkeys (both sexes) used both evaluative signals, infrequently but consistently, to adjust their subsequent decisions. We found further that these behavioral adjustments had reliable relationships with the neural representations of both evaluative signals in caudate, but not FEF. These results suggest that the cortico-striatal decision network may use diverse evaluative signals to monitor and adjust decision-making behaviors, adding to our understanding of the different roles that the FEF and caudate nucleus play in a diversity of decision-related computations.
Keywords: basal ganglia, decision evaluation, frontal cortex, perceptual decision making, saccade, striatum
Significance Statement
Effective decision-making often requires the evaluation of current decisions to guide adjustment of future decisions. We used a behavioral task with separate manipulations of visual evidence uncertainty and reward size to disentangle two types of evaluative signals with theoretical importance: accuracy and reward expectation. We found that well-trained monkeys used these signals infrequently but consistently to adjust subsequent decisions. Neurons in the caudate nucleus in the basal ganglia and frontal eye field (FEF) in the prefrontal cortex encoded both types of evaluative signals, with substantial regional differences. Caudate activity, but not FEF activity, was linked to the monkeys’ decision adjustments. These results suggest different involvements of these two regions in decision evaluation and adjustment.
Introduction
Effective learning can depend on comparisons between expected and experienced outcomes (Sutton and Barto, 1998). These expectations have been studied under terms such as confidence, choice uncertainty, choice accuracy, and reward expectation. For perceptual decisions based on unreliable or noisy sensory evidence, these expectations typically involve the assessment that a choice is correct given the evidence (Kiani et al., 2014). This assessment can support adaptive strategies in changing environments and account for other forms of sequential behavioral adjustments including post-error slowing (Yu and Dayan, 2005; Nassar et al., 2012; Purcell and Kiani, 2016). For reward- or value-based decisions, reward expectation is the expected benefit (and/or cost) given a choice. This expectation is a critical component of reinforcement learning and is commonly used to evaluate value-based decisions (Sutton and Barto, 1998; Samejima et al., 2005; Daw and Doya, 2006; Rangel et al., 2008; Schultz, 2015). In more complex behavioral contexts, confidence, accuracy expectation, and reward expectation may become intertwined (Locke et al., 2020; Caziot and Mamassian, 2021).
Neural signals consistent with either of these forms of expectation have been reported in many brain regions, including the caudate nucleus of the basal ganglia and the frontal cortex (Kawagoe et al., 1998; Schultz, 1998; Roesch and Olson, 2003; Padoa-Schioppa and Assad, 2006; Kepecs et al., 2008; Lau and Glimcher, 2008; Kiani and Shadlen, 2009; Basten et al., 2010; Ding and Gold, 2010; Nomoto et al., 2010; Kennerley et al., 2011; Middlebrooks and Sommer, 2012; Teichert et al., 2014; Yanike and Ferrera, 2014a; Hebart et al., 2016; So and Stuphorn, 2016; Lak et al., 2017, 2020b). However, our understanding of the neural representations of these evaluative signals has been limited by the fact that these quantities are easily conflated under conditions in which they are typically examined. For example, for value-based decision tasks, choice confidence can be based on a comparison of reward expectations for the chosen versus the unchosen options. Likewise, for many perceptual decision tasks, the reward expectation for the chosen option is the product of accuracy and the magnitude of reward associated with a correct choice. When the reward magnitude is fixed, choice confidence, accuracy expectation, and reward expectation are all perfectly correlated.
Given these confounds, only a few studies have used task manipulations that were effective at identifying distinguishable neural representations of these quantities. For example, one study identified distinct neural representations of choice confidence and reward expectation in the rat orbitofrontal cortex (OFC), along with reward expectation-modulated activity in striatum-projecting OFC neurons (Hirokawa et al., 2019). Another study identified representations of choice confidence but not reward expectation in the supplemental eye field (So and Stuphorn, 2016). To advance our understanding of how the brain implements decision evaluation, we focused here on two quantities: (1) accuracy expectation, which estimates the probability of a choice being correct; and (2) reward expectation, which estimates the expected value of a choice (i.e., the product of accuracy expectation and expected reward size). We examined if and how accuracy expectation and reward expectation have distinguishable representations in two brain areas that play key roles in both value-based and perceptual decision-making, the caudate and frontal eye field (FEF).
We leveraged a behavioral task with separate manipulations of evidence strength and reward-choice associations (Fig. 1A) to uncouple the estimated accuracy expectation and reward expectation, thus allowing us to differentiate neural representations of the two quantities at the single-neuron level in the caudate and FEF. We previously showed that neurons in these two areas play similar, but distinguishable, computational roles in forming these decisions that require balancing uncertain sensory evidence with asymmetric-reward expectations (Fan et al., 2020). Here we show that these regions may also play similar, but distinguishable, roles in monitoring current decisions and adjusting future decisions, by keeping track of both accuracy expectation and reward expectation and using those signals to guide subsequent behavior.
Figure 1.
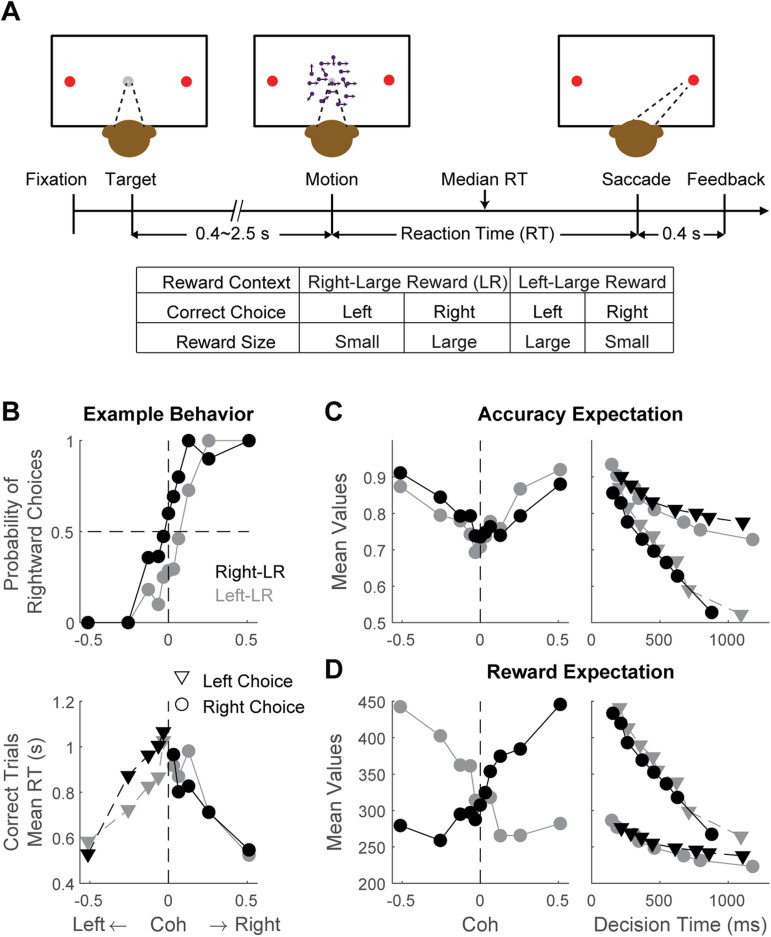
Task design and example performance. A, Monkeys reported the perceived direction of a random-dot motion stimulus with a saccade to one of the two choice targets. The motion stimulus was turned off upon detection of saccade. Correct trials were rewarded based on the reward context. Error trials were not rewarded. Reward context was alternated between blocks of trials, signaled to the monkey at the beginning of a block, and kept constant within a block. Multiple levels of motion coherences and two directions were pseudorandomly interleaved within a block. B, Psychometric (top) and chronometric (bottom) functions for an example session. Black and gray symbols represent data from blocks with different reward contexts, as indicated in the top panel. Triangles and circles represent data for left and right choices. C, D, Estimated accuracy expectation (C) and reward expectation (D) for the example session in B. In the left panels, values were grouped by motion coherence and averaged across decision times. In the right panels, values were grouped by decision time quantiles and averaged over coherence levels, with triangles and circles representing left and right choices, respectively.
Materials and Methods
Experimental design and statistical analyses
The data sets for the present study were obtained from three monkeys (two males and one female) and identical to those reported previously (Fan et al., 2020). The original report focused on neural activity during decision formation (i.e., after motion onset and before the saccadic response). The present study focused on neural activity around saccade onset that can encode evaluation of the decision. Details of subjects, the behavioral task, data acquisition, and fitting with a drift-diffusion model (DDM) with collapsing bounds can be found in three previous reports (Fan et al., 2018, 2020; Doi et al., 2020) and are summarized here. All training, surgery, and experimental procedures were performed in accordance with the NIH's Guide for the Care of Use of Laboratory Animals and were approved by the University of Pennsylvania Institutional Animal Care and Use Committee (protocol #804726).
The numbers of neurons for each animal are reported in Results. Statistical tests related to neural and behavioral analyses are detailed in “Neural data analysis” and “Measurement of sequential effects” subsections, respectively, with controls for multiple comparisons when applicable.
Behavioral task, data acquisition, and model fitting
Briefly, a trial began with presentation of a central fixation point (Fig. 1A). Once the monkey acquired and maintained fixation on this point, two choice targets were presented to indicate the two motion directions to be discriminated. After a random delay, the fixation point was dimmed, and a random-dot kinematogram was shown (“motion onset”) with randomly interleaved motion direction and motion strength (coherence). The monkey reported the perceived motion direction by making a self-timed saccade to the corresponding choice target. Two asymmetric-reward contexts were alternated in a block design. In the Right-LR blocks, the rightward choice was paired with a large juice reward (LR). In the Left-LR blocks, the leftward choice was paired with the large reward. The other choice was paired with a small juice reward. The reward context for the current block was signaled to the monkey at the first trial. Three monkeys were extensively trained on this task. Single-unit recordings were obtained in the FEF and caudate nucleus (in separate sessions) while monkeys performed the task. DDM model fitting was performed, separately for each session, using the maximum a posteriori estimate method and prior distributions suitable for human and monkey subjects (Wiecki et al., 2013). The same fitting results were reported previously (Fan et al., 2020).
Computation of accuracy expectation and reward expectation
Following previous literature (Kiani and Shadlen, 2009), we defined accuracy expectation as the estimation of accuracy on average given the current choice and decision time (DT), as follows:
| (1) |
where DT is the decision time that equals RT minus non-DT (estimated from DDM fits). The right-hand side was computed by marginalizing over all possible coherences. For example, Right choices (Fig. 2) can be represented as follows:
| (2) |
where is signed coherence (± for rightward and leftward motion) and, by task design, as follows:
| (3) |
Figure 2.
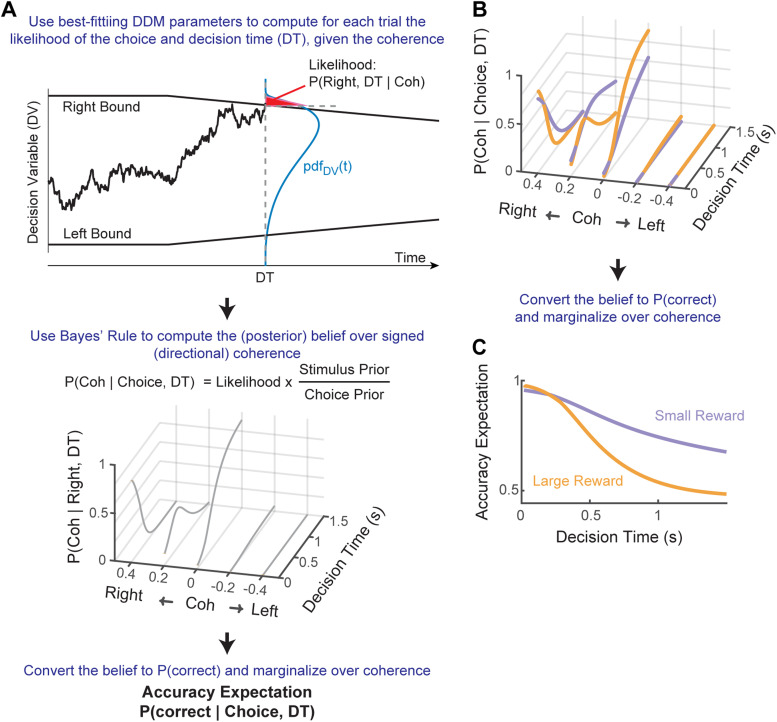
Computing accuracy expectation. A, General framework for computing accuracy expectation. For a given set of DDM parameters fitted to monkeys’ choice and RT data, the probability density function of the DV can be derived for a given time and coherence level: pdfDV(t). In this example, the likelihood of reaching a Right choice at time t is the area under the pdfDV(t) curve (red patch) beyond the Right Bound. The likelihoods are used to compute the posterior belief of the stimulus state (i.e., signed coherence). Using the mapping between signed coherence and correct choice, the posterior belief is converted to the probability of being correct and marginalized over coherence to compute accuracy expectation. B, C, Illustration of how asymmetric-reward contexts can influence posterior belief (B) and accuracy expectation (C). For the illustrations, five coherence levels (0, ±0.2, and ±0.4) and the average DDM parameters, separately for the two reward contexts, from all caudate recordings were used.
In our task design, each coherence had an equal chance of appearance, except that Coh = 0 happened twice as often as the other coherences:
| (4) |
In some sessions, Coh = 0 was not included. In those sessions:
| (5) |
was obtained by numerical simulation of the DDM using the best-fitting parameters. For each coherence, we obtained the probability of the decision variable (DV) attaining a value x at time t, , using the best-fitting DDM parameters of each session and reward context.
| (6) |
Similarly,
| (7) |
After obtaining an estimate of accuracy expectation,
| (8) |
To standardize across sessions with different juice volumes, we normalized reward size by the volume of the smaller reward for each session. That is, for each session the small reward was assigned a reward size of 1, and the large reward was assigned a value equal to the large–small reward ratio.
Neural data analysis
We focused on neural activity between 200 ms before saccade onset (i.e., near decision commitment) and 400 ms after saccade onset (i.e., before feedback delivery).
Joint modulations by reward size, DT, and coherence
For each single unit, we computed the average firing rates in three task epochs: (1) a pre-saccade 100 ms window beginning at 100 ms before saccade onset, (2) a peri-saccade 300 ms window beginning at 100 ms before saccade onset, and (3) a post-saccade 400 ms window beginning at saccade onset (all epochs end before reward delivery). For each unit and epoch, we performed two multiple linear regressions (Eqs. 9, 10), focusing on coherence and RT dependencies, respectively, and including only correct trials.
| (9) |
| (10) |
In both Equations 9 and 10, is the unsigned motion coherence; is the normalized reaction time (mean-subtracted values, with the mean values measured for the corresponding reward context-choice combinations).
| (11) |
| (12) |
| (13) |
| (14) |
| (15) |
The signs of , and (or , and ) were used to create the 8 categories of joint modulations in Figure 6. Chi-square tests were used to assess whether the proportion of the 8 categories were the same (criterion: p = 0.05/12, correcting for the 12 comparisons).
Figure 6.
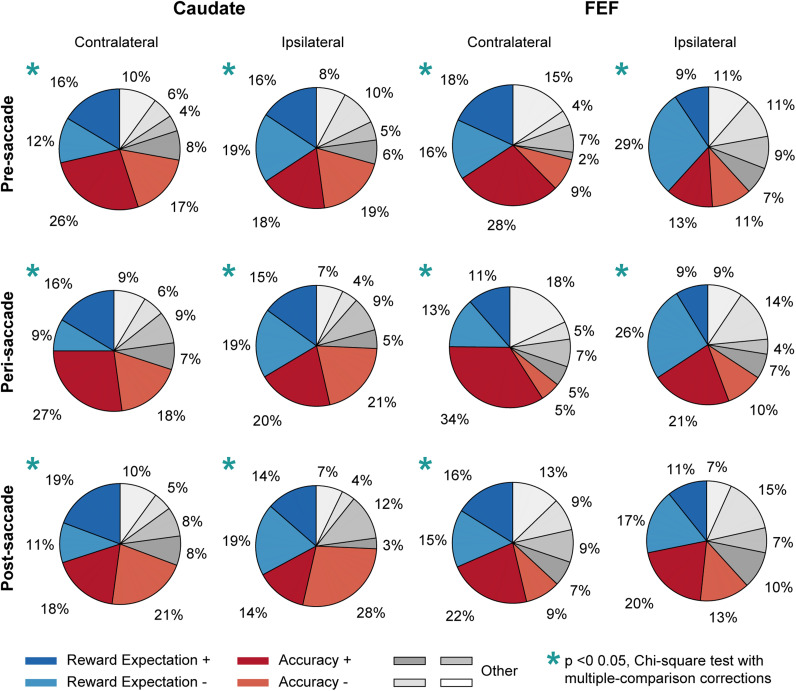
Distribution of modulation patterns in caudate and FEF neurons. Each pie chart shows the distribution of eight possible modulation combinations by reward size, decision time, and coherence, based on the signs of the regression coefficients from the linear regressions defined in Equations 9 and 10. All neurons were included in this analysis regardless of significance of regression coefficients. “Accuracy +”: negative coefficient for reward size and decision time, positive for coherence. “Accuracy −”: positive for reward size and decision time, negative for coherence. “Reward expectation +”: negative for decision time, positive for reward size and coherence. “Reward expectation −”: positive for decision time, negative for reward size and coherence. Activity in FEF and caudate neurons and the three epochs were analyzed separately. Star: the distribution differed significantly from uniform (Chi-square test, p < 0.05/12).
Correlation between neural activity and evaluative signals
For each neuron, we measured the average firing rates in 300 ms time windows with 10 ms steps. For each time window, we performed two partial (Spearman) correlations: (1) between firing rates and accuracy expectation while removing the effect of reward expectation, and (2) between firing rates and reward expectation while removing the effect of accuracy expectation. Significance was assessed at p = 0.05. Chi-square tests were performed to compare fractions of significant modulation at each time window between conditions, with corrections for multiple comparisons. We report here the results based on data from correct trials only. Similar results were obtained including all trials (not shown).
We tested the effects of two potential confounds. First, because accuracy expectation and reward expectation are both affected by reward biases, it is possible that reward context modulation alone may cause measurable correlations between firing rate and accuracy expectation or reward expectation. To minimize such a possibility, we imposed an additional criterion that modulation by accuracy expectation or reward expectation must be accompanied by modulation by DT. For each time window and choice, we computed the correlation between firing rates and DT for the two reward contexts separately and jointly. We considered a significant modulation by DT to be present if any of the three correlation coefficients were non-zero (p < 0.05).
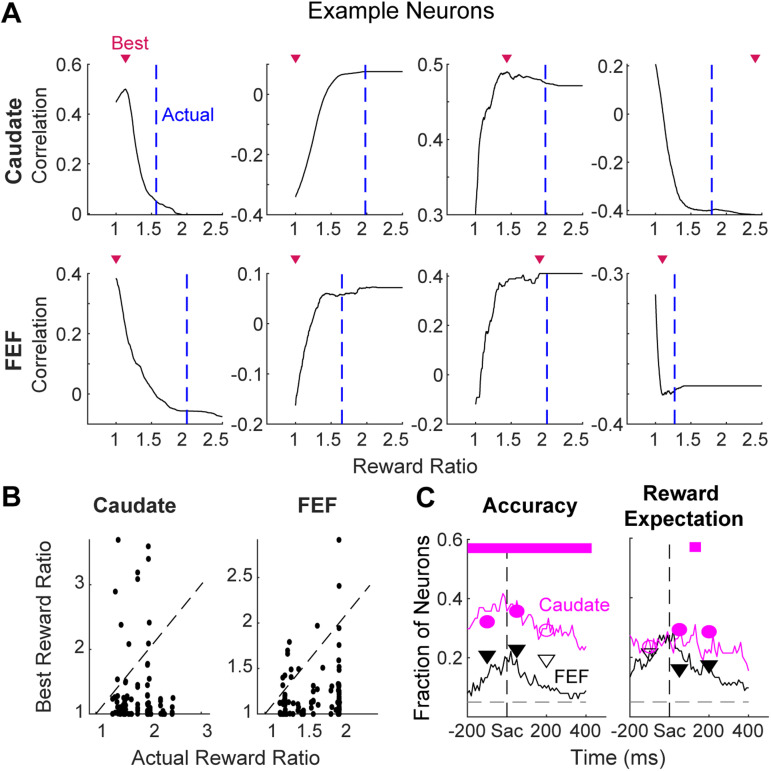
Second, we assessed whether a subjective reward ratio, different from the actual ratio of juice volume, may provide a more accurate measurement of reward expectation and significantly affect the prevalence of reward expectation modulation of neural activity. We computed new reward expectation with reward ratio ranging from 1 to 2.5 and operationally defined the “best” reward ratio as the value associated with the largest correlation between firing rate and reward expectation (Fig. 8).
Figure 8.
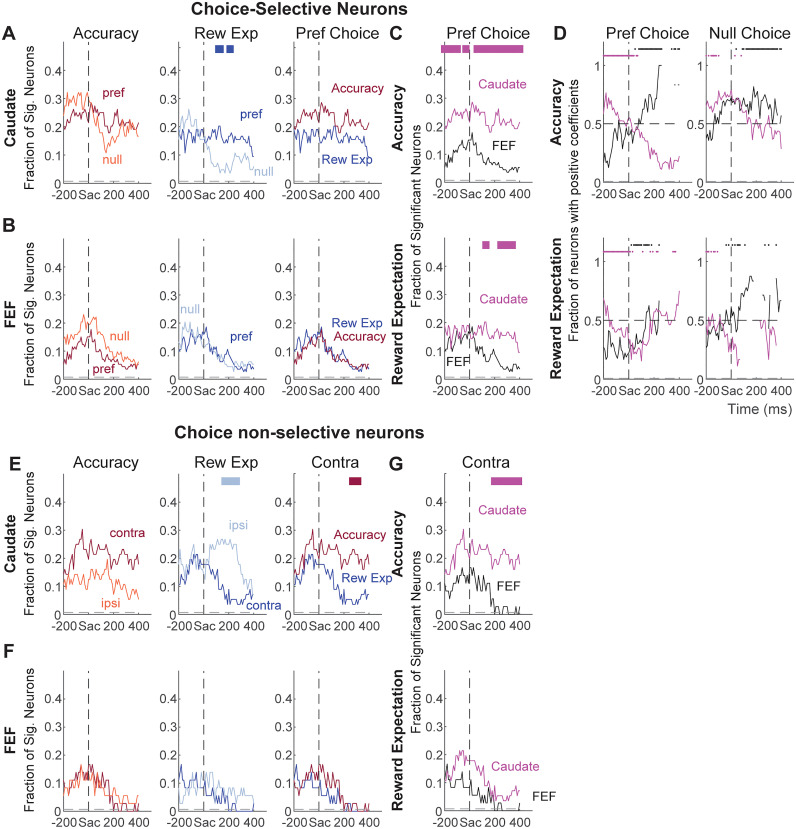
Fractions of significant non-zero partial correlation coefficients. A–D, Results for neurons with choice-selective activity around saccade onset. A, B, comparisons of the prevalence of modulation between the preferred and null choice trials and between accuracy expectation and reward expectation for the preferred choice, in the caudate (A) and FEF samples (B), respectively. Dashed lines indicate chance level. C, Comparisons of the prevalence of modulation by accuracy expectation (top) and reward expectation (bottom) between FEF and caudate samples. The bar on top of the curves shows the time points (in 12 bins) with significant differences between the two samples (color indicates the region with the larger fraction; Chi-square test p < 0.05/12). For these comparisons, only neurons showing modulation by decision time were included to avoid counting neurons with pure reward context or reward size modulation. D, Comparisons of the prevalence of positive partial correlation coefficients between FEF and caudate samples for the preferred and null choices separately. Same format as C. Only neurons with significant non-zero coefficients were included and time bins with fewer than six of such neurons were excluded. E–G, Results for neurons without choice-selective activity around saccade onset. Same format as A–C. Note that the small size of FEF subpopulation without choice selectivity precluded the comparison with the corresponding caudate subpopulation for modulation signs.
Measurement of sequential effects
We measured how monkeys’ choice and RT may be influenced by evaluative signals from the previous trial. To measure sequential effects on choice, we performed logistic regressions using the following function:
| (16) |
where is the probability of choosing the same option as previous trial; is the signed coherence of current trials (± for motion towards the same/opposite direction as the previous choice direction); and and are the z-scored accuracy expectation value and reward expectation value, respectively, in the previous trial.
| (17) |
| (18) |
implies that the monkey was more likely to repeat the same choice after a high-accuracy trial. implies that that the monkey was more likely to repeat the same choice after a high-reward expectation trial. and . imply that the evaluative signal-dependent effects were stronger after an error trial.
To measure sequential effects on RT, we performed multiple linear regressions using the following function:
| (19) |
where is the unsigned motion coherence in the current trials (positive for both directions); , are defined the same way as in Equation 16. and are defined the same way as in Equations 17 and 18.
| (20) |
| (21) |
| (22) |
| (23) |
| (24) |
| (25) |
implies that the monkey tended to slow down when repeating the same choice. implies that the monkey tended to slow down after a large-reward trial. implies that the monkey slowed down even more when repeating a choice that resulted in a large reward. implies that the monkey slowed down after an error trial. implies that the monkey slowed down even more when repeating a previously incorrect choice. implies that the monkey tended to slow down after a high-accuracy correct trial, regardless of the saccade direction. implies that the above slow-down effect was stronger if the monkey also repeated the same choice. Similar interpretations apply with beta coefficients associated with error trials ( and ) and reward expectation parameters ( , , , and ).
For the choice data, the logistic regression was fitted via generalized linear model assuming Binomial distribution for the response variable. Each session data was fitted separately. To reduce the possibility of over-fitting, we used two methods of regularization: Elastic Net and LASSO regressions. Operationally, the fits were obtained using lassoglm function in MATLAB, setting the alpha parameter to 1 and 0.5 for LASSO and Elastic Net regressions, respectively. For each fitting, a fivefold cross validation was performed, and the coefficients were chosen as the ones corresponding to the minimum cross-validation error plus one standard error.
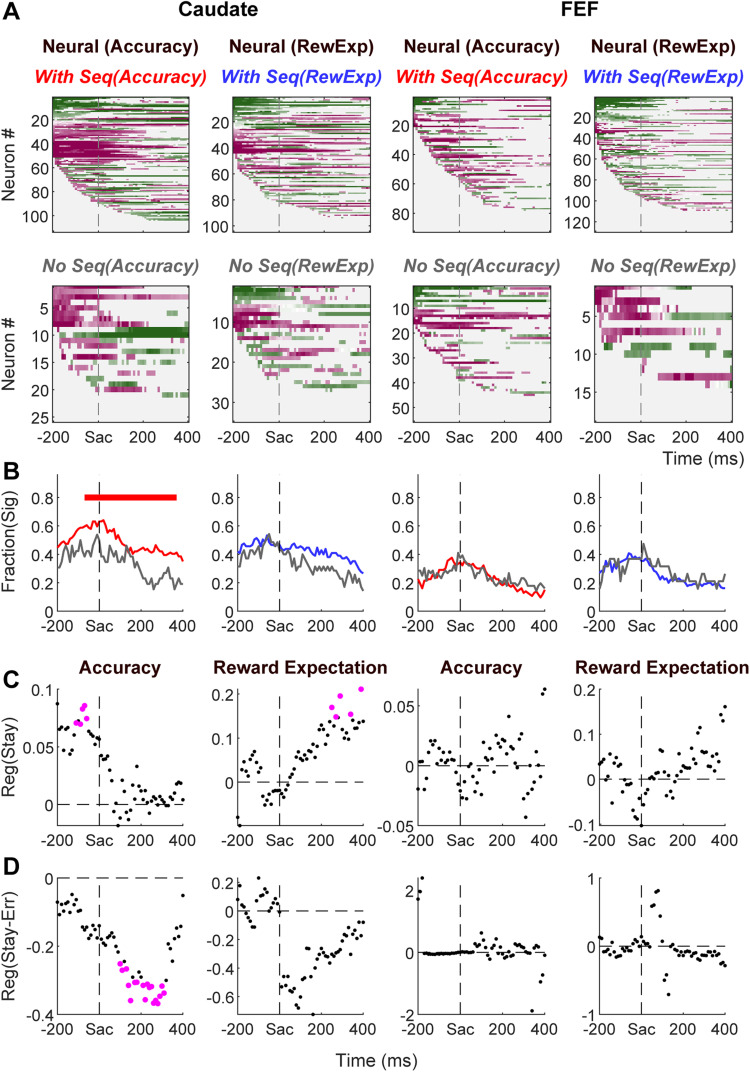
We assessed whether it was more likely to encounter evaluative signal-related modulation in neurons recorded in sessions with sequential effects, using Chi-square test with a criterion of p = 0.05 (Fig. 11B). To assess the relationship between neural modulation by accuracy expectation and sequential effects related to accuracy expectation, we performed a linear regression for all neurons:
We applied this linear regression in sliding windows and used ttest to assess significant non-zero regression coefficients (p < 0.05, magenta dots in Fig. 11C,D). A similar regression was performed for reward expectation-related neural and sequential effects.
| (26) |
Figure 11.
Caudate activity is more closely linked to the monkeys’ sequential adjustments. A, First column: heatmaps of correlation coefficients between firing rates and accuracy expectation, after accounting for the effect of reward expectation, for caudate neurons recorded in sessions with accuracy expectation-dependent sequential effects (top) and other caudate neurons (bottom). For neurons showing significant correlation for both choices, the average coefficient was plotted. For neurons showing significant correlation for only one choice, the significant coefficient was plotted. Second column, heatmaps for correlation coefficient between firing rates and reward expectation, after accounting for the effect of accuracy expectation, for caudate neurons recorded in sessions with reward expectation-dependent sequential effects (top) and other caudate neurons (bottom). Third and fourth columns: heatmaps for FEF neurons. Same format as the first two columns. B, Comparison of the fractions of neurons showing significant correlation coefficients for sessions with and without the corresponding evaluative signal-dependent sequential effects. Horizontal bar indicates time bins in which the two fractions are significantly different (Chi-square test, p < 0.05). C, D, Regression coefficients measuring the relationship between neural modulation by an evaluative signal and sequential effects that depended on that evaluative signal (Eqs. 25, 26, for accuracy expectation and reward expectation, respectively). C: values; D: values. Values that significantly differed from zero were plotted in magenta (t test, p < 0.05).
Results
We trained three monkeys to perform a response-time (RT), asymmetric-reward, random-dot visual motion direction-discrimination saccade task (Fig. 1A; Fan et al., 2018). The monkeys made saccades to indicate their judgments about the global motion direction of a motion stimulus. Motion direction and strength were varied across trials, and reward context (Fig. 1, table below the timeline) was varied in blocks of trials. As we documented previously, the three monkeys showed consistent behavioral strategies such that their choice and response time (RT) depended on both the reward context and motion strength (Fig. 1B), and their reward-biased decision strategy can be captured with a combination of drift-rate and bound biases in a DDM framework (Fan et al., 2018; Doi et al., 2020). Here we re-analyzed behavioral and neural data from 140 sessions with caudate recordings (n = 17, 45, and 70 from monkey A, C, and F, respectively) and, separately, 149 sessions with FEF recordings (n = 75, 23, and 33 from monkey A, C, and F, respectively).
Post-decision accuracy expectation and reward expectation exhibit distinct relationships with reward size, DT, and coherence
We computed accuracy expectation and reward expectation (values for an example session are shown in Fig. 1C) by adapting methods used by others (see Fig. 2A and Materials and Methods for details; Kiani and Shadlen, 2009; Fetsch et al., 2014; Kiani et al., 2014). Briefly, we computed accuracy expectation as the estimated probability that the monkey made a correct choice, as follows. First, we estimated the monkey's decision process by fitting their choice and RT data to a DDM and used these fits to obtain the likelihood of each stimulus state (i.e., signed coherence) given a choice and the RT associated with that choice. We then computed the (posterior) belief of a stimulus state from the likelihood values and priors, using Bayes’ rule. Finally, we converted the belief into the probability of a correct choice and marginalized this probability over states (signed coherence) to obtain the subjective assessment of the probability that the current choice is correct. We then computed reward expectation as the product of accuracy expectation and the reward size associated with the choice.
As shown previously, accuracy expectation and reward expectation for this kind of task both depend on stimulus strength (motion coherence) and DT (Fig. 2C; Kiani and Shadlen, 2009; Fetsch et al., 2014). Moreover, because the monkeys in our study showed different choice and RT behaviors for the two reward contexts, the fitted DDM parameters differed between reward contexts, giving rise to additional dependencies on the interactions among reward size, DT, and coherence. That is, because the likelihoods of stimulus states for the same DT and choice differed between when a large and a small reward was expected, the resulting belief of stimulus state and accuracy expectation also depended on reward context in non-linear, DT- and coherence-dependent manners (Fig. 2B,C). For these reasons, we computed both quantities separately for each reward context in each session.
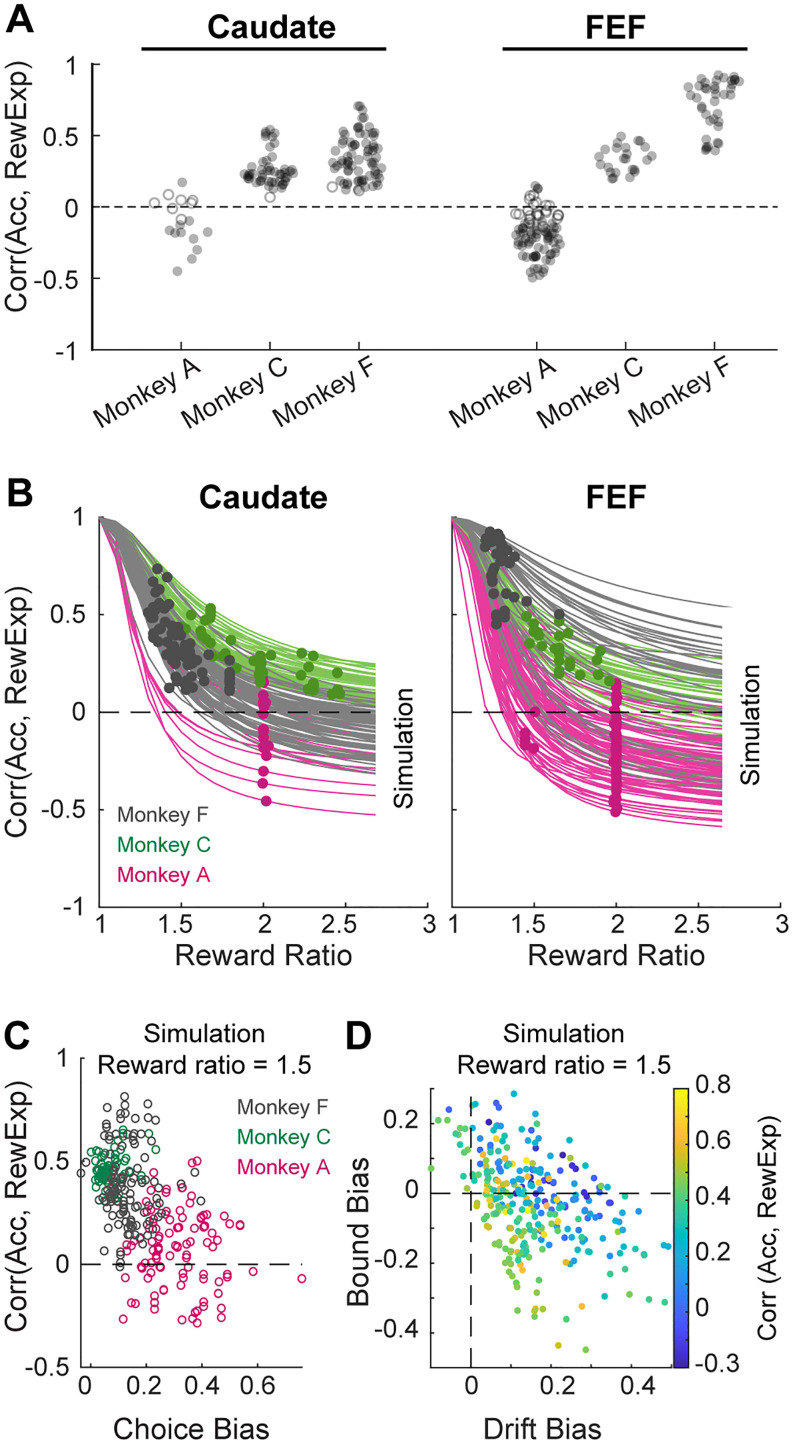
The similarities and differences between accuracy expectation and reward expectation are best illustrated by considering their relationships with reward size, DT, and coherence. For the example session in Figure 1C, accuracy expectation tended to be higher for smaller reward (purple relative to orange in both panels), shorter DT (left panel), and higher coherence (right panel). In contrast, reward expectation tended to be higher for larger reward, shorter DT, and higher coherence (Fig. 1D). Consistent with these illustrations, these measures of accuracy expectation and reward expectation were no longer perfectly correlated (e.g., because they were affected differently by reward magnitude), but could still be partially correlated (e.g., because both tended to decrease with increasing DT and increase with coherence) across all sessions (Fig. 3A). The exact correlation coefficient depended on experimental parameters, such as the ratio between large and small rewards, and the monkey’ performance (Fig. 3B,D). For example, the correlation coefficient tended to decrease, sometimes reaching negative values, with increasing reward ratios (Fig. 3B). The correlation also tended to decrease when the monkey was more biased by reward contexts (Fig. 3C). The dependency patterns were more complex for DDM parameters (Fig. 3D) because multiple parameters can interact to alter likelihood estimation. Most critically, their correlation was significantly <1 (Wilcoxon signed-rank test, p < 0.05/6 for all the monkeys and brain areas), which allowed us to probe their potentially different relationships to neural activity and behavior, as detailed below.
Figure 3.
Decoupling of accuracy expectation and reward expectation. A, Distributions of the Spearman correlation coefficients between accuracy expectation and reward expectation in all recording sessions. Filled circle: correlation is different from zero for the individual session (p < 0.05). Note that correlation coefficients were below 1 for all sessions. B, The correlation coefficient depended on the ratio between large and small rewards. Each line depicts the coefficients from simulated results using different reward ratios for each session. Each dot depicts the actual coefficient and reward ratio from the given session. Colors indicate the results from the three monkeys. C, The correlation coefficient (simulated for a fixed reward ratio of 1.5) covaried with the degree to which the reward asymmetry biased choices in individual sessions (points). D, The correlation coefficient (simulated for a fixed reward ratio of 1.5) covaried with estimated reward biases in drift-rate and relative bound heights in a DDM framework. Reward biases in drift rates and relative bound heights were estimated from the same DDM fits that were used to calculate accuracy expectation.
Accuracy expectation and reward expectation are reflected in post-decision activity of FEF and caudate neurons
Previously, we reported in passing that a substantial proportion of neurons in both caudate and FEF exhibited post-decision activity patterns that were modulated by a combination of reward, DT, and coherence (Doi et al., 2020; Fan et al., 2020). Above we showed that these three factors also jointly modulate accuracy expectation and reward expectation. Therefore, we examined whether and how post-decision activity in the caudate and FEF represent accuracy expectation, reward expectation, or both.
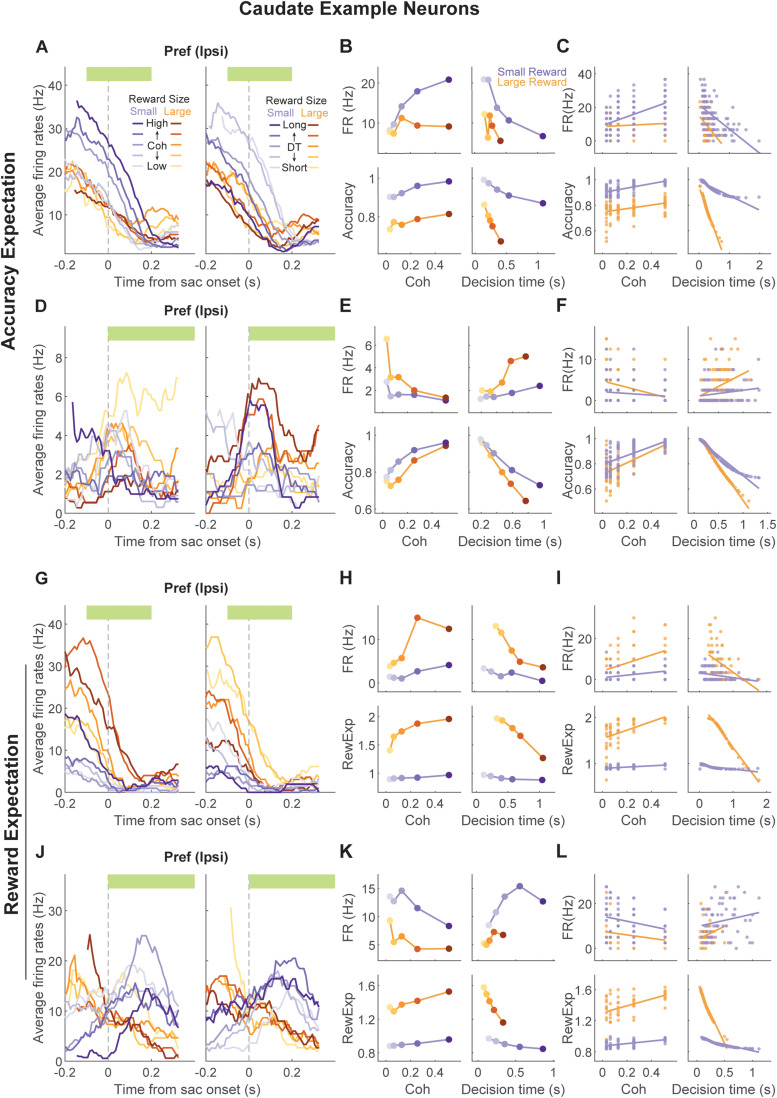
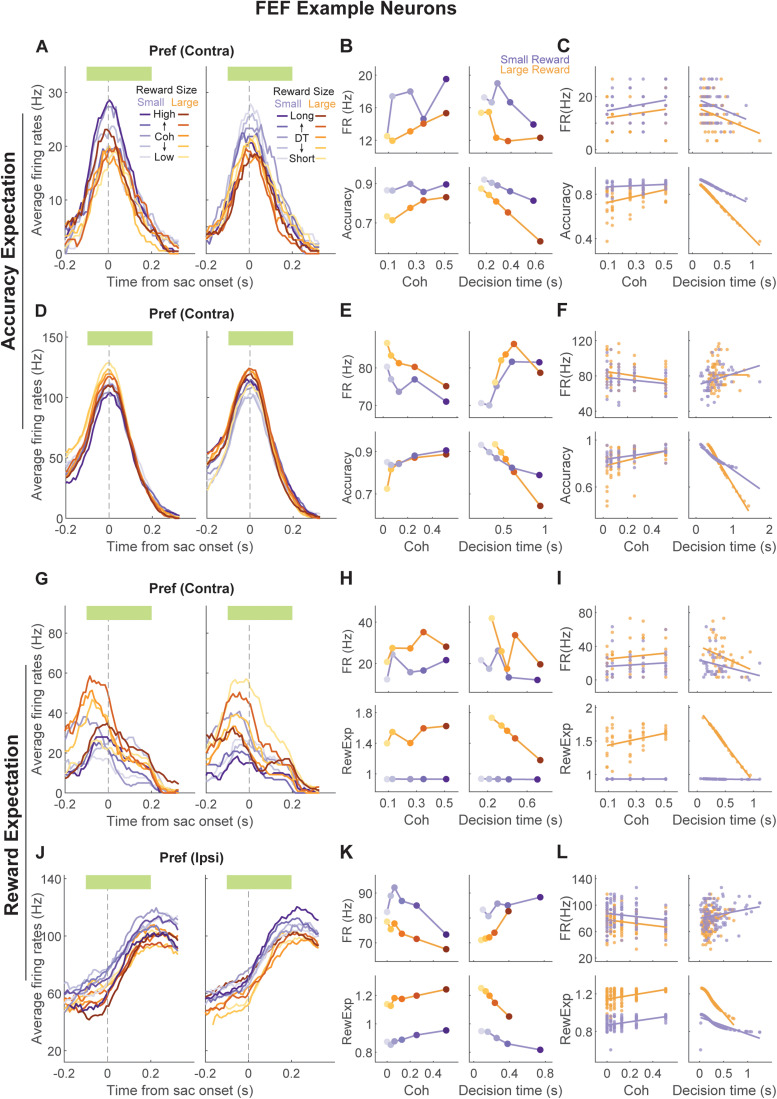
The example caudate neuron depicted in Figure 4A–C exhibited modulation patterns that resembled accuracy expectation. Specifically, the neuron was more active when decisions were to the small reward option, decision times were short, and coherence was high (Fig. 3B,C bottom panels), similar to accuracy expectation estimated from the monkey's behavior in this session (Fig. 4B,C bottom panels). The neuron depicted in Figure 4D–F exhibited modulation patterns that resembled the negative of accuracy expectation: the neuron was more active when the decisions were to the large-reward option, decision times were long, and coherence was low. Accuracy expectation for this session followed the opposite patterns. In contrast, the example caudate neuron depicted Figure 4G–I exhibited modulation patterns that resembled reward expectation. Specifically, the neuron was more active when reward size and coherence were high and less active with increasing decision times. The neuron depicted in Figure 4J–L showed the opposite activity pattern, resembling the negative of reward expectation. Similar examples and subpopulations were found in FEF (Fig. 5).
Figure 4.
Example caudate neurons encoding accuracy expectation or reward expectation. A, Average firing rates of a caudate neuron around saccade onset for one choice, grouped by reward size and coherence (left) or decision time (right). Green bar: the time window used for neural activity measurements in B and C. B, Comparison of the average firing rate (top row) and average accuracy expectation (bottom row) for the neuron in A, as a function of motion coherence (left column), decision time (right column, divided into quintiles), and reward size (orange/purple). Note the correspondence between the modulation patterns for neural activity and accuracy expectation. C, Same format as B, except showing values for individual trials and without binning decision times. Lines: linear regression, separately for the two reward conditions. D–F, Another example neuron, in which the modulation patterns for neural activity and accuracy expectation were in opposite directions. Same format as A–C. G–I, Example neuron, in which the modulation patterns for neural activity corresponded to those for reward expectation. Same format as A–C. J–L, Example neuron, in which the modulation patterns for neural activity and reward expectation were in opposite directions. Same format as A–C.
Figure 5.
Example FEF neurons encoding accuracy expectation or reward expectation. Same format as Figure 4.
These neural modulation patterns did not emerge from a random mix of reward, DT, and coherence sensitivity but instead reflected a robust representation of evaluative signals. We examined neural activity in three peri-decision epochs: pre-, peri-, and post-saccade (−100 to 0 ms, −100 to 200 ms, and 0 to 400 ms from saccade onset, respectively). For each epoch, we counted the number of neurons showing one of eight possible combinations of modulation by the three factors (positive or negative coefficients in multiple linear regressions defined by Eqs. 9, 10). Figure 6 documents the distributions of neurons in these eight categories, with red and blue fractions representing neurons with modulation patterns consistent with accuracy expectation and reward expectation, respectively. For almost all combinations of brain region, epoch, and choice identity, the distributions were not uniform across the eight categories (blue asterisks: Chi-square test p < 0.05/12), arguing against a random mixture of sensitivity in the population. Rather, the majority of neurons showed modulation patterns consistent with evaluative signals (red/blue vs. gray). These results suggest that substantial portions of FEF and caudate neurons encode either accuracy expectation or reward expectation.
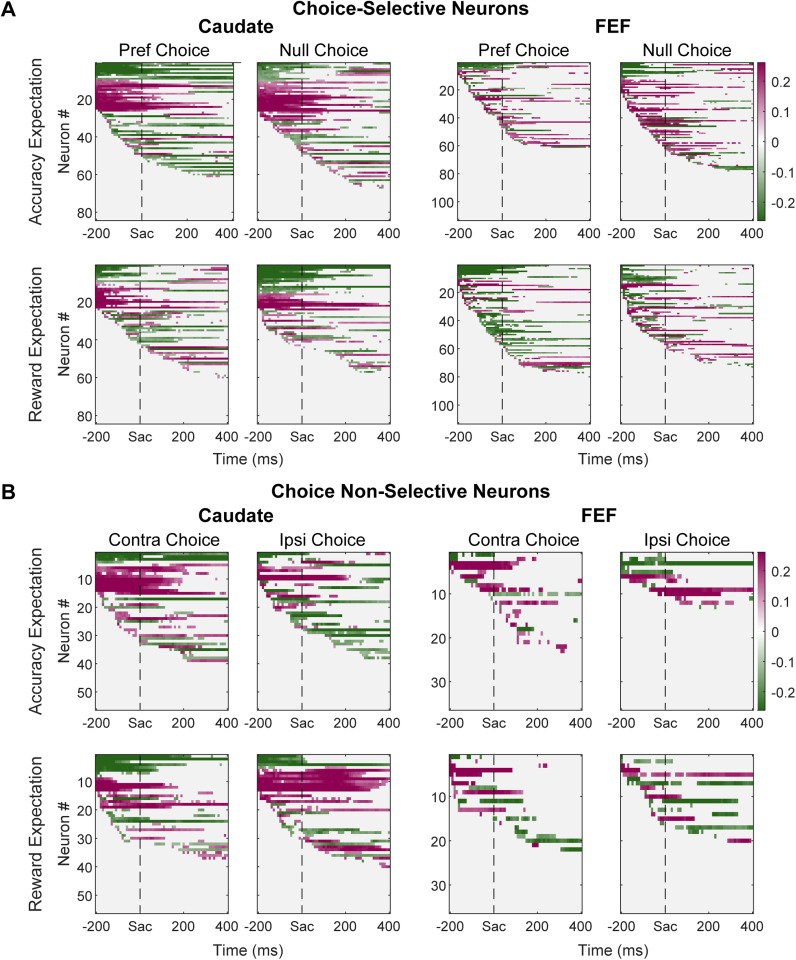
To assess more directly the relationship between neural activity and these evaluative signals, we computed two partial correlations between firing rate and each quantity, while accounting for the other. We chose the Spearman correlation to capture any non-linear, but monotonic, relationship. We used partial correlations to account for the potential confound of non-zero correlations between the model-derived measures of accuracy expectation and reward expectations that we found for many sessions (Fig. 3A). We observed significant non-zero partial correlation coefficients between accuracy expectation or reward expectation and the activity of many caudate and FEF neurons (p < 0.05). Some of these neurons showed reliable choice selectivity in their activity around saccade onset, as tested previously using multiple linear regression (100 ms before saccade onset to 200 ms after) (Fan et al., 2020), whereas others did not. The within-trial time courses of these correlation coefficients for neurons in each brain area separated by their choice selectivity are shown in Figure 7.
Figure 7.
Partial correlation coefficients for evaluative signals. A, Results from neurons with choice-selective activity around saccade onset. Top: correlation coefficients between firing rates and accuracy expectation, after accounting for the effect of reward expectation. Bottom: correlation coefficients between firing rates and reward expectation, after accounting for the effect of accuracy expectation. Neurons are sorted by the onset of the significant non-zero coefficient and sign of the coefficient, separately for the preferred and null choices. Each pixel shows the result for average firing rates computed in a 300 ms running window (10 ms step). B, Results from neurons without choice-selective activity around saccade onset. Same format as A, except that activity was grouped by contralateral and ipsilateral choices.
Accuracy expectation and reward expectation are represented differently in caudate and FEF populations
Previously, we reported differences between caudate and FEF populations in their involvement related to decision formation (Ding and Gold, 2010, 2012a; Fan et al., 2020). Here we assessed whether and how these regions also differ in their involvement related to decision evaluation. We observed several regional differences in the distributions of partial correlation coefficients. First, modulation by evaluative signals showed different choice dependencies for the two regions. In the choice-selective caudate subpopulation, modulation by reward expectation appeared more often in trials ending with the neurons’ preferred choices (Fig. 8A, second panel). In the other caudate subpopulation, modulation by reward expectation appeared more often in trials ending with the ipsilateral choice (Fig. 8E, second panel). In both FEF subpopulations, the prevalence of accuracy expectation or reward expectation modulation did not depend on choice (Fig. 8B,F, first two columns).
Second, the relative prevalence of modulation by the two evaluative signals differed for the two regions. In the caudate, the fraction appeared higher for accuracy expectation throughout the peri-saccade period, although this difference reached significance only in a short time window for the subpopulation without choice selectivity (Fig. 8A,E, third column). In the FEF, the fractions of neurons showing either accuracy expectation or reward expectation modulation were similar (Fig. 8B,F, third column).
Third, modulation by evaluative signals was generally more common for caudate neurons (Fig. 8C,G). Modulation by accuracy expectation was more prevalent in caudate than FEF, for the preferred choice in choice-selective neurons and contralateral choice in other neurons. Modulation by reward expectation was also more prevalent in caudate for the preferred choice in choice-selective neurons.
Fourth, the dominant signs of the partial correlation coefficients (positive/negative values imply that neural activity increased/decreased with increasing accuracy expectation or reward expectation) differed between the two regions. For neurons with choice-selective activity, the coefficients for accuracy expectation were primarily negative before saccade onset and positive afterward for FEF (Fig. 8D, top row). The opposite time course was observed for caudate neurons. The time course of the sign for reward expectation modulation was similar for the two regions for the preferred choice, with quantitative differences in the actual fractions (Fig. 8D, bottom row). For the null choice, both regions showed roughly equal distribution of positive and negative modulation before diverging around saccade onset. Because only a small number of FEF neurons showed no choice selectivity and evaluative signal modulation, we could not reliably compare their sign distributions with those of caudate neurons.
Note that for these comparisons, we imposed an additional criterion that neurons encoding evaluative signals must be also sensitive to DT. We used this criterion to filter out neurons that simply encoded reward context or reward size alone in a way that might appear to be modulated by either evaluative signal. Removing this filter did not qualitatively change the patterns described above. For example, caudate representations of accuracy expectation and reward expectation remained more prevalent than FEF representations (compare Figs. 8C, 9C).
Figure 9.
The observed regional differences were not due to estimation errors for the subjective reward ratio. A, Illustration of the identification of the best reward ratio (triangles) in the correlation function between firing rates and reward expectation values calculated with different reward ratios. Dashed lines: the actual ratio in juice volume. The eight traces correspond to the eight example neurons in Figures 4 and 5, respectively. B, Scatterplots of the best and actual reward ratios estimated using firing rates in pre-saccade, peri-saccade, and post-saccade epochs for all sessions. Note that the best reward ratio is expected to be near one for activity modulated only by accuracy expectation. C, Comparisons between results using the actual reward ratios and the fractions measured using best reward ratios (circles: caudate samples, triangles: FEF samples) for the three epochs. For both types of reward ratio, neuron counts did not require additional modulation by decision time. Filled symbols: significant regional difference (Chi-square test, p < 0.05). Note that the same patterns of regional difference remained.
Our finding of a relatively high prevalence of signals encoding accuracy expectation versus reward expectation comes with a potential caveat: the above analyses assumed that reward expectation was based on the objective reward asymmetry, but the monkeys might have had different subjective preferences (e.g., when we doubled the juice reward, a given monkey in a given session might have preferred it less or more than twice as much). We conducted additional analyses to show that our results were robust to any (unknown) variability in their subjective reward ratios. Specifically, for each monkey and session, we identified the subjective reward ratio that would maximize the correlation between neural activity and reward expectation (examples are shown in Fig. 9A). This procedure thus provides an upper bound on our estimate of the number of neurons that encode reward expectation. Across neurons and three task epochs (pre-saccade, peri-saccade, and post-saccade), the estimated best reward ratio was often close to 1 (Fig. 9B), which is consistent with our finding that many neurons were sensitive to accuracy expectation (which is equivalent to a reward ratio of 1). More generally, this new analysis did not change the greater prevalence of neurons encoding accuracy expectation versus reward expectation representation in the caudate population, nor the greater prevalence of neurons encoding accuracy expectation in caudate versus FEF populations (Fig. 9C). Together, these results suggest that the two regions encode evaluative signals differently.
Accuracy expectation and reward expectation differently influence subsequent decisions
To assess the behavioral relevance of these neural representations of evaluative signals in caudate and FEF, we next characterized how these signals related to the trial-to-trial adjustments the monkeys made in their choice and RT behavior. All three monkeys were well trained on the task and therefore made choices whose accuracy and speed could be well accounted-for via the DDM; that is, they were based primarily on a decision process that combined the accumulated sensory evidence on the current trial with certain reward context-dependent biases (Fan et al., 2018; Doi et al., 2020). Nevertheless, the monkeys occasionally adjusted their behavior from trial to trial based on evaluations of the previous choice. We assessed these potential sequential effects using (1) logistic regression testing for effects on staying or switching on the subsequent choice (Eq. 16) and (2) linear regression testing for effects on speeding up or slowing down the subsequent decision (Eq. 20). To account for the possibility that the monkeys’ sequential adjustments were a result of simpler outcome-driven (i.e., reinforcement learning-like) effects than the complex accuracy expectation- or reward expectation-driven effects, we also included regressors for whether the previous trial was correct and whether the monkey received a large reward. We used Elastic Net regularization to reduce overparameterization.
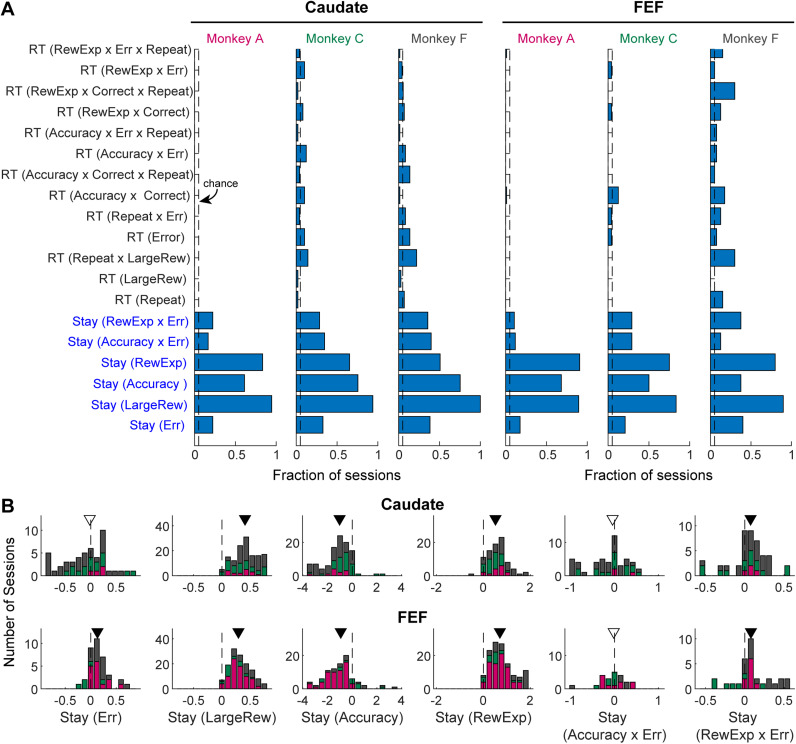
Even though the monkeys were well trained, we still observed sequential effects driven by accuracy expectation, and/or reward expectation, or both in many sessions. As shown in Figure 10A, all three monkeys showed sequential effects on choice in above-chance fractions of sessions. Sequential effects on RT were less frequent and more variable across monkeys and for caudate and FEF recording sessions. Specifically, the monkeys showed consistent tendencies to repeat the same choice after receiving a large reward or after a high-reward expectation trial (especially if the high-reward expectation was followed by an error outcome) (Fig. 10B, second, fourth, and sixth columns, respectively). In contrast, they tended to switch to the other choice after a high-accuracy expectation trial (third column). Their responses to an error outcome alone or with the accuracy expectation interaction varied across monkeys and sessions and may also depend on their overall experience on the task (first and fifth columns, respectively). The sequential effects based on previous large reward, accuracy expectation, and reward expectation were especially robust when we used Lasso regression as an alternative regularization method (Table 1).
Figure 10.
Monkeys showed opposite sequential effects that were based on accuracy expectation or reward expectation in the previous trial. A, Fractions of sessions with non-zero beta coefficients for sequential effects on choice and RT, based on Elastic Net regressions defined in Equations 16 and 20. Coefficients that showed above-chance (0.05) fractions across all monkeys and recording sites are indicated with blue text labels. B, Distributions of the non-zero beta coefficients for the common effects (blue labels) identified in A. Colors indicate sessions from the three monkeys. Triangle: median value; Filled triangle: the median value is significantly different from zero (Wilcoxon signed-rank test, p < 0.05). Note that the sequential effects differed in signs for accuracy expectation and reward expectation.
Table 1.
Regression results for common sequential effects
| Elastic net | Lasso | |||
|---|---|---|---|---|
| Median | p-value | Median | p-value | |
| Caudate sessions | ||||
| Stay (Err) | −0.020 | 0.2815 | ||
| Stay (LargeRew) | 0.406 | <0.0001 | 0.417 | <0.0001 |
| Stay (Accuracy) | −1.018 | <0.0001 | −0.838 | <0.0001 |
| Stay (RewExp) | 0.516 | <0.0001 | 0.409 | <0.0001 |
| Stay (Accuracy × Err) | −0.045 | 0.0726 | ||
| Stay (RewExp × Err) | 0.074 | 0.0318 | ||
| FEF sessions | ||||
| Stay (Err) | 0.131 | <0.0001 | ||
| Stay (LargeRew) | 0.291 | <0.0001 | 0.359 | <0.0001 |
| Stay (Accuracy) | −0.922 | <0.0001 | −1.298 | <0.0001 |
| Stay (RewExp) | 0.703 | <0.0001 | 0.592 | <0.0001 |
| Stay (Accuracy × Err) | −0.019 | 0.6378 | ||
| Stay (RewExp × Err) | 0.078 | 0.0048 | ||
Median values were from sessions with non-zero values for each regression coefficient; p-values were raw values from Wilcoxon signed-rank test performed on the non-zero coefficients.
These behavioral results suggested that the monkeys made online adjustments to their decision behavior based on accuracy expectation and/or reward expectation on the previous trial. The adjustments were in opposite directions after high-accuracy expectation and high-reward expectation trials.
Neural representations of evaluative signals were related differently to the monkeys’ sequential behavioral effects for caudate and FEF neurons
To test whether and how the neural representations of evaluative signals were related to the monkeys’ sequential behavioral adjustments, we performed two tests. First, we reasoned that such a relationship would predict that neural representations of an evaluative signal would be more likely to occur in sessions in which the monkeys showed evaluative signal-dependent sequential effects. We defined such sessions by the presence of non-zero beta coefficients in Elastic Net regressions for sequential effects on either choice or RT. We measured the prevalence of neural representation of evaluative signals by counting, for each time bin, the number of neurons showing significant non-zero partial correlation coefficients (Fig. 11A,B). During caudate recording sessions, neural modulation by accuracy expectation was more likely when the monkeys used accuracy expectation to guide sequential behavioral adjustments (Fig. 11A,B, first column). A qualitatively similar, but quantitatively much weaker, effect was observed for reward expectation (second column). During FEF recording sessions, the probability of encountering modulations by either accuracy expectation or reward expectation was similar regardless of whether monkeys made accuracy expectation or reward expectation-dependent sequential adjustments (third and fourth columns).
Second, we tested whether the coefficient of neural modulation was correlated with the coefficients of sequential effects across sessions. We used a linear regression, with the neural correlation coefficient (as in Fig. 10A) as the dependent variable and the corresponding sequential effect coefficients (as in Fig. 9) as the regressors. We found that, in the caudate population, neural modulation by accuracy expectation before saccade onset was related positively to whether the monkeys tended to repeat the same choice with a high-accuracy expectation on the previous trial (Fig. 10C, first column). Neural modulation by accuracy expectation after saccade onset was related negatively to whether the monkeys tended to repeat the high-accuracy expectation, but wrong, choice on the previous trial (Fig. 11D, first column). The post-saccade modulation by reward expectation was related positively to the monkeys’ tendency to repeat a choice with a high-reward expectation on the previous trial (Fig. 11C, second column). The same relations were observed in an alternative linear regression analysis that included all coefficients for sequential effects (i.e., both choice and RT). These results suggest that the contributions of post-decision, pre-feedback caudate representation of accuracy expectation to future decision adjustments depended on the correct/error feedback. The different time courses of the regression coefficients for accuracy expectation and reward expectation (compare Fig. 11C first and second columns) also implied that the neural representations of these two evaluative signals might be involved in different computations for future decision adjustments. We did not observe any significant relationship for the FEF population (Fig. 11C,D, third and fourth columns).
Discussion
Accuracy expectation and reward expectation are both important quantities for evaluating a decision after it has occurred, but their distinct roles are not well understood because they are perfectly correlated in many commonly used decision tasks. We addressed this challenge by manipulating sensory uncertainty and reward sizes to partially decorrelate and therefore identify distinguishable representations of these two conceptually distinct quantities. We focused on post-decision activity in previously recorded FEF and caudate neurons (Doi et al., 2020; Fan et al., 2020) and observed that: (1) accuracy expectation and reward expectation were represented in both brain regions; (2) these representations were more prevalent in caudate than FEF neurons, especially for accuracy expectation; (3) the monkeys used accuracy expectation and reward expectation from the previous trial to adjust their decision on the current trial; and (4) these behavioral adjustments were more closely linked to evaluative signals represented in caudate than in FEF. These results provide new perspectives on previously reported cognitive signals in post-decision FEF and caudate activity and further demonstrate functional differences between these two regions in decision evaluation and adjustment.
Previous studies have shown that post-decision FEF and caudate neural activity are sensitive to various cognitive signals, including choice value (Kawagoe et al., 1998; Lau and Glimcher, 2008; Seo et al., 2012), task difficulty (Ding and Gold, 2010, 2012a; Teichert et al., 2014), confidence (Middlebrooks and Sommer, 2012; Yanike and Ferrera, 2014a), and accuracy-related risk (Yanike and Ferrera, 2014b). There are two common hypotheses regarding the diverse modulation patterns. One hypothesis is that these different signals reflect the same underlying computations but are expressed differently under different task contexts. Our results, using a single task design, argue against this simple hypothesis by demonstrating that neural representations of at least two conceptually distinct signals co-exist in two brain regions that are well known to be involved in decision making. Extrapolating from these results, it seems likely that even more diverse types of evaluative signals are present in the decision network, which includes other cortical areas, midbrain dopamine neurons, and superior colliculus (Kepecs et al., 2008; Kiani and Shadlen, 2009; Zariwala et al., 2013; So and Stuphorn, 2016; Lak et al., 2017, 2020a,b; Odegaard et al., 2018; Hirokawa et al., 2019). In principle, these signals can be flexibly employed to adapt a decision-maker's strategy to diverse decision goals. For example, the accuracy-related signals can be more readily used to maximize accuracy, detect a change in environments (Yu and Dayan, 2005; Nassar et al., 2012), implement multi-stage decisions (van den Berg et al., 2016; Desender et al., 2019a), or seek more information (Desender et al., 2019b). In contrast, reward expectation/risk-related signals can be more readily used to maximize reward rate (Bogacz, 2007; Feng et al., 2009; Simen et al., 2009; Fan et al., 2018) and for implementing reinforcement learning algorithms (Sutton and Barto, 1998). The other hypothesis is that some patterns reflect precursor quantities that are not directly relevant to behavior. For example, the accuracy signal in caudate neurons may be used to compute reward expectation in loco but does not directly affect the monkeys’ behaviors. Arguing against this hypothesis, the monkeys’ sequential adjustments were linked to both accuracy and reward expectation signals in caudate. In addition, generalizing from a rodent study of OFC neurons (Hirokawa et al., 2019), the caudate may receive already-computed reward expectation signals from the cortex and thus does not need to encode accuracy expectation unless it is functionally relevant.
Given the extensive projection from the FEF to the caudate, it is not surprising that the two regions share many functional similarities, particularly for decision-making. For example, we and others have shown previously that both the FEF and caudate carry information related to decision formation, such as uncertain sensory evidence (Kim and Shadlen, 1999; Ding and Gold, 2010, 2012a; Ding, 2015), values for potential outcomes (Kawagoe et al., 1998; Lauwereyns et al., 2002b,a; Roesch and Olson, 2003; Samejima et al., 2005; Ding and Hikosaka, 2006; Lau and Glimcher, 2008), and the combination of them in complex decisions (Fan et al., 2020). The pre-decision activity in both regions is linked causally to decision behavior (Moore and Fallah, 2001; Ding and Gold, 2012b; Santacruz et al., 2017; Bollimunta et al., 2018; Doi et al., 2020). The similarity also extends to decision evaluation, as we show here that both regions carry information about accuracy expectation and reward expectation.
Despite these similarities, it is also clear that the caudate is not simply a relay station for FEF output. There are many notable regional differences even when the two regions are compared on the same task and in the same animals. For example, for a simple saccade task with reward manipulations, reward expectation-related information tends to be multiplexed with choice-selective activity in FEF, whereas it is encoded directly by a subset of caudate neurons (Ding and Hikosaka, 2006). FEF and caudate activity encoding reward context information also shows different temporal dynamics (Ding, 2015). For a visual motion-discrimination task, pre-decision FEF activity reflects motion evidence accumulation until a threshold level that is related to decision commitment, whereas caudate activity follows evidence accumulation only in the earlier phase of decision process (Ding and Gold, 2010, 2012a; Ding, 2015). For the asymmetric-reward motion-discrimination task used here, FEF activity is more directly linked to monkeys’ reward biases in evidence accumulation (Fan et al., 2020). Our new results document additional regional differences in decision evaluation and adjustment. Specifically, the greater prevalence of accuracy expectation signals in caudate activity and the closer link between caudate activity and the monkeys’ sequential behavioral adjustments support the idea that the caudate is more directly involved in tuning the decision process. This idea is further supported by previous observations that post-action caudate microstimulation can gradually bias RTs of a specific saccade (Nakamura and Hikosaka, 2006; Williams and Eskandar, 2006) and that caudate microstimulation during decision formation induces behavioral effects that mimics the monkeys’ voluntary reward bias strategies (Doi et al., 2020).
Further arguing against a direct relay scheme, the direct excitatory FEF→caudate projection contradicts the opposite directions of how accuracy expectation-related encoding in FEF and caudate neurons evolves over the course of a trial (Fig. 8D). The “sign flip” may be mediated by striatal inhibitory interneurons. Because these neurons are sparse relative to the striatal projection neurons that we recorded, future recordings using cell-type-specific sampling techniques are needed to determine the involvement of striatal interneurons in decision-related computations. The “sign flip” may also reflect additional sources of evaluative signals to the caudate. For example, the supplementary eye field has projection fields in the caudate that overlap with those of FEF, and its neural activity is mostly negatively correlated with confidence on a value-based decision task (Parthasarathy et al., 1992; So and Stuphorn, 2016). Striatum-projecting OFC neurons may provide a negative reward expectation signal to caudate (Hirokawa et al., 2019).
The present results and our previous documentation of pre-decision activity in FEF and caudate neurons, indicate that both regions are involved in both the formation and evaluation of decisions. We did not observe any relationship between activity related to decision formation and evaluation at the single-neuron level. For example, neurons with and without modulation in their pre-decision activity (during motion viewing) were similarly likely to show modulation by evaluative signals in their post-decision activity. The sign of a neuron's post-decision modulation by accuracy expectation or reward expectation also appeared unrelated to its pre-decision (during motion viewing) modulation by choice, reward context, or motion coherence. These results suggest that overlapping neural substrates may mediate decision formation and evaluation.
For our study, we used mathematically-derived estimates of accuracy expectation and reward expectation. Our results show that these quantities relate to both behavior and neural activity, lending credence to our premise that these quantities are a useful starting point for understanding how the brain uses expectations to evaluate and adjust behavior. Nevertheless, how the quantities we computed relate to the actual quantities used in the brain remains a challenging question. A major hurdle is the lack of a paradigm that can distinguish different forms of evaluative signals and are amenable to neurophysiological studies. For example, monkeys can be trained on post-decision wager tasks, but it is difficult to ensure that the wagers are based strictly on accuracy or reward expectation. Human subjects may be instructed carefully to report accuracy expectation, reward expectation, or choice confidence, but invasive neural recordings in normal subjects are unethical. The advancement of intracranial recordings in certain patient populations may offer unprecedented opportunities to understand how decision evaluation is implemented in the human brain.
In summary, we used a task design with independent manipulations of sensory evidence and reward associations to decouple accuracy and reward expectations. We found that a substantial fraction of caudate and FEF neurons encode these two different evaluative signals in their post-decision activity, but with regional differences in their prevalence, time course, and associations with behavior. These results highlight the diversity of signals and brain regions that contribute to how decisions are formed, evaluated, and adjusted to achieve particular goals.
References
- Basten U, Biele G, Heekeren HR, Fiebach CJ (2010) How the brain integrates costs and benefits during decision making. Proc Natl Acad Sci U S A 107:21767–21772. 10.1073/pnas.0908104107 [DOI] [PMC free article] [PubMed] [Google Scholar]
- Bogacz R (2007) Optimal decision-making theories: linking neurobiology with behaviour. Trends Cogn Sci 11:118–125. 10.1016/j.tics.2006.12.006 [DOI] [PubMed] [Google Scholar]
- Bollimunta A, Bogadhi AR, Krauzlis RJ (2018) Comparing frontal eye field and superior colliculus contributions to covert spatial attention. Nat Commun 9:3553. 10.1038/s41467-018-06042-2 [DOI] [PMC free article] [PubMed] [Google Scholar]
- Caziot B, Mamassian P (2021) Perceptual confidence judgments reflect self-consistency. J Vis 21:8. 10.1167/jov.21.12.8 [DOI] [PMC free article] [PubMed] [Google Scholar]
- Daw ND, Doya K (2006) The computational neurobiology of learning and reward. Curr Opin Neurobiol 16:199–204. 10.1016/j.conb.2006.03.006 [DOI] [PubMed] [Google Scholar]
- Desender K, Boldt A, Verguts T, Donner TH (2019a) Confidence predicts speed–accuracy tradeoff for subsequent decisions. Elife 8:e43499. 10.7554/eLife.43499 [DOI] [PMC free article] [PubMed] [Google Scholar]
- Desender K, Murphy P, Boldt A, Verguts T, Yeung N (2019b) A postdecisional neural marker of confidence predicts information-seeking in decision-making. J Neurosci 39:3309–3319. 10.1523/JNEUROSCI.2620-18.2019 [DOI] [PMC free article] [PubMed] [Google Scholar]
- Ding L (2015) Distinct dynamics of ramping activity in the frontal cortex and caudate nucleus in monkeys. J Neurophysiol 114:1850–1861. 10.1152/jn.00395.2015 [DOI] [PMC free article] [PubMed] [Google Scholar]
- Ding L, Gold JI (2010) Caudate encodes multiple computations for perceptual decisions. J Neurosci 30:15747–15759. 10.1523/JNEUROSCI.2894-10.2010 [DOI] [PMC free article] [PubMed] [Google Scholar]
- Ding L, Gold JI (2012a) Neural correlates of perceptual decision making before, during, and after decision commitment in monkey frontal eye field. Cereb Cortex 22:1052–1067. 10.1093/cercor/bhr178 [DOI] [PMC free article] [PubMed] [Google Scholar]
- Ding L, Gold JI (2012b) Separate, causal roles of the caudate in saccadic choice and execution in a perceptual decision task. Neuron 75:865–874. 10.1016/j.neuron.2012.07.021 [DOI] [PMC free article] [PubMed] [Google Scholar]
- Ding L, Hikosaka O (2006) Comparison of reward modulation in the frontal eye field and caudate of the macaque. J Neurosci 26:6695–6703. 10.1523/JNEUROSCI.0836-06.2006 [DOI] [PMC free article] [PubMed] [Google Scholar]
- Doi T, Fan Y, Gold JI, Ding L (2020) The caudate nucleus contributes causally to decisions that balance reward and uncertain visual information. eLife 9:e56694. 10.7554/eLife.56694 [DOI] [PMC free article] [PubMed] [Google Scholar]
- Fan Y, Gold JI, Ding L (2018) Ongoing, rational calibration of reward-driven perceptual biases. eLife 7:e36018. 10.7554/eLife.36018 [DOI] [PMC free article] [PubMed] [Google Scholar]
- Fan Y, Gold JI, Ding L (2020) Frontal eye field and caudate neurons make different contributions to reward-biased perceptual decisions. Elife 9:e60535. 10.7554/eLife.60535 [DOI] [PMC free article] [PubMed] [Google Scholar]
- Feng S, Holmes P, Rorie A, Newsome WT (2009) Can monkeys choose optimally when faced with noisy stimuli and unequal rewards? PLoS Comput Biol 5:e1000284. 10.1371/journal.pcbi.1000284 [DOI] [PMC free article] [PubMed] [Google Scholar]
- Fetsch CR, Kiani R, Newsome WT, Shadlen MN (2014) Effects of cortical microstimulation on confidence in a perceptual decision. Neuron 83:797–804. 10.1016/j.neuron.2014.07.011 [DOI] [PMC free article] [PubMed] [Google Scholar]
- Hebart MN, Haynes J-D, Donner TH, Schriever Y (2016) The relationship between perceptual decision variables and confidence in the human brain. Cereb Cortex 26:118–130. 10.1093/cercor/bhu181 [DOI] [PubMed] [Google Scholar]
- Hirokawa J, Vaughan A, Masset P, Ott T, Kepecs A (2019) Frontal cortex neuron types categorically encode single decision variables. Nature 576:446–451. 10.1038/s41586-019-1816-9 [DOI] [PMC free article] [PubMed] [Google Scholar]
- Kawagoe R, Takikawa Y, Hikosaka O (1998) Expectation of reward modulates cognitive signals in the basal ganglia. Nat Neurosci 1:411–416. 10.1038/1625 [DOI] [PubMed] [Google Scholar]
- Kennerley SW, Behrens TE, Wallis JD (2011) Double dissociation of value computations in orbitofrontal and anterior cingulate neurons. Nat Neurosci 14:1581–1589. 10.1038/nn.2961 [DOI] [PMC free article] [PubMed] [Google Scholar]
- Kepecs A, Uchida N, Zariwala HA, Mainen ZF (2008) Neural correlates, computation and behavioural impact of decision confidence. Nature 455:227–231. 10.1038/nature07200 [DOI] [PubMed] [Google Scholar]
- Kiani R, Corthell L, Shadlen MN (2014) Choice certainty is informed by both evidence and decision time. Neuron 84:1329–1342. 10.1016/j.neuron.2014.12.015 [DOI] [PMC free article] [PubMed] [Google Scholar]
- Kiani R, Shadlen MN (2009) Representation of confidence associated with a decision by neurons in the parietal cortex. Science 324:759–764. [DOI] [PMC free article] [PubMed] [Google Scholar]
- Kim JN, Shadlen MN (1999) Neural correlates of a decision in the dorsolateral prefrontal cortex of the macaque. Nat Neurosci 2:176–185. 10.1038/5739 [DOI] [PubMed] [Google Scholar]
- Lak A, et al. (2020a) Reinforcement biases subsequent perceptual decisions when confidence is low, a widespread behavioral phenomenon. Elife 9:e49834. 10.7554/eLife.49834 [DOI] [PMC free article] [PubMed] [Google Scholar]
- Lak A, Nomoto K, Keramati M, Sakagami M, Kepecs A (2017) Midbrain dopamine neurons signal belief in choice accuracy during a perceptual decision. Curr Biol 27:821–832. 10.1016/j.cub.2017.02.026 [DOI] [PMC free article] [PubMed] [Google Scholar]
- Lak A, Okun M, Moss MM, Gurnani H, Farrell K, Wells MJ, Reddy CB, Kepecs A, Harris KD, Carandini M (2020b) Dopaminergic and prefrontal basis of learning from sensory confidence and reward value. Neuron 105:700–711.e6. 10.1016/j.neuron.2019.11.018 [DOI] [PMC free article] [PubMed] [Google Scholar]
- Lau B, Glimcher PW (2008) Value representations in the primate striatum during matching behavior. Neuron 58:451–463. 10.1016/j.neuron.2008.02.021 [DOI] [PMC free article] [PubMed] [Google Scholar]
- Lauwereyns J, Takikawa Y, Kawagoe R, Kobayashi S, Koizumi M, Coe B, Sakagami M, Hikosaka O (2002a) Feature-based anticipation of cues that predict reward in monkey caudate nucleus. Neuron 33:463–473. 10.1016/S0896-6273(02)00571-8 [DOI] [PubMed] [Google Scholar]
- Lauwereyns J, Watanabe K, Coe B, Hikosaka O (2002b) A neural correlate of response bias in monkey caudate nucleus. Nature 418:413–417. 10.1038/nature00892 [DOI] [PubMed] [Google Scholar]
- Locke SM, Gaffin-Cahn E, Hosseinizaveh N, Mamassian P, Landy MS (2020) Priors and payoffs in confidence judgments. Atten Percept Psychophys 82:3158–3175. 10.3758/s13414-020-02018-x [DOI] [PMC free article] [PubMed] [Google Scholar]
- Middlebrooks PG, Sommer MA (2012) Neuronal correlates of metacognition in primate frontal cortex. Neuron 75:517–530. 10.1016/j.neuron.2012.05.028 [DOI] [PMC free article] [PubMed] [Google Scholar]
- Moore T, Fallah M (2001) Control of eye movements and spatial attention. Proc Natl Acad Sci U S A 98:1273–1276. 10.1073/pnas.98.3.1273 [DOI] [PMC free article] [PubMed] [Google Scholar]
- Nakamura K, Hikosaka O (2006) Facilitation of saccadic eye movements by postsaccadic electrical stimulation in the primate caudate. J Neurosci 26:12885–12895. 10.1523/JNEUROSCI.3688-06.2006 [DOI] [PMC free article] [PubMed] [Google Scholar]
- Nassar MR, Rumsey KM, Wilson RC, Parikh K, Heasly B, Gold JI (2012) Rational regulation of learning dynamics by pupil-linked arousal systems. Nat Neurosci 15:1040–1046. 10.1038/nn.3130 [DOI] [PMC free article] [PubMed] [Google Scholar]
- Nomoto K, Schultz W, Watanabe T, Sakagami M (2010) Temporally extended dopamine responses to perceptually demanding reward-predictive stimuli. J Neurosci 30:10692–10702. 10.1523/JNEUROSCI.4828-09.2010 [DOI] [PMC free article] [PubMed] [Google Scholar]
- Odegaard B, Grimaldi P, Cho SH, Peters MAK, Lau H, Basso MA (2018) Superior colliculus neuronal ensemble activity signals optimal rather than subjective confidence. Proc Natl Acad Sci U S A 115:E1588–E1597. 10.1073/pnas.1711628115 [DOI] [PMC free article] [PubMed] [Google Scholar]
- Padoa-Schioppa C, Assad JA (2006) Neurons in the orbitofrontal cortex encode economic value. Nature 441:223–226. 10.1038/nature04676 [DOI] [PMC free article] [PubMed] [Google Scholar]
- Parthasarathy HB, Schall JD, Graybiel AM (1992) Distributed but convergent ordering of corticostriatal projections: analysis of the frontal eye field and the supplementary eye field in the macaque monkey. J Neurosci 12:4468–4488. 10.1523/JNEUROSCI.12-11-04468.1992 [DOI] [PMC free article] [PubMed] [Google Scholar]
- Purcell BA, Kiani R (2016) Neural mechanisms of post-error adjustments of decision policy in parietal cortex. Neuron 89:658–671. 10.1016/j.neuron.2015.12.027 [DOI] [PMC free article] [PubMed] [Google Scholar]
- Rangel A, Camerer C, Montague PR (2008) A framework for studying the neurobiology of value-based decision making. Nat Rev Neurosci 9:545–556. 10.1038/nrn2357 [DOI] [PMC free article] [PubMed] [Google Scholar]
- Roesch MR, Olson CR (2003) Impact of expected reward on neuronal activity in prefrontal cortex, frontal and supplementary eye fields and premotor cortex. J Neurophysiol 90:1766–1789. 10.1152/jn.00019.2003 [DOI] [PubMed] [Google Scholar]
- Samejima K, Ueda Y, Doya K, Kimura M (2005) Representation of action-specific reward values in the striatum. Science 310:1337–1340. 10.1126/science.1115270 [DOI] [PubMed] [Google Scholar]
- Santacruz SR, Rich EL, Wallis JD, Carmena JM (2017) Caudate microstimulation increases value of specific choices. Curr Biol 27:3375–3383 e3. 10.1016/j.cub.2017.09.051 [DOI] [PMC free article] [PubMed] [Google Scholar]
- Schultz W (1998) Predictive reward signal of dopamine neurons. J Neurophysiol 80:1–27. 10.1152/jn.1998.80.1.1 [DOI] [PubMed] [Google Scholar]
- Schultz W (2015) Neuronal reward and decision signals: from theories to data. Physiol Rev 95:853–951. 10.1152/physrev.00023.2014 [DOI] [PMC free article] [PubMed] [Google Scholar]
- Seo M, Lee E, Averbeck BB (2012) Action selection and action value in frontal–striatal circuits. Neuron 74:947–960. 10.1016/j.neuron.2012.03.037 [DOI] [PMC free article] [PubMed] [Google Scholar]
- Simen P, Contreras D, Buck C, Hu P, Holmes P, Cohen JD (2009) Reward rate optimization in two-alternative decision making: empirical tests of theoretical predictions. J Exp Psychol Hum Percept Perform 35:1865–1897. 10.1037/a0016926 [DOI] [PMC free article] [PubMed] [Google Scholar]
- So N, Stuphorn V (2016) Supplementary eye field encodes confidence in decisions under risk. Cereb Cortex 26:764–782. [DOI] [PMC free article] [PubMed] [Google Scholar]
- Sutton RS, Barto AG (1998) Reinforcement learning: an introduction. Cambridge, MA: MIT Press. [Google Scholar]
- Teichert T, Yu D, Ferrera VP (2014) Performance monitoring in monkey frontal eye field. J Neurosci 34:1657–1671. 10.1523/JNEUROSCI.3694-13.2014 [DOI] [PMC free article] [PubMed] [Google Scholar]
- van den Berg R, Zylberberg A, Kiani R, Shadlen MN, Wolpert DM (2016) Confidence is the bridge between multi-stage decisions. Curr Biol 26:3157–3168. 10.1016/j.cub.2016.10.021 [DOI] [PMC free article] [PubMed] [Google Scholar]
- Wiecki TV, Sofer I, Frank MJ (2013) HDDM: hierarchical Bayesian estimation of the drift-diffusion model in python. Front Neuroinformatics 7:14. 10.3389/fninf.2013.00014 [DOI] [PMC free article] [PubMed] [Google Scholar]
- Williams ZM, Eskandar EN (2006) Selective enhancement of associative learning by microstimulation of the anterior caudate. Nat Neurosci 9:562–568. 10.1038/nn1662 [DOI] [PubMed] [Google Scholar]
- Yanike M, Ferrera VP (2014a) Interpretive monitoring in the caudate nucleus. eLife 3:e03727. 10.7554/eLife.03727 [DOI] [PMC free article] [PubMed] [Google Scholar]
- Yanike M, Ferrera VP (2014b) Representation of outcome risk and action in the anterior caudate nucleus. J Neurosci 34:3279–3290. 10.1523/JNEUROSCI.3818-13.2014 [DOI] [PMC free article] [PubMed] [Google Scholar]
- Yu AJ, Dayan P (2005) Uncertainty, neuromodulation, and attention. Neuron 46:681–692. 10.1016/j.neuron.2005.04.026 [DOI] [PubMed] [Google Scholar]
- Zariwala HA, Kepecs A, Uchida N, Hirokawa J, Mainen ZF (2013) The limits of deliberation in a perceptual decision task. Neuron 78:339–351. 10.1016/j.neuron.2013.02.010 [DOI] [PMC free article] [PubMed] [Google Scholar]


