

Significance
Existing targeted therapies for solid tumors harboring FGFR2 alterations include pan-FGFR inhibitors, which often cannot be dosed to maximum efficacy due to FGFR1- and FGFR4-mediated toxicities. The structural similarity among FGFR family members has thwarted conventional approaches to structure-based design of FGFR2-selective inhibitors, so we used long-timescale molecular dynamics simulations to identify differential motions of FGFR2 and FGFR1 that could be leveraged to design FGFR2-selective inhibitors. Our efforts led to lirafugratinib (RLY-4008), an FGFR2 inhibitor exhibiting substantial selectivity over other FGFRs. Lirafugratinib was reported to have a 73% objective response rate in early clinical studies in FGFR-inhibitor naive, FGFR2 fusion-positive intrahepatic cholangiocarcinoma patients treated orally (once daily doses ≥70 mg) without inducing clinically significant adverse effects by inhibiting off-targets.
Keywords: FGFR2 inhibitor, cholangiocarcinoma, motion-based drug design, molecular dynamics simulation
Abstract
Fibroblast growth factor receptor (FGFR) kinase inhibitors have been shown to be effective in the treatment of intrahepatic cholangiocarcinoma and other advanced solid tumors harboring FGFR2 alterations, but the toxicity of these drugs frequently leads to dose reduction or interruption of treatment such that maximum efficacy cannot be achieved. The most common adverse effects are hyperphosphatemia caused by FGFR1 inhibition and diarrhea due to FGFR4 inhibition, as current therapies are not selective among the FGFRs. Designing selective inhibitors has proved difficult with conventional approaches because the orthosteric sites of FGFR family members are observed to be highly similar in X-ray structures. In this study, aided by analysis of protein dynamics, we designed a selective, covalent FGFR2 inhibitor. In a key initial step, analysis of long-timescale molecular dynamics simulations of the FGFR1 and FGFR2 kinase domains allowed us to identify differential motion in their P-loops, which are located adjacent to the orthosteric site. Using this insight, we were able to design orthosteric binders that selectively and covalently engage the P-loop of FGFR2. Our drug discovery efforts culminated in the development of lirafugratinib (RLY-4008), a covalent inhibitor of FGFR2 that shows substantial selectivity over FGFR1 (~250-fold) and FGFR4 (~5,000-fold) in vitro, causes tumor regression in multiple FGFR2-altered human xenograft models, and was recently demonstrated to be efficacious in the clinic at doses that do not induce clinically significant hyperphosphatemia or diarrhea.
Fibroblast growth factor receptor 2 (FGFR2) is a receptor tyrosine kinase that belongs to a family of four receptors (FGFR1–4). These kinases play crucial roles in development as well as in signaling cascades in mature cells that mediate cell division, growth, and differentiation (1, 2). Dysregulation of FGFR2 has been implicated in numerous cancers, most commonly in intrahepatic cholangiocarcinoma (iCCA) (3, 4). Oncogenic activation of FGFR2 can occur via three distinct types of genomic alterations—gene amplification, activating mutation, or chromosomal fusion (1). FGFR2 fusions occur in 10 to 15% of iCCA (5) and are also found in a variety of other tumor types (6, 7).
Clinical proof of concept of FGFR2 as a therapeutic target was validated by the observed efficacy of pan-FGFR inhibitors (pan-FGFRi) in patients with iCCA bearing FGFR2 fusions/rearrangements (8–11). However, FGFR1- and FGFR4-mediated toxicities and the emergence of on-target FGFR2 resistance mutations have limited the efficacy of existing pan-FGFRi. The most common adverse effect of pan-FGFRi is hyperphosphatemia (12–15) caused by the inhibition of FGFR1, which is required for phosphate reabsorption in the kidney (16), and diarrhea caused by FGFR4 inhibition (16). Elevated serum phosphate levels are reported in 55% to 81% of patients with iCCA in Phase 2 clinical trials (13–15) and require active management (such as dietary modification, phosphate binders, and dose reductions) or treatment interruptions (17, 18). Hyperphosphatemia has been observed with pan-FGFRi in both preclinical testing and in patients (19) and should be avoided to achieve maximum efficacy of an FGFR2 inhibitor (7).
The high similarity (sequence and structural) among the kinase domains of FGFR family members represents a significant challenge to the identification of FGFR2-selective inhibitors via structure-based design, suggesting that novel design approaches are needed. Here, we describe the design of selective FGFR2 inhibitors. We used long-timescale molecular dynamics (MD) simulations to identify differential protein motions between FGFR1 and FGFR2 and then leveraged those differences to target FGFR2 selectively. Simulations were initiated from crystal structures of apo FGFR1 and apo FGFR2, both of which feature an extended conformation of the P-loop. In the simulations of FGFR1, the P-loop quickly contracted from the extended conformation and became disordered. In the simulations of FGFR2, however, a somewhat extended conformation persisted, and the P-loop was far less flexible than that of FGFR1. This result suggested that the P-loop might be a suitable region for selective targeting of FGFR2.
Our initial design efforts aimed to covalently engage FGFR2 Cys491, a residue that lies at the tip of the extended P-loop and is also targeted by the covalent pan-FGFRi futibatinib (10, 20, 21). Simulations of FGFR1 binding one of our early selective compounds suggested that its selectivity arose because the compound stabilized the FGFR1 P-loop in an extended conformation with such a low degree of flexibility that covalent engagement of Cys488 (homologous to FGFR2 Cys491) was discouraged. Based on this insight, simulations were subsequently used to computationally screen prospective compounds that would bind stably in the FGFR2 binding pocket while achieving selectivity by favoring extended conformations of FGFR1. The screening results were then used to prioritize molecules for synthesis. Using this approach as part of an iterative process of optimization, our efforts culminated in the identification of lirafugratinib (RLY-4008), a highly selective, orally available small-molecule FGFR2 inhibitor to enter clinical development (22).
Results
MD Simulations Suggest Differential Dynamics and Conformations of the P-loop between FGFR1 and FGFR2.
We performed 25 µs MD simulations initiated from apo crystal structures of the FGFR1 (PDB ID: 4RWI) and FGFR2 (PDB ID: 1GJO) kinase domains (three simulations for each isoform) to glean insight into the differential dynamics of these proteins (Fig. 1 A and B, and see SI Appendix, Table S1 for a full list of simulations). We observed that the P-loop was one of the regions that displayed a substantial divergence in protein motion between the two family members (Fig. 1A and SI Appendix, Fig. S1 A and B). The P-loop is in an extended conformation in both crystal structures, but in the simulations of FGFR1, the P-loop quickly contracted from the extended conformation and became disordered. In the simulations of FGFR2, however, the P-loop maintained a somewhat extended conformation, and aside from the region containing Cys491, the P-loop was more rigid than that of FGFR1 (Fig. 1B and Movies S1 and S2; amino acids are numbered according to the FGFR2-IIIc isoform). We conjectured that the differential behavior in the P-loops might be leveraged for selective targeting of FGFR2.
Fig. 1.
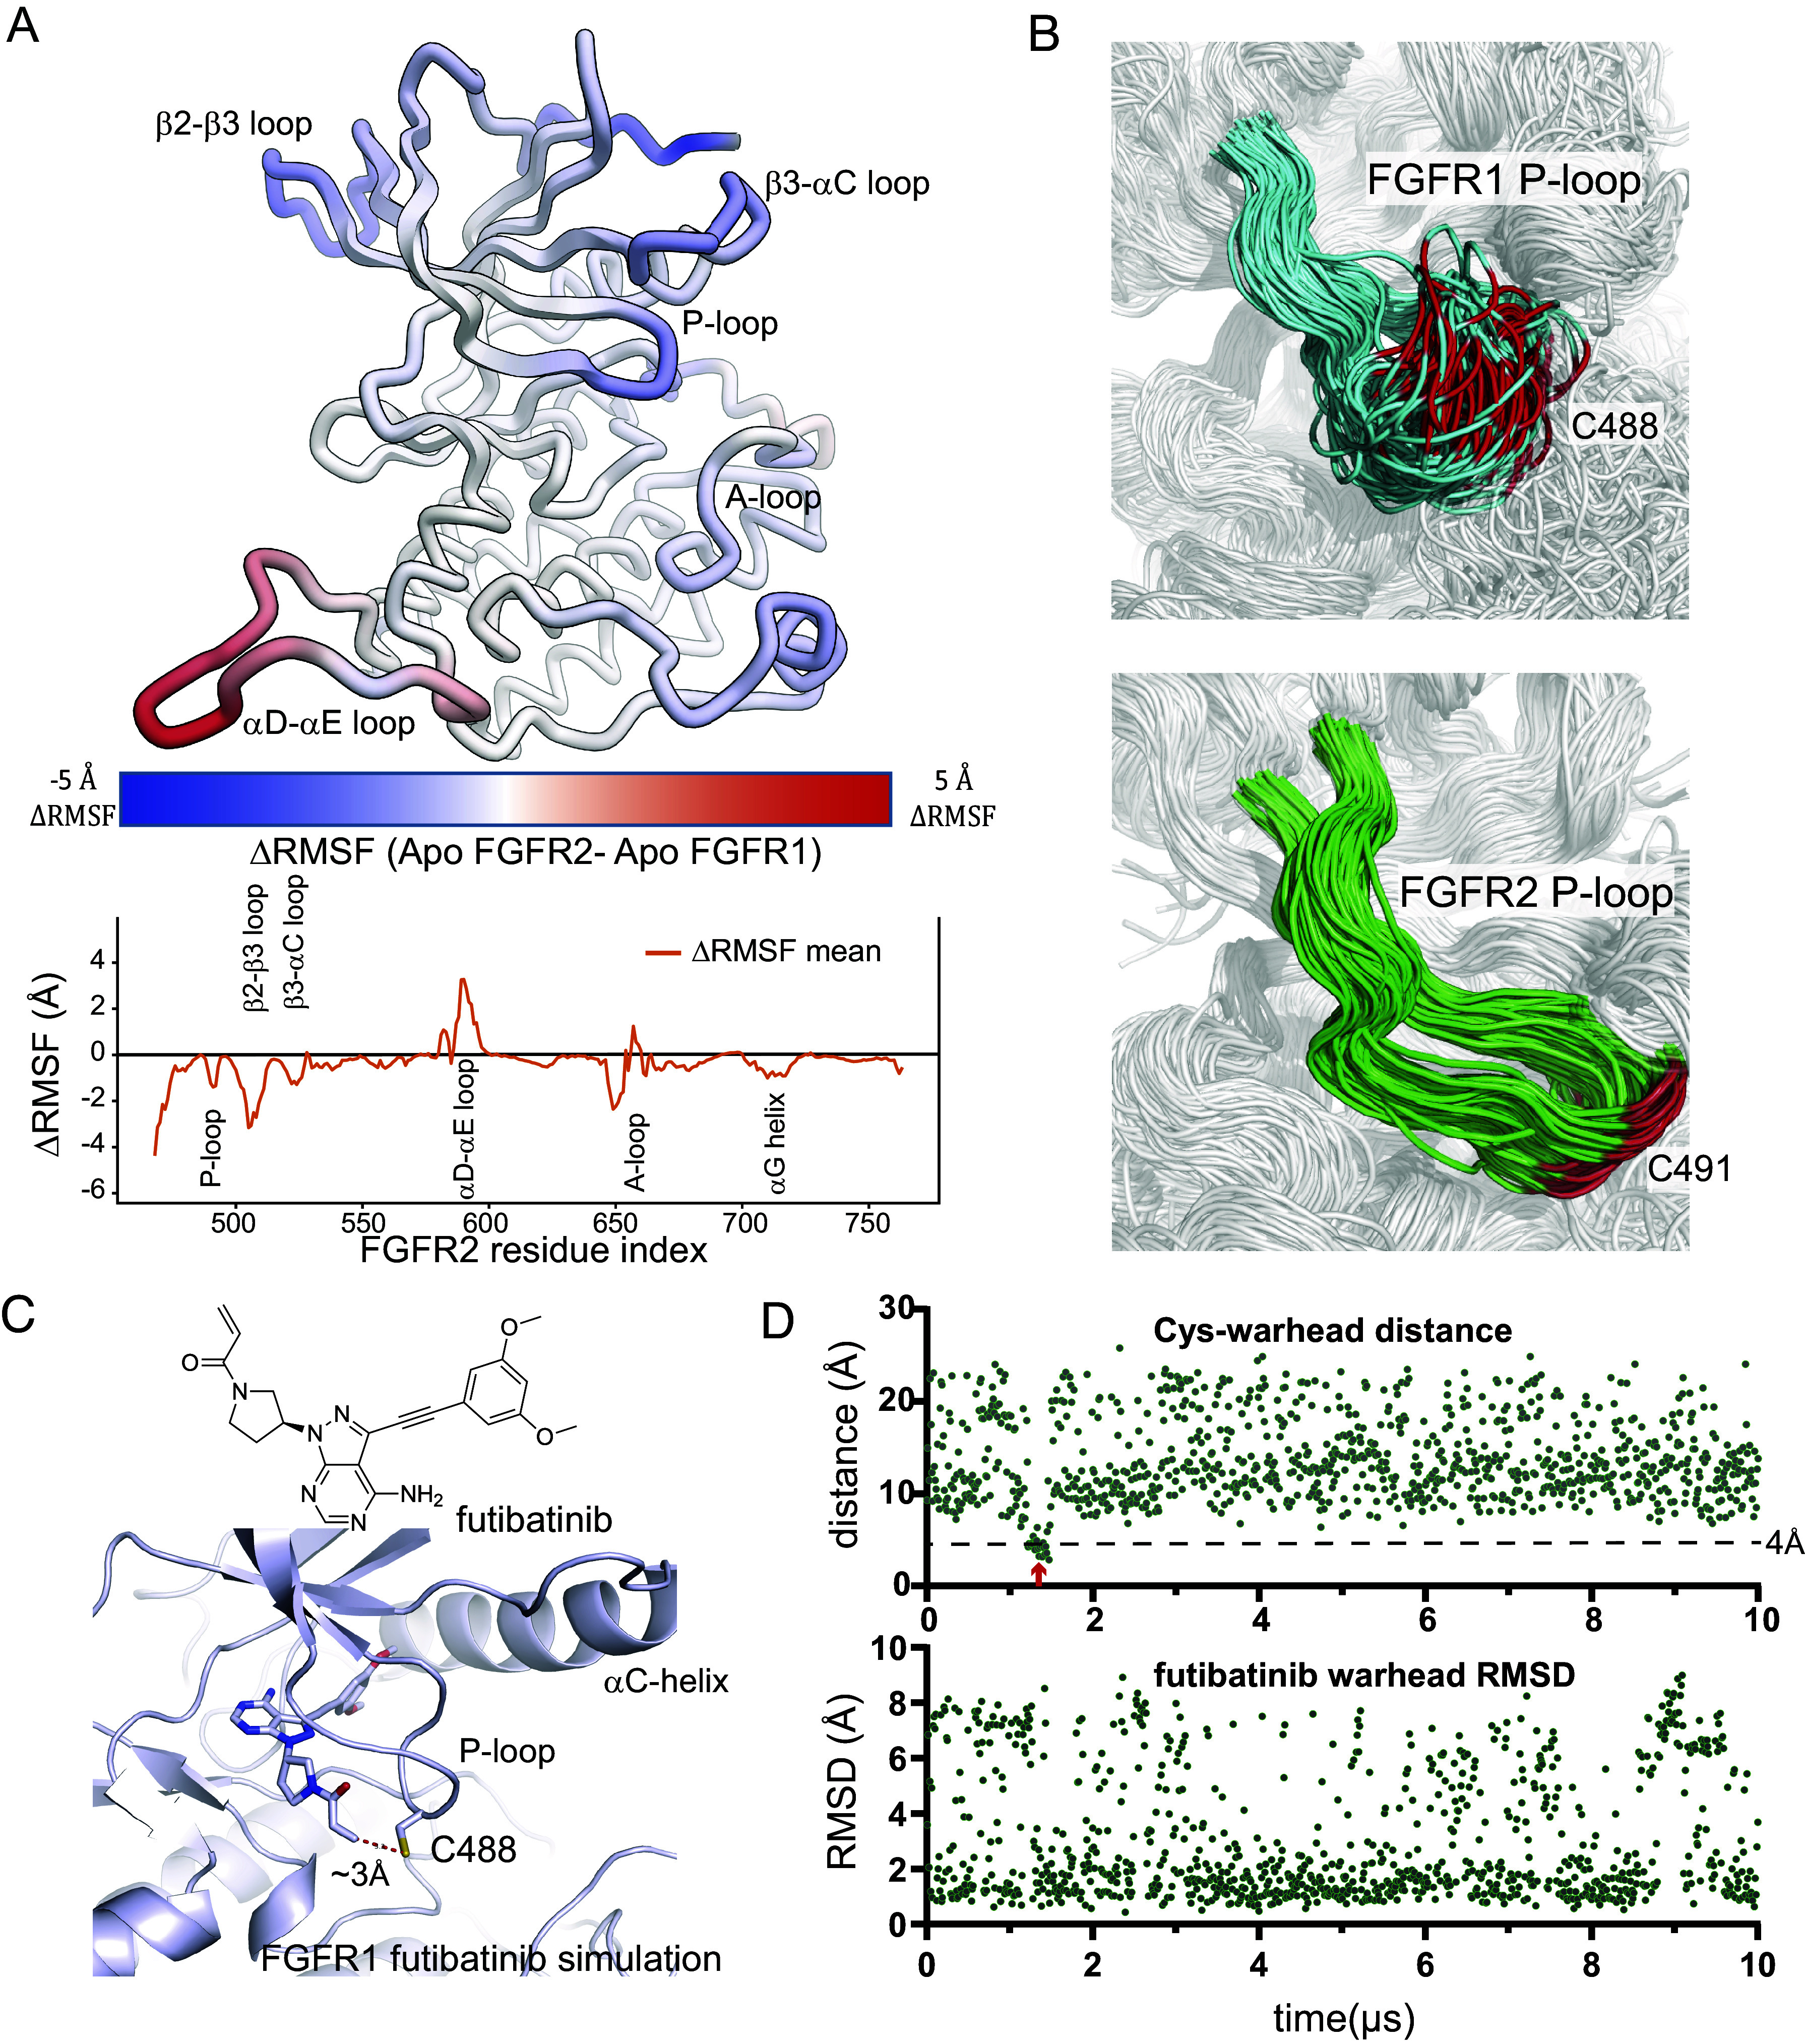
The P-loop region has different dynamics in FGFR1 and FGFR2. (A) The structure of FGFR2 is colored according to the difference in the rms fluctuations (ΔRMSF) of the Cα atoms between apo simulations of FGFR1 and FGFR2 (Top). ΔRMSF values are plotted for each residue (Bottom). Individual RMSF plots are reported in SI Appendix, Fig. S1A. (B) Equally spaced frames from a 25 µs simulation of apo FGFR1 (Top, cyan) and apo FGFR2 (Bottom, green) are superposed to highlight the differences in P-loop dynamics. Cys488 of FGFR1 and Cys491 of FGFR2 are shown in red. (C) A frame from a simulation of FGFR1 with futibatinib bound, in which the covalent warhead sampled a distance less than 4 Å from the C488 sulfur atom (marked with a red arrow in panel D); the simulation started from a structure in which futibatinib is in a reversible binding mode with FGFR1 (PDB ID: 6MZQ). (D) For the same simulation, the distance between the futibatinib warhead amide beta-carbon atom and the C488 sulfur atom is plotted (Top). The RMSD of the futibatinib warhead with respect to the first frame of the simulation is also plotted (Bottom).
Experimentally, we demonstrated previously that futibatinib exhibits very fast labeling of both FGFR1 and FGFR2 (22), indicating that both P-loops afford a productive encounter with the flexible, electrophilic warhead of futibatinib. To better understand the mechanism by which the FGFR1 P-loop engages futibatinib, and thereby inform the design of molecules that limit such productive interactions, we performed simulations of futibatinib bound noncovalently to FGFR1. In these simulations, the warhead attached at the 1 position of the pyrazolo pyrimidine core was highly dynamic (Fig. 1D), and the high flexibility of the P-loop allowed it to readily sample the short Cys-warhead distances (Fig. 1 C and D and SI Appendix, Fig. S1C) that are required for efficient covalent engagement. This finding is consistent with X-ray structures of FGFR1 covalently bound with futibatinib, in which the P-loop is largely unresolved and likely disordered (23). We hypothesized that we could take advantage of the distinct ensembles of P-loop conformations in FGFR1 and FGFR2 to design a ligand that could discriminate against FGFR1 by stabilizing its flexible P-loop (and limiting the dynamic nature of the warhead), while still being able to efficiently target the P-loop Cys of FGFR2. The FGFR2 P-loop was already stable in the apo simulation, so we anticipated that stabilizing effects of a ligand might not impact covalent labeling in this case. Designing a compound whose warhead would reside under the extended P-loop conformation preferentially observed for FGFR2 seemed a promising strategy.
Development of Compound 6, a Potent Covalent Inhibitor of FGFR2 with High Selectivity over FGFR1.
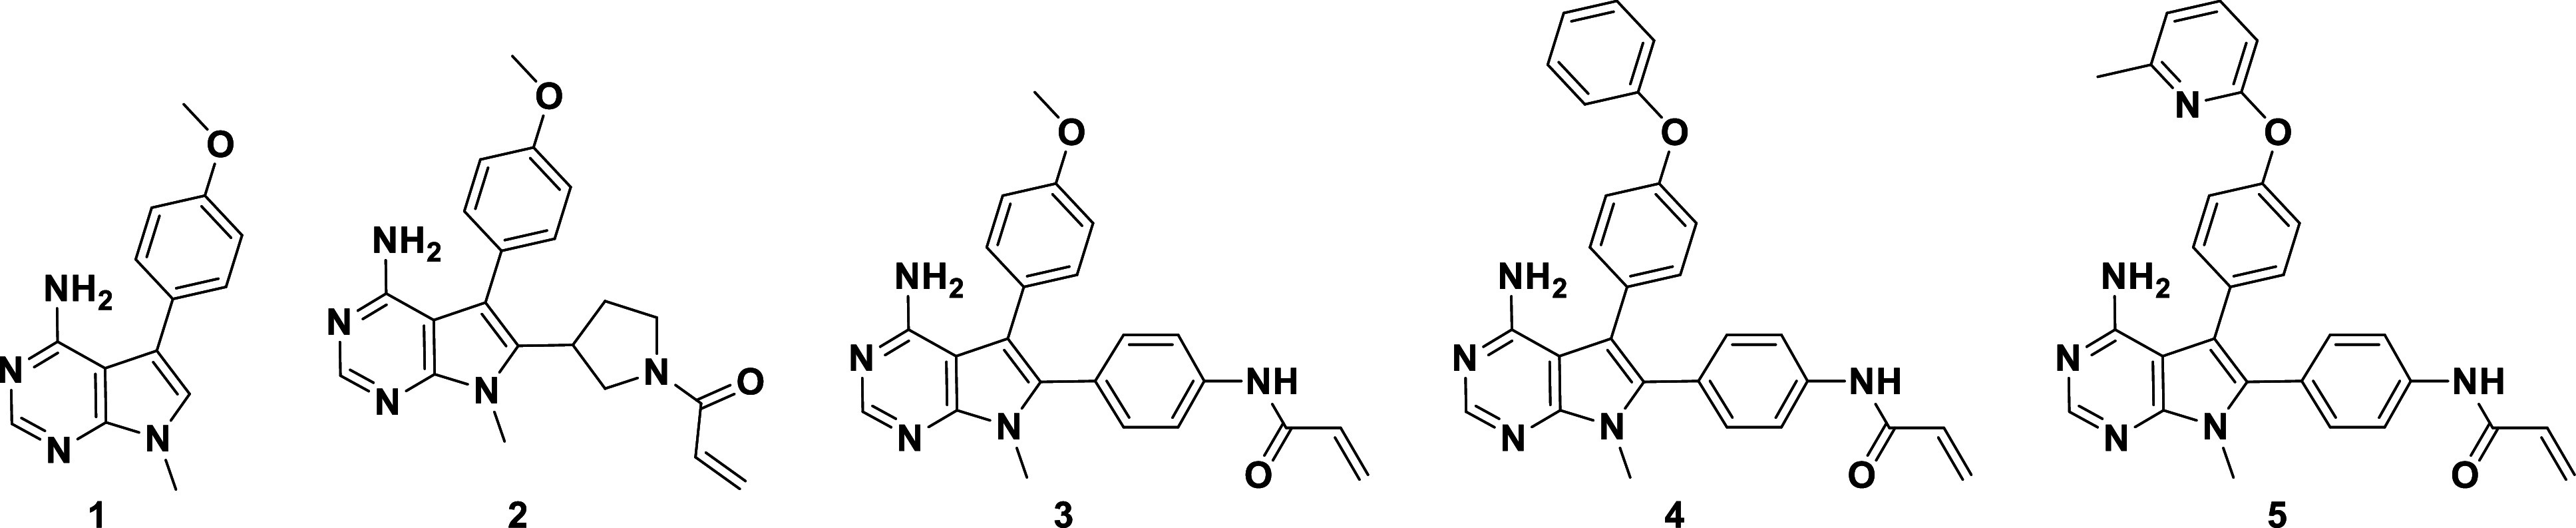
To identify a compound that would preferentially bind the extended P-loop conformation, we started from hinge-binding fragment 1 (Table 1), a nonselective low-micromolar inhibitor of FGFR1 and FGFR2. The IC50 values reported here were generated using FGFR Caliper assays. Initially, we used a traditional medicinal chemistry approach to improve potency and selectivity and began by adding a pyrrolidine acrylamide warhead in the 2-position of the pyrrolo pyrimidine core, resulting in compound 2, which had 10-fold improved potency against FGFR2, but no significant selectivity over FGFR1. Incorporating a phenyl linker, resulting in 3, led to a significant gain in potency against both FGFR1 and FGFR2, consistent with a higher level of covalent labeling driven mostly by increased reactivity of the acrylamide. We were able to obtain crystal structures of the 3-FGFR2 complex (PDB ID: 8SWE), both reversibly and covalently bound (the reversible complex is shown in SI Appendix, Fig. S2A). Only minor differences in binding pose and ligand interactions were observed between the structures; in the covalent complex, the pyrrolo pyrimidine core is slightly pulled away (~0.5 Å) from the hydrogen-bonding interactions at the hinge, but overall, the structures suggest a consistent binding mode before and after covalent reaction with Cys491.
Table 1.
Progression of hinge binder 1 into potent covalent inhibitor 5
| ||||||
|---|---|---|---|---|---|---|
| Caliper IC50 (µM) | R1/R2 Selectivity | Prolif. IC50 (µM) | ||||
| Compound | FGFR2 | FGFR1 | Caliper | Cell | SNU-16 | JMSU1 |
| 1 | 1.6 | 3.3 | 2 | ND | >10 | ND |
| 2 | 0.48 | 1.44 | 3 | 6 | 0.15 | 0.96 |
| 3 | 0.01 | 0.063 | 5 | 4 | 0.022 | 0.081 |
| 4 | 0.006 | 0.084 | 13 | 16 | 0.005 | 0.082 |
| 5 | 0.0001 | 0.0098 | 98 | 23 | 0.0006 | 0.014 |
While exploring further expansion into the back pocket of the active site [which is known to provide additional affinity against tyrosine kinases (24, 25)], we observed that including a biphenyl ether substituent in the 3-position (4) did not impact potency but did open the selectivity window to 13-fold. Extensive exploration of the structure–activity relationship for the back-pocket substituent showed that Me-pyridine-phenyl ether 5 further increased activity, resulting in a highly potent FGFR2 inhibitor with 98-fold selectivity over FGFR1. We characterized compound 5 in cellular pharmacodynamics (PD) and proliferation assays, including in the FGFR2-dependent SNU-16 cell line and FGFR1-dependent JMSU1 cell line, to assess cellular selectivity. SNU-16 and JMSU1 proliferation IC50 ratios showed that FGFR2 selectivity was maintained in cells without a shift in the cellular activity. However, compound 5, with its reactive phenyl-acrylamide warhead, exhibited instability in ADME assays, which complicated its utility as an in vivo tool compound.
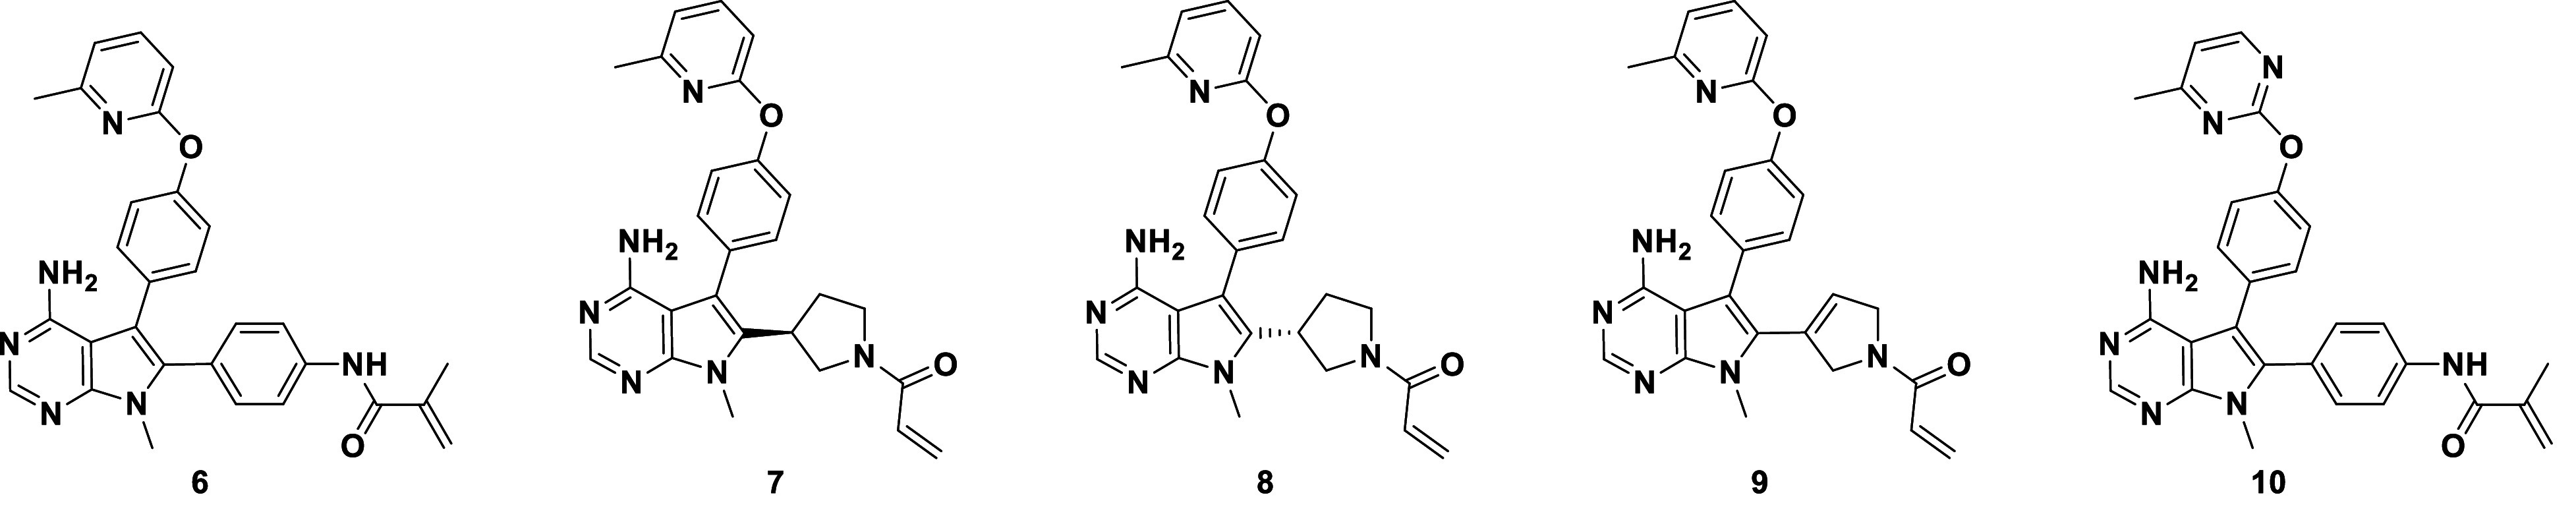
We attempted to tune the warhead reactivity by adding a methyl group to the acrylamide to achieve 6, conjecturing that we could increase compound stability and modulate reactivity toward FGFR (Table 2). We observed a 40-fold potency loss against both FGFR2 and FGFR1, but favorable selectivity was maintained, with 124-fold biochemical selectivity and 111-fold cellular selectivity (a ratio of the SNU-16 and JMSU1 proliferation IC50 values). Compound 6 was stable in plasma and blood across species, and the balance of potency and unbound exposure in mouse pharmacokinetic experiments enabled in vivo evaluation at doses that allowed us to assess varying degrees of FGFR1 and FGFR2 target engagement. Fig. 2A highlights the kinetic differences for the covalent inhibition mechanism: a ~15-fold increase in kinact for FGFR2 and comparable KI, which results in a ~60-fold selectivity ratio for kinact /KI. During the optimization process, we spot-checked kinact /KI selectivity and found it to track well with the selectivity windows observed in biochemical and cellular assays. This enabled us to drive SAR for this covalent hit series quickly based on simple, high-throughput assays. Compound 6 was also extensively profiled in vivo, demonstrating modulation of phospho-extracellular signal-regulated kinase (p-ERK) and phospho-FGFR2 (pFGFR2), as well as tumor regression in the FGFR2-amplified SNU-16 gastric cancer xenograft model (22).
Table 2.
Progression toward highly selective FGFR2 inhibitors, as demonstrated in biochemical and cell-based activity assays
| ||||||||
|---|---|---|---|---|---|---|---|---|
| Caliper IC50 (µM) | Prolif. IC50 (µM) | R1/R2 Selectivity | ||||||
| Compound | FGFR2 | FGFR1 | FGFR3 | FGFR4 | SNU-16 | JMSU1 | Caliper | Cell |
| 6 | 0.004 | 0.47 | 0.18 | 8 | 0.0036 | 0.4 | 124 | 111 |
| 7 | 0.009 | 0.312 | 0.06 | ND | 0.007 | 0.22 | 35 | 31 |
| 8 | 0.11 | 1.62 | 0.63 | ND | 0.068 | 1.47 | 15 | 22 |
| 9 | 0.006 | 0.25 | 0.11 | ND | 0.005 | 0.37 | 42 | 74 |
| 10 | 0.007 | 1.29 | 0.53 | 31 | 0.006 | 0.77 | 177 | 128 |
Fig. 2.
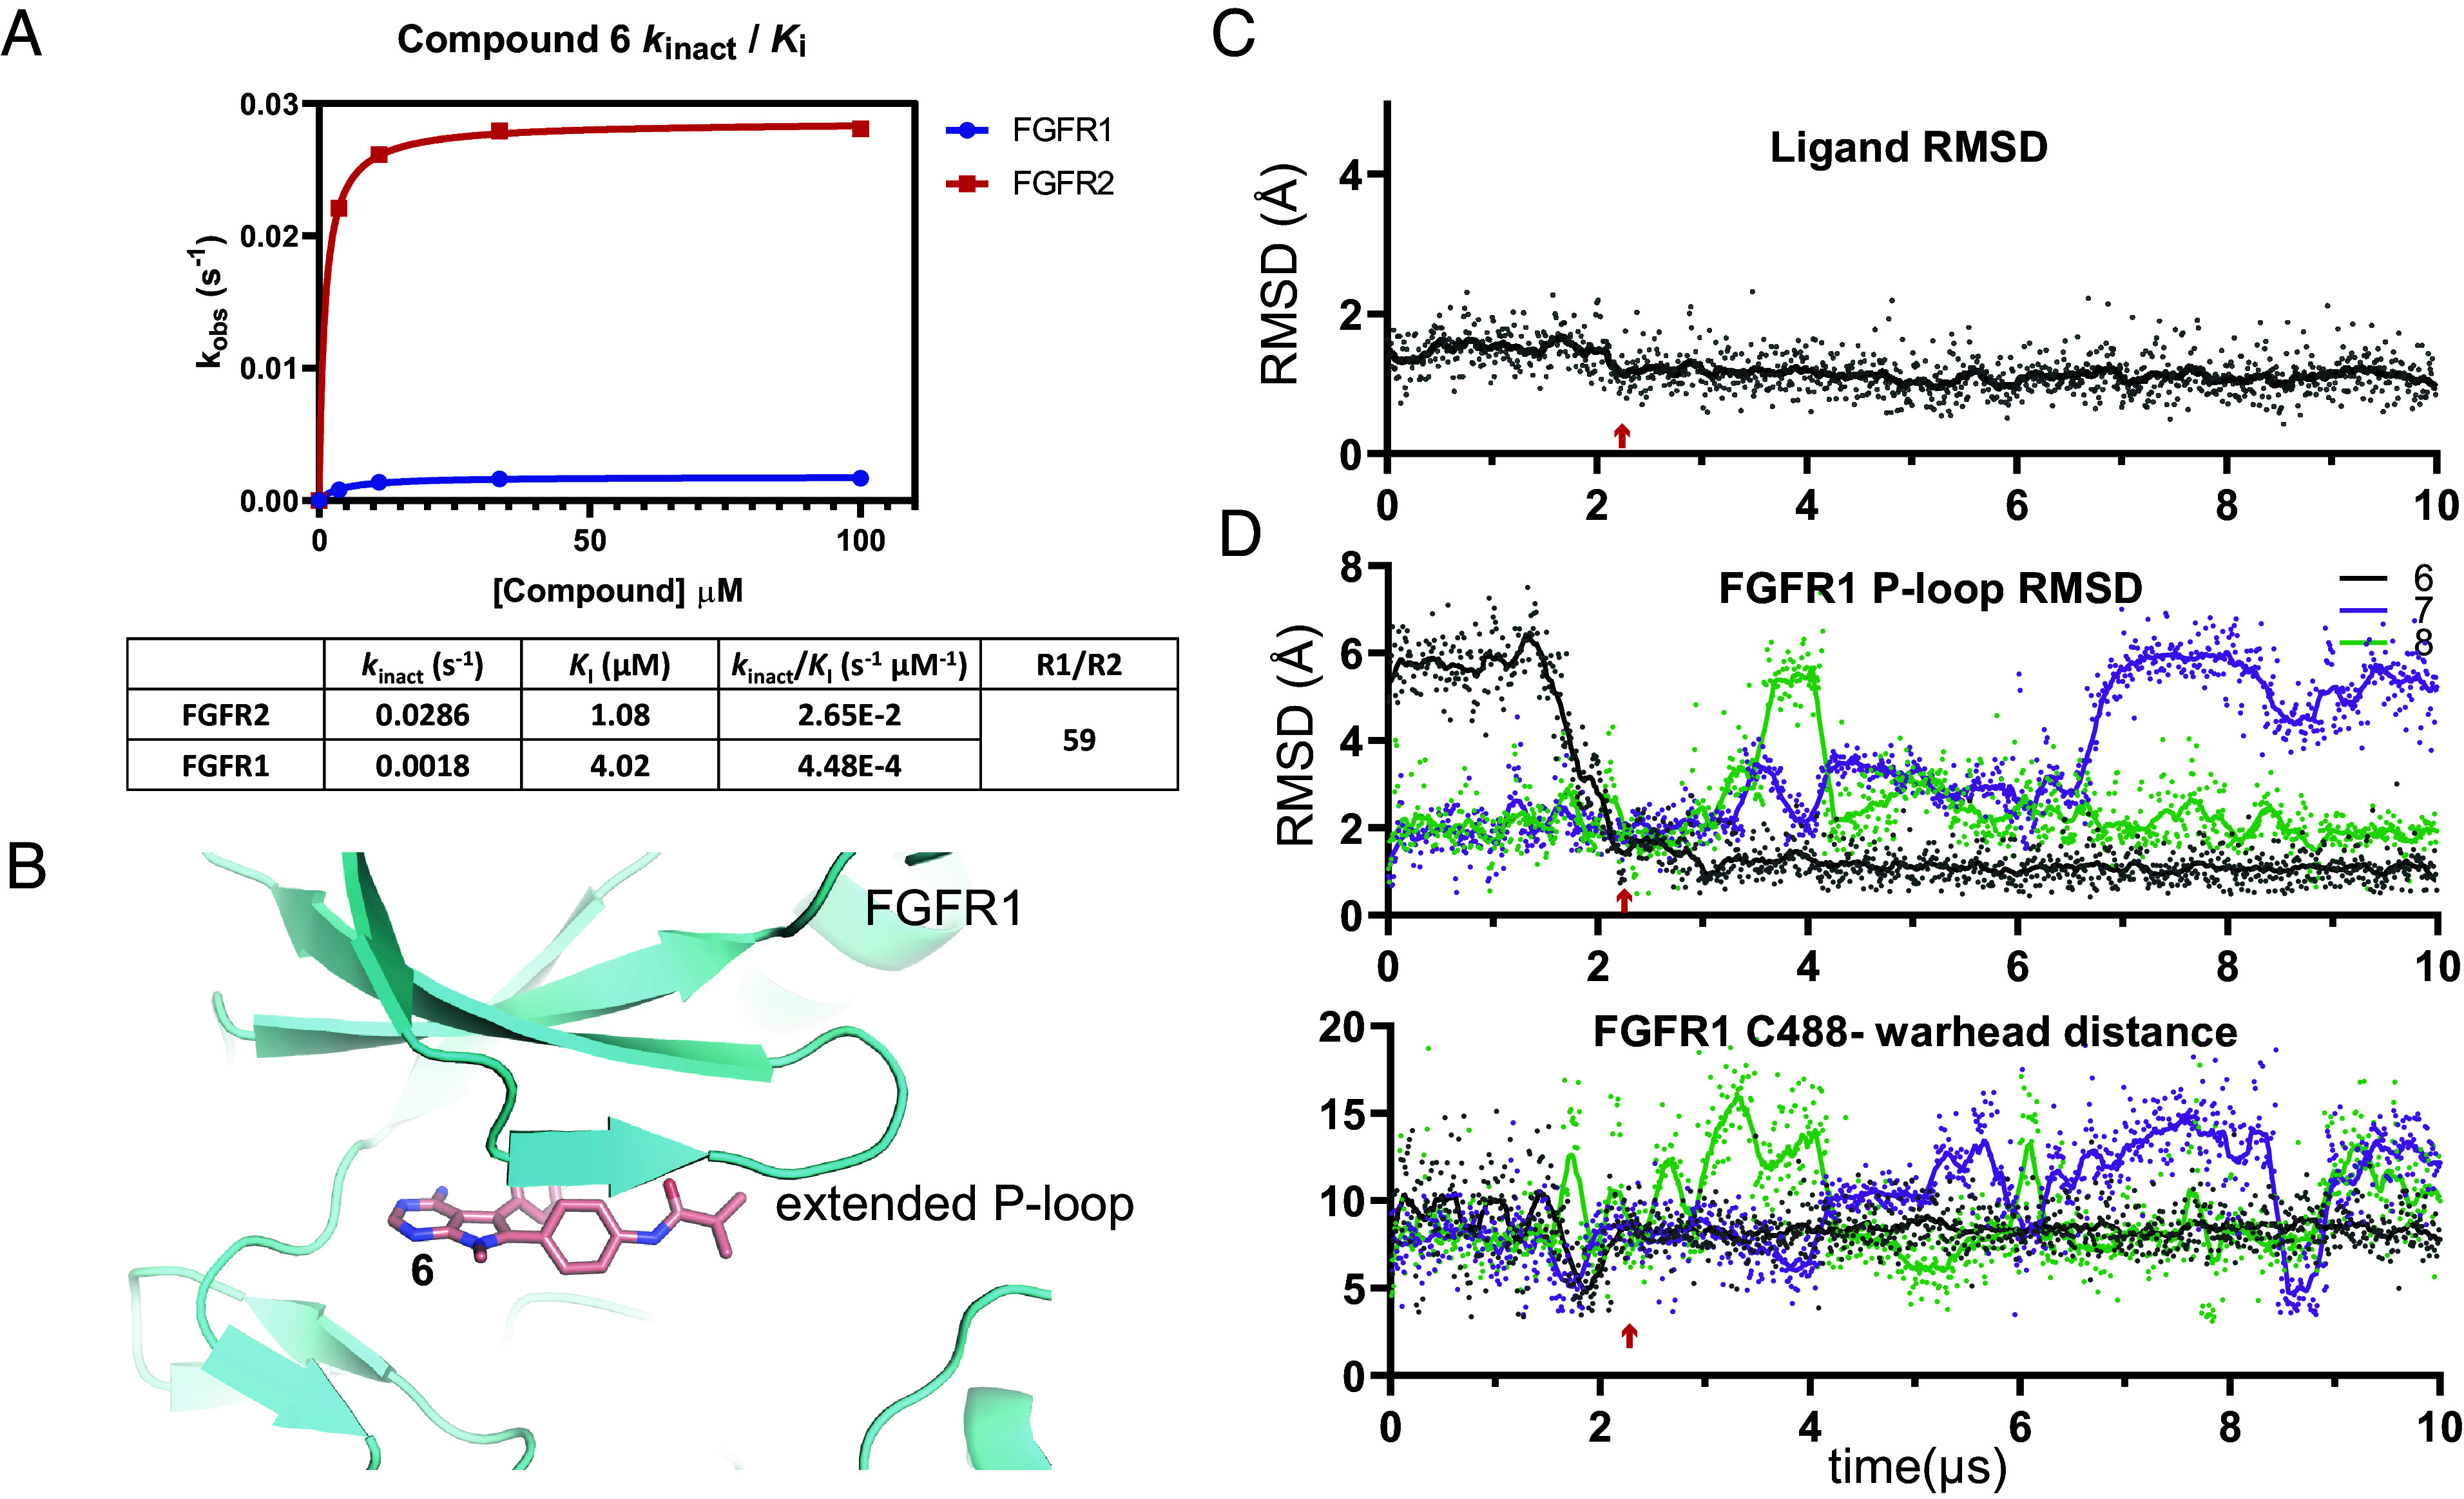
Compound 6 induces a stable extended conformation of the FGFR1 P-loop, which allows for selective covalent labeling of FGFR2. (A) Observed rate of inactivation against FGFR2 (red) and FGFR1 (blue) at different concentrations of 6 measured via liquid chromatography intact mass spectrometry, the resulting estimates of kinact and KI for the individual kinases, and the resulting selectivity ratio. (B) From the simulation of 6 bound to FGFR1, which started from the disordered conformation of the P-loop, a representative frame from after the extended P-loop conformation has been induced. (C) Plot of the RMSDs of 6 from the same simulation as in B with respect to the last frame of the simulation. (D) Plots of the RMSDs of the FGFR1 P-loop in a simulation with compound 6 (the same simulation as in B), and in simulations with compounds 7 and 8; the latter two simulations were initiated from the extended conformation of the P-loop (Top). For the same simulations as in the Top panel, plots of the distances between the acrylamide warhead carbon atom of compounds 6, 7, or 8 and the C488 sulfur atoms (Bottom). The red arrow marks the simulation frame in which the P-loop switched from the disordered to the extended conformation in the compound 6 simulation.
Stabilization of an Extended P-loop Conformation in Simulations of FGFR1 with Ligand Predicts Selectivity against FGFR1.
A 10 µs MD simulation of FGFR1 with 6, starting from a disordered P-loop conformation, revealed the fast formation of a stable, extended P-loop conformation (Fig. 2 B and C and Movie S3) in which Cys488 was locked into a position about 8 Å from the ligand (Fig. 2D), likely not allowing for a productive Cys-warhead encounter or covalent bond formation. In this extended conformation, we observed extensive van der Waals packing interactions between the methyl moiety of the pyrrolo pyrimidine core, the phenyl warhead linker, the methyl acrylamide moiety of 6, and P-loop residues 484 to 487 (SI Appendix, Fig. S2D). In a 10 µs simulation of FGFR2 bound to 6, the P-loop was also in an extended conformation, but this conformation did not differ substantially from that in the FGFR2 apo simulation or X-ray structure. Caliper assays with compound 6 show that covalent labeling of FGFR2 was efficient (Table 2). The efficiency of labeling, despite the extended conformation, may be a function of the closer Cys-warhead distances that were expected based on the simulation of 6 with FGFR2 (SI Appendix, Fig. S2 B, C, and E and Movie S4).
We subsequently screened promising ligands by first (noncovalently) docking the designed compounds to FGFR2 and then by performing 10 µs MD simulations starting from the docked pose to ensure the stability of the ligand in the binding site. For the compounds that had a good docking score and a stable FGFR2 binding pose, we conducted a counter screen for selectivity against FGFR1 by performing simulations of the candidates (not covalently bound) with FGFR1 starting from the extended P-loop pose. Compounds were prioritized for synthesis based on their ability to stabilize the FGFR1 P-loop in the extended conformation. The SAR trend observed for compounds 7, 8, and 9 further solidified the observation that conformational restriction and robust FGFR1 P-loop extension is crucial to achieving >100-fold selectivity. The pyrrolidine-based warheads of these compounds, although providing an improved physicochemical property profile through increased sp3 character, were not able to fully stabilize the FGFR1 P-loop in the extended state (Fig. 2D and Movies S5 and S6). Extensive SAR exploration of nonaromatic linked warheads did not yield compounds with the desired selectivity profile.
Simulation-Based Models of the Noncovalently Bound State Complement the Covalent X-ray Structure in Informing Optimization of the Back-Pocket Substituent on FGFR2.
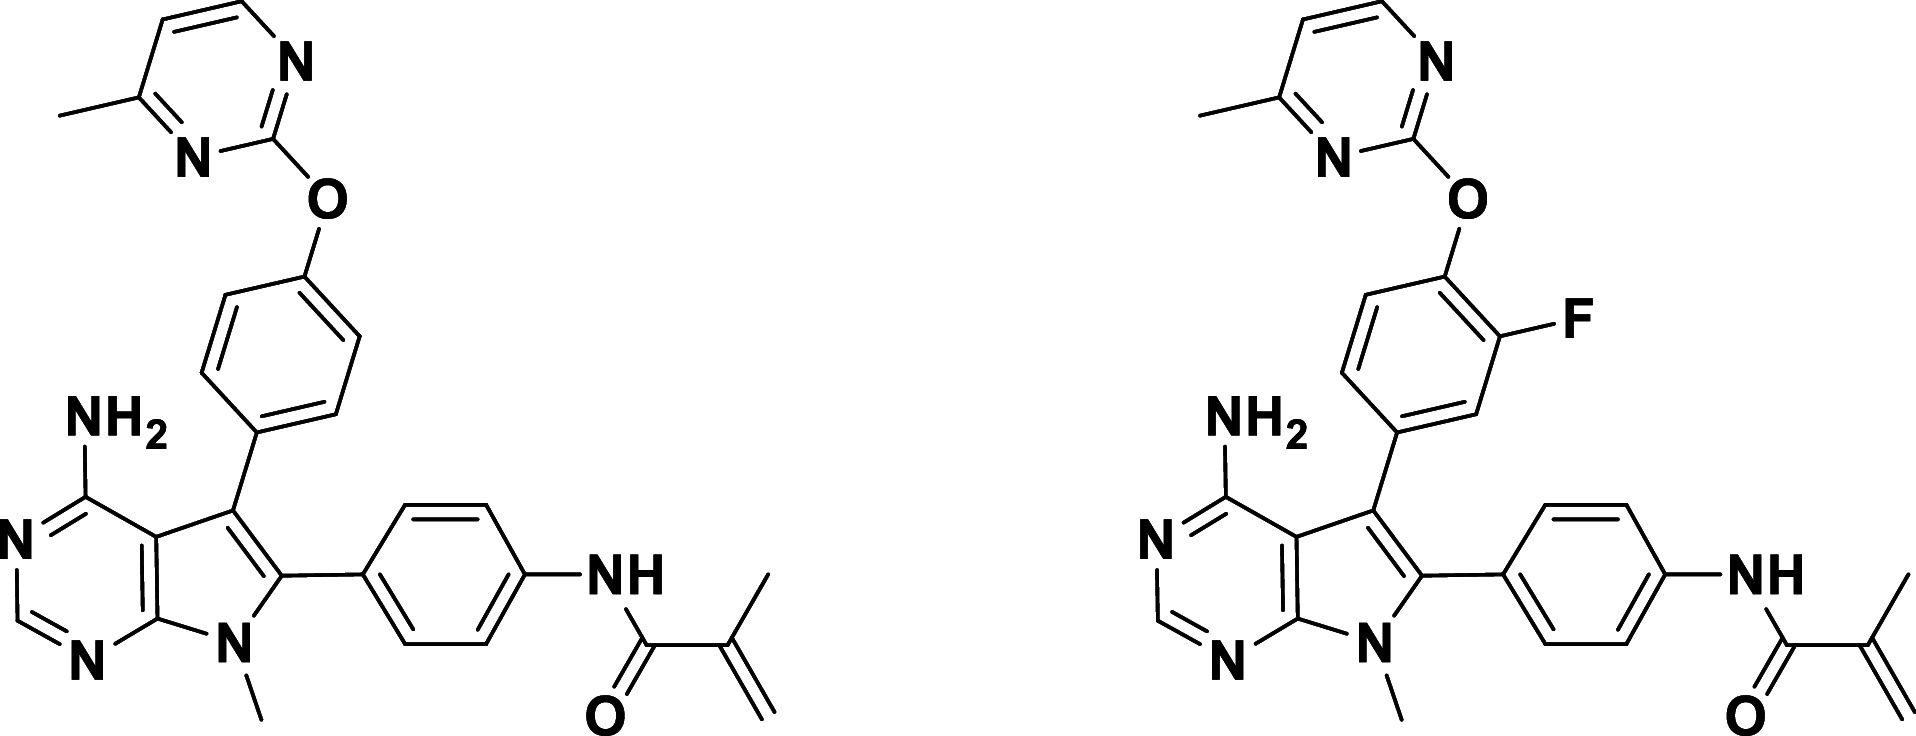
Next, the SAR for the back pocket was expanded with two goals in mind: i) to better understand the impact of occupancy and ligand conformation on FGFR2 affinity, and ii) to modulate the lipophilicity and solubility of this chemical series. The optimization process was guided by a docking model to predict the binding affinity of reversible binding to the FGFR2 active site. The FGFR2 crystal system used to obtain X-ray structures for compound 3 did not accommodate our selective front-runner compounds with the extended back-pocket substituent, so we were unable to design based on X-ray structures. However, we were able to generate a model based on ligand poses from simulation frames of 6 reversibly bound to FGFR2, in which N-lobe rotation had opened a larger back-pocket space to accommodate the biaryl ether group. The docking model proved predictive of reversible binding to FGFR2. The introduction of a 4-Me-pyrimidine distal ring in 10 showed a modest impact on logD and solubility; however, in vivo unbound clearance and bioavailability in rodents were improved twofold to threefold relative to 6. We also conducted two 20 µs simulations of compound 10 bound to FGFR1 and observed that the extended FGFR1 P-loop conformation was maintained, with large Cys488-10 warhead distances sampled (~9 Å) (SI Appendix, Fig. S3C). Interestingly, we also observed increased selectivity: 177-fold in the biochemical setting and 128-fold in cells (Table 2).
As discussed above, we observed only minor differences in the binding poses and ligand interactions of FGFR2 either covalently or reversibly bound with compound 3. We wanted to determine whether there were more significant differences between the poses and interactions for compound 10 when comparing the reversible and covalent binding modes, with the hope that designs informed by the reversible binding pose might stabilize the reversibly bound state and that designs informed by the covalently bound pose could help stabilize the final bound state. We thus performed a 100 µs simulation of FGFR2 reversibly bound with compound 10 and a 100 µs simulation of FGFR2 covalently bound with compound 10 (Fig. 3 and SI Appendix, Fig. S3). Previously, in the 25 µs simulations of apo FGFR1 and FGFR2, we observed two main conformations of the DFG motif: the sidechain rotamer states of homologous residues Phe642 in FGFR1 and Phe645 in FGFR2 differed in these two simulations, and we refer to these states as the R1 pose and R2 pose, respectively (Fig. 3A); the R1 pose and R2 pose are similar to the previously observed apo X-ray structures of FGFR1 and FGFR2, respectively (SI Appendix, Fig. S3A). The simulation of 10 reversibly bound to FGFR2 showed that Phe645 remained in the R2 pose (Fig. 3B). In this simulation, we observed short Cys491-10 warhead distances (Fig. 3H), and we used a frame extracted from this simulation to build the covalent system.
Fig. 3.
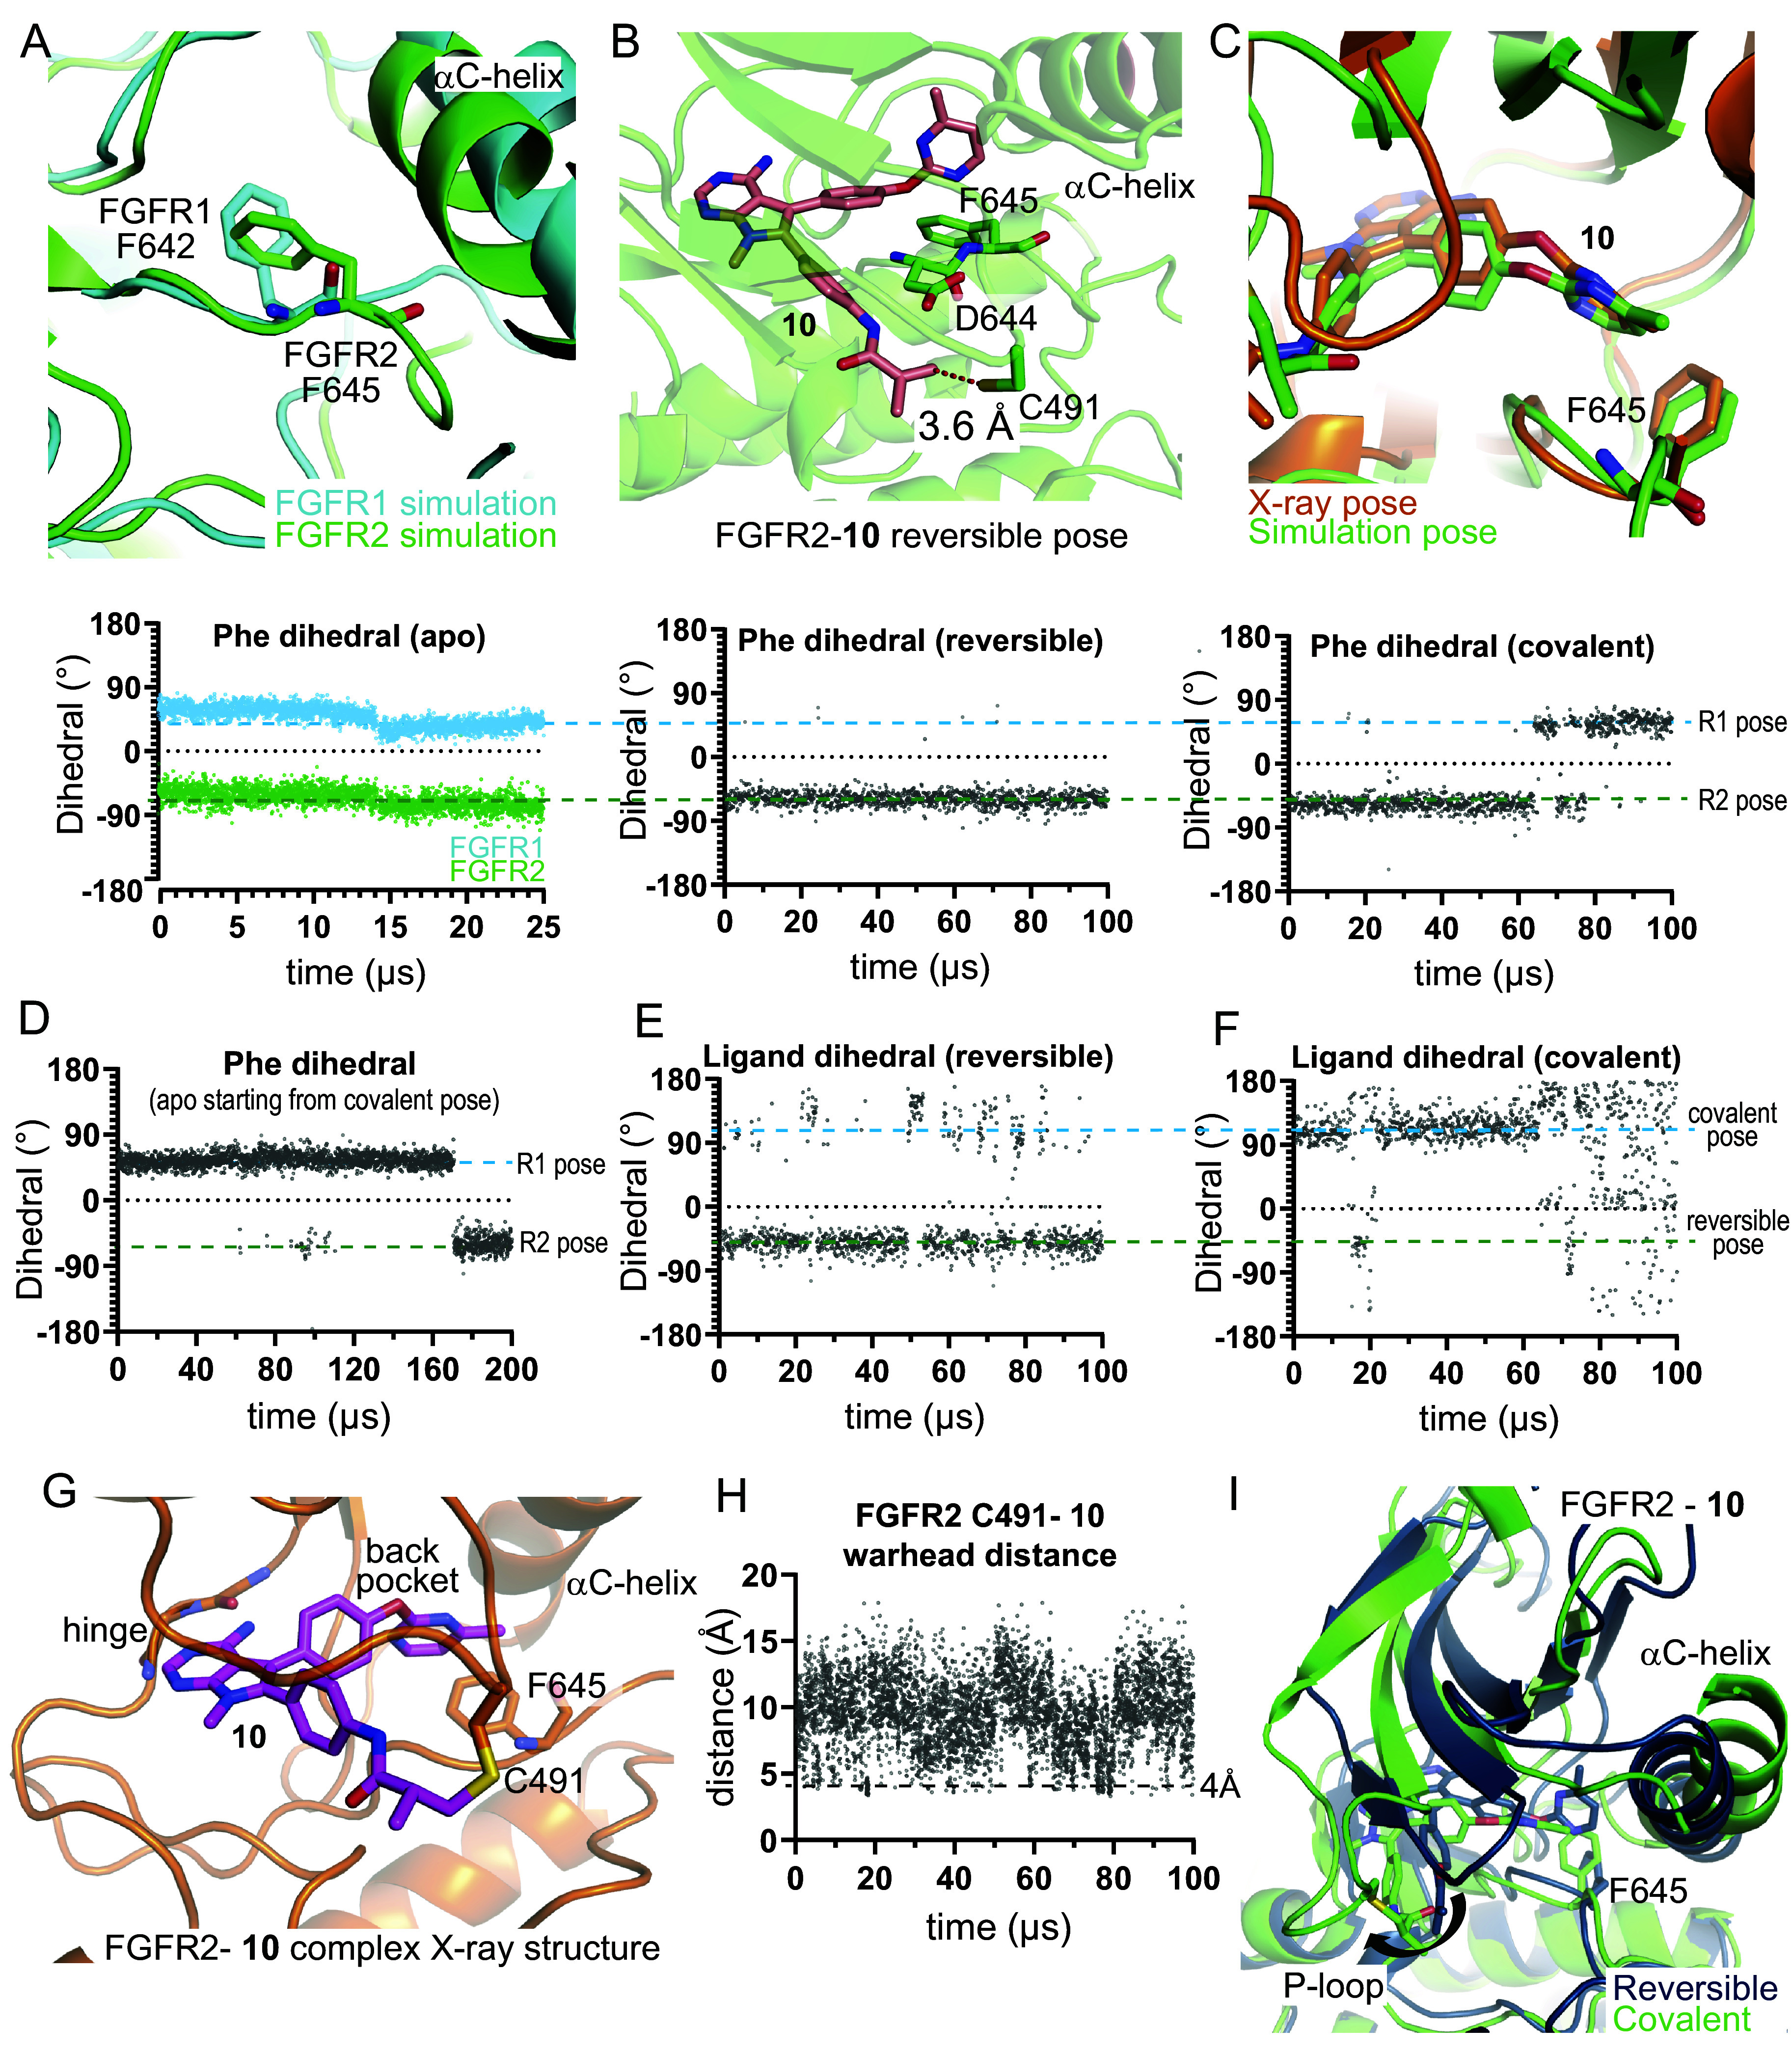
MD Simulations capture protein conformational changes in the FGFR2 back pocket upon covalent engagement with compound 10. (A) Representative frames from FGFR1 (cyan) and FGFR2 (green) apo simulations are superimposed. DFG-motif Phe residues are shown (Top), and the corresponding N-Cα-Cβ-Cγ dihedrals are plotted (Bottom). (B) A representative pose from a simulation of 10 reversibly bound with FGFR2 (Top). The FGFR2 C491-10 warhead distance is marked. F645, adopting a position similar to the apo FGFR2 pose, is shown, and the corresponding dihedral is plotted (Bottom). (C) A representative pose from near the end of a simulation of 10 covalently bound with FGFR2 is superimposed on the X-ray structure of 10 bound to FGFR2 (Top). F645, adopting a position similar to that in the apo FGFR1 pose, is shown, and the corresponding dihedral is plotted (Bottom). (D) The F645 dihedral is plotted from a simulation that started from a covalently bound FGFR2 structure in which the ligand had been removed. The ligand back-pocket biaryl ether dihedral (SI Appendix, Fig. S4J) is plotted for the (E) reversibly and (F) covalently bound FGFR2-10 simulations. (G) The FGFR2-10 covalent complex X-ray structure is shown (PDB ID: 8U1F). (H) The FGFR2 C491-10 warhead distance is plotted from a simulation of 10 reversibly bound with FGFR2. (I) Representative frames from the reversible (dark) and covalent (light) simulations of 10 bound to FGFR2, superposed using C-lobe residues 600 to 764.
When 10 was simulated in the covalently bound form, Phe645 switched into the R1 pose and did not return to the R2 pose (Fig. 3C). With compound 10 covalently bound to Cys491, we observed a substantial conformational change at the P-loop and a rotation of the N-lobe with respect to the C-lobe (Fig. 3I). These changes impacted how the ligand and Phe645 packed with the αC-helix (Met538 and Ile541) and the β3-αC loop (Ile547) (SI Appendix, Fig. S3E), and this change in packing likely allowed Phe645 to adopt the R1 pose. We next performed a 200 µs simulation of apo FGFR2 starting from the last frame of the simulation with compound 10 covalently bound to FGFR2 (i.e., after removing the ligand), in which Phe645 was in the R1 pose. In this simulation, we observed that in the absence of the covalently bound ligand, the Phe645 rotamer reverted to the R2 pose (Fig. 3D). Taken together, these observations suggest that in the presence of the covalently bound ligand, the conformations of the DFG motif and the P-loop are likely coupled and that both the R1 pose and the R2 pose are important to consider in design because they likely represent stable states in the process of binding.
The compound 10 back-pocket moiety also adopted distinct poses in simulations depending on whether 10 bound reversibly or bound covalently with FGFR2, as highlighted by the different dihedral angles around the biaryl ether moiety (Fig. 3 E and F). In the covalent state, we observed a ligand conformation that aligned with a pose determined later in an X-ray structure obtained of an FGFR2-10 covalent complex (PDB ID: 8U1F; Fig. 3 C and G). (The rotated N-lobe we observed in the simulation is also present in this X-ray structure, but to a lesser degree.) However, the biaryl ether conformation and Phe645 rotamer we observed in the covalent complex are not the lowest energy conformations in simulations of reversible binding, and frames from the reversible binding simulations with compound 6 were used for our docking calculations to predict reversible binding affinity to FGFR2. This suggests that structural studies of only the final covalently bound state may not be sufficient for rational optimization of covalent inhibitors and that structural information of the noncovalently bound state may inform design elements that promote the reversible step of binding, which in our case corresponds well to the observed SAR. The aggregate binding simulation is shown in Movie S7.
Design of Lirafugratinib (RLY-4008).
Continuing to apply the screening approach described above—using (noncovalent) docking to FGFR2 and simulations of the docked pose to assess stability in the FGFR2 binding site, followed by simulations to assess stabilization of an extended FGFR1 P-loop conformation—we triaged analogs of compound 10 for synthesis. Ultimately, by adding just one F group to the biaryl ether substituent, we arrived at lirafugratinib (stabilization of extended FGFR1 P-loop conformations by lirafugratinib is shown in SI Appendix, Fig. S3F). Compared to 10, lirafugratinib showed a significant improvement in activity and selectivity, coupled with superior physicochemical, DMPK, and off-target profiles (22). In simulations with FGFR2, lirafugratinib, upon covalent engagement, induced similar protein conformational changes in the DFG motif to those induced by 10; these changes are consistent with a subsequently acquired FGFR2–lirafugratinib complex X-ray structure (PDB ID: 8STG; SI Appendix, Fig. S3 H and I). Key data for lirafugratinib are summarized in Table 4. Noteworthy is the exceptional >5,000-fold selectivity over FGFR4, an FGFR family member that is structurally divergent from FGFR1, 2, and 3, exceeding FGFR4 selectivities of pan-FGFRi by orders of magnitude. Given that FGFR4 inhibition is associated with adverse effects in the clinic (16), this observation adds to the overall improved profile of lirafugratinib.
Table 4.
In vitro and in vivo profiles of compound 10 and lirafugratinib
|
|||
|---|---|---|---|
| Compound 10 | Lirafugratinib | ||
| Potency and selectivity | FGFR1/2/3/4 Caliper IC50 (µM) | 1.29/0.007/0.53/31 | 0.77/0.003/0.26/15 |
| SNU16 PD/Proliferation IC50 (µM) | 0.004/0.006 | 0.003/0.002 | |
| JMSU Proliferation IC50 (µM) | 0.77 | 0.66 | |
| R1/2 Selectivity Caliper/Cell | 177/128 | 229/330 | |
| Physicochemical properties | ELogD@7.4/MW | 4.1/492 | 4.3/510 |
| Therm. Solubility FaSSIF/SGF (µM) | 12/176 | 49.3/540 | |
| In vitro ADME properties | PPB Fu m/r/d/cm/h (%) | 0.96/2.3/4.3/0.17/0.13 | 0.82/1.6/2.3/0.20/0.14 |
| CACO2 Papp AB/BA (10-6 cm/s)/ER | 4.7/6.2/1.3 | 5.3/6.8/1.3 | |
| Hep. Clint m/r/d/cm/h (µL/min/106 cells) | 21/12/28/3.4/<2.2 | 29/30/19/6.5/<1 | |
| In vivo pharmacokinetics | IV CL m/r/d/cm (mL/min/kg) | 3.4/30/23/1.7 | 4.4/60/28/2.2 |
| IV CLu m/r/d/cm (mL/min/kg) | 356/1,322/528/1,018 | 538/3,813/1,200/1,100 | |
| IV Vdss m/r/d/cm (L/kg) | 0.36/0.98/1.2/0.2 | 0.42/0.98/1.3/0.26 | |
| IV Vdss,u m/r/d/cm (L/kg) | 38/43/28/118 | 51/62/57/130 | |
| IV t1/2, eff m/r/d/cm (h) | 1.2/0.37/0.61/1.4 | 1.1/0.19/0.55/1.4 | |
| PO Bioavailability m/r/d/cm (%) | 74/17/45/19 | 58/18/53/47 | |
| Off-target activity | Cyp Rev. Inhib. IC50 (µM) 1A2/2C9/2C19/2D6/3A4 |
>30/4.9/4.1/3.6/14 | >75/6.5/2.2/1.4/15 |
| Cyp TDI IC50 (µM) 1A2/2C9/2C19/2D6/3A4 |
>30/5.2/5.2/3.6/7.6 | >75/6.4/2.2/1.4/10 | |
| hERG IC50 (µM) | 14 | 16 | |
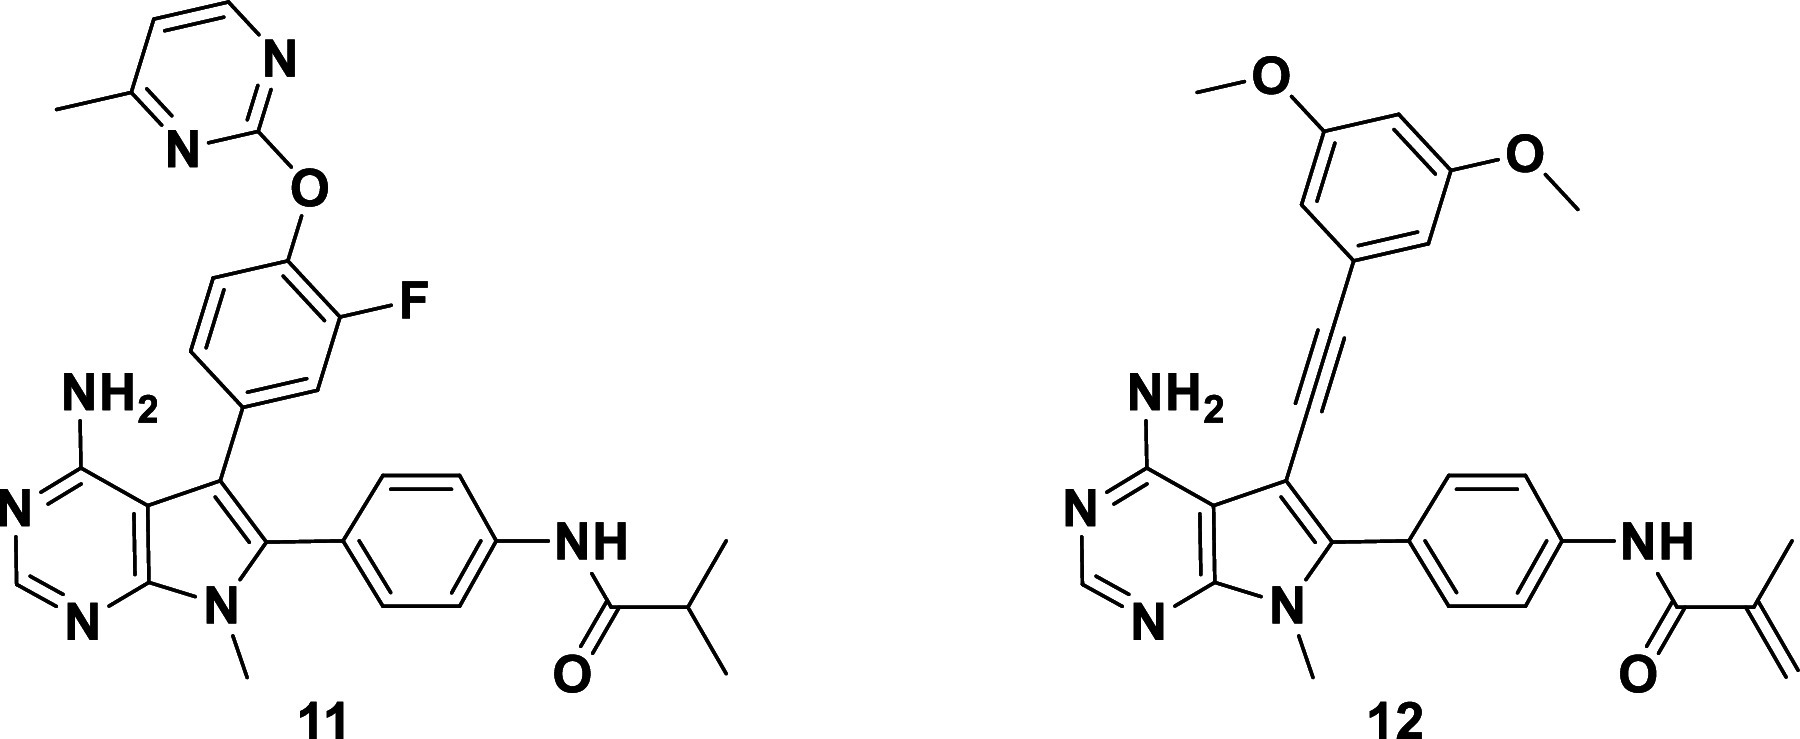
The saturated, noncovalent analog of lirafugratinib, 11 (Table 3), exhibited low micromolar activity and no selectivity, as expected due to the absence of covalent P-loop engagement. Compound 12, bearing the back-pocket piece of futibatinib, on the other hand, exhibited moderate nanomolar activity both biochemically and in cells, perhaps by covalently engaging the P-loop Cys. However, selectivity over FGFR1 dropped dramatically for 12, providing further support for the notion that back-pocket occupancy and P-loop labeling are interconnected and need to be optimized in parallel.
Table 3.
Data for nonselective tool compounds
| ||||||
|---|---|---|---|---|---|---|
| Caliper IC50 (µM) | R1/R2 Selectivity | Prolif. IC50 (µM) | ||||
| Compound | FGFR2 | FGFR1 | Caliper | Cell | SNU-16 | JMSU1 |
| 11 | 2.17 | 4.6 | 2 | 2 | 4.87 | 9.65 |
| 12 | 0.037 | 0.063 | 2 | 5 | 0.088 | 0.45 |
Variations to the hinge-binding core and 1-Me-group pointing toward the ribose pocket were investigated in parallel during this medicinal chemistry campaign (26), but they had no significant impact on the selectivity optimization. As expected, varying the hinge-binding donor-acceptor pharmacophore had a significant effect on binding affinity, and none of the multiple core modifications we explored improved the overall compound profile. Adding polar or charged moieties in the ribose pocket modulated solubility, albeit without improvements in lipophilic ligand efficiency.
Lirafugratinib (RLY-4008) Demonstrates Dose-Dependent Inhibition of FGFR2 and Antitumor Activity without Significantly Increasing Serum Phosphate Levels.
A limited selection of in vivo data is presented here to demonstrate proof of concept, including a PK/PD/efficacy study in the FGFR2-amplified SNU-16 gastric cancer xenograft model (Fig. 4 A and B). A more extensive set of in vivo experiments is described by Subbiah et al. (22), including PK/PD/efficacy studies in various human xenograft models, such as an FGFR2 fusion-positive ICC model harboring the FGFR2V564F mutation and an endometrial cancer model harboring the FGFR2N549K mutation—two resistance mutations that drive clinical progression for patients taking current pan-FGFRi (1, 27–31). Lirafugratinib at oral doses of 1, 5, and 10 mg/kg twice daily was compared with clinically relevant doses of futibatinib and pemigatinib. Lirafugratinib plasma exposure increased linearly with dose, but decreased quickly over the dosing interval, consistent with the short half-life observed in mice. We observed exposure-dependent modulation of phosphorylated FGFR2 (pFGFR2), including complete suppression of pFGFR2 at 2 h postdose in the 5 and 10 mg/kg groups (corresponding with Cmax). Tumor stasis was observed at the 10 mg/kg twice daily dose. Regression can be achieved at the dose of 10 mg/kg twice daily in other FGFR2-dependent models (22) and with higher doses in the SNU-16 xenograft model (22). To assess the functional impact of selectivity over FGFR1 in vivo, hyperphosphatemia studies in Sprague Dawley rats were carried out in which serum phosphate levels were evaluated. A 14-d study comparing the clinically relevant exposures of futibatinib to lirafugratinib dosed at 100 and 200 mg/kg BID [100 mg/kg BID was chosen to match the exposure of 10 mg/kg BID lirafugratinib in mouse, which causes stasis or better in all models tested, and 200 mg/kg BID was chosen to match exposure of 30 mg/kg BID lirafugratinib, which leads to regression in all models tested (22)] showed that lirafugratinib does not significantly increase serum phosphate levels at efficacious exposures, in contrast to futibatinib (Fig. 4C).
Fig. 4.
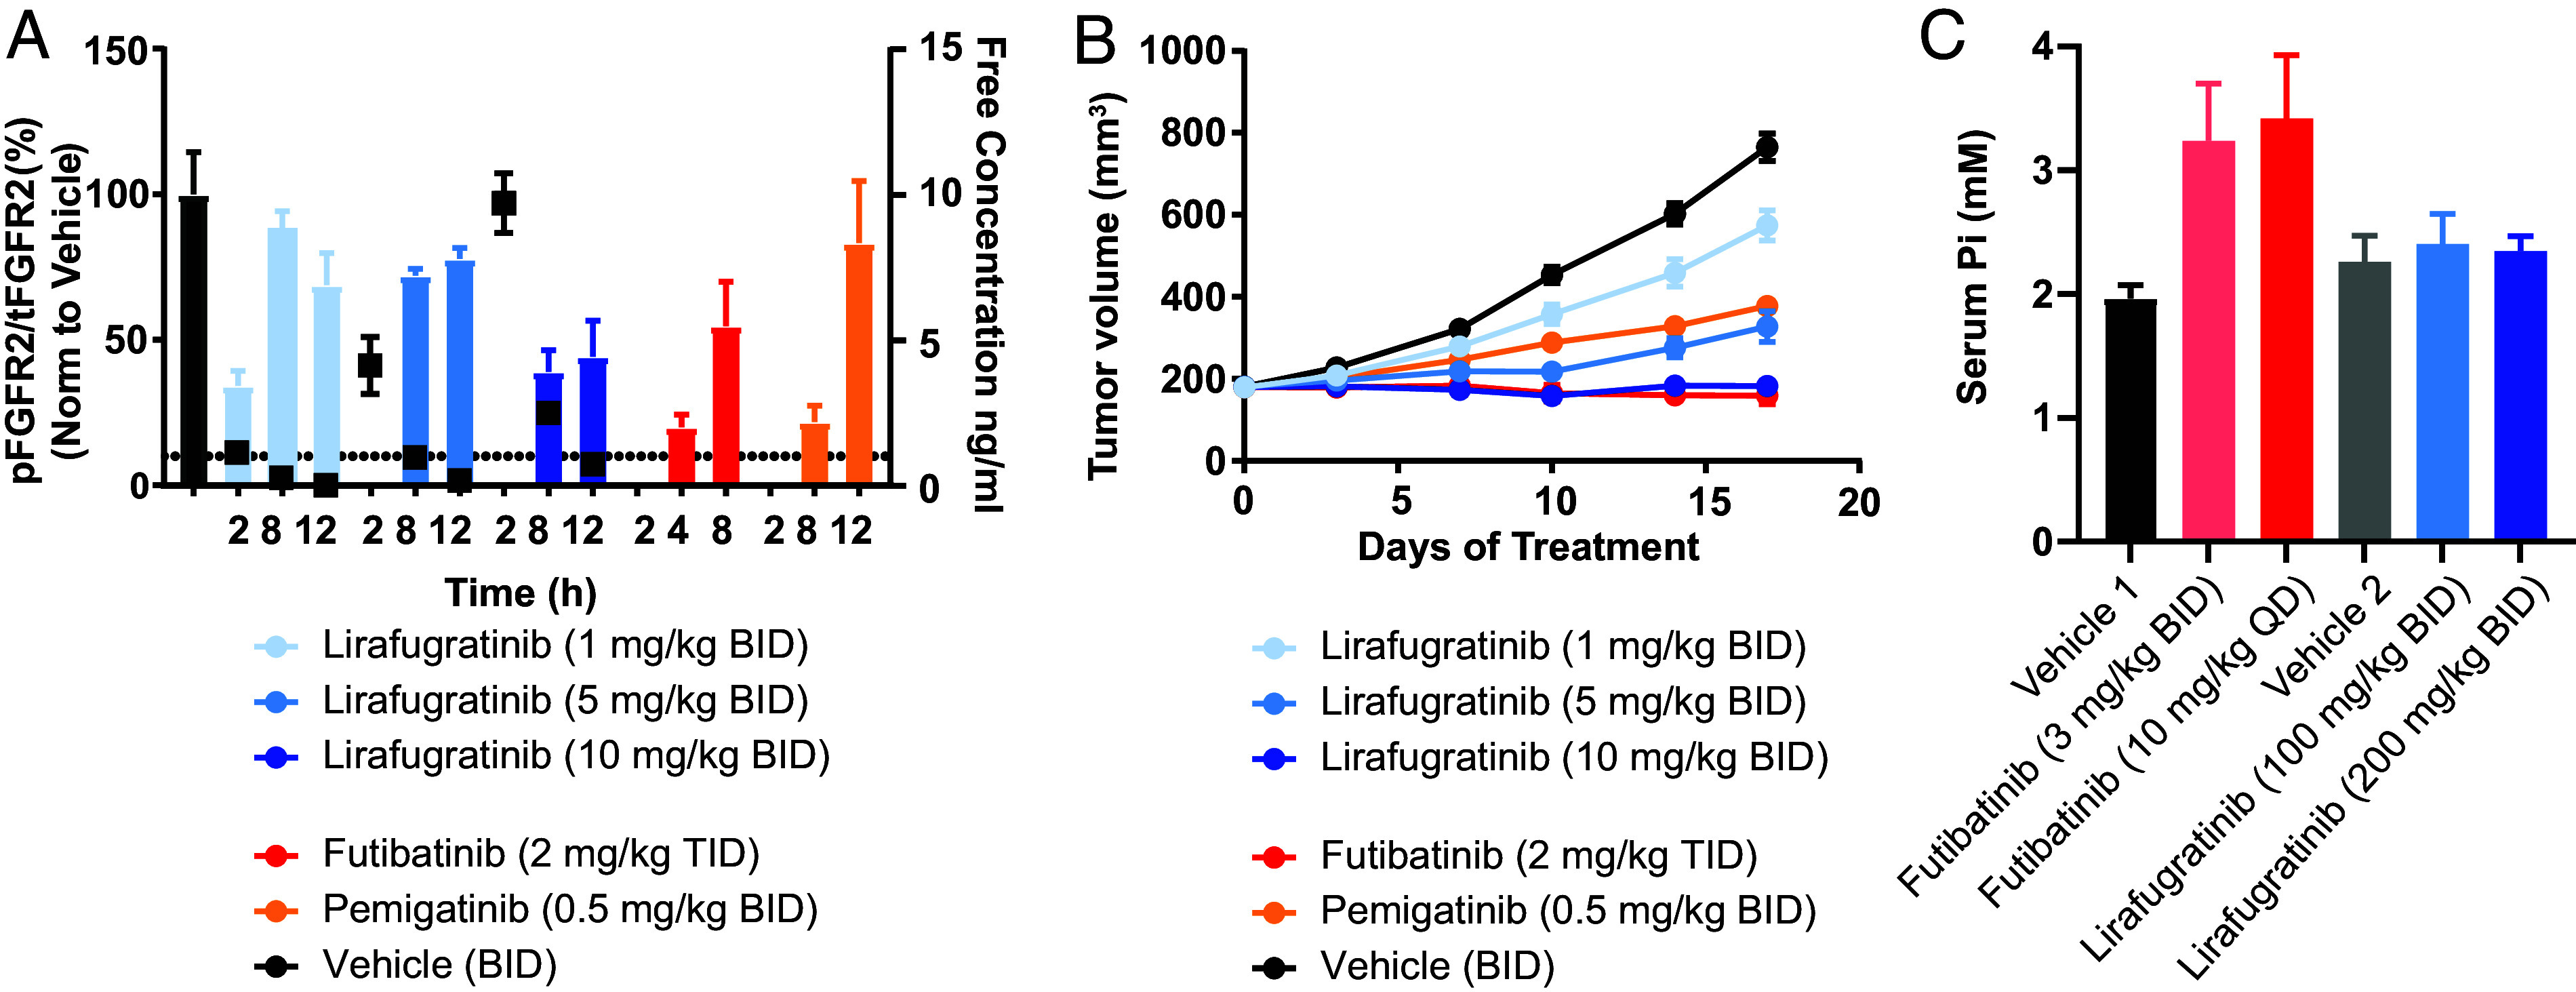
In vivo characterization of lirafugratinib. (A) Dose-dependent inhibition of FGFR2 in the FGFR2-amplified SNU-16 gastric cancer xenograft model. Female BALB/c mice were given twice daily oral doses of 1, 5, or 10 mg/kg lirafugratinib. Doses for futibatinib and pemigatinib were selected to match clinically relevant exposures (20). Animals were euthanized according to procedures approved by the Institutional Animal Care and Use Committee of Pharmaron Beijing Co., Ltd and following the guidance of the Association for Assessment and accreditation of Laboratory Animal Care, and tumors harvested at the indicated time points after the final dose on the fourth day of dosing. Tumor lysates were analyzed via pFGFR2 (Y653/654) and total FGFR2 (tFGFR2) HTRF; pFGFR2 normalized to tFGFR2 is reported (n = 3/group). Unbound plasma concentration of lirafugratinib is shown as black squares. Data are mean ± SEM. (B) Dose-dependent antitumor activity of lirafugratinib in the FGFR2-amplified SNU-16 gastric cancer xenograft model dosed as in A (n = 9/group). Data are mean ± SEM. (C) Lirafugratinib spares FGFR1-driven hyperphosphatemia in vivo. Following 14 d of dosing futibatinib and lirafugratinib to Sprague Dawley rats at the indicated doses and schedules, blood was collected from all animals for serum phosphate analysis (n = 5/group). Doses for futibatinib were chosen to match clinically efficacious doses. Data are mean ± SD.
Discussion
In this report, we describe the design of the first highly selective FGFR2 inhibitor, using a protein dynamics–based selectivity hypothesis and taking advantage of a set of experimental and computational tools. The integration of experimental findings, MD simulations, and traditional computational drug discovery methods enabled the generation of dynamics-based models to design selective compounds between the highly homologous proteins FGFR1 and FGFR2, a challenge that has not yielded to the traditional structure-based design strategies that have previously been applied. This motion-based drug discovery paradigm gave rise to lirafugratinib (RLY-4008), which exhibits excellent kinome-wide selectivity for FGFR2 (as originally reported in Fig. 1H of ref. 22: “At the test concentration of 500 nmol/L, three kinases showed greater than 75% inhibition: FGFR2 (94.1%), MEK5 (92.4%), and MKNK2 (89%),” with off-targets not expected to be inhibited irreversibly by lirafugratinib). Lirafugratinib also has low nanomolar (1 to 14 nM) activity in FGFR2-dependent cell lines (22), a favorable property profile (Table 4), and good oral exposure across species, with rat bioavailability being an outlier attributed to efficient clearance via various mechanisms specific to rat. Fig. 4A exemplifies the oral PK profile after a single low dose across species. These data, in combination with human hepatocyte clearance and protein binding data, were used to predict human PK and an efficacious dose that was expected to be feasible in the clinic, considering the solubility and absorption of lirafugratinib. The recommended phase 2 oral dose in the ongoing Phase 1/2 trial in patients with solid tumors (ReFocus; NCT04526106) is 70 mg once daily (32, 33).
The limited in vivo studies presented here are consistent with the translation of the in vitro activity and selectivity profile of lirafugratinib into in vivo efficacy at doses that do not induce hyperphosphatemia. Ongoing clinical trials have confirmed (32, 33) this finding in patients, where an overall improved safety profile compared to pan-FGFRi is observed in combination with a 73% objective response rate in early clinical studies in FGFR-inhibitor-naive, FGFR2 fusion-positive cholangiocarcinoma patients (≥70 mg once daily dose) (34). We believe this substantially improved response rate is driven by lirafugratinib’s ability to sustain prolonged target coverage compared to pan-FGFRi due to FGFR2-selective inhibition. Limited adverse effects occurring with treatment were reported (34), including minimal hyperphosphatemia and diarrhea across dose levels.
Materials and Methods
Purification of FGFR1 and FGFR2 Wild-Type Kinase Domains.
Wild-type FGFR1 kinase domain (residues A458 to E765) was purified from Escherichia coli using Talon FF, Resource Q, HisTrap HP, and Superdex 200 columns at Wuxi Biortus Biosciences Co. Ltd. Protein was treated with calf intestinal alkaline phosphatase prior to Resource Q column, and tag was removed via protease digestion prior to HisTrap HP column. Purified protein was stored in 20 mM Tris pH 8.0, 20 mM NaCl, and 2 mM tris(2-carboxyethyl)phosphine (TCEP). Wild-type FGFR2 kinase domain (residues P458 to E768) was purified by an identical process, and purified protein was stored in 30 mM 4-(2-hydroxyethyl)-1-piperazineethanesulfonic acid buffer (HEPES) pH 8.0, 150 mM NaCl, and 1 mM TCEP. Theoretical molecular weights for the wild-type FGFR1 and FGFR2 kinase domain are 35,434.91 Da and 36,143.85 Da, respectively. Molecular weights were confirmed experimentally using SYNAPT G2-Si liquid chromatography-mass spectrometry (LCMS) (FGFR1 = 35,432 Da and FGFR2 = 36,141 Da).
Cloning and Protein Purification for Crystallization.
FGFR2 wild-type kinase domain was recombinantly expressed and purified as previously described (22). For cocrystallization with compound 10, FGFR2 was copurified with compound 10. Briefly, 10 molar excess compound 10 was added to the protein sample after His-tag affinity purification and equilibrated overnight at 4 °C with no shaking. Intact mass spectrometry confirmed 100% of the protein sample was labeled before carrying out anionic exchange chromatography using a MonoQ column. As a final step, protein was gel filtered on a Superdex–S200 Increase 10/6300 column equilibrated with gel filtration buffer consisting of 30 mM HEPES, pH 7.5, 150 mM NaCl, and 1 mM TCEP. Mass spectrometry confirmed the protein sample remained 100% labeled after gel filtration.
Protein Crystallization and Structure Determination.
Crystals of the FGFR2-10 covalent adduct were generated by the hanging-drop vapor diffusion method [18 °C, equilibrated against 1 µL well solution (0.1 M Tris pH 8 and polyethylene glycol (PEG) 8K 18 to 20% w/v)]. After 48 h, the rods were harvested in well solution supplemented with 27% glycerol. Crystals grew in the space group P212121 with the unit cell a = 62.51 Å; b = 88.28 Å; c = 129.13 Å. X-ray diffraction experiments were carried out at NSLS-II at beamline 17-ID-2. FGFR2 apo crystals grew in siting drop format 48-well plates at 18 °C in well solution consisting of 27% PEG 4,000, 0.1 M HEPES pH 7.5, 0.252 M ammonium sulfate, and 0.05 M GSH GSSG. Apo crystals grew in the space group P21212 with the unit cell a = 105.46 Å; b = 117.13 Å; c = 64.86 Å. Compound 3 was soaked into apo FGFR2 kinase domain crystals by supplementing mother liquor with 1 mM compound and equilibrating against well solution for 4 h. Compound-soaked crystals were cryoprotected in mother liquor supplemented with 25% glycerol and 500 µM compound 3. Diffraction data were recorded at Advanced Light Source beamline 8.3.1. Data were reduced and phased as described previously (22). In both datasets, compound density was unambiguously resolved in difference maps. After iterative rounds of modeling and refining all protein components, the compound was modeled into composite omit maps, and the final model was refined in Phenix using ligand restraints generated in eLBOW. Regions of the structure were left unmodeled where electron density was uninterpretable. The PDB IDs for the FGFR2-10 and FGFR2-3 adducts are 8U1F and 8SWE, respectively.
LCMS Sample Preparation and Data Analysis.
FGFR1 or FGFR2 kinase domain was diluted in reaction buffer (25 mM HEPES pH 7.4, 10 mM MgCl2, 20 mM NaCl, and 1 mM dithiothreitol (DTT) at 0.1 mg/mL and mixed at 1:1 ratio with reaction buffer containing 2× test compound (of indicated concentration; 200 µM for 6 and futibatinib in rate of covalent bond formation experiments). At indicated time points, the 10-µL reaction was quenched with 2 µL 5% formic acid; samples were then diluted to 40 µL. Using SYNAPT G2-Si LCMS, ~0.2 µg of material was injected per sample. Primary LCMS data were processed using BioPharmaLynx 1.3.5 (Waters Technologies Corporation) and deconvoluted in batch using identical settings. Peak intensities corresponding to nonmodified FGFR1 or FGFR2 kinase domain mass and mass plus test compound were recorded.
Using peak intensity data of unmodified and modified protein, the percent unmodified protein remaining was calculated. Percent unmodified protein over time followed an exponential decay pattern and was analyzed using GraphPad Prism to obtain the apparent rate of decay (kobs). kobs at each test compound concentration was plotted against compound concentration to determine how efficiently FGFR1 and FGFR2 kinase domains were modified. Modification efficiency is defined by kinact/KI, parameters obtained from this plot: kinact is the maximum kobs achievable at infinite compound concentration; KI is the compound concentration needed to achieve 50% of the maximum kobs. For rate of covalent bond formation experiments with 6 and futibatinib, compound concentration was significantly higher than the compound’s respective IC50 value. Thus, it was assumed that the concentration tested (100 µM final) was significantly higher than the reversible equilibrium constant of the initial encounter complex; therefore, the apparent rate of decay is equivalent to the rate of covalent adduct formation (kinact).
FGFR1 and FGFR2 Kinase Activity Assay.
Test compounds were preincubated with FGFR1, 2, 3, or 4 kinase (Carna Biosciences) and substrate peptide (FL-Peptide 30, Perkin Elmer) in 50 mM HEPES pH 7.5, 10 mM MgCl2, 1 mM EGTA, 0.01% Brij-35, 2 mM DTT, and 0.05% bovine serum albumin for 30 min at room temperature. Compound volume was 1% final assay volume. ATP was added to a total concentration of 100 µM, incubated for 90 min, and reactions were quenched using 100 mM HEPES pH 7.5, 35.5 mM EDTA, 0.015% Brij-35, 0.0002% coating reagent #3 (Perkin Elmer), and 5% dimethyl sulfoxide (DMSO). The substrate conversion ratio was calculated for each concentration and was then used to calculate IC50 values.
Cell Culture and Proliferation Assays.
SNU-16 (CRL-5974) was purchased from ATCC, and JMSU-1 (ACC505) was purchased from RIKEN BRC. Cell lines were cultured at 37 °C in 5% CO2 humidified air in media recommended by the vendor. JMSU1 cells were seeded in 100 μL media into a black 96-well, clear-bottom plate, including a day 0 untreated plate to be read after 24 h. After a 24-h incubation at 37 °C, 5% CO2, cells were treated with DMSO or test compound in additional 100 μL for 96 h at 37 °C, 5% CO2. SNU-16 cells were seeded in a volume of 100 μL in black 96-well, clear-bottom plates containing DMSO or test compound and incubated at 37 °C, 5% CO2 for 96 h, including a day 0 untreated plate to be read after 24 h. Following incubation, plates and CellTiter-Glo 2.0 (Promega) were equilibrated to room temperature for 30 min. For JMSU1 cells, 100 μL media were removed from each well followed by addition of 100 μL CellTiter-Glo 2.0 to all wells. Plates were placed on a shaker (protected from light) at room temperature for 30 min and read on an EnVision plate reader. Data were normalized by subtracting day 0 values from all treated sample measurements followed by normalization to DMSO controls and conversion to percent viability. A sigmoidal four-parameter curve (4PL) (GraphPad Prism) was used to determine the IC50.
In Vivo Studies.
All procedures relating to animal handling, care, and treatment were performed according to the guidelines approved by the Institutional Animal Care and Use Committee of the companies performing the studies and following the guidance of the Association for Assessment and Accreditation of Laboratory Animal Care. Lirafugratinib was formulated in 0.5% methylcellulose/2% tocofersolan (TPGS) and futibatinib in 0.5% methylcellulose/2% TPGS or 20% (2-Hydroxypropyl)-β-cyclodextrin (HP-b-CD) at pH 3.0; both compounds were dosed orally as suspensions. Pemigatinib was formulated in 10% dimethylacetamide/90% 20% HP-b-CD at pH 3.5 and dosed orally as a solution. All compound doses are expressed as mg/kg free base.
The SNU-16 xenograft and rat hyperphosphatemia studies were conducted at Pharmaron Beijing Co., Ltd. For SNU-16, female BALB/c nude mice were inoculated subcutaneously on the right flank with 1 × 10⁷ cells in 0.1 mL RPMI-1640:BD Matrigel mixture (1:1). Mice were dosed by oral gavage. Treatment was initiated when the average tumor volume was 100 to 200 mm3 for efficacy studies and 250 to 350 mm3 for PK/PD studies. Body weight was measured daily, and tumors were measured twice weekly in two dimensions using a caliper. Tumor volume was expressed in mm3 using the formula: V = 0.5 a × b2, where a and b are the long and short diameters of the tumor, respectively.
For the hyperphosphatemia study, male Sprague Dawley rats were dosed by oral gavage for 14 d. Body weight was measured daily. Blood was collected by orbital sinus and serum was separated by centrifugation at 8,000 g for 15 min at 4 °C. Blood chemistry was measured using a TBA-40FR automated analyzer (Toshiba).
In Vitro and In Vivo PD Analysis.
For cellular PD assays, SNU-16 cells were plated in 384-well plates (60,000 cells/well). Cells were immediately incubated with the test compound for 2 h at 37 °C, 5% CO2. p-ERK (Tyr202/204) Cellular HTRF (Perkin Elmer; 64AERPEH) assays were carried out per the manufacturer’s protocol. Data were fitted to a sigmoidal four-parameter curve (4PL) (GraphPad Prism) to determine IC50.
For tumor PD, tumors were lysed in lysis buffer #2 (component of Perkin Elmer 63ADK054PEH/63ADK057PEH kits) supplemented with cOmplete protease inhibitor tablet (Roche) and homogenized in a TissueLyser (Qiagen). pFGFR2 (Perkin Elmer; 63ADK054PEH) and total FGFR2 (Perkin Elmer; 63ADK057PEH) HTRF assays were carried out per the manufacturer’s protocol.
Plasma Protein Binding Measurements Used for Unbound Concentration Calculations.
Lirafugratinib was incubated at 5 μM with pooled plasma from Caesarean derived-1 and BALB/c mouse, SD rat, beagle dog, cynomolgus monkey, and human sources at 37 ± 1 °C in 5% CO2 atmosphere in a 96-well rapid equilibrium dialysis device against phosphate buffer with an incubation length of 18 h. After incubation, an aliquot was removed from each side of the membrane. A matrix match was performed by adding blank phosphate-buffered saline (PBS) to samples from the plasma chambers and blank plasma added to samples from the PBS chambers. The resulting samples were extracted and analyzed by LC–MS/MS with standard curves bracketing the study samples. Additional steps to ensure accurate quantitation included evaluation of precision and accuracy quality control samples as well as blank plasma samples to ensure minimal carryover from previous injections.
The fraction unbound (Fu) in plasma was determined based on the ratios of concentrations calculated from each side of the membrane. The results for warfarin, the highly plasma protein–bound positive control, were within acceptance criteria. Lirafugratinib was stable in the plasma of all species under the assay conditions. Recovery of lirafugratinib was acceptable for all species of plasma. A robust analytical method enabled accurate detection of highly bound study samples.
Bioanalysis.
Reverse-phase chromatography with positive electrospray ionization mode LC–MS/MS methods was qualified for the quantitation of lirafugratinib in various biological matrices of nonclinical species. Sample concentrations were within calibration curve ranges, with standard and quality control samples demonstrating acceptable accuracy; therefore, the methods were deemed suitable for the quantitation for lirafugratinib concentrations in the biological matrices in non-GLP studies.
PK Studies.
Lirafugratinib doses were administered intravenously (1 or 2 mg/kg) or orally (3 or 5 mg/kg) via gavage to BALB/c nude mice, Sprague Dawley rats, beagle dogs, and cynomolgus monkeys. The IV formulation for all species was 10% dimethylacetamide/5% Solutol/85% water. The oral formulation used was either 20% HP-β-CD solution in pH 3.0 citrate buffer (for mouse and rat) or 0.5% methylcellulose and 2% D-α-tocopherol polyethylene glycol 1000 succinate (vitamin E TPGS) (for dog and monkey).
For mouse and rat studies, serial blood samples were collected at predose, 0.083 (IV dosing only), 0.25, 0.5, 1, 2, 4, 6, 8, and 24 h postdose. For dog and monkey studies, serial blood samples were collected at predose, 0.083 (IV dosing only), 0.25, 0.5, 1, 2, 4, 8, 12, and 24 h postdose. Collected blood samples were processed to extract plasma by centrifugation. The plasma was protein precipitated, and the diluted supernatant was analyzed using LC/MS/MS using a qualified method. A standard curve was prepared in naive plasma and processed in the same manner as the samples. Pharmacokinetic parameters were determined using WinNonLin.
Chemistry.
The chemical synthesis of compounds shown was conducted at Pharmaron Beijing Co., Ltd., and detailed synthetic protocols and analytical data are available in SI Appendix. Futibatinib and pemigatinib were purchased from MedChem Express.
MD Simulations.
Simulation systems were prepared based on the X-ray structures of FGFR1 (PDB ID: 4RWI, 35) and FGFR2 (PDB ID: 1GJO, 36) by placing the kinase domains in a cubic simulation box with periodic boundary conditions (∼77 Å per side, containing ∼45,000 atoms). Waters were represented explicitly, and Na+ and Cl− ions were added to neutralize the system and achieve a physiological salinity of 150 mM. The systems were parameterized with the Amber99SB*-ILDN force field (37) [which builds on other modifications (38, 39) to Amber99 (40)] with the TIP3P water model (41). The small molecules were parameterized using the general Amber force field (42). The systems were each equilibrated on GPU Desmond using a mixed NVT/NPT schedule (43). MD simulations were performed on the special-purpose machine Anton (44) in the NPT ensemble with T = 310 K and P = 1 bar using a multigrator approach (45) with the underlying thermostat and barostat being related to the Nosé–Hoover (46) and the Martyna–Tobias–Klein (47) algorithms, respectively. The simulation time step was 2 fs; the r-RESPA integration method was used, with long-range electrostatics evaluated every three time steps. Water molecules and all bond lengths to hydrogen atoms were constrained using an implementation (48) of M-SHAKE (49). The electrostatic forces were calculated using the u-series method (50) with a 13.7-Å cutoff for the electrostatic pairwise summation. A 9-Å cutoff was applied for the van der Waals calculations.
Supplementary Material
Appendix 01 (PDF)
Simulation of the apo FGFR1 kinase domain. FGFR1 is colored in cyan. The view is focused on the P-loop, and the vicinity of Cys488 is highlighted in a darker shade of blue.
Simulation of the apo FGFR2 kinase domain. FGFR2 is colored in green. The view is focused on the P-loop, and the vicinity of Cys 491 is highlighted in a darker shade of green.
Simulation of the FGFR1 kinase domain bound to compound 6, starting from a disordered Ploop conformation. Bound to compound 6, the FGFR1 P-loop adapts an extended conformation. FGFR1 is colored in cyan.
Simulation of the FGFR2 kinase domain bound to compound 6. P-loop Cys491 can sample close warhead distances that likely allow targeting of Cys491. FGFR2 is colored in green.
Simulation of the FGFR1 kinase domain bound to compound 7, starting from an extended P-loop conformation. Bound to compound 7, the FGFR1 P-loop becomes disordered. FGFR1 is colored in cyan.
Simulation of the FGFR1 kinase domain bound to compound 8, starting from an extended P-loop conformation. Bound to compound 8, the FGFR1 P-loop becomes disordered. FGFR1 is colored in cyan.
Aggregate trajectory of two simulations: (i) Simulation of the FGFR2 kinase domain bound to compound 10. In this simulation, we observed that FGFR2 P-loop Cys491 can sample close distances to the warhead methyl acrylamide C atom, likely allowing targeting of Cys491. (ii) A second simulation was started from a frame selected from the initial simulation, and the covalent bond between the warhead and the kinase was manually built. Superposition of a pose from the second simulation is shown with the X-ray structure pose of FGFR2 bound to 10. FGFR2 is colored in green.
Acknowledgments
Author contributions
H.S., P.A., A.M.T., J.B.C., B.B.T., D.T.M., R.V., S.Z., P.J.O., F.G., D.M., G.N., H.G., M.M.M., A.A.B., T.H.M., D.E.S., J.W., and D.A.B. designed research; H.S., P.A., J.B.C., B.B.T., D.T.M., B.M.H., R.V., S.Z., P.J.O., L.F., D.A.S., S.G., A.L., R.K., N.G.-M., D.M., K.B., G.N., H.G., R.C., and Y.W. performed research; S.Z., P.J.O., L.F., and A.L. contributed new reagents/analytic tools; H.S., P.A., A.M.T., J.B.C., B.B.T., D.T.M., B.M.H., R.V., S.Z., P.J.O., D.A.S., S.G., F.G., N.G.-M., D.M., K.B., G.N., H.G., A.A.B., T.H.M., and J.W. analyzed data; and H.S. and P.A. wrote the paper.
Competing interests
Some authors are currently or have in the past been Relay employees. Some authors may own Relay stock. Relay (and some of the authors) have pending patents containing claims for lirafugratinib: World Intellectual Property Organization, WO2022109577 A1 2022-05-27; World Intellectual Property Organization, WO2020231990 A1 2020-11-19; US 11780845 B2 2023-10-10.
Footnotes
This article is a PNAS Direct Submission.
Contributor Information
Heike Schönherr, Email: hschoenherr@relaytx.com.
David E. Shaw, Email: David.Shaw@DEShawResearch.com.
Data, Materials, and Software Availability
Due to the large size of the MD trajectories reported in SI Appendix, Table S1, they are available for noncommercial use through contacting trajectories@deshawresearch.com.
Supporting Information
References
- 1.Babina I. S., Turner N. C., Advances and challenges in targeting FGFR signalling in cancer. Nat. Rev. Cancer 17, 318–332 (2017). [DOI] [PubMed] [Google Scholar]
- 2.Katoh M., Fibroblast growth factor receptors as treatment targets in clinical oncology. Nat. Rev. Clin. Oncol. 16, 105–122 (2019). [DOI] [PubMed] [Google Scholar]
- 3.Tomczak A., et al. , Precision oncology for intrahepatic cholangiocarcinoma in clinical practice. Br. J. Cancer 127, 1701–1708 (2022). [DOI] [PMC free article] [PubMed] [Google Scholar]
- 4.Arai Y., et al. , Fibroblast growth factor receptor 2 tyrosine kinase fusions define a unique molecular subtype of cholangiocarcinoma. Hepatology 59, 1427–1434 (2014). [DOI] [PubMed] [Google Scholar]
- 5.Goyal L., Kongpetch S., Crolley V. E., Bridgewater J., Targeting FGFR inhibition in cholangiocarcinoma. Cancer Treat. Rev. 95, 102170 (2021). [DOI] [PubMed] [Google Scholar]
- 6.Helsten T., et al. , The FGFR landscape in cancer: Analysis of 4,853 tumors by next-generation sequencing. Clin. Cancer Res. 22, 259–267 (2016). [DOI] [PubMed] [Google Scholar]
- 7.Gu W., et al. , Comprehensive identification of FGFR1-4 alterations in 5 557 Chinese patients with solid tumors by next-generation sequencing. Am. J. Cancer Res. 11, 3893–3906 (2021). [PMC free article] [PubMed] [Google Scholar]
- 8.TRUSELTIQ (infigratinib), Highlights of prescribing information. https://www.accessdata.fda.gov/drugsatfda_docs/label/2021/214622s000lbl.pdf. Accessed 26 October 2022.
- 9.PEMAZYRE®(pemigatinib), Highlights of prescribing information. https://www.accessdata.fda.gov/drugsatfda_docs/label/2022/213736s002lbl.pdf. Accessed 26 October 2022.
- 10.LYTGOBI® (futibatinib), Highlights of prescribing information. https://www.accessdata.fda.gov/drugsatfda_docs/label/2022/214801s000lbl.pdf. Accessed 26 October 2022.
- 11.BALVERSA (erdafitinib), Highlights of prescribing information. https://www.accessdata.fda.gov/drugsatfda_docs/label/2019/212018s000lbl.pdf. Accessed 26 October 2022.
- 12.Javle M., et al. , Infigratinib (BGJ398) in previously treated patients with advanced or metastatic cholangiocarcinoma with FGFR2 fusions or rearrangements: Mature results from a multicentre, open-label, single-arm, phase 2 study. The Lancet Gastroenterol. Hepatol. 6, 803–815 (2021). [DOI] [PubMed] [Google Scholar]
- 13.Javle M., et al. , Phase II study of BGJ398 in patients with FGFR-Altered advanced cholangiocarcinoma. J. Clin. Oncol. 36, 276–282 (2018). [DOI] [PMC free article] [PubMed] [Google Scholar]
- 14.Abou-Alfa G. K., et al. , Pemigatinib for previously treated, locally advanced or metastatic cholangiocarcinoma: A multicentre, open-label, phase 2 study. Lancet Oncol. 21, 671–684 (2020). [DOI] [PMC free article] [PubMed] [Google Scholar]
- 15.Goyal L., et al. , Updated results of the FOENIX-CCA2 trial: Efficacy and safety of futibatinib in intrahepatic cholangiocarcinoma (iCCA) harboring FGFR2 fusions/rearrangements. J. Clin. Orthod. 40, 4009–4009 (2022). [Google Scholar]
- 16.Gattineni J., et al. , Regulation of renal phosphate transport by FGF23 is mediated by FGFR1 and FGFR4. Am. J. Physiol. Renal. Physiol. 306, F351–F358 (2014). [DOI] [PMC free article] [PubMed] [Google Scholar]
- 17.Kommalapati A., Tella S. H., Borad M., Javle M., Mahipal A., FGFR inhibitors in oncology: Insight on the management of toxicities in clinical practice. Cancers 13, 2968 (2021). [DOI] [PMC free article] [PubMed] [Google Scholar]
- 18.Subbiah V., Verstovsek S., Clinical development and management of adverse events associated with FGFR inhibitors. Cell Rep. Med. 4, 101204 (2023). [DOI] [PMC free article] [PubMed] [Google Scholar]
- 19.Dieci M. V., Arnedos M., Andre F., Soria J. C., Fibroblast growth factor receptor inhibitors as a cancer treatment: From a biologic rationale to medical perspectives. Cancer Discov. 3, 264–279 (2013). [DOI] [PubMed] [Google Scholar]
- 20.Sootome H., et al. , Futibatinib is a novel irreversible FGFR 1–4 inhibitor that shows selective antitumor activity against FGFR-deregulated tumors. Cancer Res. 80, 4986–4997 (2020). [DOI] [PubMed] [Google Scholar]
- 21.Ito S., et al. , Discovery of futibatinib: The first covalent FGFR kinase inhibitor in clinical use. ACS Med. Chem. Lett. 14, 396–404 (2023). [DOI] [PMC free article] [PubMed] [Google Scholar]
- 22.Subbiah V., et al. , RLY-4008, the first highly selective FGFR2 inhibitor with activity across FGFR2 alterations and resistance mutations. Cancer Discov. 13, 2012–2031 (2023), 10.1158/2159-8290.CD-23-0475. [DOI] [PMC free article] [PubMed] [Google Scholar]
- 23.Kalyukina M., et al. , TAS-120 cancer target binding: Defining reactivity and revealing the first fibroblast growth factor receptor 1 (FGFR1) irreversible structure. ChemMedChem 14, 494–500 (2019). [DOI] [PubMed] [Google Scholar]
- 24.Caldwell R. D., et al. , Discovery of evobrutinib: An oral, potent, and highly selective, covalent bruton’s tyrosine kinase (BTK) inhibitor for the treatment of immunological diseases. J. Med. Chem. 62, 7643–7655 (2019). [DOI] [PubMed] [Google Scholar]
- 25.Pan Z., et al. , Discovery of selective irreversible inhibitors for Bruton’s tyrosine kinase. ChemMedChem 2, 58–61 (2007). [DOI] [PubMed] [Google Scholar]
- 26.Toure B., et al. , Preparation of nitrogen-containing heterocycles as FGFR inhibitors and methods of use thereof (WO2020231990, 2020).
- 27.Silverman I. M., et al. , Clinicogenomic analysis of FGFR2-rearranged cholangiocarcinoma identifies correlates of response and mechanisms of resistance to pemigatinib. Cancer Discov. 11, 326–339 (2021). [DOI] [PubMed] [Google Scholar]
- 28.Goyal L., et al. , Polyclonal secondary FGFR2 mutations drive acquired resistance to FGFR inhibition in patients with FGFR2 fusion-positive cholangiocarcinoma. Cancer Discov. 7, 252–263 (2017). [DOI] [PMC free article] [PubMed] [Google Scholar]
- 29.Goyal L., et al. , TAS-120 overcomes resistance to ATP-competitive FGFR inhibitors in patients with FGFR2 fusion-positive intrahepatic cholangiocarcinoma. Cancer Discov. 9, 1064–1079 (2019). [DOI] [PMC free article] [PubMed] [Google Scholar]
- 30.Goyal L., Baiev I., Zhang K., Harris W., Karasic T. B., “Landscape of acquired resistance to selective FGFR inhibitors in FGFR2 fusion or rearrangement+ cholangiocarcinoma” in Proceedings of the 32nd EORTC/AACR/NCI Virtual Symposium, October 24–25 2020(Virtual meeting, Abstract 49, 2020). [Google Scholar]
- 31.Chen H., et al. , A molecular brake in the kinase hinge region regulates the activity of receptor tyrosine kinases. Mol. Cell 27, 717–730 (2007). [DOI] [PMC free article] [PubMed] [Google Scholar]
- 32.Hollebecque A., et al. , LBA12 Efficacy of RLY-4008, a highly selective FGFR2 inhibitor in patients (pts) with an FGFR2-fusion or rearrangement (f/r), FGFR inhibitor (FGFRi)-naïve cholangiocarcinoma (CCA): ReFocus trial. Ann. Oncol. 33, S1381 (2022). [Google Scholar]
- 33.Schram A. M., et al. , First-in-human study of highly selective FGFR2 inhibitor, RLY-4008, in patients with intrahepatic cholangiocarcinoma and other advanced solid tumors. J. Clin. Oncol. 39, TPS4165 (2021). [Google Scholar]
- 34.Borad M. J., et al. , Updated dose escalation results for ReFocus, a first-in-human study of highly selective FGFR2 inhibitor RLY-4008 in cholangiocarcinoma and other solid tumors. J. Clin. Oncol. 41, 4009–4009 (2023). [Google Scholar]
- 35.Sohl C. D., Ryan M. R., Luo B., Frey K. M., Anderson K. S., Illuminating the molecular mechanisms of tyrosine kinase inhibitor resistance for the FGFR1 gatekeeper mutation: The Achilles’ heel of targeted therapy. ACS Chem. Biol. 10, 1319–1329 (2015). [DOI] [PMC free article] [PubMed] [Google Scholar]
- 36.Ceska T. A., et al. , The FGFR2 tyrosine kinase domain (PDB entry 1GJO, 2003), 10.2210/pdb1GJO/pdb. [DOI]
- 37.Lindorff-Larsen K., et al. , Improved side-chain torsion potentials for the Amber ff99SB protein force field. Proteins 78, 1950–1958 (2010). [DOI] [PMC free article] [PubMed] [Google Scholar]
- 38.Best R. B., Hummer G., Optimized molecular dynamics force fields applied to the helix-coil transition of polypeptides. J. Phys. Chem. B 113, 9004–9015 (2009). [DOI] [PMC free article] [PubMed] [Google Scholar]
- 39.Hornak V., et al. , Comparison of multiple Amber force fields and development of improved protein backbone parameters. Proteins 65, 712–725 (2006). [DOI] [PMC free article] [PubMed] [Google Scholar]
- 40.Wang J., Cieplak P., Kollman P. A., How well does a restrained electrostatic potential (RESP) model perform in calculating conformational energies of organic and biological molecules? J. Comput. Chem. 21, 1049–1074 (2000). [Google Scholar]
- 41.Jorgensen W. L., Chandrasekhar J., Madura J. D., Impey R. W., Klein M. L., Comparison of simple potential functions for simulating liquid water. J. Chem. Phys. 79, 926–935 (1983). [Google Scholar]
- 42.Wang J., Wolf R. M., Caldwell J. W., Kollman P. A., Case D. A., Development and testing of a general amber force field. J. Comput. Chem. 25, 1157–1174 (2004). [DOI] [PubMed] [Google Scholar]
- 43.Bergdorf M., Baxter S., Rendleman C. A., Shaw D. E., “Desmond/GPU performance as of October 2015” (Shaw Research Tech. Rep. DESRES/TR–2015-01, 2015). https://www.deshawresearch.com/resources.html.
- 44.Shaw D. E., et al. , “Anton 2: Raising the bar for performance and programmability in a special-purpose molecular dynamics supercomputer” in SC '14: Proceedings of the International Conference for High Performance Computing, Networking, Storage and Analysis (IEEE, Piscataway, NJ, 2014), pp. 41–53. [Google Scholar]
- 45.Lippert R. A., et al. , Accurate and efficient integration for molecular dynamics simulations at constant temperature and pressure. J. Chem. Phys. 139, 164106 (2013). [DOI] [PubMed] [Google Scholar]
- 46.Hoover W. G., Canonical dynamics: Equilibrium phase-space distributions. Phys. Rev. A Gen. Phys. 31, 1695–1697 (1985). [DOI] [PubMed] [Google Scholar]
- 47.Martyna G. J., Tobias D. J., Klein M. L., Constant pressure molecular dynamics algorithms. J. Chem. Phys. 101, 4177–4189 (1994). [Google Scholar]
- 48.Lippert R. A., et al. , A common, avoidable source of error in molecular dynamics integrators. J. Chem. Phys. 126, 046101 (2007). [DOI] [PubMed] [Google Scholar]
- 49.Kräutler V., van Gunsteren W. F., Hünenberger P. H., A fast SHAKE algorithm to solve distance constraint equations for small molecules in molecular dynamics simulations. J. Comput. Chem. 22, 501–508 (2001). [Google Scholar]
- 50.Predescu C., et al. , The u-series: A separable decomposition for electrostatics computation with improved accuracy. J. Chem. Phys. 152, 084113 (2020). [DOI] [PubMed] [Google Scholar]
Associated Data
This section collects any data citations, data availability statements, or supplementary materials included in this article.
Supplementary Materials
Appendix 01 (PDF)
Simulation of the apo FGFR1 kinase domain. FGFR1 is colored in cyan. The view is focused on the P-loop, and the vicinity of Cys488 is highlighted in a darker shade of blue.
Simulation of the apo FGFR2 kinase domain. FGFR2 is colored in green. The view is focused on the P-loop, and the vicinity of Cys 491 is highlighted in a darker shade of green.
Simulation of the FGFR1 kinase domain bound to compound 6, starting from a disordered Ploop conformation. Bound to compound 6, the FGFR1 P-loop adapts an extended conformation. FGFR1 is colored in cyan.
Simulation of the FGFR2 kinase domain bound to compound 6. P-loop Cys491 can sample close warhead distances that likely allow targeting of Cys491. FGFR2 is colored in green.
Simulation of the FGFR1 kinase domain bound to compound 7, starting from an extended P-loop conformation. Bound to compound 7, the FGFR1 P-loop becomes disordered. FGFR1 is colored in cyan.
Simulation of the FGFR1 kinase domain bound to compound 8, starting from an extended P-loop conformation. Bound to compound 8, the FGFR1 P-loop becomes disordered. FGFR1 is colored in cyan.
Aggregate trajectory of two simulations: (i) Simulation of the FGFR2 kinase domain bound to compound 10. In this simulation, we observed that FGFR2 P-loop Cys491 can sample close distances to the warhead methyl acrylamide C atom, likely allowing targeting of Cys491. (ii) A second simulation was started from a frame selected from the initial simulation, and the covalent bond between the warhead and the kinase was manually built. Superposition of a pose from the second simulation is shown with the X-ray structure pose of FGFR2 bound to 10. FGFR2 is colored in green.
Data Availability Statement
Due to the large size of the MD trajectories reported in SI Appendix, Table S1, they are available for noncommercial use through contacting trajectories@deshawresearch.com.