

Significance
Uncertainties of the fundamental knowledge surrounding ecological associations of soil microbes hinder our comprehension of microbial biodiversity drivers. By surveying soil ecological networks involving multiple trophic levels, from bacteria to invertebrates, in various regions around the world, we emphasize that positive associations play a critical role in governing soil microbes worldwide. Positive associations between soil multitrophic organisms are essential for sustaining diverse and stable soil networks, as they support soil biodiversity and enhance stability against disturbances. The consistent global pattern underscores the significance of cooperative groups of soil taxa within complex networks, bridging the gap between maintaining biodiversity and functionality in the face of ongoing global changes.
Keywords: soil organisms, ecological networks, biodiversity
Abstract
Microbial interactions are key to maintaining soil biodiversity. However, whether negative or positive associations govern the soil microbial system at a global scale remains virtually unknown, limiting our understanding of how microbes interact to support soil biodiversity and functions. Here, we explored ecological networks among multitrophic soil organisms involving bacteria, protists, fungi, and invertebrates in a global soil survey across 20 regions of the planet and found that positive associations among both pairs and triads of soil taxa governed global soil microbial networks. We further revealed that soil networks with greater levels of positive associations supported larger soil biodiversity and resulted in lower network fragility to withstand potential perturbations of species losses. Our study provides unique evidence of the widespread positive associations between soil organisms and their crucial role in maintaining the multitrophic structure of soil biodiversity worldwide.
Soil organisms are the fundamental drivers of terrestrial ecosystem functioning (1, 2), supporting key processes such as carbon sequestration, nutrient cycling, and organic matter degradation. However, soil organisms do not exist independently. They create complex networks of biotic associations that fuel the functioning of terrestrial ecosystems by maintaining countless metabolic routes (3, 4). Despite the growing number of soil network studies (5–8), how soil ecological networks influence the maintenance of soil biodiversity, which is the foundation of soil ecosystem functions, has not been addressed.
There are four main knowledge gaps about the role of ecological networks in explaining the maintenance of soil biodiversity. First, the vast majority of ecological network studies focus on defining network architecture based on organisms that interact (9, 10). However, other basic knowledge, such as the types of network associations more common in soil networks worldwide, remains vastly unknown. Network associations can range from mostly negative (e.g., competitive networks) (11, 12) to mostly positive (facilitative networks) (13, 14). Traditional views indicate that soil organisms are likely to compete rather than cooperate for resources (15, 16). However, the fact that soil organisms support complex processes such as organic matter decomposition, which involves cooperation among numerous species and several metabolic routes (17, 18), suggests the opposite. Nonetheless, empirical evidence that positive associations may prevail in nature is lacking. Second, we lack fundamental information on the simplest and most prevalent structures of biotic associations that build up complex communities of multitrophic soil organisms, including bacteria, fungi, protists, and invertebrates (19, 20). The key property in network structures is network motif, which encompasses associations among species triads (21). Literature on plant and animal networks has explored motifs and their importance in ecological networks (22, 23), but their application to soil ecological networks remains unexplored. This application can reveal different insights into whether soil networks are significantly different compared with those of plants and animals, or conversely, universal rules emerge regardless of the considered taxa. Third, studies focusing on soil organisms have mostly investigated environmental factors associated with soil biodiversity (24). However, much less is known about to what extent microbial associations influence the number of soil taxa in a given ecosystem, which is important to understanding the maintenance mechanisms of biodiversity (25). Finally, most studies of soil networks have been conducted at a local scale and based on a single group of soil organisms (26). These studies are essential to understanding ecological networks in a given context but they cannot support the knowledge of universal and predictable network patterns applicable across global environmental gradients, especially what global environmental drivers shape the basic structure of multitrophic soil ecological networks worldwide.
To address these knowledge gaps, we combined a standardized global field survey (27) involving 151 ecosystems (sites) and 615 soil composite samples with next-generation sequencing information for the biodiversity and community composition of soil bacteria, fungi, protists, and invertebrates. This global survey includes samples from seven continents and across a wide range of vegetation types, bioclimatic regions, edaphic characteristics, and soil taxa (i.e., phylotypes; see Materials and Methods). We aim to address the following questions: 1) What is the relative frequency of positive and negative associations between multitrophic organisms in complex soil systems across the globe? Considering the importance of cooperation in soil processes such as organic matter decomposition occurring in all soils worldwide, we hypothesize that positive associations, either among pairs and triads (i.e., network motifs) of phylotypes, prevail in soil networks worldwide. 2) Can ecological associations of multitrophic soil organisms consistently explain soil biodiversity worldwide? Ecological theory in plant literature suggests that network motifs are required for biodiversity maintenance because they promote local persistence (14). Although vastly unknown for soil organisms, similar mechanisms may apply to soil biodiversity.
Results and Discussion
First, we characterized multitrophic soil ecological networks globally. In order to do so, we started by clustering all sites and associated composite soil samples in the global field survey into spatially independent global regions based on geographical and environmental information using a geostatistical algorithm (see Materials and Methods for details) (27). In total, 20 global regions were identified using this approach (Fig. 1A). We then inferred the network associations of multitrophic soil organisms by a self-designed bootstrap sampling method comprising Spearman correlation combined with Bray–Curtis dissimilarity measures (28). We conducted these analyses independently for each global region. In our networks, the focus was on relatively dominant soil taxa defined as both ubiquitous (>25% of all sites) within a global region and abundant (>0.01% relative abundance). By doing so, we aimed to reduce any artifact caused by rare taxa in our analyses. The number of nodes (soil phylotypes) ranged from 241 to 610, and the number of links ranged from 1,320 to 38,877 (Fig. 1A, SI Appendix, Figs. S1–S3, and Dataset S1), which were far more complicated compared with other ecological networks of plants and animals in terrestrial ecosystems (29, 30). The generated multitrophic soil ecological networks showed a wide range of network structures across the globe. The most dominant taxa were bacteria (15.7 to 33.2%) and fungi (7.0 to 31.9%), followed by protists (2.3 to 15.2%) and invertebrates (0.2 to 3.6%) (Fig. 1B). Information on the relative proportion of associated taxa (links) in each network was further provided, including “within prokaryotes” (~60.4%), “within eukaryotes” (~9.8%), and “across domains” (~29.8%) (Fig. 1C), suggesting that associations within and between soil taxa build the complexity of the soil networks worldwide.
Fig. 1.

Global ecological networks of multitrophic soil organisms. (A) World map showing the locations of all study sites and ecological networks. The color of sampling points represents clusters at different locations. An inset for each soil network is shown next to the corresponding sampling region. Red and blue links represent positive and negative associations within soil ecological networks. The scale bar below each network includes the proportion of positive (red) and negative (blue) associations. (B) Distribution of node affiliations to the different taxa, including soil bacteria, protists, fungi, and invertebrates, within each soil ecological network. (C) Distribution of link affiliations for each soil ecological network, including within prokaryotes, within eukaryotes, and “across prokaryotes and eukaryotes” (i.e., across domains).
Consistent with the first hypothesis, the proportion of positive associations among pairs of soil taxa exceeded half of the network associations in each region, and in some cases, positive associations were dominant (54.3 to 99.2%). These results indicate that ecological positive associations are prevalent among soil taxa. We next evaluated the most common associations among triads of soil taxa (phylotypes) (i.e., network motifs), considered the basic building blocks of complex networks. Again, network motifs were computed for the identified 20 regions of the planet independently (Fig. 2A and SI Appendix, Figs. S4 and S5). Echoing the first hypothesis again, triad positive associations (i.e., facilitative motif types) prevailed over triad negative associations (i.e., competitive motif types) in multitrophic soil communities worldwide when incorporating associations among triads of soil phylotypes. Several findings support this conclusion. On the one hand, of the seven theoretical motifs based on all possible combinations of three-way associations (Fig. 2A), only five motifs were detected and represented in our real-world soil networks, and the two most common include positive associations (cycle facilitation [cycfac] ~37.8% and transitive facilitation [tranfac] ~25.3%) (Fig. 2B). This prevalence is consistent with the fact that we also observed positive associations among soil taxa worldwide when considering pairs of phylotypes (54.3 to 99.2%) (Dataset S2). On the other hand, we found that two network motifs (cycfac and facilitation-mediated competition [facmcom]), including positive associations among phylotypes, were statistically more common than expected by chance across networks (Fig. 2C). Meanwhile, network motifs with negative associations, such as transitive competition [trancom] or transitive competition and facilitation [trancomfac] did not differ from the null expectation (11/20 and 9/20, respectively) or were unrepresented (Dataset S3). These findings agree with a recent study of alpine plant communities wherein motifs incorporating positive and negative associations support plant communities (14). Plant densities and distributions could be increased by both plant and animal facilitators that reduce herbivory. For soil organisms, the overrepresentation of facilitative motifs termed cycfac and facmcom [direct and indirect facilitation, following Kehe et al. definitions (31)] suggests that direct cross-feed facilitation or mutualism (e.g., cycfac) of phylotype triads with a divergent optimal niche for survival and indirect cooperation (e.g., facmcom) under more stressful conditions are the main ecological strategies driving the basic structure of multitrophic soil ecological networks. Likewise, it can reflect resistance to predation that arises when different taxa co-occur as it has been documented by a recent experimental study with two specific bacterial strains and a common predator Dictyostelium discoideum (32). Overall, these observational studies and detailed experiments indicate that these structures are likely the most overrepresented ones because positive associations may enable cooperative species to use a greater portion of available resources (e.g., space, light, and nutrients) under stressful environments, repel natural enemies and, therefore, to increase the diversity of soil organisms (15).
Fig. 2.

Network motifs within soil ecological networks of multitrophic soil organisms across different global regions. (A) All possibilities of network motifs among triads of soil taxa included cycle facilitation (cycfac), cycle competition (cyccom), facilitation-mediated competition (facmcom), competition-mediated facilitation (commfac), transitive facilitation (tranfac), transitive competition (trancom), and transitive competition and facilitation (trancomfac). Green dots represent soil taxa (i.e., phylotypes). Blue and red links represent negative and positive associations, while gray dash links represent neutral associations. (B) Composition bar plot of network motifs among triads of soil taxa detected in 20 networks across the globe. Different colors represent the types of identified motifs. (C) Overrepresentation heatmap of network motifs. The importance of network motifs was assessed by the z-score of motifs relative to chance, thus acting as concern modules. Cyan (Z > 0, P < 0.05) and brown (Z < 0, P < 0.05) blocks represent motifs that significantly occurred more and less than expected by chance, respectively, whereas white blocks (P > 0.05) represent motifs that did not occur differently relative to chance.
Notably, we found that soil biodiversity was not explained by the frequency of positive associations (r = 0.05, P = 0.83), leading us to realize that key macroscopic properties (e.g., pairwise associations) are challenging to understand for complex soil communities in isolation. To further explore the importance of positive associations in network motifs for maintaining multitrophic soil biodiversity worldwide, we correlated obtained network motifs (z-score, overrepresentation of motifs) with soil biodiversity (richness, average number of soil taxa per site over a community involved in the inferred networks) observed across the 20 different global regions and with the estimation of the overall network fragility (robustness, the change rate in natural connectivity after removing targeted nodes) for each region, computed as the ability of the system to maintain network and community stability after potential perturbations of species losses (Fig. 3 A–D and SI Appendix, Figs. S6 and S7 and Tables S1 and S2). Ecological networks with a larger proportion of facilitative motifs (cycfac and facmcom, z-scores) were associated with greater soil biodiversity and lower network fragility (i.e., more stable). Complementary analyses, including structural equation modeling (SEM), also supported this key finding by assessing the effects of the focused motifs on soil biodiversity and network fragility after controlling for edaphic properties, climatic factors, spatial factors, and network modularity (Fig. 3 E–G and SI Appendix, Fig. S8 and Tables S3–S5). Nevertheless, our analyses could be biased for different reasons. On the one hand, because there were limitations in inferring global soil networks by geographic regions, we further conducted uniform network analyses for groups based on the Whittaker biomes (n = 8) and full subsets (n = 591), with outcomes that consistently support our findings (SI Appendix, Figs. S9 and S10). On the other hand, redundancy and correlation analyses corroborated that the overrepresented motifs (cycfac and facmcom) significantly contributed more than environmental variables to the different network metrics evaluating the complexity of multitrophic soil systems (SI Appendix, Figs. S11–S13 and Tables S6 and S7 and Datasets S4 and S5). Taken together, these complementary findings strongly support the critical role of positive associations in fueling diverse and stable soil networks.
Fig. 3.

Linkages of network motifs with soil biodiversity and network fragility. Relationships between soil biodiversity (richness, average number of soil taxa per site over a community involved in the inferred networks, y-axis) and overrepresentation (z-score, x-axis) of cycfac (A) and facmcom (B) motifs. Relationships between network fragility (robustness, the change rate in natural connectivity after removing targeted nodes, y-axis) and overrepresentation (z-score, x-axis) of cycfac (C) and facmcom (D) motifs. n = 20 study networks. Statistical analysis of the relationships was performed using ordinary least squares regression. Differences were considered significant at *P < 0.05 and **P < 0.01. Transparent shading indicates the 95% CI. Structural equation models describing the direct and indirect effects of cycfac (E) and facmcom (F) motifs on network fragility and soil biodiversity. Numbers adjacent to arrows indicate the effect size of the relationship. Adjusted P-values are indicated by asterisks: *P ≤ 0.05; **P < 0.01. R2 denotes the proportion of variance explained for soil biodiversity and network fragility. Values of Fisher’s C with P in the models were > 0.05, representing acceptable goodness of fit for the constructed model. Soil biodiversity and network fragility were defined as above. Network architecture was represented by network modularity. All variables considered in SEM were selected by pre-fitted linear models. Environmental factors, including different categories (space, climate, and soil), were grouped into the blue box in the model for graphical simplicity (G).
Given the critical importance of positive associations in network motifs to maintain soil biodiversity and make it less vulnerable to perturbations in an ever-changing world, the question remains whether we could predict these basic structures across contrasting global biomes. Across a myriad of environmental factors considered, temperature seasonality (TSEA) exhibited the strongest correlations with the two most overrepresented network motifs, cycfac (Mantel r = 0.40, P = 0.001) and facmcom (Mantel r = 0.33, P = 0.001) (Fig. 4A), while the mean annual temperature (MAT) and the distance from the equator (DFE) were also important for other network motifs. Although another study has reported that temperature affects the complexity and stability of microbial networks (6), our study highlights that the basic building block (i.e., network motif) of multitrophic soil ecological networks is also sensitive to climate seasonality at the global scale. Both results are consistent with the fact that regional climate heterogeneity plays a major role in explaining soil biodiversity and multifunctionality worldwide (33, 34). Following the critical importance of the seasonality of temperature (TSEA), we further calculated the correlations between network motifs (z-scores) and TSEA (region-weighted) included in each of the 20 networks considered. This correlation allows exploring the potential reason that network motifs are tightly associated with the biodiversity of multitrophic soil organisms (Fig. 4 B and C and SI Appendix, Figs. S14 and S15). We observed different relationships among all evaluated motifs, but again the two most overrepresented motifs cycfac (R2 = 0.25, P < 0.001) and facmcom (R2 = 0.22, P < 0.001) were significantly positively correlated with TSEA across all regions. The interpretation of this last finding can be associated with environmental stress. Suppose the seasonality of temperature (i.e., colder climates) is stressful for soil organisms. In that case, it is likely to expect, according to the stress gradient hypothesis (35), a shift toward more positive associations with increasing stress, and therefore, this could provide an explanation for why an abiotic factor structured at the global scale drive the observed prevalence of positive associations across soil multitrophic networks worldwide. The importance of TSEA as a driver for maintaining and stabilizing multitrophic soil ecological networks highlights the fact that changes in global temperature due to climate change can have far-reaching consequences in the multiple provision of services that soil systems provide.
Fig. 4.
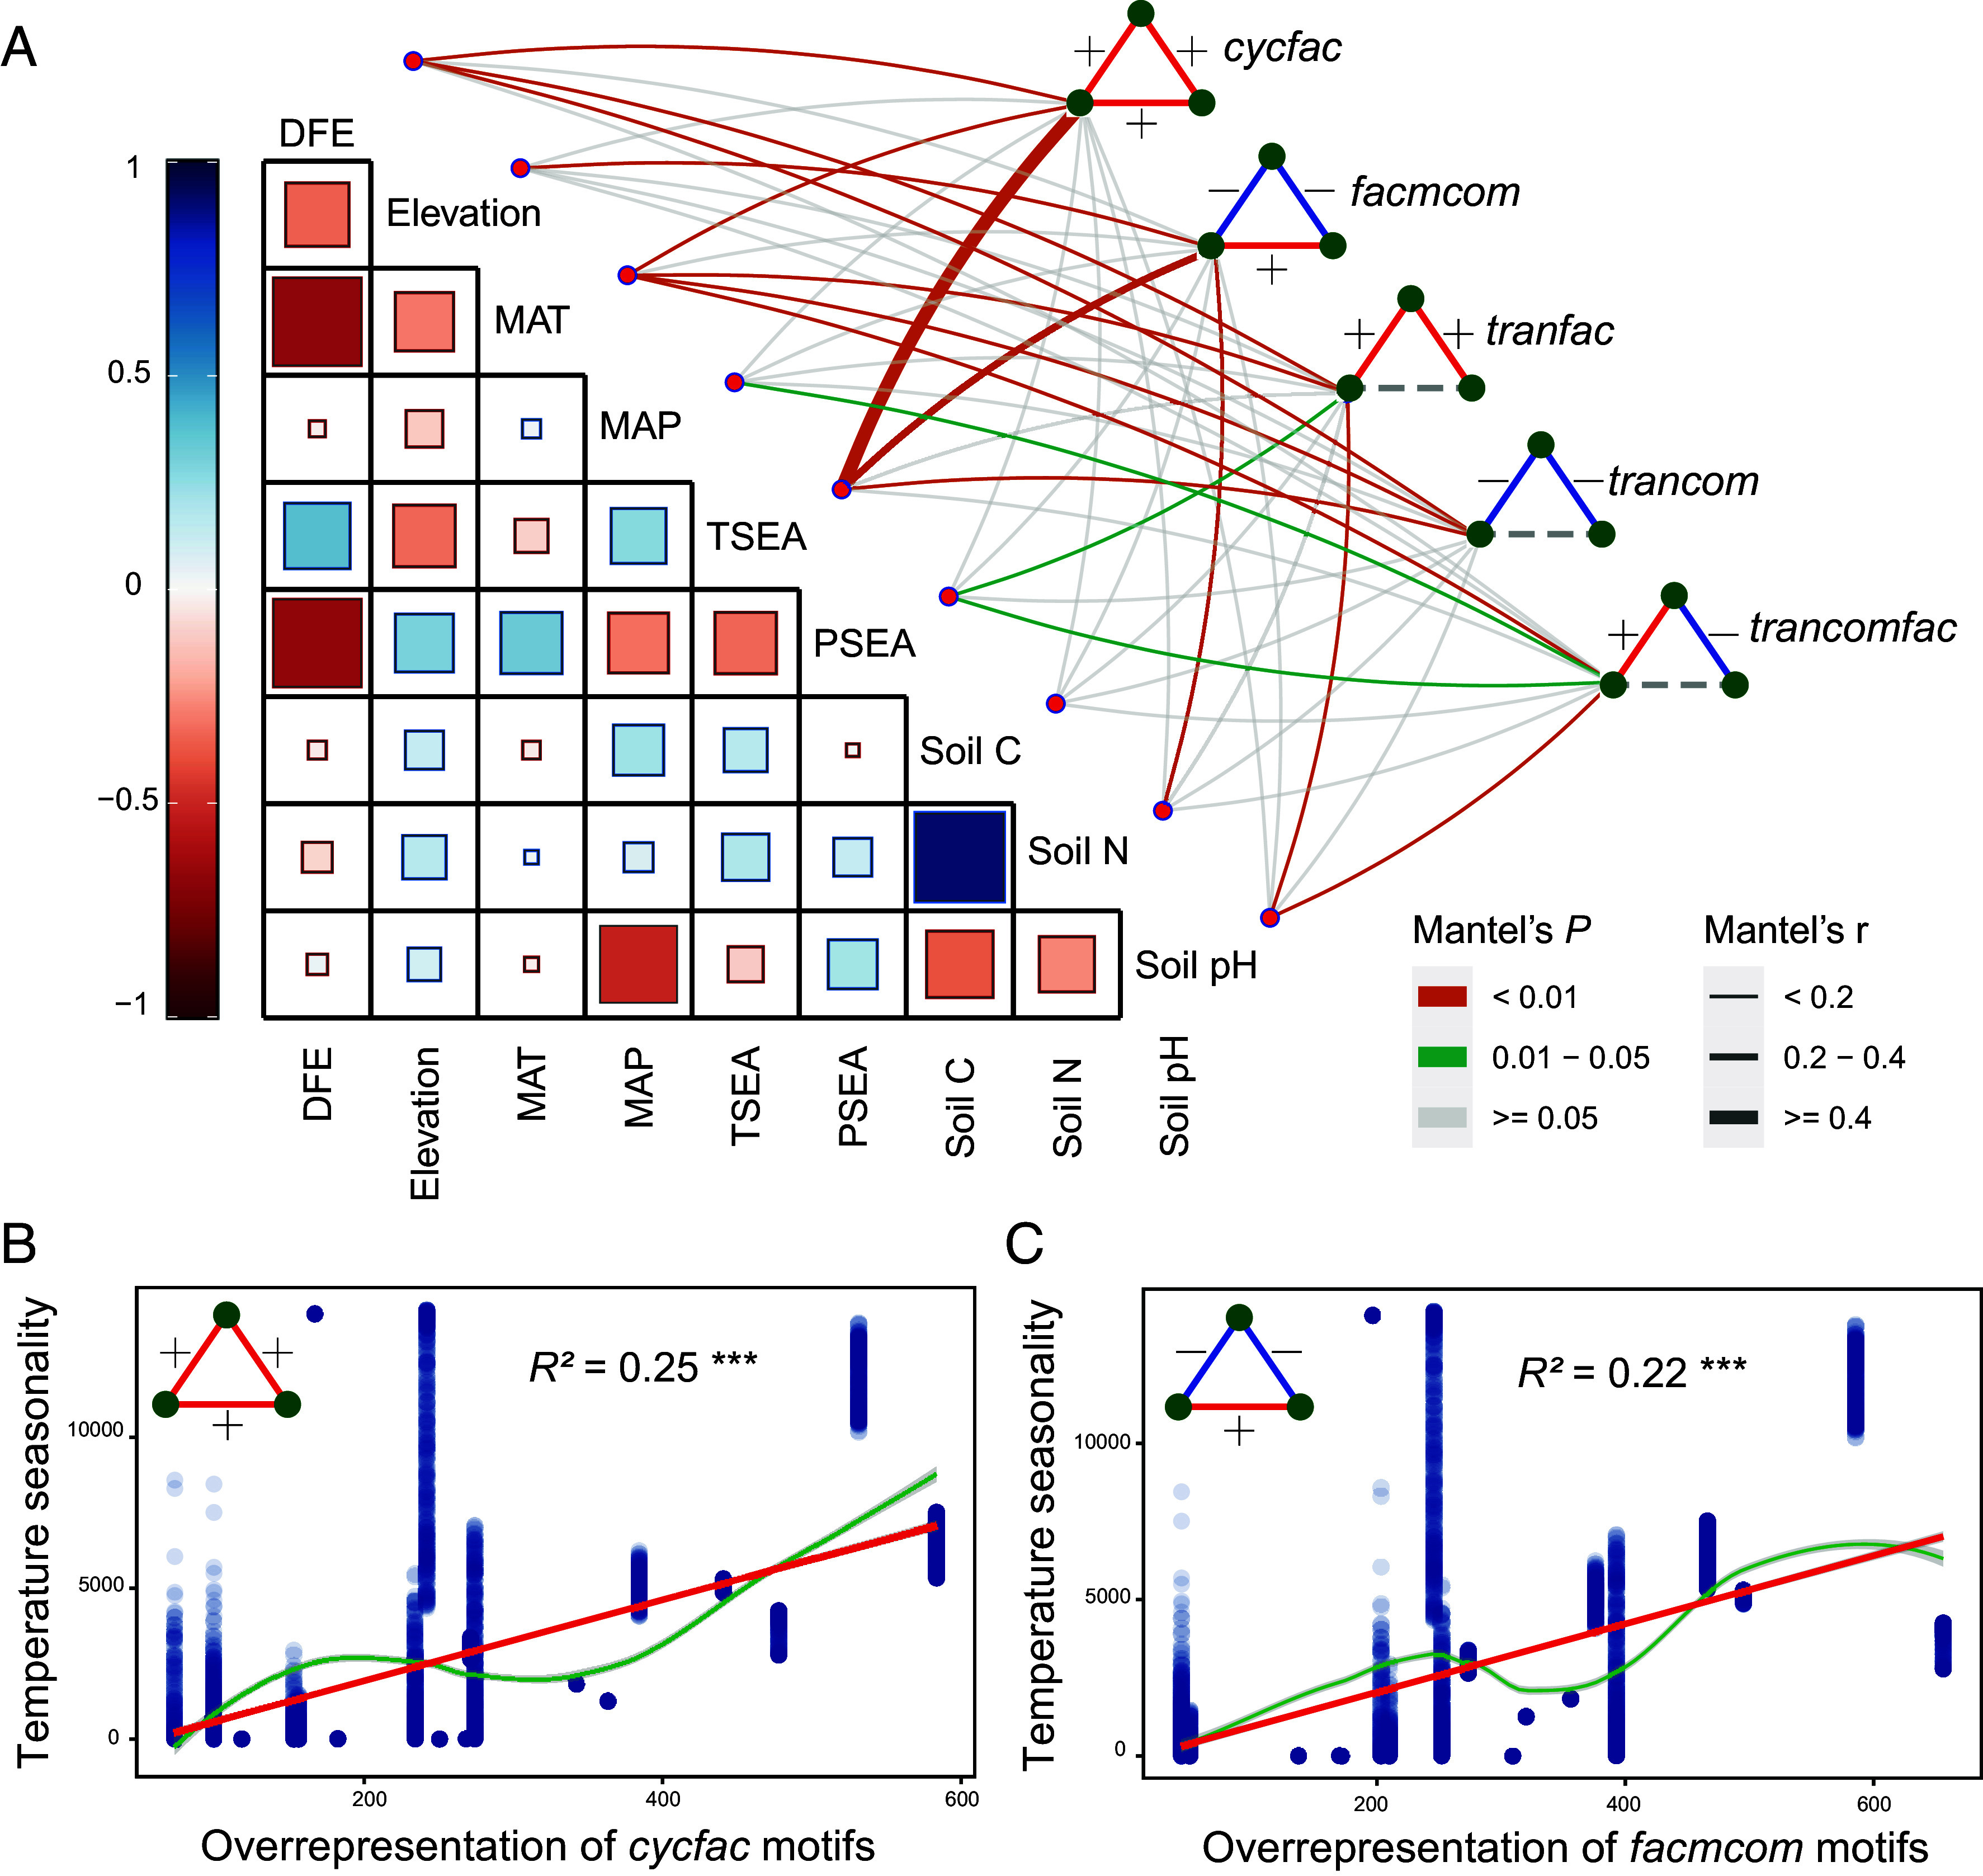
Relationships between environmental variables and network motifs within soil ecological networks worldwide. Correlations of network motifs (z-scores) with space, climate, and soil variables (A). The edge width corresponds to Mantel’s r value, and the edge color denotes statistical significance. Pairwise correlations of these variables are shown with a color gradient denoting Spearman’s correlation coefficient. Space variables include DFE and elevation. Climate variables include MAT, MAP (mean annual precipitation), TSEA, and PSEA (precipitation seasonality). Soil variables include soil C, soil N, and soil pH. Relationships between TSEA (region-weighted, y-axis) involved in the networks and overrepresentation (z-score, x-axis) of cycfac (B) and facmcom (C) motifs. The red line fitted the ordinary least squares regression, and the green line fitted the non-linear relationships by the losses method. Adjusted P-values are indicated by asterisks: ***P < 0.001.
Measuring global soil ecological networks is challenging, particularly soil organisms that are difficult to observe and quantify. As such, our study relied on ecological networks among microbial communities at the global scale. It is far from feasible to perform experiments with all possible associations between pairs and triads of soil organisms. To overcome this logistic limitation, we maximized the use of available data from the standardized field survey by adapting state-of-the-art methods. This allowed us to reconstruct multitrophic soil ecological networks at the global scale as reliably as possible. Indeed, our findings are grounded in the application of null model approaches within the context of beta diversity, chosen for their proven utility in gaining insights into community assembly (36). In particular, we here integrated such null models into the study of ecological networks to interpret the ecological implications of microbial associations from observational data. Nevertheless, to standardize comparisons with future datasets, it is crucial to consider the use of null-model-based network analysis carefully. Selecting key properties and ensuring the reliability of network inference is paramount (9). By paying this meticulous attention, our network reconstruction has provided an overwhelming role to positive associations while suggesting that soil ecological networks differ from what has been documented before for macroscopic terrestrial systems in which negative associations or modular network structures dominate (37). Although our study makes significant advancements, it opens the door to future research worth considering. First, complex ecological networks are composed of inter- and intra-specific associations, as well as higher-order associations across multiple trophic levels, implying that we cannot ignore the importance of unconsidered variables in biodiversity and functions. Second, our analyses did not consider rare species and weak correlation that might account for the lack of commensalism and amensalism, which are also required to be considered and integrated into soil network studies.
Overall, we provide a different perspective on the prevalence of positive associations among both pairs and triads of soil taxa in supporting the complex soil system and maintaining multitrophic soil biodiversity. The consequences of such prevalence are important because the simulations of keystone taxa losses against potential perturbations showed that direct and indirect facilitative motifs contributed to minimizing losses and stabilizing ecological networks. These results seem to be a particular feature of soil microbial networks which support multiple connected functions. Yet, the consistency of the patterns observed at the global scale suggests more broadly that cooperative groups of coexisting soil taxa embedded in complex networks can prove to be valuable for establishing solid bridges between the maintenance and function of biodiversity under ongoing global changes.
Materials and Methods
Global Field Survey.
Our global field survey included 615 composite topsoil samples (top ~0 to 10 cm) collected from 151 locations in all continents across contrasting ecosystems (covers regions with different characteristics, including temperate, tropical, and dry forests; cold, temperate, tropical, and arid grasslands; shrublands and boreal forests) between 2016 and 2019 (27). This standardized survey was conducted to assess soil biodiversity in different ecosystems around the world by considering the importance of topsoil in preserving soil processes and hosting soil organisms. The sampling sites were selected primarily on the basis of vascular and nonvascular vegetation that represented the sampled ecosystems (38). Therefore, soil samples beneath the dominant vegetation at each site were collected following the protocol described in a previous study (39).
Furthermore, this survey incorporated multiple composite soil samples from each site to account for the spatial variability of climatic factors, soil properties, and biodiversity. The sampling approach was designed to encompass a wide range of climatic conditions (Dataset S1). For example, at a spatial resolution of 1 km2, the mean annual precipitation (MAP) and MAT ranged from 45 to 2,833 mm and from −7.6 to 26.4 °C, respectively (https://www.worldclim.org). Meanwhile, WorldClim v.2 revealed that TSEA and precipitation seasonality (PSEA) varied from 0 to 14,239 and 10 to 170, respectively. The sampling approach also considered various edaphic characteristics on a global scale, including a soil pH range of 3.49 to 9.54, soil C content from 0.3 to 473.6 g kg−1, soil N content from 0.001 to 2.443 g kg−1, and clay content between 1.89% and 79.9%. Thus, a comprehensive and global representation of soils was obtained. Geographic coordinates and elevation data were obtained during sampling using GPS instruments, and geographic coordinates were noted according to the DFE. After sampling, soil samples were sieved using a 2-mm mesh. A segment of the soil was frozen at −20°C to analyze the multiple trophic levels of soil organisms by molecular analysis, while the remaining soil was air-dried and used for physicochemical analysis.
Overall, we recorded and compiled space, climate, and soil data at each sampling site, including latitude, longitude, elevation, DFE, MAT, MAP, TSEA, PSEA, soil C content, soil N content, soil pH, and the percentage of clay and silt content (also defined as fine soil texture). Additional details of this field survey can be found in Dataset S6 (27).
Soil Microbiome.
The Illumina MiSeq platform was used to assess the soil biodiversity [i.e., number of phylotypes (richness)] and community composition [i.e., the proportion of phylotypes (%)] of multiple trophic levels of soil organisms (bacteria, fungi, protists, and invertebrates) via amplicon sequencing by following a previously published protocol (40). The PowerSoil DNA Isolation Kit (MoBio Laboratories) was used in accordance with the manufacturer’s instructions to extract soil DNA. A portion of the prokaryotic 16S and eukaryotic 18S ribosomal Ribonucleic Acid (rRNA) genes were sequenced using the 515F/806R (41) and Euk1391f/EukBr (42) primer sets, respectively. Bioinformatics processing was performed for raw sequences by combining QIIME (43), USEARCH (44), and UNOISE (45). Soil phylotypes, which are amplicon sequence variants (ASVs) with 100% similarity, were derived using the above-mentioned analyses. In this study, “soil taxa” is used as a synonym for “soil phylotypes or ASVs” to increase comprehension for non-specialist readers. The Silva v.132 16S gene database (46) and PR2 18S gene database (47) were used to annotate the representative sequences of phylotypes by the UCLUST method in QIIME v.1.9.1. The abundance matrix of soil phylotypes was rarefied to ensure even sampling depths within each belowground group of soil organisms, with 5,000 sequences per sample for bacteria (16S rRNA gene), 1,000 sequences per sample for fungi (18S rRNA gene), 800 sequences per sample for protists (18S rRNA gene), and 100 sequences per sample for invertebrates (18S rRNA gene). Protists were classified according to Oliverio et al. (48) that contained all eukaryotic taxa, excluding fungi, invertebrates (Metazoa), and vascular plants (Streptophyta). Samples that did not meet the rarefaction threshold were removed.
Soil Ecological Networks.
Network inference.
To explore complex associations among multitrophic soil organisms, we established soil ecological networks comprising multitrophic soil organisms to infer network associations among soil taxa, including positive (i.e., potential facilitation) and negative (i.e., potential competition) relationships (9). We first clustered all sites and associated composite soil samples in independent spatial regions of the planet based on a geographic distance matrix using the hclust function. These regions were then used to generate independent soil ecological networks to test our research questions and hypotheses. All 615 composite soil samples in this study were clustered into 20 regions across the globe (Fig. 1). Downstream analyses were independently conducted for these 20 regions. First, we identified dominant soil taxa in these 20 regions, and then the rarefied ASV abundance tables were filtered to focus on relatively dominant taxa within each region by following two criteria used in previous studies: 1) ubiquity (ASVs in >25% of all samples within a given region) and 2) abundance (ASVs with mean relative abundances > 0.01%) (18). Such filtering criteria were used to avoid a biased impact of rare taxa in a region in our network analysis, which is known to occur in correlation-based ecological network-building techniques and can lead to false correlations. These taxa are relatively dominant and expected to be consequential in sustaining function and biodiversity, as they include the most abundant organisms in soils. After these analyses, we generated 20 soil ecological networks based on the dominant taxa of the 20 independent regions.
To ensure the robustness and reproducibility of soil ecological networks, we adopted an ensemble method of network inference (CoNet, https://github.com/ramellose/CoNetinR) based on multiple similarity measures and generalized boosted linear models. Considering the variations in sample sizes among the regions involved, we implemented a bootstrap sampling procedure to mitigate the influence of sampling errors. The underlying concept was to randomly select a specific number of subsets (we used a sample size of 10) from a single region to construct a network. This process was repeated 1,000 times for one region to obtain the median of all associations between identical pairs of soil taxa to characterize their potential ecological relationships. In cases where the sample size of a particular region fell below the minimum threshold, the local network was derived by extracting the sub-network from the global network based on community composition, as previously described (6, 26).
Specifically, we used Spearman correlation and Bray–Curtis dissimilarity analysis to evaluate the strength (i.e., correlation coefficients) and direction (i.e., positive or negative) of ecological associations between pairs of soil taxa. To ascertain the accuracy (i.e., P-values) of the associations between pairs, we used permutation and bootstrap distributions (999 iterations each) by randomly rearranging the taxon abundances and randomly selecting samples with replacements. The P-values for each measure were combined using Brown’s method (49) and adjusted using the Benjamini–Hochberg procedure (50). To ensure that the distribution of soil ecological networks follows ecological principles, correlation coefficients were examined using random matrix theory (RMT) (51). This enabled the identification of a cut-off threshold to enhance the reliability of the inferred networks. After these analyses, the correlation coefficients with adjusted P-values above 0.05 and weights below the RMT thresholds were discarded. Isolated network nodes were removed from each network. We conducted multiple complementary analyses to eliminate potential false correlations within the 20 independent soil ecological networks. This method is more appropriate for detecting the type of positive and negative correlations, but it should be employed with caution in network analysis scenarios where the strength of the correlations needs to be taken into account.
Network adjacency matrices (Aij), which were generated in accordance with the ecological networks of the given region, comprised a set of nodes (n) connected by undirected links (L). The undirected links between pairs of nodes exhibited weighted values ranging from −1 to 1, which correspond to positive (+, value > 0), neutral (0, value = 0), and negative (−, value < 0) relationships in the network. The network structure can be represented by the adjacency matrices Aij for each region, where aij (association strength) describes the association between soil taxa i and j, which is the basis for subsequent computations of network properties.
Network complexity.
To explore the network structures of the 20 regions, we investigated the complexity of each soil ecological network. We first converted the adjacency matrices of each individual soil ecological network into the igraph format to calculate some representative topological indices using igraph and ggClusterNet packages in R v.4.1.0. These indices, which include the number of nodes (n) and links (L), the proportion of negative links, average degree, the centrality of betweenness, the centrality of closeness, network modularity, and network nestedness, have been used to describe network complexity in previous studies (9, 52). To assess the significance of the soil ecological networks, the Maslov–Sneppen approach was used to generate random networks for each empirical network by randomly rearranging the connections between the nodes while keeping the number of nodes and links constant (53). For each randomization, the same set of topological indices was calculated, and the means and SD of these indices were compared with those of the empirical networks. The igraph package was used for network randomization, and the topological indices can be defined as follows:
-
(1)
Node (n), also known as network size, refers to the total number of associated taxa involved in each network and describes the structure and complexity of ecological networks.
-
(2)
Link (L), also known as network connectivity, refers to the number of associations between pairs of nodes in a network and describes network complexity.
-
(3)
The proportion of negative links, which refers to the number of negative associations divided by the total number of associations in each network, is used to understand the patterns of antagonistic relationships (i.e., potential competition) between soil taxa at the global scale (26).
-
(4)
Average degree, which refers to the connectivity per soil taxa (i.e., L/n), has been introduced by ecologists to understand network specialization. It was measured using the node_properties function in the ggClusterNet package.
-
(5)
The centrality of betweenness measures the shortest path through a given node as a proxy to estimate the core role of the node in the network. It was also measured using the node_properties function in the ggClusterNet package.
-
(6)
The centrality of closeness evaluates the average distance between a given node and the other nodes in a network. A higher value implies that the distance between them is shorter. This was also determined using the node_properties function in the ggClusterNet package.
-
(7)
Network modularity is used to assess the extent to which a network is divided into distinct modules where the nodes within each module possess numerous connections with each other while possessing few connections with nodes in other modules. As the size and other characteristics of networks differ greatly, relative modularity (RM) is a more accurate way to compare the modular structures of different networks. In this study, RM was calculated as the ratio of the difference between the modularity of an empirical network and the mean modularity of random networks over the mean modularity of random networks. Modularity was estimated using the modularity function based on the fast greedy clustering algorithm in the igraph package.
-
(8)
Network nestedness describes the extent to which taxa interacting with specialists are subsets of those associated with generalists (54). This metric has a range from zero to one, where zero implies that taxa interacting with specialists are not a part of those interacting with generalists; however, one indicates that taxa associated with specialists are a complete subset of those interacting with generalists. Similar to RM, relative nestedness was also calculated as the ratio of the difference between the nestedness of an empirical network and the mean nestedness of random networks over the mean nestedness of random networks. Nestedness was determined using the nestednodf function in the vegan package.
Network stability.
In addition to network complexity, network stability is important for understanding the stability of soil ecological networks that comprise multiple trophic levels of soil organisms to potential taxa losses caused by perturbations. In this study, we evaluated the stability of soil ecological networks globally by calculating network fragility, which is also known as network robustness. This was implemented by simulating the targeted and random extinction of soil taxa when exposed to potential perturbations, as previously described (55). To simulate the effects of keystone taxa losses, specific network hubs with high degrees and betweenness were removed from the network, while random network nodes calculated using null models were selected and removed to simulate random fluctuations. To evaluate the impact of this removal on the remaining community, we compared the natural connectivity of the network structure before and after the potential loss of keystone taxa. Network fragility was determined by calculating the rate of change in the matrix eigenvalue (natural connectivity) after targeted node removal:
where nce is the natural connectivity of empirical networks within each region, and ncr is the natural connectivity of simulated networks after targeted node removal. When tested in various ecosystems, this approach is a reliable indicator of network stability for multitrophic soil ecological networks.
Network motifs.
To better elucidate the structure of soil ecological networks, we quantified the frequency of network modules among the three phylotypes, which are also called network motifs (21). These motifs are formed by triads of soil taxa (i.e., three phylotypes) and are considered the basic building blocks of complex networks. Furthermore, network motifs incorporating multiple associations between soil taxa were used to explore the role of complex biotic associations among multitrophic soil organisms in promoting soil taxa coexistence and maintaining biodiversity. Owing to the undirected associations, the characteristics of soil ecological networks were different from those of macro-ecological communities (SI Appendix, Fig. S4) (14): 1) cycle facilitation, cycfac (A↔B: +, B↔C: +, C↔A: +); 2) cycle competition, cyccom (A↔B: −, B↔C: −, C↔A: −); 3) facilitation-mediated competition, facmcom (A↔B: −, A↔C: −, B↔C: +); 4) competition-mediated facilitation, commfac (A↔B: +, A↔C: +, B↔C: −); 5) transitive facilitation, tranfac (A↔B: +, A↔C: +); 6) transitive competition, trancom (A↔B: −, A↔C: −); and 7) transitive competition and facilitation, trancomfac (A↔B: +, A↔C: −).
A phenomenological model of community dynamics was designed according to the characteristics of soil ecological networks. Network motifs were considered in isolation using the following network adjacency matrices and iterated using each network matrix:
| [1] |
| [2] |
| [3] |
| [4] |
| [5] |
| [6] |
| [7] |
To assess whether network motifs were more prevalent compared with random networks (called overrepresentation), repeated calculations were conducted on 999 random networks. A quantitative shuffle method was used to randomize soil taxa among sites while preserving their occurrence and relative abundance. This approach uses a standard null model of community ecology for shuffling the community matrix (i.e., taxa × sites) (56, 57). Consequently, the overrepresentation of network motifs was calculated using the standard z-score:
where the number of each network motif (obs) was compared with the mean and SD of the same type of motif across random networks (exp). The significance of the observed patterns was measured as follows:
where I[obs > exp] is an indicator function that equals 1 when the frequency of observed motifs is greater than the random value, while it exhibits a value of 0 for all simulations plus one empirical value.
Statistical Analysis.
Correlation analyses.
We then aimed to link environmental conditions with ecological network properties. Spearman correlation analysis was performed using the cor.test function in R and represented by heatmaps, such as the linkages of network motifs with environmental factors and network topologies shown in SI Appendix, Fig. S14. Ordinary least squares regression was used to estimate linear relationships, such as those observed between network motifs and soil biodiversity (Fig. 3). R2 and P-value were used to determine the explained proportion and significance of the regression models. A redundancy analysis, which was performed using the rda function in the vegan package, revealed the variation in network topology across the 20 soil ecological networks and elucidated the effects of explanatory factors (i.e., environmental variables and network motifs) on the variation in network topological structures (SI Appendix, Figs. S11 and S12). Significant differences in these explanatory factors were observed for each network topological structure using the adonis function in the vegan package, and explanatory factors were fitted onto the ordination using the envfit function. Mantel tests were performed using the mantel function in the vegan package to determine the driving forces of network motifs (Fig. 4) while revealing the relationships between network motifs and topological indices across different ecological networks (SI Appendix, Fig. S13).
SEM.
In our global survey, SEM was used to evaluate the direct and indirect effects of network motifs on soil biodiversity (richness) and network fragility (robustness) after simultaneously accounting for multiple key factors. Herein, soil biodiversity represented the number of phylotypes involved in soil ecological networks across different regions, while network fragility was defined as the rate of change in natural connectivity after removing targeted nodes. The following composite variables were constructed and used as predictor variables for explaining the variation in soil biodiversity: spatial factors (elevation, DFE), climatic factors (TSEA, MAP), edaphic characteristics (pH, soil C, clay content), network architecture (modularity), network fragility, and network motifs (58). All variables were standardized before being incorporated into the model (mean = 0 and SD = 1). First, the pre-fitted linear model was used to explore the significant relationships between network motifs and soil biodiversity (z-scores) as explanatory variables and soil biodiversity as response variables (SI Appendix, Fig. S6). The pre-fitted linear model calculated the correlation (r) and significance (P) between network motifs and soil biodiversity to select important motifs of concern. After comparing the results obtained with pre-fitted linear models, we selected the motifs of cycfac, facmcom, and trancom as motif variables to construct the ultimate SEM. Spatial, climatic, and edaphic factors were included to control the effect of abiotic factors that act as important drivers of soil ecological networks. The different SEMs (cycfac, facmcom, and trancom) were compared to evaluate how network motifs regulate soil biodiversity worldwide. Specific dependencies between composite variables were included based on previous studies (59). Fisher’s C values and P-values were used to assess the goodness of fitness for the constructed SEMs, with P-values > 0.05 representing acceptable models. All SEM analyses were performed using the piecewiseSEM package.
Supplementary Material
Appendix 01 (PDF)
Dataset S01 (XLSX)
Dataset S02 (XLSX)
Dataset S03 (XLSX)
Dataset S04 (XLSX)
Dataset S05 (XLSX)
Dataset S06 (XLSX)
Acknowledgments
We thank Prof. Jordi Bascompte for his insightful comments on an earlier draft. We thank the researchers involved in the CLIMIFUN and MUSGONET projects for the collection of data. This work was funded by a Large Research Grant from the British Ecological Society (No. LRB17\1019; MUSGONET). H.C. was supported by the National Key R&D Program of China (2022YFD1500202), the Strategic Priority Research Program of Chinese Academy of Sciences (XDA28020202), the National Natural Science Foundation of China (42230511, 92251305), and the Second Tibetan Plateau Scientific Expedition and Research Program (STEP, 2019QZKK0503). M.D.-B. acknowledges support from the Spanish Ministry of Science and Innovation for the I+D+i project PID2020-115813RA-I00 funded by MCIN/AEI/10.13039/501100011033. M.D.-B. was also supported by a project of the Fondo Europeo de Desarrollo Regional (FEDER) and the Consejería de Transformación Económica, Industria, Conocimiento y Universidades of the Junta de Andalucía (FEDER Andalucía 2014-2020 Objetivo temático “01—Refuerzo de la investigación, el desarrollo tecnológico y la innovación”) associated with the research project P20_00879 (ANDABIOMA). O.G. acknowledges financial support provided by the Spanish Ministry of Economy and Competitiveness and by the European Social Fund through a Ramón y Cajal contract (RyC 2017-23666).
Author contributions
X.L., H.C., and M.D.-B. designed research; X.L., H.C., and M.D.-B. performed research; X.L., H.C., and M.D.-B. contributed new reagents/analytic tools; X.L., H.C., K.F., G.-F.G., T.Y., and M.D.-B. analyzed data; O.G. revised the paper; Y.M. discussed about the paper; and X.L., H.C., O.G., K.F., G.-F.G., T.Y., Y.M., and M.D.-B. wrote the paper.
Competing interests
The authors declare no competing interest.
Footnotes
This article is a PNAS Direct Submission. M.D.B. is a guest editor invited by the Editorial Board.
Contributor Information
Haiyan Chu, Email: hychu@issas.ac.cn.
Manuel Delgado-Baquerizo, Email: m.delgado.baquerizo@csic.es.
Data, Materials, and Software Availability
The code used in data analysis has been deposited at github.com/joshualiuxu/Network-motifs-explain-soil-organism-coexistence-and-biodiversity (60). All study data are included in the article and/or supporting information.
Supporting Information
References
- 1.Crowther T. W., et al. , The global soil community and its influence on biogeochemistry. Science 365, eaav0550 (2019). [DOI] [PubMed] [Google Scholar]
- 2.Bardgett R. D., van der Putten W. H., Belowground biodiversity and ecosystem functioning. Nature 515, 505–511 (2014). [DOI] [PubMed] [Google Scholar]
- 3.Hu J., Amor D. R., Barbier M., Bunin G., Gore J., Emergent phases of ecological diversity and dynamics mapped in microcosms. Science 378, 85–89 (2022). [DOI] [PubMed] [Google Scholar]
- 4.Tilman D., Isbell F., Cowles J. M., “Biodiversity and ecosystem functioning” in Annual Review of Ecology, Evolution, and Systematics, D. J. Futuyma, Ed. (Annual Reviews, Palo Alto, 2014), vol. 45, pp. 471–493. [Google Scholar]
- 5.Yang X., et al. , Net plant interactions are highly variable and weakly dependent on climate at the global scale. Ecol. Lett. 25, 1580–1593 (2022). [DOI] [PubMed] [Google Scholar]
- 6.Yuan M. M., et al. , Climate warming enhances microbial network complexity and stability. Nat. Clim. Change 11, 343–348 (2021). [Google Scholar]
- 7.Delgado-Baquerizo M., et al. , Increases in aridity lead to drastic shifts in the assembly of dryland complex microbial networks. Land Degrad. Dev. 31, 346–355 (2020). [Google Scholar]
- 8.Frost C. M., et al. , Using network theory to understand and predict biological invasions. Trends Ecol. Evol. 34, 831–843 (2019). [DOI] [PubMed] [Google Scholar]
- 9.Guseva K., et al. , From diversity to complexity: Microbial networks in soils. Soil Biol. Biochem. 169, 108604 (2022). [DOI] [PMC free article] [PubMed] [Google Scholar]
- 10.Faust K., Open challenges for microbial network construction and analysis. ISME J. 15, 3111–3118 (2021). [DOI] [PMC free article] [PubMed] [Google Scholar]
- 11.Romdhane S., et al. , Unraveling negative biotic interactions determining soil microbial community assembly and functioning. Isme J. 16, 296–306 (2022). [DOI] [PMC free article] [PubMed] [Google Scholar]
- 12.Palmer J. D., Foster K. R., Bacterial species rarely work together. Science 376, 581–582 (2022). [DOI] [PubMed] [Google Scholar]
- 13.Dehling D. M., Barreto E., Graham C. H., The contribution of mutualistic interactions to functional and phylogenetic diversity. Trends Ecol. Evol. 37, 768–776 (2022). [DOI] [PubMed] [Google Scholar]
- 14.Losapio G., et al. , Network motifs involving both competition and facilitation predict biodiversity in alpine plant communities. Proc. Natl. Acad. Sci. U.S.A. 118, e2005759118 (2021). [DOI] [PMC free article] [PubMed] [Google Scholar]
- 15.Gralka M., Szabo R., Stocker R., Cordero O. X., Trophic interactions and the drivers of microbial community assembly. Curr. Biol. 30, R1176–R1188 (2020). [DOI] [PubMed] [Google Scholar]
- 16.Chesson P., Kuang J. J., The interaction between predation and competition. Nature 456, 235–238 (2008). [DOI] [PubMed] [Google Scholar]
- 17.Hu A., et al. , Ecological networks of dissolved organic matter and microorganisms under global change. Nat. Commun. 13, 3600 (2022). [DOI] [PMC free article] [PubMed] [Google Scholar]
- 18.Delgado-Baquerizo M., et al. , Multiple elements of soil biodiversity drive ecosystem functions across biomes. Nat. Ecol. Evol. 4, 210–220 (2020). [DOI] [PubMed] [Google Scholar]
- 19.Kleinhesselink A. R., Kraft N. J. B., Pacala S. W., Levine J. M., Detecting and interpreting higher-order interactions in ecological communities. Ecol. Lett. 25, 1604–1617 (2022). [DOI] [PubMed] [Google Scholar]
- 20.Singh P., Baruah G., Higher order interactions and species coexistence. Theor. Ecol. 14, 71–83 (2021). [Google Scholar]
- 21.Milo R., et al. , Network motifs: Simple building blocks of complex networks. Science 298, 824–827 (2002). [DOI] [PubMed] [Google Scholar]
- 22.Beauchesne D., Cazelles K., Archambault P., Dee L. E., Gravel D., On the sensitivity of food webs to multiple stressors. Ecol. Lett. 24, 2219–2237 (2021). [DOI] [PubMed] [Google Scholar]
- 23.Giling D. P., et al. , Plant diversity alters the representation of motifs in food webs. Nat. Commun. 10, 1226 (2019). [DOI] [PMC free article] [PubMed] [Google Scholar]
- 24.Chu H., Gao G.-F., Ma Y., Fan K., Delgado-Baquerizo M., Soil microbial biogeography in a changing world: Recent advances and future perspectives. mSystems 5, e00803-19 (2020). [DOI] [PMC free article] [PubMed] [Google Scholar]
- 25.Vellend M., Conceptual synthesis in community ecology. Q. Rev. Biol. 85, 183–206 (2010). [DOI] [PubMed] [Google Scholar]
- 26.Ma B., et al. , Earth microbial co-occurrence network reveals interconnection pattern across microbiomes. Microbiome 8, 82 (2020). [DOI] [PMC free article] [PubMed] [Google Scholar]
- 27.Guerra C. A., et al. , Global hotspots for soil nature conservation. Nature 610, 693–698 (2022). [DOI] [PubMed] [Google Scholar]
- 28.Lima-Mendez G., et al. , Determinants of community structure in the global plankton interactome. Science 348, 1262073 (2015). [DOI] [PubMed] [Google Scholar]
- 29.Thebault E., Fontaine C., Stability of ecological communities and the architecture of mutualistic and trophic networks. Science 329, 853–856 (2010). [DOI] [PubMed] [Google Scholar]
- 30.Montoya J. M., Pimm S. L., Sole R. V., Ecological networks and their fragility. Nature 442, 259–264 (2006). [DOI] [PubMed] [Google Scholar]
- 31.Kehe J., et al. , Positive interactions are common among culturable bacteria. Sci. Adv. 7, eabi7159 (2021). [DOI] [PMC free article] [PubMed] [Google Scholar]
- 32.Zhang S., Mukherji R., Chowdhury S., Reimer L., Stallforth P., Lipopeptide-mediated bacterial interaction enables cooperative predator defense. Proc. Natl. Acad. Sci. U.S.A. 118, e2013759118 (2021). [DOI] [PMC free article] [PubMed] [Google Scholar]
- 33.Feng Y., et al. , Temperature thresholds drive the global distribution of soil fungal decomposers. Global Change Biol. 28, 2779–2789 (2022). [DOI] [PubMed] [Google Scholar]
- 34.Zhou J., et al. , Temperature mediates continental-scale diversity of microbes in forest soils. Nat. Commun. 7, 12083 (2016). [DOI] [PMC free article] [PubMed] [Google Scholar]
- 35.Maestre F. T., Callaway R. M., Valladares F., Lortie C. J., Refining the stress-gradient hypothesis for competition and facilitation in plant communities. J. Ecol. 97, 199–205 (2009). [Google Scholar]
- 36.Anderson M. J., et al. , Navigating the multiple meanings of beta diversity: A roadmap for the practicing ecologist. Ecol. Lett. 14, 19–28 (2011). [DOI] [PubMed] [Google Scholar]
- 37.Hernandez D. J., David A. S., Menges E. S., Searcy C. A., Afkhami M. E., Environmental stress destabilizes microbial networks. Isme J. 15, 1722–1734 (2021). [DOI] [PMC free article] [PubMed] [Google Scholar]
- 38.Maestre F. T., et al. , Plant species richness and ecosystem multifunctionality in global drylands. Science 335, 214–218 (2012). [DOI] [PMC free article] [PubMed] [Google Scholar]
- 39.Bahram M., et al. , Structure and function of the global topsoil microbiome. Nature 560, 233–237 (2018). [DOI] [PubMed] [Google Scholar]
- 40.Delgado-Baquerizo M., et al. , Changes in belowground biodiversity during ecosystem development. Proc. Natl. Acad. Sci. U.S.A. 116, 6891–6896 (2019). [DOI] [PMC free article] [PubMed] [Google Scholar]
- 41.Fierer N., et al. , Cross-biome metagenomic analyses of soil microbial communities and their functional attributes. Proc. Natl. Acad. Sci. U.S.A. 109, 21390–21395 (2012). [DOI] [PMC free article] [PubMed] [Google Scholar]
- 42.Ramirez K. S., et al. , Biogeographic patterns in below-ground diversity in New York City’s Central Park are similar to those observed globally. Proc. Biol. Sci. 281, 20141988 (2014). [DOI] [PMC free article] [PubMed] [Google Scholar]
- 43.Caporaso J. G., et al. , QIIME allows analysis of high-throughput community sequencing data. Nat. Methods 7, 335–336 (2010). [DOI] [PMC free article] [PubMed] [Google Scholar]
- 44.Edgar R. C., Search and clustering orders of magnitude faster than BLAST. Bioinformatics 26, 2460–2461 (2010). [DOI] [PubMed] [Google Scholar]
- 45.Edgar R. C., UPARSE: Highly accurate OTU sequences from microbial amplicon reads. Nat. Methods 10, 996–998 (2013). [DOI] [PubMed] [Google Scholar]
- 46.Yilmaz P., et al. , The SILVA and “All-species Living Tree Project (LTP)” taxonomic frameworks. Nucleic Acids Res. 42, D643–D648 (2014). [DOI] [PMC free article] [PubMed] [Google Scholar]
- 47.Adl S. M., et al. , Revisions to the classification, nomenclature, and diversity of eukaryotes. J. Eukaryotic Microbiol. 66, 4–119 (2019). [DOI] [PMC free article] [PubMed] [Google Scholar]
- 48.Oliverio A. M., et al. , The global-scale distributions of soil protists and their contributions to belowground systems. Sci. Adv. 6, eaax8787 (2020). [DOI] [PMC free article] [PubMed] [Google Scholar]
- 49.Poole W., Gibbs D. L., Shmulevich I., Bernard B., Knijnenburg T. A., Combining dependent P-values with an empirical adaptation of Brown’s method. Bioinformatics 32, 430–436 (2016). [DOI] [PMC free article] [PubMed] [Google Scholar]
- 50.Benjamini Y., Yekutieli D., The control of the false discovery rate in multiple testing under dependency. Ann. Stat. 29, 1165–1188 (2001). [Google Scholar]
- 51.Luo F., Zhong J., Yang Y., Scheuermann R. H., Zhou J., Application of random matrix theory to biological networks. Phys. Lett. A 357, 420–423 (2006). [Google Scholar]
- 52.Goberna M., Verdu M., Cautionary notes on the use of co-occurrence networks in soil ecology. Soil Biol. Biochem. 166, 108534 (2022). [Google Scholar]
- 53.Maslov S., Sneppen K., Specificity and stability in topology of protein networks. Science 296, 910–913 (2002). [DOI] [PubMed] [Google Scholar]
- 54.Almeida-Neto M., Guimaraes P., Guimaraes P. R. Jr., Loyola R. D., Ulrich W., A consistent metric for nestedness analysis in ecological systems: Reconciling concept and measurement. Oikos 117, 1227–1239 (2008). [Google Scholar]
- 55.Tipton L., et al. , Fungi stabilize connectivity in the lung and skin microbial ecosystems. Microbiome 6, 12 (2018). [DOI] [PMC free article] [PubMed] [Google Scholar]
- 56.Chase J. M., Kraft N. J. B., Smith K. G., Vellend M., Inouye B. D., Using null models to disentangle variation in community dissimilarity from variation in alpha-diversity. Ecosphere 2, 1–11 (2011). [Google Scholar]
- 57.Ulrich W., Gotelli N. J., Null model analysis of species associations using abundance data. Ecology 91, 3384–3397 (2010). [DOI] [PubMed] [Google Scholar]
- 58.Grace J. B., Anderson T. M., Olff H., Scheiner S. M., On the specification of structural equation models for ecological systems. Ecol. Monographs 80, 67–87 (2010). [Google Scholar]
- 59.Saiz H., Gomez-Gardenes J., Pablo Borda J., Maestre F. T., The structure of plant spatial association networks is linked to plant diversity in global drylands. J. Ecol. 106, 1443–1453 (2018). [DOI] [PMC free article] [PubMed] [Google Scholar]
- 60.Liu X., Chu H., Delgado-Baquerizo M., Network-motifs-explain-soil-organism-coexistence-and-biodiversity. Github. Available at https://github.com/joshualiuxu/Network-motifs-explain-soil-organism-coexistence-and-biodiversity. Deposited 29 September 2022.
Associated Data
This section collects any data citations, data availability statements, or supplementary materials included in this article.
Supplementary Materials
Appendix 01 (PDF)
Dataset S01 (XLSX)
Dataset S02 (XLSX)
Dataset S03 (XLSX)
Dataset S04 (XLSX)
Dataset S05 (XLSX)
Dataset S06 (XLSX)
Data Availability Statement
The code used in data analysis has been deposited at github.com/joshualiuxu/Network-motifs-explain-soil-organism-coexistence-and-biodiversity (60). All study data are included in the article and/or supporting information.