

Abstract
Background
A central feature of myalgic encephalomyelitis/chronic fatigue syndrome (ME/CFS) is post-exertional malaise (PEM), which is an acute worsening of symptoms after a physical, emotional and/or mental exertion. Dynamic measures of PEM have historically included scaled questionnaires, which have not been validated in ME/CFS. To enhance our understanding of PEM and how best to measure it, we conducted semistructured qualitative interviews (QIs) at the same intervals as visual analogue scale (VAS) measures after a cardiopulmonary exercise test (CPET).
Methods
Ten ME/CFS and nine healthy volunteers participated in a CPET. For each volunteer, PEM symptom VAS (12 symptoms) and semistructured QIs were administered at six timepoints over 72 hours before and after a single CPET. QI data were used to plot the severity of PEM at each time point and identify the self-described most bothersome symptom for each ME/CFS volunteer. Performance of QI and VAS data was compared with each other using Spearman correlations.
Results
Each ME/CFS volunteer had a unique PEM experience, with differences noted in the onset, severity, trajectory over time and most bothersome symptom. No healthy volunteers experienced PEM. QI and VAS fatigue data corresponded well an hour prior to exercise (pre-CPET, r=0.7) but poorly at peak PEM (r=0.28) and with the change from pre-CPET to peak (r=0.20). When the most bothersome symptom identified from QIs was used, these correlations improved (r=0.0.77, 0.42. and 0.54, respectively) and reduced the observed VAS scale ceiling effects.
Conclusion
In this exploratory study, QIs were able to capture changes in PEM severity and symptom quality over time, even when VAS scales failed to do so. Measurement of PEM can be improved by using a quantitative–qualitative mixed model approach.
Keywords: CHRONIC FATIGUE SYNDROME
WHAT IS ALREADY KNOWN ON THIS TOPIC.
Cardiopulmonary exercise testing (CPET) is an important tool for evaluating post-exertional malaise (PEM), a central feature of Myalgic Encephalomyelitis/Chronic Fatigue Syndrome (ME/CFS). Assessment of PEM following CPET lacks a validated quantification tool.
WHAT THIS STUDY ADDS
This mixed-methods study used qualitative interviews (QIs) and visual analogue scales (VAS) to assess PEM following CPET. QIs capture the multidimensional experience of PEM, and its change over time, more effectively than VAS. Singling out the most bothersome symptom improved the VAS assessment of PEM.
HOW THIS STUDY MIGHT AFFECT RESEARCH, PRACTICE, OR POLICY
This study provides insights into potential methods that can optimise the subjective assessments of PEM.
Introduction
Persistent and disabling fatigue, exercise intolerance, cognitive difficulties and myalgias/arthralgias are characteristics of myalgic encephalomyelitis/chronic fatigue syndrome (ME/CFS). Post-exertional malaise (PEM) is an acute worsening of these symptoms after minimal physical or mental exertion.1 The PEM experience is described as all-encompassing, difficult to predict or manage and requiring complete bedrest to recover.2 3 Three core PEM symptoms have been identified: exhaustion, cognitive difficulties and neuromuscular complaints.4 It has a characteristic delayed onset, peaking within hours to days after a triggering exertion with a duration of several days or longer.4–6 Although PEM is a central feature of ME/CFS,7 its assessment is challenging due to its subjective nature and a lack of validated quantification tools. Cardiopulmonary exercise testing (CPET) is an important tool for evaluating ME/CFS8 9 and can be used to induce PEM in research settings. The development of a scale that can accurately and reliably capture how PEM evolves over time is an essential first step to understanding its biology.
Historically, visual analogue scales (VAS) have been used for quantifying symptom severity and its change over time, especially in pain.9–11 VAS and Numeric Rating Scales (NRS) have been employed in ME/CFS studies to detect differences in physical fatigue, mental fatigue and painful symptoms after provocative exercise or orthostatic stress.12–18 VAS are prone to ceiling effects and are sensitive to minor variability in wording when measuring PEM.19–21 VAS and NRS have been used to measure the point-in-time evolution of PEM8 22 23 but have not been validated for PEM measurement.
While the DePaul Symptom Questionnaire (DSQ) has provided the field with a validated tool for assessing PEM,19 21 24 the instrument uses lengthy recall periods and was not designed to capture PEM in real time. Other retrospective questionnaires have been used to capture PEM symptom breadth, severity and duration, including the Patient-Reported Outcomes Measurement Information System, Short Form 36 Health Survey Questionnaire, Chronic Fatigue Questionnaire and Fatigue Impact Scale.21 25 26 These instruments use lengthy temporal intervals in symptom assessment (7 days, 30 days, 6 months) that are unsuitable for measuring moment-to-moment change. Baraniuk27 and colleagues created a composite measure of the eight ancillary symptoms of the Fukuda criteria28 that performed well in distinguishing ME/CFS patients from healthy volunteers (HVs). Building on this, Moore et al,29 quantified PEM using a composite measure of nine symptom domains and found it able to distinguish ME/CFS patients from sedentary controls and useful for tracking recovery from exercise testing.
Open-ended questionnaires have also been used to capture PEM following CPET. Twomey et al30 provided volunteers an open-ended questionnaire 96 hours after exercise testing with instructions to recall the previous 4 days. Other studies have provided questionnaires ahead of time, instructing patients to answer questions at several timepoints following the exercise test.15 31 These types of retrospective methodologies and the use of predetermined questions are unavoidably subject to recall bias and limit the potential range of responses.4 5 21 22
An interactive assessment that probes and clarifies the breadth and severity of symptoms at a point-in-time during the experimental initiation of PEM is an important step towards the discovery of its biological correlates. Qualitative interviews (QIs) afford patients the opportunity to fully delineate the breadth and complexity of their PEM experience. The current study uses QIs to capture PEM symptoms at structured intervals following CPET testing and aims to improve current measurement of PEM by employing a mixed-methods approach (collection and analysis of both quantitative VAS and qualitative QI data) to concurrently measure PEM in real time. In this study, we evaluate the benefits and drawbacks of this method and make this approach available to other interested clinicians and scientists in the field.
Materials and methods
Study design
Data were collected as part of the ME/CFS Protocol at the National Institutes of Health (NCT02669212), which was approved by the NIH Institutional Review Board (IRB). This was a deep phenotyping study of ME/CFS and HVs that included a CPET intervention designed to induce PEM with serial follow-up performed over 72 hours. In the current study, we chose a convergent parallel mixed methods study design, in which quantitative and qualitative data were collected simultaneously; the data were analysed independently and then merged and interpreted together. The convergent design brings together the strengths and non-overlapping weaknesses of qualitative (in-depth; detailed) and quantitative (generalisable; able to show trends) methods.32 Triangulation of the qualitative and quantitative data in the current study (comparing and contrasting QI and VAS data) allows for a more comprehensive understanding of PEM and is supported by validated guidelines.33 Mixed methods designs have grown in importance in health research.34 35 The objective of the current study was to use qualitative data to improve on the performance of standard VAS measurements in determining the relative severity over time within an individual’s experience of PEM.
Participants
Study recruitment occurred between December 2016 and February 2020. Of 484 ME/CFS inquiries, 217 individuals underwent detailed case reviews, and 27 ME/CFS and 25 HVs underwent in-person research evaluation. Of these, a subgroup of 10 volunteers with ME/CFS and 9 HVs completed the CPET experiment. To the extent possible, HVs were recruited to match demographic characteristics of ME/CFS volunteers. All ME/CFS volunteers met 2015 IOM ME/CFS criteria and were unanimously determined to have ME/CFS by a panel of clinical experts. This study was approved by the NIH Institutional Review Board (NIH Federalwide Assurance; FWA #: 00005897).
Although additional recruitment was terminated due to the COVID-19 pandemic, the study had high ‘information power’ as termed by Malterud et al36 who developed a model for assessment of sample size in qualitative interviewing studies. Studies with high information power require a lower sample size. Using their appraisal tool, the current study had high information power on all five items included in the model: (1) narrow study aim of assessing symptoms for 72 hours following CPET; (2) participants with specific shared experiences due to the highly specific recruitment criteria for the ME/CFS volunteers; (3) a well-established phenomenon of PEM in ME/CFS4 13–15; (4) interviews that contained rich dialogue and were conducted by an experienced researcher and (5) in-depth thematic analysis of hundreds of pages of transcripts from a small number of volunteers.
Cardiopulmonary exercise testing
CPET is an exercise physiology protocol that is used to measure exercise performance and tolerance. It involves performing exercise on a cycle ergometer that starts at a level considered easy and steadily becomes more challenging over time. Volunteers are instructed to exercise until they reach subjective exhaustion and cannot continue to exercise further.37 Small clinical studies report that a single CPET session (1-day CPET) is a reliable way to induce PEM in individuals with ME/CFS.13 38 The NIH protocol used single-session CPET as a method to induce PEM for scientific inquiry. All ME/CFS volunteers rested for at least 2 days prior to undergoing CPET and met the criteria for a successful aerobic effort on CPET, with respiratory exchange ratio of 1.1 or greater.
Data collection
An experienced female qualitative researcher conducted all the semistructured QIs. Several days before the CPET, the interviewer met with the volunteer at length to introduce herself and establish rapport. QIs were conducted at several timepoints before and after volunteers underwent CPET testing (1 hour pre-CPET; 1, 4, 24, 48 and 72 hours post-CPET). Phrasing used in the QIs was open ended and asked the volunteer to describe current physical, cognitive and emotional symptoms (online supplemental appendix 1). We have found in previous work that this broad, open-ended phrasing prompts volunteers to thoroughly describe all symptoms they are experiencing while organically drawing out symptoms most important to the individual.4
bmjno-2023-000529supp001.pdf (35.6KB, pdf)
All interviews were conducted bedside in the volunteer’s hospital room with one study team member observing, except for the 4-hour post-CPET interview, which was conducted via telephone due to the volunteer undergoing respiratory exchange measurements in a metabolic chamber. Each interview lasted 30–45 min and was recorded and transcribed. By performing an assessment before undergoing CPET, we established each volunteer’s pre-CPET level. We sought to fully understand symptoms following CPET and to ascertain perceptions of the changes in symptom severity between timepoints. To gauge the severity of PEM, we asked ME/CFS volunteers to compare their current PEM with an episode in their day-to-day life during which they had severe PEM. Although the specific triggering event was different for each person, using the benchmark of ‘severe PEM’ created an individualised standard that could be compared across participants. Participants chose memorable events such as weddings and graduations. These memorable events created an internal standard for comparison that was salient to each participant’s experiences. All interviews were audio recorded and transcribed by a professional service. VAS data were collected for 12 symptoms immediately following the QI and at the same six timepoints: physical fatigue, mental fatigue or mental fog, muscle aches, joint aches, headache, muscle weakness, light headedness, flu-like symptoms, sore throat, gastrointestinal symptoms, shortness of breath and sensitive to environment. Volunteers were provided a tablet and instructed ‘to place an ‘X’ on a line for each symptom to indicate how they felt RIGHT NOW’. (figure 1). Lines were anchored on the left and right side indicating ‘NOT AT ALL’ and ‘MOST EXTREME’.
Figure 1.
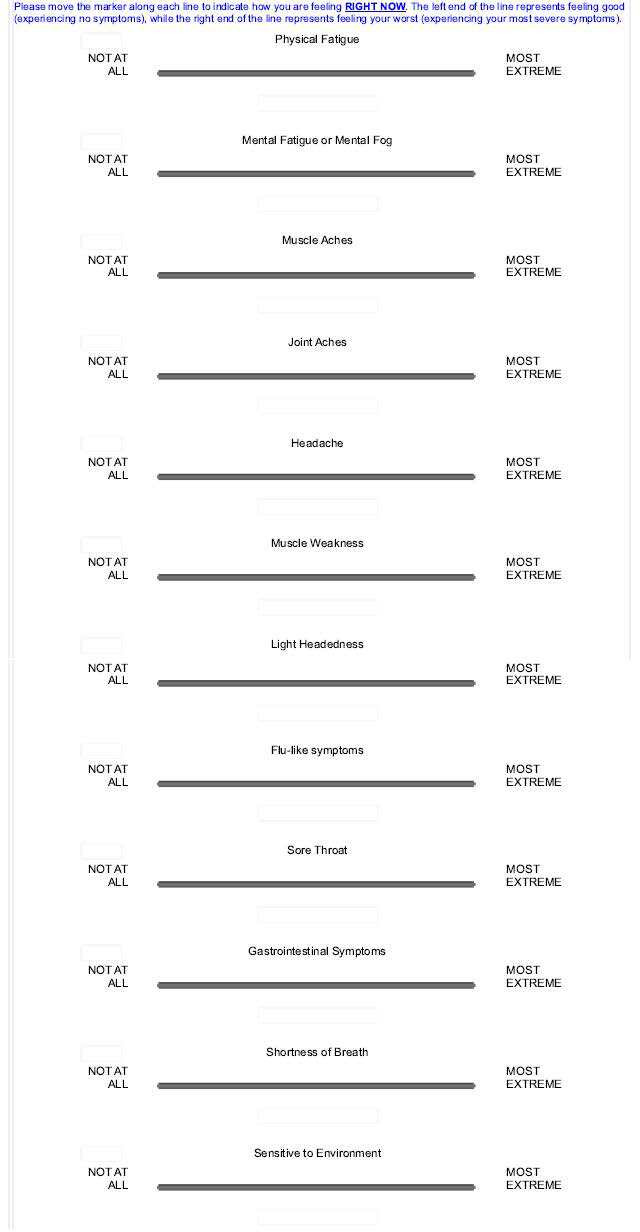
Visual analogue scale (VAS) for symptoms of post-exertional malaise.
Below is an excerpt from an interview at 4 hours post-CPET that illustrates how the QI can provide contextual information to aid in the interpretation of VAS scores. In the example, the ME/CFS volunteer described the change in their headache from 1-hour post-CPET to 4-hour post-CPET and the volunteer’s VAS score for headache was 78 at 1-hour post-CPET and 96 at 4-hour post-CPET.
Q: So can you tell me how you’re feeling right now physically?
A: Still fairly exhausted. And I have a headache not much different than what I felt like when I first came out [of CPET]. A little bit better, but not much.
Q: What symptom is bothering you the most right now?
A: Probably my headache is the most stressing part right now.
Q: Is it as bad as when we spoke 3 hours ago?
A: It’s probably one degree less. It’s probably at a 7 instead of an 8/9 or 9/10. It’s a 7/8.
This example highlights how the QI and VAS can describe different stories. Since the VAS is captured in isolation at each timepoint, the detection of change between timepoints is vulnerable to subjective interpretation of the scale in the moment with no ability to directly ask about differences between points. Furthermore, headache, not fatigue, was the most bothersome symptom. Asking volunteers to compare to the previous timepoint enabled researchers to graphically plot the course of PEM throughout the six timepoints.
Data analysis
Qualitative Interviews
Qualitative data analysis was informed by the phenomenological qualitative research approach, which provides the theoretical tool for understanding the experiences of a group of people from the views of that group.39 40 An experienced qualitative researcher trained three additional researchers who had previous experience in data collection and coordination of clinical research. Each of the four researchers individually read hundreds of pages of transcripts to gain familiarity with and immerse themselves in the data. Each researcher then analysed, evaluated and synthesised the entirety of the PEM experience as described by volunteers and guided by literature on the experience of PEM. Transcripts ranged in length from approximately 15 000–40 000 words per volunteer. Each researcher separately plotted the trajectory of PEM across the six timepoints and individually determined the time of peak PEM and the most bothersome symptom. After all researchers finished independently analysing a volunteer, the team met as a group to collectively review each transcript line by line, graph the trajectory of PEM and develop the coding structure with supporting quotes using Microsoft Excel. An audit trail of rates of agreement and meeting schedules was maintained. Before adjudication, the team reached 75% agreement based on their independent analyses. Complete consensus was achieved by the study team reviewing transcripts line-by-line together with in-depth discussions to systematically adjudicate disagreements.
Based on benchmarks described above, six categories of severity were created: usual baseline (how the volunteer usually feels on a typical day), slightly worse than usual baseline, somewhat worse than usual baseline, much worse than usual baseline, equivalent to severe triggering event and worse than severe triggering event. To meet the threshold on QI for having PEM, two criteria were required: any increase in PEM from the pre-CPET value AND a peak rating of at-least 3 (much worse than usual baseline). A peak of 3 or greater was chosen because it was clinically meaningful with disruptive symptoms. Figure 2 provides an example of PEM following CPET using the QI scale. The most bothersome symptom was determined by analysing each ME/CFS volunteer’s self-described experience of symptoms at each timepoint. HVs experienced none or minor symptoms following CPET (figure 3). Because HVs did not experience PEM, the remainder of this paper focuses on ME/CFS volunteers.
Figure 2.

Post-exertional malaise scaling example based on a qualitative interview. CPET, cardiopulmonary exercise test.
Figure 3.

Overlay of post-exertional malaise, physical fatigue and composite visual analogue scales for healthy volunteers. CPET, cardiopulmonary exercise test; PEM, post-exertional malaise.
Quantitative data
PEM data, both derived from QIs and VAS, were investigated graphically within each volunteer to understand the time courses from pre-CPET to 72 hours post-CPET. A composite measure that calculated a mean across all 12 VAS scales was created. To align with previous research more closely, we also created a 9 VAS composite scale (discarding gastrointestinal symptoms, shortness of breath and sensitive to environment). The 9 and 12 symptom versions of the composite performed virtually identically; below we report on the performance of the 12-item VAS composite scale. Correlations between PEM rating and VAS scores were visualised and tested at pre-CPET and at time of peak PEM. Longitudinal time courses were also investigated for the severity of the four symptoms described as most bothersome (physical fatigue, mental fatigue, headache and muscle ache) and the composite VAS. For each ME/CFS volunteer, correlations were conducted to describe the relationship between QI PEM, physical fatigue and composite VAS severity ratings. These correlations were repeated using each ME/CFS volunteer’s most bothersome symptom. Change in symptoms from pre-CPET to peak PEM was determined by subtracting the pre-CPET from the maximum PEM score. Spearman correlations were used throughout because non-parametric correlations are preferred with a small sample size. R statistical software V.4.0.0 was used for data analysis and visualisation.41 Correlation coefficients whose magnitude was >0.68 are strong/highly correlated, 0.36–0.67 considered modest/moderately correlated and<0.36 as low/weakly correlated.42
Results
Demographic characteristics for study volunteers are shown in table 1. Although recruitment sought to demographically match ME/CFS volunteers and HVs, there were some notable differences. HVs were recruited from the local Washington D.C. area, whereas ME/CFS volunteers represented all US geographic areas. None of the ME/CFS volunteers was working full time and only four were working part-time, whereas more than half of the HVs were working fulltime, and all were working except for one student. Seventy percent of the ME/CFS volunteers were married compared with 11% of HVs.
Table 1.
Demographic characteristics for ME/CFS and healthy volunteers
| ME/CFS volunteers (n=10) | Healthy volunteers (n=9) | |
| Sex | ||
| Male | 5 | 6 |
| Female | 5 | 3 |
| Age | ||
| 18–29 | 3 | 2 |
| 30–39 | 1 | 2 |
| 40–49 | 4 | 2 |
| 50–59 | 1 | 3 |
| 60+ | 1 | -- |
| Race | ||
| White | 8 | 8 |
| Non-White | 2 | 1 |
| Ethnicity | ||
| Hispanic | 1 | -- |
| Non-Hispanic | 9 | 9 |
| Geographic region* | ||
| Northeast US | 2 | -- |
| Southern US | 2 | 9 |
| Midwestern US | 1 | -- |
| Western US | 4 | -- |
| Canada | 1 | -- |
| Employment status | ||
| Full time | -- | 5 |
| Part time | 4 | 3 |
| Student | 1 | 1 |
| Not working due to disability | 4 | -- |
| Not working for other reasons | 1 | -- |
| Marital status | ||
| Married | 7 | 1 |
| Divorced | 2 | |
| Never married | 3 | 6 |
| Education | ||
| Less than college degree | 3 | 3 |
| College degree | 3 | 2 |
| Graduate level or above | 4 | 4 |
| Years since symptom onset | ||
| 1–2 | 4 | N/A |
| 3–4 | 1 | N/A |
| 5–6 | 5 | N/A |
*Based on U.S. Census Bureau Categories.
ME/CFS, myalgic encephalomyelitis/chronic fatigue syndrome.
Qualitative data
We asked volunteers to broadly describe how they were feeling physically, cognitively and emotionally. ME/CFS volunteers often went into great detail describing their current state. One ME/CFS volunteer described how she was feeling physically as:
Well, my head hurts and my leg hurts worse. It’s nothing unexpected. I feel quivery, even though the quivering has stopped. I still feel … I don't know how to explain it. But I feel like I have gone close to that wall where I should not have….yeah. But if I lie down and hold still for the rest of the afternoon and sleep as much as possible, I haven’t hit a point of no return yet.
Another ME/CFS volunteer described her physical symptoms as:
Pretty tired. More tired than usual… I have a little bit of a headache, now that I'm sitting up. I was just lying down for a while. Yeah, I find that when I'm lying down that it relieves the headache a bit… Like this morning when I got out of bed, I felt a little lightheaded, more than usual and just like even just from waking up I felt more tired.
When elaborating on cognitive symptoms, an ME/CFS volunteer said:
Yeah. I mean, it’s difficult to recall things. I can start to worry about things that I need to remember. And then I get fixated on those things trying to remember that it becomes a chore and it’s a lot of… I just… I could be spending a lot of energy that way. You’re just surprised by the amount of energy that is required just to think. just to respond to emails, just to be coherent, those types of things.
QIs revealed the emotional toll that PEM can take on ME/CFS volunteers. As one volunteer explained:
It’s just I feel emotionally exhausted, like there’s just not much energy there for anything. I think -- if I can use the word passion for very general in terms of enthusiasm, excitement, drive for everything, that type of thing, I feel like I don't have the energy or passion to pursue anything… I mean, last night, I wanted to hear about [my wife’s] day because she had a meeting in the morning. I wanted to see how that turned out and everything. I was listening to it, and I was very curious and interested, and yet at the same time I didn't want to be on the phone call or the Skype call because I was just so tired. There’s a desire, but not the drive…
Overlay of qualitative and quantitative data for PEM severity for each ME/CFS volunteer
Figure 4 shows the course of PEM symptom severity for ME/CFS volunteers across the six timepoints overlayed with physical fatigue and the composite VAS. QI data revealed that every ME/CFS volunteer experienced PEM within the 72-hour study period with only one returning to their pre-CPET level by the final 72-hour timepoint. During QI interviews, volunteers were asked to compare how they were feeling with the previous timepoint to allow for determining changes between timepoints. When asked to compare current symptoms to the previous timepoint, one ME/CFS volunteer said:
Figure 4.

Overlay of post-exertional malaise (PEM), physical fatigue and composite visual analogue scales for myalgic encephalomyelitis/chronic fatigue syndrome (ME/CFS) volunteers. CPET, cardiopulmonary exercise test.
You know, like I said yesterday, sometimes the second day after an exercise is actually worse than the first. I think probably mentally that is probably the case today, because I mean, I slept great and I felt like I slept well and everything else, but I was still foggy, you know, this morning, which I was probably a little clearer yesterday, at least it felt like I was.
A wide variation was seen in timing of peak PEM with occurrences at every timepoint measured after CPET. When comparing QI severity to VAS severity data, physical fatigue VAS performed better than the composite VAS but failed to capture PEM for 30% of ME/CFS volunteers (5, 9 and 10) with the VAS plot line flat throughout the time course. ME/CFS volunteer 5 shows a potential confounding issue with QIs, as the pre-CPET value was rated a 4 (equivalent to severe triggering event). However, this ME/CFS volunteer rated their symptoms a 5 (worse than severe triggering event) at 24 hours suggestive of post-CPET PEM.
For half of the ME/CFS volunteers, PEM severity and VAS physical fatigue severity aligned closely indicating that, in these cases, the physical fatigue VAS captured PEM. The composite VAS failed to align with PEM severity for any of the 10 ME/CFS volunteers. In addition, several ME/CFS volunteers reported having more than one PEM peak during the time course on QIs, which was not captured by the physical fatigue VAS. Taken as a whole, these data show that interviews and VAS provided different information about the course of PEM, with QIs having more measurement granularity and face validity.
Correlations for most bothersome symptoms
During QIs, we asked volunteers to identify the symptom bothering them the most. One ME/CFS volunteer described how her most bothersome symptom was muscle pain:
My neck pain. And it’s like neck starting from the occipital lobe and then going down to like, this is my top rib, I think, …And that’s more bothersome than my fatigue right now…
QI data analysis revealed four symptoms as most bothersome for these ME/CFS volunteers: physical fatigue (40%), mental fatigue (20%), headache (30%) and muscle ache (10%). Table 2 presents r values for the correlations of PEM between the QI and VAS severity scores when measured at pre-CPET, at the time of peak PEM, as well as the change between pre-CPET and peak PEM for the four most bothersome symptoms and the composite VAS. When looking at the data combined across ME/CFS volunteers, singling out the most bothersome symptom outperformed individual and composite VAS scales at all timepoints. When focusing on individual timepoints, strong correlations were seen for physical fatigue (r=0.70), mental fatigue (r=0.66) and the composite VAS (r=0.70) at pre-CPET, whereas muscle ache and headache had weak correlations (r=0.39 and 0.34, respectively). However, at the time of maximum PEM, the same correlations were uniformly weak. When change over time from pre-CPET to peak PEM was considered, correlations between QIs and VAS were also weak (r=0.03 to 0.37).
Table 2.
R values for correlations between post-exertional malaise and visual analogue scale among ME/CFS volunteer’s report of most bothersome symptom (n=10)
| ME/CFS volunteers’ most bothersome symptom | 12-item composite VAS* |
|||||
| Combined most bothersome symptom for all volunteers (n=10) r (p value) |
Physical fatigue (n=4) r (p value) |
Mental fatigue (n=2) r (p value) |
Muscle ache (n=1) r (p value) |
Headache (n=3) r (p value) |
||
| Correlations for selected timepoints for all ME/CFS volunteers combined | ||||||
| Pre-CPET | 0.77 (0.01) | 0.70 (0.02) | 0.66 (0.04) | 0.39 (0.27) | 0.34 (0.34) | 0.70 (0.02) |
| Peak | 0.42 (0.23) | 0.28 (0.43) | 0.29 (0.42) | 0.28 (0.43) | 0.05 (0.89) | 0.24 (0.50) |
| Change from pre-CPET to peak | 0.54 (0.11) | 0.20 (0.57) | 0.03 (0.94) | 0.23 (0.53) | 0.37 (0.3) | −0.23 (0.51) |
| Correlations across all timepoints for individual ME/CFS volunteers | ||||||
| ME/CFS 1 | 0.09 (0.86) | 0.15 (0.77) | ||||
| ME/CFS 2 | 0.35 (0.49) | 0.97 (0.001) | ||||
| ME/CFS 3 | 0.71 (0.12) | 0.79 (0.06) | ||||
| ME/CFS 4 | 0.96 (0.003) | 0.55 (0.26) | ||||
| ME/CFS 5 | 0.94 (0.005) | 0.68 (0.14) | ||||
| ME/CFS 6 | 0.70 (0.12) | 0.61 (0.20) | ||||
| ME/CFS 7 | 0.75 (0.08) | 0.68 (0.14) | ||||
| ME/CFS 8 | 0.74 (0.1) | 0.03 (0.96) | ||||
| ME/CFS 9 | 0.34 (0.51) | −0.44 (0.38) | ||||
| ME/CFS 10 | 0.90 (0.01) | 0.70 (0.12) | ||||
*Composite VAS is a mean across 12 VAS domains: physical fatigue, mental fatigue or mental fog, muscle aches, joint aches, headache, muscle weakness, lightheadedness, flu-like symptoms, sore throat, gastrointestinal symptoms, shortness of breath and sensitive to environment.
ME/CFS, myalgic encephalomyelitis/chronic fatigue syndrome; VAS, visual analogue scale.
Table 2 also presents correlations between PEM and VAS severity at the individual level across all timepoints. For 7 of the 10 ME/CFS volunteers, the correlation between VAS and QI severity data was at or above 0.70 (r=0.7 to 0.96). For the other three, the correlations were weak (r=0.09 to 0.35). Figure 5 shows VAS severity across the six timepoints for the four most bothersome symptoms and the composite VAS among the ME/CFS volunteers. A wide variation was seen, with several scores sustaining high levels throughout the six timepoints, indicative of VAS ceiling (red) effects. Additionally, of all ceiling effects, only one represented an ME/CFS volunteer’s most bothersome symptom (headache, red dashed line). Ceiling effects were not seen in the composite VAS though for the majority of ME/CFS volunteers, the line remained flat across the timepoints. By collecting information about the most bothersome symptom, the QIs complement the VAS scales, enabling selection of the most meaningful VAS measure for measuring PEM. However, QIs on their own appear more sensitive to symptom change than either the composite or most bothersome symptom VAS. Additional quotations illuminating onset and peak of PEM, most bothersome symptoms and changes in symptoms between timepoints are shown in table 3.
Figure 5.

Visual analogue scale data for myalgic encephalomyelitis/chronic fatigue syndrome volunteers (n=10). CPET, cardiopulmonary exercise test.
Table 3.
Example quotations illuminating aspects of PEM: onset, peak, most bothersome symptom and changes between timepoints not detected with VAS
| Onset of PEM | |
| I’m feeling, starting to feel achy in the legs, kind of in my calves. Feeling kind of, I guess I’d call it a tightness in my back that I normally don't have. Feeling physically pretty exhausted… I’m feeling a little more achy, a little more muscle pain, a little more just, I guess, body aches than four hours ago… Cognitively, feeling a little foggier than normal, slowed thinking. You know, just kind of not as with it, not as aware of my surroundings and stuff going on around me, probably” (Patient 9; 4 hours post CPET). “I’m physically more tired than when I saw you an hour after the exercise. Yeah, I’m definitely feeling it more. Like I said, I can’t predict the times, whether it’s an hour later, half a day later, or a full day later, but I definitely feel a lot more tired now than I did about an hour ago (Patient 10; 4 hours post CPET). | |
| Peak PEM | |
| So it seems like there was kind of a delayed effect to the fatigue because when I got out of the chamber this morning and they wheeled me to the room downstairs…I felt really dizzy. You know, I just kind of laid in bed in a fetal position and head felt heavy, had a headache… So that went on for a couple of hours… (Patient 10; 24 hours post CPET). Tired. You know, fatigued… I mean, you just feel weak, you know. It feels like when you have the flu…without all the aches and pains and a high fever and stuff. So, where your body’s just depleted…I’d say you know it’s a little bit worse…than yesterday… Hard to find words… Oh, worse [than yesterday) (patient 8; 24 hours post CPET). | |
| Most Bothersome Symptom | |
| Physical fatigue | Very tired. Like I've run a marathon kind of a thing. Not that I've ever run a marathon, but I assume it’s something like this. Yeah (patient 1; 48 hours post-CPET). |
| Mental fatigue | Hard to find words. So, I know there’s words that I want to say… (Asked to compare with yesterday) Oh, worse (patient 8; 24 hours post CPET). |
| Headache | So my body, my brain feel on fire…(Asked what’s bothering her the most right now) That’s a hard call. I don’t like shaking because then people can see. But my head hurts worse (patient 6; 48 hours post-CPET). |
| Muscle Aches | Back, neck, shoulders - yes, especially it’s the back of my neck and the top of my shoulders that are really sore… My neck, mostly in the back of my neck, up to like the base of my head. And that’s where I felt the soreness today… At 7:45pm (yesterday) I was so restless due to pain because it was really bothersome (patient 2; 24 hours post CPET). |
| Change between timepoints not detected with VAS | |
| Definitely more tired than when we talked (at 1 hour after CPET). So I fell asleep after we talked and I went upstairs, had lunch and fell asleep and then they woke me up to give blood….I can use a nap; I'm definitely tired…All I want to do is go back to bed… (patient 4; 4 hours post CPET; Fatigue and Composite VAS scores remained the same at 1 and 4 hours after CPET). | |
CPET, cardiopulmonary exercise test; PEM, post-exertional malaise; VAS, visual analogue scale.
Discussion
ME/CFS has been described as a devastating disabling illness4 43 44 and CPET is an important tool for measuring PEM. The lack of a gold standard measure that is sensitive to PEM symptom change following CPET hinders research in the field. The mixed methods approach taken here revealed that QIs are more sensitive to PEM change than traditional or composite VAS questionnaire methods.
A wide variation of symptoms was described across the 10 ME/CFS volunteers. Overall, the QI approach was sensitive to these symptom changes. Across the study, QIs generally avoided the ceiling effects that were noted with VAS scales.45 46 The most common symptom associated with PEM, physical fatigue,4 5 31 was only the most bothersome PEM symptom for 40% of the ME/CFS volunteers, suggesting why physical fatigue VAS was not particularly sensitive to change. VAS performance improved when the most bothersome symptom was selected, with strong correlations between QIs and VAS seen in 7 of 10 ME/CFS volunteers but still insensitive to the other three.
The correlations between QIs and VAS scales were relatively strong before CPET but became serially weaker as symptoms changed over time. A composite VAS effectively tracked recovery from exercise testing in Moore et al29, but performed poorly relative to QIs in the current study. QIs appear to capture the multidimensional experience of PEM and its change over time, more effectively than VAS. The development of multidimensional symptom indices that can capture moment-to-moment change rather than changes over days or weeks could be a useful tool for measuring PEM.
Due to the wide breadth of symptoms, high levels of pain and other symptoms experienced during PEM,4 5 12 14 a more nuanced measurement system with an ability to consider multiple symptoms as a single holistic experience may be necessary to accurately access PEM. Future development of these PEM measurement tools is necessary. While QIs appear to have promise, such tools still need to be designed in ways that clinical researchers can afford to implement. There seems potential for using most bothersome symptom reporting to improve VAS performance, but it may not be usable retrospectively. The success with QIs also suggests that more descriptive categorical scales (eg, ‘a little better’, ‘a lot better’, ‘no change’, ‘a little worse’, ‘a lot worse’) may perform better than point-based VAS. These alternative approaches need exploration and testing to improve on the ability to measure individual PEM experiences.
Study limitations
This small, exploratory study requires further validation. Its sample size likely limited the range of symptoms found as most bothersome but was adequate to demonstrate how QIs are more sensitive to PEM change than VAS. Larger cohorts would allow for a more accurate estimate of the method’s value and deficiencies. This study did not include the DSQ,47 the single validated PEM measure, because this current study predates its validation. In this study, QIs were conducted prior to VAS scales; it is unknown how this order might have biased responses. Future studies could assess this methodology using respondent validation.
Conclusion
Development of a sensitive measure of PEM is necessary for its scientific study. By allowing for synthesising the entire experience of PEM using both open-ended description and probing questions, QIs were more sensitive to PEM change than VAS scales. Improvement on this approach has promise for optimising the subjective assessments of PEM.
Acknowledgments
We would like to thank Drs. Mark Hallett, Leorey Saligan and Termeh Feinberg for helpful comments on a previous draft. We would also like to thank the entire NIH ME/CFS Study Group.
Footnotes
Contributors: BS designed the study, collected and analysed the data, wrote and edited the manuscript. BC, AG and SC collected and analysed the data and edited the manuscript. GN analysed the data, participated in writing and editing the paper and approved of the final version. AN contributed to supervision of the work, participated in writing and editing the paper and approved the final version. BW contributed to supervision of the work, data collection, data analysis, writing and editing the paper and approved the final version. BW was a guarantor for the study.
Funding: This research was supported (in part) by intramural funding from the National Institute of Neurological Disorders and Stroke at the National Institutes of Health (ZIA NS003157) and the NIH Common Fund.
Competing interests: There are no competing interests.
Provenance and peer review: Not commissioned; externally peer-reviewed.
Supplemental material: This content has been supplied by the author(s). It has not been vetted by BMJ Publishing Group Limited (BMJ) and may not have been peer-reviewed. Any opinions or recommendations discussed are solely those of the author(s) and are not endorsed by BMJ. BMJ disclaims all liability and responsibility arising from any reliance placed on the content. Where the content includes any translated material, BMJ does not warrant the accuracy and reliability of the translations (including but not limited to local regulations, clinical guidelines, terminology, drug names and drug dosages), and is not responsible for any error and/or omissions arising from translation and adaptation or otherwise.
Data availability statement
Quantitative data are available upon resonalble request. The textual qualitative data contain idenifiable information and cannot be made available without breaching confidentiality.
Ethics statements
Patient consent for publication
Not applicable.
Ethics approval
This study involves human participants and was approved by NIH Institutional Review Board NIH Federalwide Assurance FWA #: 00005897. Expires: 8/19/2027. IORG #: 00010. Participants gave informed consent to participate in the study before taking part.
References
- 1.Unger ER, Lin J-MS, Brimmer DJ, et al. CDC grand rounds: chronic fatigue syndrome advancing research and clinical education. MMWR Morb Mortal Wkly Rep 2016;65:1434–8. 10.15585/mmwr.mm655051a4 [DOI] [PubMed] [Google Scholar]
- 2.Vernon SD, Hartle M, Sullivan K, et al. Post-Exertional malaise among people with long COVID compared to Myalgic Encephalomyelitis/chronic fatigue syndrome (ME/CFS). Work 2023;74:1179–86. 10.3233/WOR-220581 [DOI] [PubMed] [Google Scholar]
- 3.Jason LA, Dorri JA. ME/CFS and post-Exertional malaise among patients with long COVID. Neurol Int 2022;15:1–11. 10.3390/neurolint15010001 [DOI] [PMC free article] [PubMed] [Google Scholar]
- 4.Stussman B, Williams A, Snow J, et al. Characterization of post-Exertional malaise in patients with Myalgic Encephalomyelitis/chronic fatigue syndrome. Front Neurol 2020;11:1025. 10.3389/fneur.2020.01025 [DOI] [PMC free article] [PubMed] [Google Scholar]
- 5.Chu L, Valencia IJ, Garvert DW, et al. Deconstructing post-Exertional malaise in Myalgic Encephalomyelitis/ chronic fatigue syndrome: A patient-centered, cross-sectional survey. PLoS One 2018;13:e0197811. 10.1371/journal.pone.0197811 [DOI] [PMC free article] [PubMed] [Google Scholar]
- 6.Holtzman CS, Bhatia S, Cotler J, et al. Assessment of post Exertional malaise (PEM) in patients with Myalgic Encephalomyelitis (ME) and chronic fatigue syndrome (CFS): A patient driven survey. Diagnostics (Basel) 2019;9:26. 10.3390/diagnostics9010026 [DOI] [PMC free article] [PubMed] [Google Scholar]
- 7.IOM report. n.d. Available: https://www.ncbi.nlm.nih.gov/books/NBK274235/
- 8.Stevens S, Snell C, Stevens J, et al. Cardiopulmonary exercise test methodology for assessing exertion intolerance in Myalgic Encephalomyelitis/chronic fatigue syndrome. Front Pediatr 2018;6:242. 10.3389/fped.2018.00242 [DOI] [PMC free article] [PubMed] [Google Scholar]
- 9.Williams VSL, Morlock RJ, Feltner D. Psychometric evaluation of a visual analog scale for the assessment of anxiety. Health Qual Life Outcomes 2010;8:57. 10.1186/1477-7525-8-57 [DOI] [PMC free article] [PubMed] [Google Scholar]
- 10.Averbuch M, Katzper M. Assessment of visual analog versus categorical scale for measurement of osteoarthritis pain. J Clin Pharmacol 2004;44:368–72. 10.1177/0091270004263995 [DOI] [PubMed] [Google Scholar]
- 11.Buisman ETIA, Grens H, Wang R, et al. Trends in research on pain relief during Oocyte retrieval for IVF/ICSI: a systematic, methodological review. Hum Reprod Open 2022;2022:hoac006. 10.1093/hropen/hoac006 [DOI] [PMC free article] [PubMed] [Google Scholar]
- 12.van Campen CLMC, Rowe PC, Verheugt FWA, et al. Numeric rating scales show prolonged post-Exertional symptoms after orthostatic testing of adults with Myalgic Encephalomyelitis/chronic fatigue syndrome. Front Med (Lausanne) 2020;7:602894. 10.3389/fmed.2020.602894 [DOI] [PMC free article] [PubMed] [Google Scholar]
- 13.VanNess JM, Stevens SR, Bateman L, et al. Postexertional malaise in women with chronic fatigue syndrome. Journal of Women’s Health 2010;19:239–44. 10.1089/jwh.2009.1507 [DOI] [PubMed] [Google Scholar]
- 14.Van Oosterwijck J, Nijs J, Meeus M, et al. Pain inhibition and Postexertional malaise in Myalgic Encephalomyelitis/chronic fatigue syndrome: an experimental study. J Intern Med 2010;268:265–78. 10.1111/j.1365-2796.2010.02228.x [DOI] [PubMed] [Google Scholar]
- 15.Cook DB, Light AR, Light KC, et al. Neural consequences of post-exertion malaise in Myalgic Encephalomyelitis/chronic fatigue syndrome. Brain Behav Immun 2017;62:87–99. 10.1016/j.bbi.2017.02.009 [DOI] [PubMed] [Google Scholar]
- 16.Learmonth YC, Paul L, McFadyen AK, et al. Short-term effect of aerobic exercise on symptoms in multiple sclerosis and chronic fatigue syndrome: a pilot study. Int J MS Care 2014;16:76–82. 10.7224/1537-2073.2013-005 [DOI] [PMC free article] [PubMed] [Google Scholar]
- 17.Polli A, Van Oosterwijck J, Nijs J, et al. Relationship between exercise-induced oxidative stress changes and parasympathetic activity in chronic fatigue syndrome: an observational study in patients and healthy subjects. Clin Ther 2019;41:641–55. 10.1016/j.clinthera.2018.12.012 [DOI] [PubMed] [Google Scholar]
- 18.Light AR, Bateman L, Jo D, et al. Gene expression alterations at baseline and following moderate exercise in patients with chronic fatigue syndrome and Fibromyalgia syndrome. J Intern Med 2012;271:64–81. 10.1111/j.1365-2796.2011.02405.x [DOI] [PMC free article] [PubMed] [Google Scholar]
- 19.Jason LA, Holtzman CS, Sunnquist M, et al. The development of an instrument to assess post-Exertional malaise in patients with Myalgic Encephalomyelitis and chronic fatigue syndrome. J Health Psychol 2021;26:238–48. 10.1177/1359105318805819 [DOI] [PMC free article] [PubMed] [Google Scholar]
- 20.Jason LA, Evans M, So S, et al. Problems in defining post-Exertional malaise. J Prev Interv Community 2015;43:20–31. 10.1080/10852352.2014.973239 [DOI] [PMC free article] [PubMed] [Google Scholar]
- 21.Murdock KW, Wang XS, Shi Q, et al. The utility of patient-reported outcome measures among patients with Myalgic Encephalomyelitis/chronic fatigue syndrome. Qual Life Res 2017;26:913–21. 10.1007/s11136-016-1406-3 [DOI] [PMC free article] [PubMed] [Google Scholar]
- 22.Boruch AE, Lindheimer JB, Klein-Adams JC, et al. Predicting post-Exertional malaise in Gulf war illness based on acute exercise responses. Life Sci 2021;280:119701. 10.1016/j.lfs.2021.119701 [DOI] [PMC free article] [PubMed] [Google Scholar]
- 23.Lindheimer JB, Alexander T, Qian W, et al. An analysis of 2-day cardiopulmonary exercise testing to assess unexplained fatigue. Physiol Rep 2020;8. 10.14814/phy2.14564 [DOI] [PMC free article] [PubMed] [Google Scholar]
- 24.Cotler J, Holtzman C, Dudun C, et al. A brief questionnaire to assess post-Exertional malaise. Diagnostics (Basel) 2018;8:66. 10.3390/diagnostics8030066 [DOI] [PMC free article] [PubMed] [Google Scholar]
- 25.Kujawski S, Słomko J, Hodges L, et al. Post-Exertional malaise may be related to central blood pressure, sympathetic activity and mental fatigue in chronic fatigue syndrome patients. J Clin Med 2021;10:2327. 10.3390/jcm10112327 [DOI] [PMC free article] [PubMed] [Google Scholar]
- 26.Kujawski S, Słomko J, Newton JL, et al. Network analysis of symptoms Co-occurrence in chronic fatigue syndrome. Int J Environ Res Public Health 2021;18:10736. 10.3390/ijerph182010736 [DOI] [PMC free article] [PubMed] [Google Scholar]
- 27.Baraniuk JN, Adewuyi O, Merck SJ, et al. A chronic fatigue syndrome (CFS) severity score based on case designation criteria. Am J Transl Res 2013;5:53–68. [PMC free article] [PubMed] [Google Scholar]
- 28.Fukuda K, Straus SE, Hickie I, et al. The chronic fatigue syndrome: a comprehensive approach to its definition and study. Ann Intern Med 1994;121:953. 10.7326/0003-4819-121-12-199412150-00009 [DOI] [PubMed] [Google Scholar]
- 29.Moore GE, Keller BA, Stevens J, et al. Recovery from exercise in persons with Myalgic Encephalomyelitis/chronic fatigue syndrome (ME/CFS). Medicina 2023;59:571. 10.3390/medicina59030571 [DOI] [PMC free article] [PubMed] [Google Scholar]
- 30.Twomey R, Yeung ST, Wrightson JG, et al. Post-Exertional malaise in people with chronic cancer-related fatigue. J Pain Symptom Manage 2020;60:407–16. 10.1016/j.jpainsymman.2020.02.012 [DOI] [PubMed] [Google Scholar]
- 31.Mateo LJ, Chu L, Stevens S, et al. Post-Exertional symptoms distinguish Myalgic Encephalomyelitis/chronic fatigue syndrome subjects from healthy controls. Work 2020;66:265–75. 10.3233/WOR-203168 [DOI] [PubMed] [Google Scholar]
- 32.Creswell JW, Plano Clark VL. Designing and conducting mixed methods research 2nd edition. Thousand Oaks, CA: Sage Publications, 2011. [Google Scholar]
- 33.Tong A, Sainsbury P, Craig J. Consolidated criteria for reporting qualitative research (COREQ): a 32-item checklist for interviews and focus groups. Int J Qual Health Care 2007;19:349–57. 10.1093/intqhc/mzm042 [DOI] [PubMed] [Google Scholar]
- 34.Wasti SP, Simkhada P, van Teijlingen ER, et al. The growing importance of mixed-methods research in health. Nepal J Epidemiol 2022;12:1175–8. 10.3126/nje.v12i1.43633 [DOI] [PMC free article] [PubMed] [Google Scholar]
- 35.Campbell JA, Ezzy D, Neil A, et al. A qualitative investigation of the health economic impacts of Bariatric surgery for obesity and implications for improved practice in health economics. Health Econ 2018;27:1300–18. 10.1002/hec.3776 [DOI] [PubMed] [Google Scholar]
- 36.Malterud K, Siersma VD, Guassora AD. Sample size in qualitative interview studies: guided by information power. Qual Health Res 2016;26:1753–60. 10.1177/1049732315617444 [DOI] [PubMed] [Google Scholar]
- 37.Mezzani A. Cardiopulmonary exercise testing: basics of methodology and measurements. Ann Am Thorac Soc 2017;14(Supplement_1):S3–11. 10.1513/AnnalsATS.201612-997FR [DOI] [PubMed] [Google Scholar]
- 38.Broderick G, Ben-Hamo R, Vashishtha S, et al. Altered immune pathway activity under exercise challenge in Gulf war illness: an exploratory analysis. Brain Behav Immun 2013;28:159–69. 10.1016/j.bbi.2012.11.007 [DOI] [PubMed] [Google Scholar]
- 39.Wherton J, Greenhalgh T, Hughes G, et al. The role of information Infrastructures in Scaling up Video consultations during COVID-19: mixed methods case study into opportunity, disruption, and exposure. J Med Internet Res 2022;24:e42431. 10.2196/42431 [DOI] [PMC free article] [PubMed] [Google Scholar]
- 40.Neubauer BE, Witkop CT, Varpio L. How Phenomenology can help us learn from the experiences of others. Perspect Med Educ 2019;8:90–7. 10.1007/s40037-019-0509-2 [DOI] [PMC free article] [PubMed] [Google Scholar]
- 41.R Core Team . R: A language and environment for statistical computing. R Foundation for Statistical Computing Vienna, Austria; 2022. Available: https://www.R-project.org/ [Google Scholar]
- 42.Taylor R. Interpretation of the correlation coefficient: A basic review. Journal of Diagnostic Medical Sonography 1990;6:35–9. 10.1177/875647939000600106 [DOI] [Google Scholar]
- 43.Chang CJ, Hung LY, Kogelnik AM, et al. A comprehensive examination of severely ill ME/CFS patients. Healthcare (Basel) 2021;9:1290. 10.3390/healthcare9101290 [DOI] [PMC free article] [PubMed] [Google Scholar]
- 44.May M, Milrad SF, Perdomo DM, et al. Post-Exertional malaise is associated with greater symptom burden and psychological distress in patients diagnosed with chronic fatigue syndrome. J Psychosom Res 2020;129:109893. 10.1016/j.jpsychores.2019.109893 [DOI] [PMC free article] [PubMed] [Google Scholar]
- 45.Beletsky A, Nwachukwu BU, Gorodischer T, et al. Psychometric properties of visual analog scale assessments for function, pain, and strength compared with disease-specific upper extremity outcome measures in rotator cuff repair. JSES Int 2020;4:619–24. 10.1016/j.jseint.2020.04.012 [DOI] [PMC free article] [PubMed] [Google Scholar]
- 46.Filocamo G, Davì S, Pistorio A, et al. Evaluation of 21-numbered circle and 10-centimeter horizontal line visual analog scales for physician and parent subjective ratings in juvenile idiopathic arthritis. J Rheumatol 2010;37:1534–41. 10.3899/jrheum.091474 [DOI] [PubMed] [Google Scholar]
- 47.Bedree H, Sunnquist M, Jason LA. The DePaul symptom Questionnaire-2: A validation study. Fatigue 2019;7:166–79. 10.1080/21641846.2019.1653471 [DOI] [PMC free article] [PubMed] [Google Scholar]
Associated Data
This section collects any data citations, data availability statements, or supplementary materials included in this article.
Supplementary Materials
bmjno-2023-000529supp001.pdf (35.6KB, pdf)
Data Availability Statement
Quantitative data are available upon resonalble request. The textual qualitative data contain idenifiable information and cannot be made available without breaching confidentiality.