

Abstract
Background
Diabetes self-management education and support is the cornerstone of diabetes care, yet only 1 in 2 adults with diabetes attain hemoglobin A1c (HbA1c) targets. Food insecurity makes diabetes management and HbA1c control more difficult.
Objective
Our aim was to test whether a cooking intervention with food provision and diabetes self-management education and support improves HbA1c and diabetes management.
Design
This was a waitlist-controlled, randomized trial.
Participants/setting
Participants were 48 adults with type 1 or type 2 diabetes.
Intervention
Cooking Matters for Diabetes was adapted from Cooking Matters and the American Diabetes Association diabetes self-management education and support intervention into a 6-week program with weekly food provision (4 servings).
Main outcome measures
Surveys (ie, Summary of Diabetes Self-Care Activities; Medical Outcomes Study Short Form Health Survey, version 1; Diet History Questionnaire III; 10-item US Adult Food Security Survey Module; and Stanford Diabetes Self-Efficacy Scale) were administered and HbA1c was measured at baseline, post intervention, and 3-month follow-up.
Statistical analysis
Mixed-effects linear regression models controlling for sex and study wave were used.
Results
Mean (SD) age of participants was 57 (12) years; 65% identified as female, 52% identified as White, 40% identified as Black, and 19 (40%) were food insecure at baseline. Intervention participants improved Summary of Diabetes Self-Care Activities general diet score (0 to 7 scale) immediately post intervention (+1.51; P = .015) and 3 months post intervention (+1.23; P = .05), and improved Medical Outcomes Study Short Form Health Survey, version 1, mental component score (+6.7 points; P = .025) compared with controls. Healthy Eating Index 2015 total vegetable component score improved at 3 months (+0.917; P = .023) compared with controls. At baseline, food insecure participants had lower self-efficacy (5.6 vs 6.9 Stanford Diabetes Self-Efficacy Scale; P = .002) and higher HbA1c (+0.77; P = .025), and demonstrated greater improvements in both post intervention (+1.2 vs +0.4 Stanford Diabetes Self-Efficacy Scale score; P = .002, and e0.12 vs +0.39 HbA1c; P = .25) compared with food secure participants.
Conclusions
Cooking Matters for Diabetes may be an effective method of improving diet-related self-care and health-related quality of life, especially among food insecure patients, and should be tested in larger randomized controlled trials.
Keywords: Cooking, Type 2 diabetes mellitus, Diabetes self-management education and support Food insecurity, Social determinants of health
DIABETES MELLITUS REMAINS ONE OF THE MOST common chronic illnesses in the United States. Type 1 diabetes mellitus represents approximately 3% to 6% of all diabetes cases in the United States.1 The other 94% to 97% of diabetes mellitus cases are type 2 diabetes mellitus (T2DM), which affects 34.1 million adults, totaling 13% of the adult population.2
Essential to the management of diabetes and prevention of complications is the adoption of evidence-based lifestyle behaviors, including healthy diet and physical activity.3 Diabetes self-management education and support (DSMES) teaches these concepts.4,5 DSMES improves hemoglobin A1c (HbA1c) by 0.5% to 1% on average in people with T2DM over 0.5 to 2 years and lowers rates of diabetes complications, improves quality of life, and leads to changes in lifestyle behaviors.4,5
Medical nutrition therapy (MNT) is evidence-based nutrition care provided by a registered dietitian nutritionist that incorporates assessment, nutrition diagnosis, and interventions such as education, counseling, and monitoring with ongoing follow-up.6–9 MNT lowers HbA1c up to 2% in T2DM and 1.9% in type 1 diabetes mellitus over 3 to 6 months.9
The goal of both DSMES and MNT is to improve management of diabetes, leading to attainment of targets for HbA1c, blood pressure, and lipid control, which is critical for preventing micro- and macrovascular complications in diabetes.3,10 Unfortunately, among adults with T2DM, only 50% meet HbA1c targets and 20% meet targets for HbA1c, blood pressure, low-density lipoprotein cholesterol, and nonsmoking status.11–13 Interventions to increase attainment of targets for diabetes control are critical.
Food insecurity is one barrier to achieving these targets, as adequate access to nutritious food is a prerequisite for successful diabetes management. The US Department of Agriculture defines food insecurity as “a household-level economic and social condition of limited or uncertain access to adequate food.”14 In 2018, 11.5% of US households experienced some food insecurity throughout the year.15 Several studies have identified a greater prevalence of food insecurity among those with T2DM compared with the national average.16–18 Individuals with food insecurity and T2DM have reduced diabetes self-efficacy compared with their food secure peers.19,20 Food insecurity in T2DM is also associated with worse glycemic control compared with food security.16,19
Teaching cooking skills has been found to help reduce the burden of food insecurity.21 Those with better cooking skills eat more healthfully at lower cost than those with poor cooking skills,22 but cooking skills alone are not enough. The broader skills required to get food on the table, called “food literacy,” that is, meal planning, shopping, budgeting, food safety, and nutrition, are also of critical importance.23
DSMES participants at a large urban academic health center in Columbus, OH, expressed interest in learning practical cooking techniques. A systematic review of cooking interventions suggests these interventions lead to dietary behavior changes and improvements in cooking confidence and knowledge, but a lack of controlled designs limit conclusive findings.24 Only 2 of the 34 studies assessed HbA1c, and these studies were noncontrolled pre–post designs without post-intervention follow-up.24 One study from this review attempted to address food security by teaching cooking skills and providing groceries to prepare the recipes taught in the cooking intervention, but did not focus on people with diabetes.25
There remains a critical gap in understanding the impact of a cooking-focused curriculum on diabetes control among individuals with and without food insecurity. Thus, Cooking Matters for Diabetes (CMFD) was designed as a pilot randomized, waitlist-controlled intervention study that combined DSMES with food and cooking skills training and food provision for individuals with type 1 or type 2 diabetes in an urban community with high rates of food insecurity.
METHODS
Recruitment
Participants were recruited from The Ohio State University Wexner Medical Center Outpatient Care East using flier advertisements; identification through DSMES exit survey responses indicating interest in learning about food and cooking; and electronic medical record review. Eligibility criteria included adults 18 years and older, with HbA1c ≥7%, prior diabetes education, type 1 or type 2 diabetes mellitus, and interest in cooking. Exclusion criteria included inability to participate in group education, previous participation in Cooking Matters, and an inability to speak and/or understand English. Participants were compensated with $10 to $15 grocery store gift cards for completing assessments during the waitlist and intervention portions of the study. Control participants received a maximum of $55 and intervention participants received a maximum of $45. All participants were recruited between June 2019 and September 2019. This study was approved by the Institutional Review Board of The Ohio State University (#2019H0095). The objectives, requirements, and risks and benefits of the study were clearly outlined and informed written consent was obtained for each participant. The study was registered on ClinicalTrials.gov (NCT04152811).
Sample Size
Power was calculated on the basis of the number of participants needed to test the intervention effect on glycemic control (HbA1c). A total of 60 patients (30 intervention, 30 waitlist control) allowed 80% power to detect a large effect size of 0.8 change in HbA1c for between-group (intervention vs control) difference in the change from baseline using a 2-sample t test. Based on prior studies,26 this effect size corresponds to a 1.8% between-group difference in HbA1c with an SD of 0.2. The 2-sided significance level of .05 was used and an attrition rate of 10% was assumed for all of the power analyses. As a pilot, this study was not powered to detect small to medium effect sizes.
Randomization
Participants were randomized 1:1:1:1 to 1 of 4 arms using a random number generator after being stratified by sex. Two arms were intervention arms and 2 arms were waitlist-control arms. The 2 intervention arms received the intervention immediately after randomization; the other 2 arms received the intervention after an 18-week waiting period. The 18-week waiting period corresponded to 6 weeks of intervention plus 3 months of follow-up for the intervention group (Figure 1). The difference between the 2 intervention arms was the start date of the intervention. The study was conducted in 2 waves, each wave contained an intervention arm and a waitlist-control arm. Waves 1 and 2 started in July 2019 and September 2019, respectively.
Figure 1.
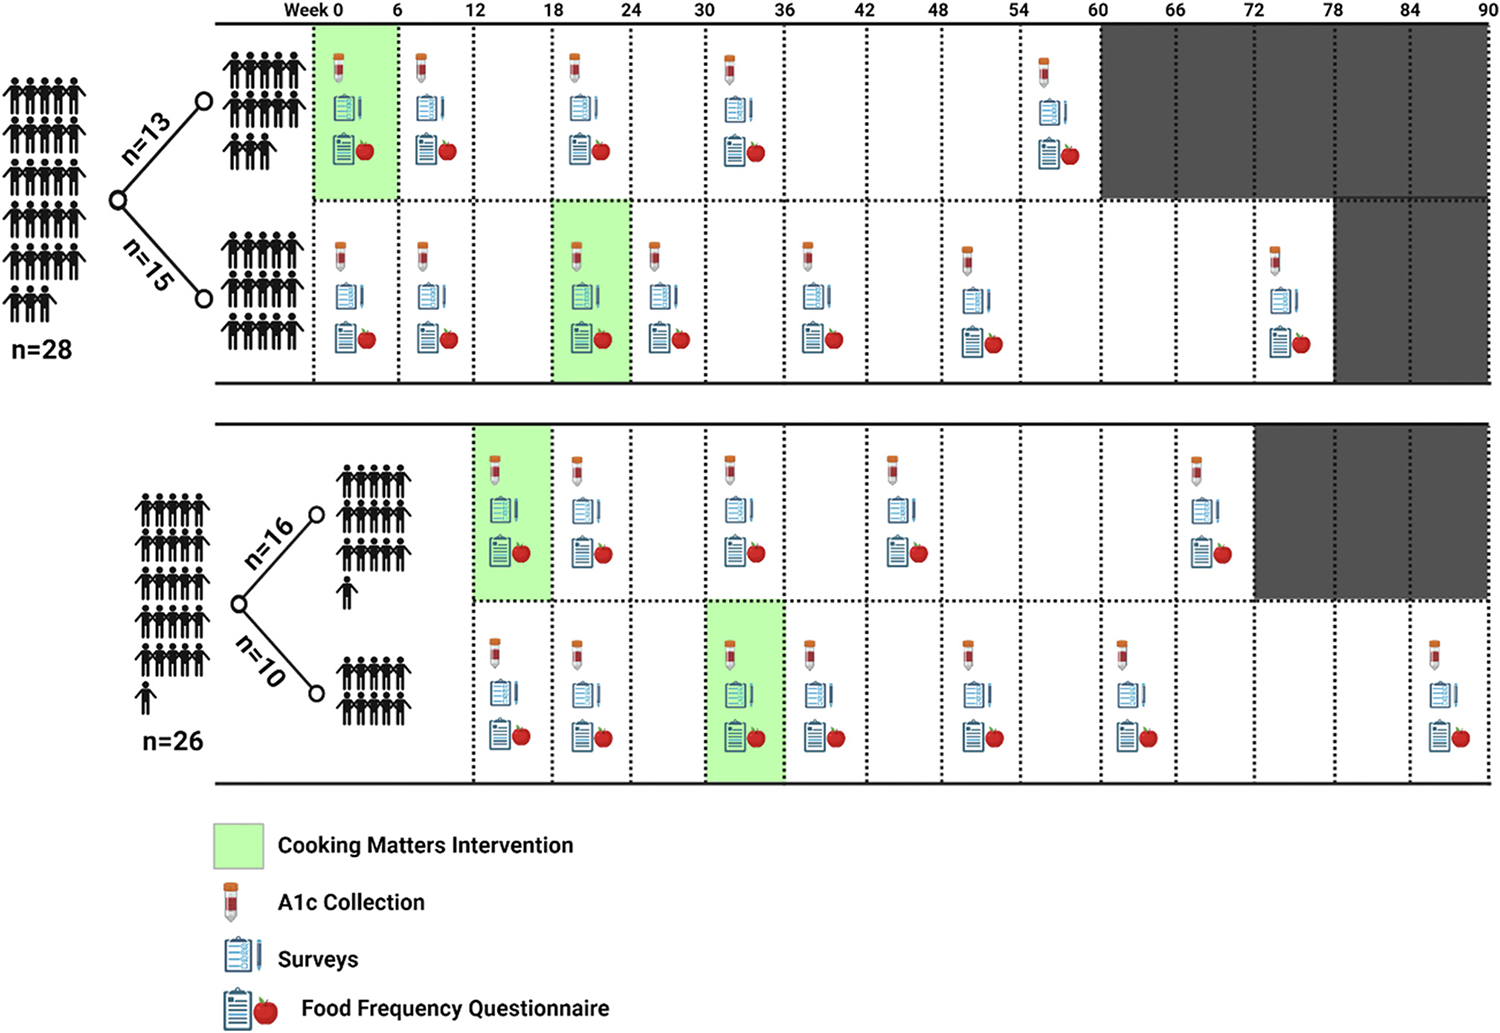
Cooking Matters for Diabetes intervention administration and data collection schedule. Arms 1 and 3 are intervention arms; arms 2 and 4 are waitlist-control arms. A1c = hemoglobin A1c.
Intervention
The intervention, CMFD, was a combination of the Share Our Strength’s Cooking Matters program and DSMES. Sponsored by Walmart, Cooking Matters provides families with the knowledge and skills to prepare healthy, affordable meals. Cooking Matters, implemented in central Ohio by Local Matters, includes hands-on, 6-week courses and an interactive grocery store tour, which educates families on how to shop for healthy foods while saving money. Cooking Matters also provides educational tools, such as recipes and materials to further assist families in stretching their food budgets and preparing healthy meals.
The CMFD intervention consisted of 2-hour classes at an academic medical center community outpatient location held weekly for 6 weeks. The classes were designed for up to 20 participants, divided into smaller groups of 4 or fewer to enhance engagement. Each class included a DSMES portion (approximately 1 hour) and a hands-on cooking portion (approximately 1 hour), except for class number 5, which was an interactive grocery store tour. The DSMES portion covered all indicators required by the American Diabetes Association. Indicators included diabetes pathophysiology and treatment options; healthy eating; physical activity; medication usage; monitoring and using patient-generated health data; preventing, detecting, and treating acute complications; preventing, detecting, and treating chronic complications; healthy coping with psychosocial issues and concerns; and problem solving.27,28 Because the program followed DSMES guidelines, 1 hour of each of the 5 classes taught by a certified diabetes care and education specialist was billed as diabetes education to participants’ insurance.
The cooking portion provided education on food safety, knife techniques, Nutrition Facts and ingredients label reading, meal planning, budgeting, and shopping. Each class, except the grocery store tour, involved participants cooking a meal in small groups. All participants then sat and shared the meal together, with the goal of participants building a sense of community. The full curriculum has been published.29
At the end of each class, participants received all of the ingredients needed to prepare 4 portions of that week’s recipes at home. An instructor trained by Cooking Matters taught the cooking portion of the class, and the DSMES portion of the class was taught by a registered dietitian nutritionist who was also a certified diabetes care and education specialist. In addition, a medical dietetics graduate student provided support for the program. At the end of the 6 weeks, participants received a cookbook with recipes from Share Our Strength’s Cooking Matters Program and a diabetes-related supplement that discusses the basics of diabetes physiology and care, with an emphasis on healthy eating for people with diabetes.
Data Collection
The full schedule for data collection is available in Figure 1. Briefly, HbA1c and survey data presented in this article were collected at baseline (0 weeks), immediately post intervention (6 weeks), 3 months post intervention (18 weeks), 6 months post intervention (30 weeks), and 12 months post intervention (54 weeks). HbA1c was collected from the electronic medical record if measured in the past 14 days for clinical care; otherwise, HbA1c was measured at the intervention class location using a point-of-care DCA Vantage Analyzer (Siemens USA).
Diabetes self-management activities were measured using the Summary of Diabetes Self-Care Activities (SDSCA),30 Diabetes Self-Management Questionnaire (DSMQ),31 Diabetes Treatment Satisfaction Questionnaire,32 and Stanford Diabetes Self-Efficacy Scale.33 Health-related quality of life (HRQOL) was evaluated using the Medical Outcomes Study Short Form Health Survey, version 1.34 Diet quality was evaluated using the Diet History Questionnaire III (DHQ III),35 which assessed consumption during the past 30 days. The DHQ III generates Healthy Eating Index 201536 total and component scores. Food security was evaluated using the 10-item US Adult Food Security Survey Module in a 3-stage design with screeners modified to a 30-day reference period.37 Food insecurity was defined as low or very low food security (3+ affirmative responses).
Study data were collected and managed online using Research Electronic Data Capture electronic data capture tools hosted at The Ohio State University.38,39 The Research Electronic Data Capture is a secure, web-based software platform designed to support data capture for research studies. Participants were e-mailed a link to the surveys from Research Electronic Data Capture, except for the DHQ III, which was completed from a separate link. Most completed the surveys online at home, and a few completed surveys online during HbA1c collection visits.
Data Analysis
Descriptive statistics were used to report baseline characteristics of all participants (nonstratified) and by control and intervention groups. Between- and within-group change in survey scores and HbA1c were analyzed via 2 sets of linear mixed-effects models. Sex and study wave were covariates in all models. The first set of models (control models) contained data from time points at baseline (0 weeks), post intervention (6 weeks), and 3 months post intervention (18 weeks). These models assessed differences between waitlist-control and intervention participants with an interaction term of time point * intervention or control indicator. The other set of models (longitudinal models) contained all measurements taken during and after the intervention (no control measurements were included). The longitudinal models included baseline (0 weeks), post intervention (6 weeks), 3 month (18 weeks), 6 month (30 weeks), and 12 month (54 weeks) measurements. Longitudinal models assessed change in outcomes over time in all participants that received the intervention (n = 48). Due to our small sample size, this exploratory longitudinal analysis was done to increase our power to detect changes with smaller effect sizes. The analysis also allowed us to use the data collected at 6 and 12 months, for which there are no complementary control data.
Food security has been found to modify the impact of diabetes education on HbA1c and diabetes self-efficacy,20 thus secondary analyses were performed stratifying by baseline food security status (low/very low security or secure) by introducing an interaction term (time point * food security indicator for longitudinal models and time point * food security * intervention group for control models), into the above models and performing a likelihood ratio test on models with and without the term. The results were reported at the nominal level and a 2-sided significance level of .05 was considered significant. All analyses were performed using R statistical software, version 4.0.5.40
RESULTS
Baseline Demographic Characteristics
The baseline demographic characteristics of CMFD participants are presented in Table 1. Mean (SD) age of participants was 57 (12) years; 65% identified as female; 52% were White, 40% were Black, 6% were more than 1 race, and 2% were unknown race and ethnicity. Participant flow through intervention and analysis was published previously.29
Table 1.
Demographic characteristic of Cooking Matters for Diabetes participants according to intervention or control group status
| Characteristic | Intervention (n = 26) | Control (n = 22) | Overall (n = 48) |
|---|---|---|---|
|
| |||
| mean (SD) | |||
| Age, y | 57.1 (12.4) | 55.7 (11.8) | 56.5 (12.0) |
| n (%) | |||
| Missing | 0(0) | 1 (5) | 1 (2) |
| Sex | |||
| Female | 16 (62) | 15 (68) | 31 (65) |
| Male | 10 (39) | 7 (32) | 17 (35) |
| Race | |||
| African American | 8(31) | 11 (50) | 19 (40) |
| More than 1 race | 2 (8) | 1 (4) | 3 (6) |
| White | 15 (58) | 10 (46) | 25 (52) |
| Missing | 1 (4) | 0 (0) | 1 (2) |
| Ethnicity | |||
| Non-Hispanic | 24 (92) | 16 (73) | 40 (83) |
| Undisclosed | 0 (0) | 3 (14) | 3 (6) |
| Missing | 2 (8) | 3 (14) | 5 (10) |
| Marital status | |||
| Divorced | 5 (19) | 3 (14) | 8 (17) |
| Living with a partner | 2 (8) | 1 (5) | 3 (6) |
| Married | 12 (46) | 9 (41) | 21 (44) |
| Never married | 5 (19) | 8 (36) | 13 (27) |
| Separated | 0 (0) | 1 (5) | 1 (2) |
| Widowed | 2 (8) | 0 (0) | 2 (4) |
| mean (SD) | |||
| No. of Children | 0.696 (1.11) | 0.300 (0.923) | 0.512 (1.03) |
| n (%) | |||
| Missing | 3 (11.5) | 2 (9.1) | 5 (10.4) |
| Income | |||
| <$25,000 | 8(31) | 8 (36) | 16 (33) |
| $25,000-$54,999 | 8(31) | 6 (27) | 14 (29) |
| $55,000-$74,999 | 5 (19) | 2 (9) | 7 (15) |
| ≥$75,000 | 4 (15) | 6 (27) | 10 (21) |
| Missing | 1 (4) | 0 (0) | 1 (2) |
| Employment status | |||
| Employed for wages | 8(31) | 7 (32) | 15 (31) |
| Out of work 1 y or more | 2 (8) | 2 (9) | 4 (8) |
| Retired | 8 (31) | 9 (41) | 17 (35) |
| Self-employed | 1 (4) | 0 (0) | 1 (2) |
| Unable to work | 6 (23) | 3 (14) | 9 (19) |
| Homemaker | 1 (4) | 0 (0) | 1 (2) |
| Student | 0 (0) | 1 (5) | 1 (2) |
| mean (SD) | |||
| Hemoglobin A1c, % | 8.40 (1.14) | 8.60 (1.03) | 8.49 (1.08) |
| Food security status | |||
| n (%) | |||
| Secure | 17 (65) | 15 (68) | 32 (67) |
| Insecure | 9 (35) | 7 (32) | 16 (33) |
Outcomes
Intervention vs Waitlist-Control Groups
There was no significant change in HbA1c in intervention participants compared with controls from baseline to post intervention (+0.17; P = .501) or to 3 months post intervention (−0.05; P = .84) (Table 2). Compared with controls, participants randomized to CMFD demonstrated significant improvements in SDSCA general diet score (0 to 7 scale) post intervention (+1.49; P = 0.014) (Table 2). SDSCA foot care score increased compared with controls at 3 months (+1.15 points; P = .048, 7-point scale). Improvements were also observed in indicators of HRQOL. The mental component score increased by 6.6 points (P = .023) on a 0 to 100 scale post intervention. Significant improvements were observed in Healthy Eating Index 201536 total vegetable component score (+0.92 points; P = .023, 0 to 5 scale) compared with controls at 3 months post intervention.
Table 2.
Mixed-effects models comparing Cooking Matters for Diabetes control and intervention participants’ change in hemoglobin A1c and survey responsesa
| Variable | Baseline | Post intervention | P value | 3 mo post intervention | P value |
|---|---|---|---|---|---|
|
| |||||
| β (95% CI) | β (95% CI) | ||||
| Hemoglobin A1c | 9.06 (8.46 to 9.65) | 0.17 (−0.31 to 0.64) | .501 | −0.05 (−0.55 to 0.43) | .836 |
| n | n | ||||
| Control/intervention | 22/26 | 22/23 | — | 22/20 | — |
| β (95% CI) | β (95% CI) | ||||
| SF-12 b | |||||
| Physical component score | 32.36 (26.69 to 38.04) | −1.40 (−5.86 to 3.04) | .543 | 2.36 (−2.23 to 6.98) | .323 |
| Mental component score | 42.99 (37.75 to 48.22) | 6.63 (1.08 to 12.19) | .023 | 2.32 (−3.41 to 8.06) | .435 |
| SDSCA c | |||||
| General diet score | 3.07 (2.05 to 4.09) | 1.49 (0.34 to 2.64) | .014 | 1.12 (−0.06 to 2.32) | .072 |
| Specific diet score | 3.09 (2.32 to 3.87) | 0.68 (−0.16 to 1.52) | .121 | 0.21 (−0.65 to 1.08) | .637 |
| Exercise | 1.56 (0.73 to 2.39) | −0.09 (−0.93 to 0.75) | .838 | 0.60 (−0.27 to 1.47) | .189 |
| Blood glucose testing | 4.59 (3.48 to 5.70) | 0.28 (−0.88 to 1.44) | .643 | −0.04 (−1.23 to 1.16) | .942 |
| Foot care | 4.89 (3.77 to 6.01) | 1.06 (−0.02 to 2.13) | .060 | 1.15 (0.042 to 2.26) | .048 |
| DSMQ d | |||||
| Glucose management | 7.15 (6.08 to 8.22) | 0.66 (−0.30 to 1.61) | .187 | 0.28 (−0.70 to 1.27) | .586 |
| Diet control | 4.84 (3.68 to 5.99) | 0.87 (−0.32 to 2.04) | .157 | 0.21 (−1.00 to 1.43) | .739 |
| Physical activity | 4.57 (3.30 to 5.85) | −0.39 (−1.69 to 0.91) | .565 | 0.41 (−0.93 to 1.75) | .556 |
| Health care | 8.01 (7.20 to 8.82) | −0.21 (−1.03 to 0.60) | .611 | −0.59 (−1.42 to 0.26) | .180 |
| Sum score | 6.21 (5.45 to 6.97) | 0.43 (−0.23 to 1.09) | .209 | 0.25 (−0.43 to 0.93) | .484 |
| DSES e | 5.43 (4.53 to 6.34) | 0.82 (−0.08 to 1.71) | .082 | 0.37 (−0.55 to 1.30) | .446 |
| Food security score | 2.45 (1.25 to 3.65) | 0.33 (−0.54 to 1.20) | .462 | −0.16 (−1.06 to 0.74) | .738 |
| n | n | ||||
| Surveys, control/intervention | 22/26 | 22/24 | — | 22/20 | — |
| β (95% CI) | β (95% CI) | ||||
| Healthy Eating Index 2015 | |||||
| Score | 64.18 (55.41 to 72.93) | 0.04 (−4.24 to 4.30) | .986 | 1.31 (−3.13 to 5.79) | .573 |
| Total vegetable component score | 3.17 (1.90 to 4.43) | 0.39 (−0.35 to 1.11) | .313 | 0.92 (0.16 to 1.68) | .023 |
| n | n | ||||
| DHQ III,f control/intervention | 20/26 | 20/22 | — | 21/17 | — |
βs from mixed-effects models adjusted for study wave and sex. Baseline βs are intercepts. Control model nonbaseline βs are the change intervention participants experienced from baseline compared with controls (βs from the intervention * time interaction term). Example interpretation: compared with controls, intervention participants’ SF-12 mental component score increased by 6.7 points compared with baseline (P = .025).
SF-12 = Medical Outcomes Study Short Form Health Survey, version 1.
SDSCA = Summary of Diabetes Self-Care Activities Measure.
DSMQ = Diabetes Self-Management Questionnaire.
DSES = Diabetes Self-Efficacy Scale.
DHQ III = Diet History Questionnaire III.
Outcomes
Longitudinal Analysis
Longitudinally, SDSCA general diet score increased immediately post intervention compared with baseline (+1.06; P = .001) (Table 3). SDSCA specific diet score also increased compared with baseline at post intervention (+0.80; P = .002) (Table 3). These changes were not sustained beyond the end of the intervention.
Table 3.
Mixed-effects models assessing change in hemoglobin A1c and survey responses after Cooking Matters for Diabetes interventiona
| Survey | Baseline | Post intervention | P value | 3 mo post intervention | P value | 6 mo post intervention | P value | 12 mo post intervention | P value |
|---|---|---|---|---|---|---|---|---|---|
|
| |||||||||
| Hemoglobin A1c | |||||||||
| β (95% CI) | 8.85 (8.30 to 9.40) | 0.00 (−0.39 to 0.39) | .992 | −0.02 (−0.46 to 0.42) | .933 | −0.05 (−0.56 to 0.45) | .844 | 0.27 (−0.22 to 0.76) | .292 |
| n | 48 | 43 | — | 28 | — | 21 | — | 22 | — |
| SF-12,b β (95% CI) | |||||||||
| Physical component score | 31.81 (27.01 to 36.62) | −0.38 (−2.82 to 2.04) | .761 | 2.01 (−0.65 to 4.64) | .142 | 0.04 (−2.67 to 2.74) | .977 | 0.38 (−2.44 to 3.18) | .790 |
| Mental component score | 43.04 (38.36 to 47.73) | 2.88 (−0.21 to 5.98) | .073 | 0.78 (−2.57 to 4.17) | .655 | −2.20 (−5.63 to 1.26) | .216 | 1.97 (−1.59 to 5.55) | .286 |
| SDSCA,c β (95% CI) | |||||||||
| General diet score | 2.66 (1.83 to 3.50) | 1.06 (0.47 to 1.64) | .001 | 0.48(−0.16 to 1.13) | .152 | 0.30 (−0.36 to 0.96) | .381 | 0.19 (−0.47 to 0.88) | .576 |
| Specific diet score | 3.05 (2.41 to 3.69) | 0.80 (0.31 to 1.28) | .002 | 0.36 (−0.17 to 0.90) | .194 | 0.63 (0.08 to 1.18) | .028 | 0.45 (−0.10 to 1.02) | .120 |
| Exercise | 1.18 (0.55 to 1.82) | 0.13 (−0.42 to 0.68) | .642 | 0.61 (0.01 to 1.21) | .050 | −0.25 (−0.86 to 0.37) | .424 | −0.17 (−0.79 to 0.47) | .611 |
| Blood glucose testing | 4.92 (3.87 to 5.97) | 0.58 (0.029 to 1.13) | .042 | −0.13 (−0.74 to 0.48) | .676 | 0.09 (−0.53 to 0.72) | .768 | −0.07 (−0.70 to 0.57) | .837 |
| Foot care | 4.33 (3.35 to 5.31) | 0.70 (0.16 to 1.24) | .013 | 0.78 (0.19 to 1.38) | .012 | 1.13 (0.53 to 1.75) | .000 | 1.03 (0.41 to 1.66) | .002 |
| DMSQ,d β (95% CI) | |||||||||
| Glucose management | 7.31 (6.28 to 8.34) | 0.55 (0.11 to 0.99) | .017 | 0.31 (−0.17 to 0.80) | .218 | 0.02 (−0.48 to 0.52) | .950 | 0.08 (−0.43 to 0.59) | .763 |
| Diet control | 4.32 (3.37 to 5.27) | 0.72 (0.17 to 1.27) | .013 | 0.37 (−0.24 to 0.98) | .240 | 0.04 (−0.58 to 0.66) | .912 | −0.07 (−0.71 to 0.57) | .830 |
| Physical activity | 4.00 (2.99 to 5.00) | 0.40 (−0.23 to 1.02) | .222 | 0.11 (−0.58 to 0.80) | .756 | 0.26 (−0.44 to 0.97) | .477 | −0.52 (−1.23 to 0.21) | .167 |
| Health care | 8.79 (8.11 to 9.48) | −0.13 (−0.56 to 0.31) | .572 | −0.20 (−0.67 to 0.28) | .413 | −0.41 (−0.89 to 0.079) | .105 | −0.46 (−0.96 to 0.04) | .073 |
| Sum score | 6.11 (5.41 to 6.80) | 0.47 (0.17 to 0.77) | .003 | 0.22 (−0.11 to 0.56) | .200 | −0.05 (−0.39 to 0.29) | .758 | −0.15 (−0.51 to 0.21) | .405 |
| DSES,e β (95% CI) | 5.35 (4.57 to 6.13) | 0.37 (−0.09 to 0.83) | .121 | 0.37 (−0.12 to 0.88) | .150 | 0.31 (−0.22 to 0.83) | .258 | 0.02 (−0.50 to 0.54) | .947 |
| Food security score | 2.40 (1.40 to 3.39) | −0.46 (−0.93 to 0.01) | .060 | −0.63 (−1.15 to −0.11) | .020 | −0.45 (−1.00 to 0.09) | .108 | −0.74 (−1.28 to −0.19) | .009 |
| n for above surveys | 48 | 41 | — | 32 | — | 28 | — | 28 | — |
| HEI-2015,f β (95% CI) | |||||||||
| Score | 62.43 (53.75 to 71.10) | 1.77 (−0.95 to 4.50) | .211 | 0.39 (−2.35 to 3.16) | .787 | −1.37 (−4.31 to 1.52) | .364 | −1.92 (−5.32 to 1.49) | .277 |
| Total vegetable component score | 3.71 (2.54 to 4.88) | 0.38 (−0.02 to 0.79) | .071 | 0.52 (0.11 to 0.94) | .016 | −0.03 (−0.47 to 0.40) | .897 | 0.24 (−0.26 to 0.76) | .355 |
| DHQ III g | |||||||||
| Energy (kcal), β (95% CI) | 1757 (853 to 2649) | −348 (−613 to −82) | .013 | −269 (−535 to −0.27) | .055 | −169 (−453 to 113) | .250 | −162 (−493 to 170) | .347 |
| Carbohydrate (g), β (95% CI) | 184 (74 to 292) | −51 (−85 to −17) | .005 | −35 (−69 to −0.13) | .054 | −21 (−58 to 15) | .257 | −10 (−52 to 33) | .660 |
| Total sugar (g), β (95% CI) | 82 (18 to 145) | −24 (−46 to −2) | .036 | −22 (−43 to 0.32) | .058 | −16.(−39 to 7) | .182 | −10 (−37 to 17) | .463 |
| Added sugars (g), β (95% CI) | 49 (10 to 88) | −17 (−31 to −3) | .025 | −15 (−30 to −0.51) | .048 | −8 (−23 to 7) | .313 | −9 (−27 to 9) | .319 |
| Refined grain (oz), β (95% CI) | 2.69 (0.93 to 4.44) | −0.61 (−1.18 to −0.04) | .041 | −0.22 (−0.80 to 0.35) | .457 | −0.02 (−0.63 to 0.59) | .958 | 0.21 (−0.50, 0.93) | .566 |
| n | 47 | 29 | — | 28 | — | 24 | — | 16 | — |
βs from mixed-effects models adjusted for study wave and sex. Baseline βs are intercepts. Longitudinal model nonbaseline βs are the change experienced from baseline in all participants once they entered the intervention phase. Example interpretation: post-intervention consumption of added sugars decreased by 17 g/d in the pre–post analysis (P = .025).
SF-12 = Medical Outcomes Study Short Form Health Survey, version 1.
SDSCA = Summary of Diabetes Self-Care Activities Measure.
DSMQ = Diabetes Self-Management Questionnaire.
DSES = Diabetes Self-Efficacy Scale.
HEI-2015 = Healthy Eating Index 2015.
DHQ III = Diet History Questionnaire III.
The longitudinal analysis of DHQ III data illuminated changes in carbohydrate consumption that occurred after the program. Refined-grain consumption decreased from baseline levels by 0.6 oz/d immediately post intervention (P = 0.041). Added sugars consumption also decreased post intervention and at 3 months (−17 g/d; P = .025 and −15 g/d; P = .048, respectively). These dietary changes were also reflected in the decreases in total sugar (−24 g/d; P = .036), energy (−348 kcal/d; P = .013), and total carbohydrate (−51 g/d; P = .005) consumption immediately post intervention.
DSMQ sum score (+0.47; P = .003), diet control score (+0.72; P = .013), and glucose management score (+0.55; P = .017) (Table 3) increased compared with baseline at the post-intervention time point (10-point scales). SDSCA foot care score was significantly higher than baseline at all post-intervention time points (Table 3). SDSCA blood glucose testing score increased immediately post intervention (+0.58; P = .042, 7-point scale) (Table 3).
Longitudinally, the decrease in food security score (less insecurity, 0 to 10 scale) from baseline was not significant immediately post intervention (−0.46; P = .060), but achieved significance at 3 months (−0.63; P = .020) (Table 3).
Stratification by Food Security Status
There was a significant difference between mean ± SD baseline HbA1c among participants with food insecurity at baseline (9.08% ± 1.25%) and food secure participants (8.31% ± 1.04%; P = .025) (Table 4). Change in diabetes self-efficacy over time for intervention participants vs controls differed by food security status (P = .002) (Table 5). Intervention participants with food insecurity experienced a greater increase in self-efficacy immediately after the intervention than food insecure controls (+1.19; P = .13; 10-point scale) (Table 5). At 3 months, self-efficacy decreased sharply (−0.43; P = .62) (Table 5) among intervention participants with food insecurity at baseline compared with the change observed among controls with food insecurity at baseline. The change in diabetes management self-efficacy in intervention participants with food security at baseline compared with food secure controls was more constant (+0.38; P = .51 at post intervention and +0.59; P = .31 at 3 months) (Table 5).
Table 4.
Demographic characteristics of Cooking Matters for Diabetes participants according to food security status Secure Insecure
| Characteristic | Secure (n = 29) | Insecure (n = 19) | P value |
|---|---|---|---|
|
| |||
| mean (SD) | |||
| Age, y | 57.4 (12.3) | 54.9 (11.8) | .485 |
| n (%) | |||
| Missing | 0 (0) | 1 (5.3) | |
| Sex | .142 | ||
| Female | 16 (55) | 15 (79) | |
| Male | 13 (45) | 4 (21) | |
| Race | .089 | ||
| African American | 9 (31) | 10 (53) | |
| More than 1 race | 1 (3.4) | 2 (11) | |
| White | 19 (66) | 6 (32) | |
| Missing | 0 (0) | 1 (5) | |
| Ethnicity | .068 | ||
| Non-Hispanic | 28 (97) | 12 (63) | |
| Undisclosed | 0 (0) | 3 (16) | |
| Missing | 1 (3) | 4 (21) | |
| Marital status | .367 | ||
| Divorced | 4 (14) | 4 (21) | |
| Living with a partner | 1 (3) | 2 (11) | |
| Married | 15 (52) | 6 (32) | |
| Never married | 7 (24) | 6 (32) | |
| Separated | 0 (0) | 1 (5) | |
| Widowed | 2 (7) | 0 (0) | |
| mean (SD) | |||
| No. of Children | 0.56 (1.12) | 0.44 (0.89) | .722 |
| n (%) | |||
| Missing | 2 (7) | 3 (16) | |
| Income | .040 | ||
| <$25,000 | 5 (17) | 11 (58) | |
| $25,000-$54,999 | 10 (35) | 4 (21) | |
| $55,000-$74,999 | 5 (17) | 2 (11) | |
| ≥$75,000 | 8 (28) | 2 (11) | |
| Missing | 1 (3) | 0 (0) | |
| Employment status | .314 | ||
| Employed for wages | 11 (38) | 4 (21) | |
| Homemaker | 0 (0) | 1 (5) | |
| Out of work for 1 y or more | 1 (3) | 3 (16) | |
| Retired | 11 (38) | 6 (32) | |
| Unable to work | 4 (14) | 5 (26) | |
| Self-employed | 1 (3) | 0 (0) | |
| Student | 1 (3) | 0 (0) | |
| mean (SD) | |||
| Hemoglobin A1c, % | 8.31 (1.04) | 9.08 (1.25) | .025 |
Table 5.
Mixed–effects models comparing Cooking Matters for Diabetes control and intervention participants' change in hemoglobin A1c and survey responses according to food security statusa
| Survey | Time | Food secure, |
Food insecure, |
Interaction P valueb | ||
|---|---|---|---|---|---|---|
| β (95% CI) | P value | β (95% CI) | P value | |||
|
| ||||||
| Hemoglobin A1c | Baseline | 8.96 (8.31 to 9.60) | .000 | 8.94 (7.75 to 10.12) | .000 | — |
| Post | 0.33 (−0.26 to 0.93) | .286 | −0.12 (−0.96 to 0.69) | .788 | — | |
| 3 mo | 0.11 (−0.49 to 0.71) | .729 | −0.36 (−1.29 to 0.51) | .453 | .274 | |
| SDSCA c | ||||||
| General diet score | Baseline | 2.51 (1.18 to 3.84) | .001 | 4.05 (2.54 to 5.57) | .000 | — |
| Post | 0.45 (−0.99 to 1.87) | .549 | 3.06 (1.23 to 4.92) | .004 | — | |
| 3 mo | 0.38 (−1.06 to 1.83) | .616 | 1.93 (−0.06 to 4.02) | .082 | .302 | |
| Specific diet score | Baseline | 3.06 (2.03 to 4.10) | .000 | 3.01 (1.85 to 4.16) | .000 | — |
| Post | 0.29 (−0.83 to 1.38) | .623 | 1.33 (0.05 to 2.61) | .059 | — | |
| 3 mo | 0.24 (−0.88 to 1.36) | .682 | 0.29 (−1.11 to 1.73) | .701 | .595 | |
| Exercise | Baseline | 1.41 (0.31 to 2.52) | .021 | 1.87 (0.59 to 3.16) | .015 | — |
| Post | −0.04 (−1.10 to 1.02) | .948 | −0.17 (−1.58 to 1.25) | .820 | — | |
| 3 mo | 0.73 (−0.34 to 1.80) | .196 | 0.61 (−0.93 to 2.20) | .465 | .893 | |
| Blood glucose testing | Baseline | 5.00 (3.82 to 6.18) | .000 | 4.17 (2.06 to 6.27) | .002 | — |
| Post | −0.22 (−1.54 to 1.10) | .754 | 0.97 (−1.09 to 3.05) | .384 | — | |
| 3 mo | −0.24 (−1.57 to 1.10) | .730 | −0.52 (−2.78 to 1.81) | .669 | .906 | |
| Foot care | Baseline | 4.72 (3.32 to 6.12) | .000 | 5.77 (3.82 to 7.72) | .000 | — |
| Post | 1.37 (−0.02 to 2.76) | .063 | 0.84 (−0.85 to 2.54) | .357 | — | |
| 3 mo | 1.50 (0.10 to 2.91) | .045 | 0.60 (−1.29 to 2.47) | .549 | .274 | |
| DSMQ d | ||||||
| Glucose management | Baseline | 7.55 (6.30 to 8.79) | .000 | 6.87 (4.89 to 8.84) | .000 | — |
| Post | 0.90 (−0.32 to 2.11) | .161 | 0.24 (−1.32 to 1.83) | .778 | — | |
| 3 mo | 0.38 (−0.85 to 1.60) | .560 | −0.22 (−1.93 to 1.58) | .813 | .587 | |
| Diet control score | Baseline | 4.39 (2.84 to 5.95) | .000 | 5.74 (3.97 to 7.51) | .000 | — |
| Post | 0.74 (−0.82 to 2.29) | .365 | 0.84 (−1.02 to 2.66) | .393 | — | |
| 3 mo | −0.09 (−1.66 to 1.48) | .909 | 0.49 (−1.55 to 2.52) | .652 | 0.161 | |
| Physical activity | Baseline | 3.86 (2.26 to 5.46) | .000 | 5.85 (3.63 to 8.07) | .000 | — |
| Post | −1.78 (−3.42 to −0.14) | .043 | 1.52 (−0.37 to 3.42) | .140 | — | |
| 3 mo | 0.12 (−1.53 to 1.78) | .887 | 1.12 (−0.98 to 3.22) | .322 | .033 | |
| Health care | Baseline | 8.43 (7.57 to 9.29) | .000 | 7.96 (6.45 to 9.48) | .000 | — |
| Post | 0.17 (−0.85 to 1.19) | .745 | −0.62 (−1.94 to 0.70) | .381 | — | |
| 3 mo | −0.58 (−1.62 to 0.45) | .283 | −0.34 (−1.77 to 1.18) | .662 | .882 | |
| Sum score | Baseline | 6.15 (5.20 to 7.10) | .000 | 6.62 (5.33 to 7.92) | .000 | — |
| Post | 0.25 (−0.62 to 1.12) | .580 | 0.65 (−0.40 to 1.68) | .250 | — | |
| 3 mo | 0.094 (−0.78 to 0.97) | .839 | 0.46 (−0.66 to 1.62) | .452 | .234 | |
| DSES e | Baseline | 5.54 (4.48 to 6.61) | .000 | 5.38 (3.71 to 7.06) | .000 | — |
| Post | 0.38 (−0.72 to 1.47) | .507 | 1.19 (−0.24 to 2.67) | .130 | — | |
| 3 mo | 0.59 (−0.50 to 1.70) | .305 | −0.43 (−2.00 to 1.24) | .615 | .002 | |
βs from mixed-effects models adjusted for study wave and sex. Baseline βs are intercepts. Control model nonbaseline βs are the change intervention participants experienced from baseline compared with controls (βs from the intervention * time interaction term). Food insecure and food secure βs were generated by running models on only food insecure or food secure participants, respectively. Example interpretation: Food secure participants compared with food secure controls had a significantly different change in DSES than food insecure participants compared with food insecure controls (P = .002).
interaction P value is the result of the likelihood ratio test of 2 models, 1 with and 1 without the interaction term food security * intervention * time.
SDSCA = Summary of Diabetes Self–Care Activities Measure.
DSMQ = Diabetes Self-Management Questionnaire.
DSES = Diabetes Self-Efficacy Scale.
The effect of the intervention over time on physical activity differed by food security status at baseline (P = .033 for interaction) (Table 5). Intervention participants with food insecurity at baseline increased their physical activity (+1.52; P = 0.14) (Table 5) and food secure intervention participants decreased their physical activity (−1.78; P = .043) (Table 5) compared with their respective controls immediately post intervention, as assessed by the DSMQ physical activity score (10-point scale).
Results of mixed-effect models for HbA1c by food security status at baseline are provided in Table 5 and Figure 2. For participants with food insecurity at baseline (n = 19), coefficient estimates were negative at the immediate post-intervention (−0.12; P = .79) and 3-month (−0.36; P = .45) time points, and in food secure individuals (n = 29), these coefficient estimates were positive post intervention (0.33; P = .29) and at 3 months (0.11, P = .73).
Figure 2.
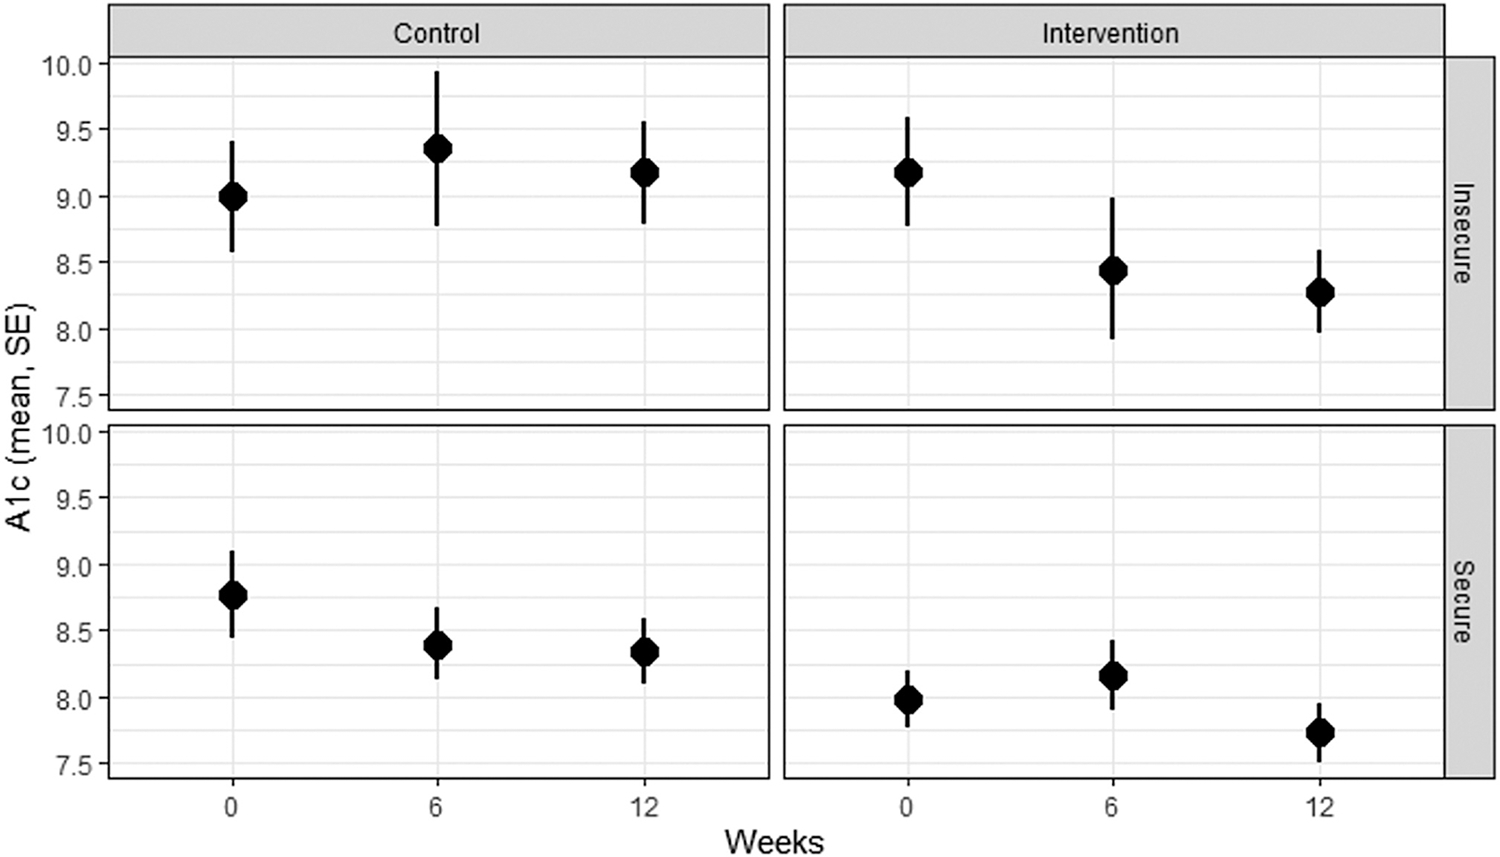
Mean hemoglobin A1c in Cooking Matters for Diabetes participants over time by food security and intervention/control group status. Mean and SE hemoglobin A1c for control and intervention participants with and without food insecurity at baseline. Interpretation: Food insecure intervention participants experienced the numerically largest decrease in hemoglobin A1c (interaction not significant). Food insecure participants started with higher hemoglobin A1c than food secure participants (P < .05). A1c = hemoglobin A1c.
Food security is a dynamic state and changed during our study. HbA1c measured at time points when participants also reported food insecurity in the last month was higher (+0.75, P = .001) than those measured when participants were food secure.
DISCUSSION
In CMFD, among 48 individuals with diabetes in a practical application of DSMES and cooking intervention, significant improvements in diabetes management, diet, food security, and HRQOL were observed. A differential response to the intervention by food security status was also observed. Similar to other randomized, controlled cooking interventions,41,42 participants increased self-reported vegetable intake and had better general diet scores after the intervention. In addition, several promising improvements in foot care and mental health were observed after the intervention. To our knowledge, this is the first intervention involving cooking instruction to assess changes in HbA1c with a control group. Although participants overall did not have a statistically significant reduction in HbA1c, several intermediate outcomes improved, and the results suggested the potential for greater improvement among participants with food insecurity than those without. Thus, larger future cooking interventions that are aimed specifically at participants with diabetes and food insecurity are critical.
HbA1c
To the authors’ knowledge, there have only been 2 cooking interventions that evaluated changes in HbA1c. Neither had a control group. First, Dasgupta and colleagues43 provided 15, three-hour lessons over 24 weeks, in which participants with diabetes and obesity or overweight prepared a balanced meal under the supervision of a chef, followed by a discussion with a registered dietitian nutritionist. After 24 weeks, there was a 0.3% decrease in HbA1c. The decrease in HbA1c was correlated to the magnitude of weight loss. CMFD did not measure body weight. Another intervention by Bielamowicz and colleagues44 provided education, in the form of cooking classes, to people with diabetes in Texas. Although thousands participated in the study, only 13 participants had HbA1c values assessed before and after the intervention. Among these individuals, the post-intervention HbA1c values were significantly lower, although the magnitude of reduction was unclear.44 Both Dasgupta and colleagues and Bielamowicz and colleagues reported reductions in HbA1c; however, both were quasi-experimental analyses limited by the absence of a control group. Thus, CMFD provides further innovation compared with the extant literature by using a randomized, controlled study design. The self-reported improvements in diabetes management, diet, and HRQOL not leading to a statistically significant reduction in HbA1c in the primary analysis may have been due to the following: dietary changes may not have been of long enough duration to engender change in HbA1c; participants were dealing with other COVID-19 pandemic–related factors, including stress, which is linked to worse glycemic control45; and physical activity, a key component of glycemic control, decreased among food secure participants. Future studies could endeavor to collect more objective signals of a health-promoting dietary pattern (eg, skin carotenoid scanning) to confirm subjective findings.
Dietary Patterns
Consistent with prior cooking interventions, CMFD led to a temporary improvement in diet-related self-care, as reflected by better SDSCA general diet scores compared with controls. Data from the DHQ III also showed higher vegetable intake and lower consumption of refined grains, added sugars, total carbohydrates, and calories. This is the first published randomized, controlled cooking intervention that has focused on people with diabetes and measured changes in diet quality, although there are published methods for another Cooking Matters–based, randomized, controlled cooking intervention in Indigenous people with diabetes.46 A randomized, controlled cooking intervention in 36 men with prostate cancer found reductions in saturated fat and animal protein consumption and increases in vegetable protein intake after the intervention compared with controls.42 Greenlee and colleagues41 also observed improvements in dietary quality after their cooking intervention in a sample of Hispanic survivors of breast cancer. The women decreased their proportion of saturated fat consumption and increased consumption of vegetables over 6 months. Greenlee and colleagues excluded individuals with HbA1c >7%, so their sample is different from the current study. Most cooking interventions in people with diabetes that measure change in diet show improvement, although these studies are limited by their lack of control group.24,47,48
Additional research is needed to illuminate methods of engendering sustained change in dietary patterns. One rationale for the temporary nature of the dietary improvements in CMFD may be the dietary response to the intervention observed among food insecure participants. SDSCA general diet score improved then decreased in participants with food insecurity. Improvements were transient in the Stanford Diabetes Self-Efficacy Scale, HRQOL mental component scores, and DSMQ diet scores among food insecure individuals. Once the intervention (including food provision and social interaction) ceased, improvements were not maintained among food insecure participants. In addition, much of the follow-up period was at the beginning of the COVID-19 pandemic, which may have impacted participants’ ability to sustain new dietary habits.
HRQOL
HRQOL mental component scores improved during the intervention. According to focus group data,29 this increase is likely attributable to the social connection and sense of community the participants experienced, similar to prior studies. Abbott and colleagues49 performed a qualitative analysis of cooking classes for Aboriginal people with diabetes and found participants most appreciated the social aspect of the cooking intervention. Consistent with CMFD, the intervention involved the participants working in small groups to prepare a meal that they ate together at the end of each class. In interviews from Abbott and colleagues, some participants claimed they attended purely for social reasons. They stated the social environment facilitated learning and enhanced the enjoyment of the course. These statements align with findings from a review of community kitchen interventions, which found that a participatory intervention and the development of a sense of community were key to the success of the interventions reviewed.21 Another review concluded cooking courses improve psychosocial outcomes, with socialization being one of the major mechanisms.50
Food Insecurity
CMFD had a greater magnitude of benefit across multiple outcomes for participants with food insecurity, consistent with prior studies.47 Although not a cooking intervention, Lyles and colleagues20 found greater improvement in HbA1c among food insecure vs food secure participants after a diabetes education intervention. Similar to CMFD, food insecure participants began with higher HbA1c and lower self-efficacy than food secure participants.
There is some evidence that food insecurity can be assuaged by heightened cooking skills and food literacy21; although, McLaughlin and colleagues51 found no association between food preparation and food insecurity severity among food insecure, low-income, Canadian women. CMFD only decreased food insecurity in longitudinal analyses at 3 months and 12 months, with a trend toward a decrease at post intervention and 6 months. More comprehensive cooking interventions with complementary education and support among a larger sample of people with food insecurity are required to determine whether such interventions can reduce the burden of food and nutrition insecurity.
Strengths and Weaknesses
CMFD has several strengths, including a randomized, waitlist-controlled design. Systematic reviews over the last 40 years revealed that the majority of general cooking interventions lack a control group and are nonrandomized.47,48 A more recent review of cooking intervention studies from 2011 to 2016 reviewed 34 studies and only 14 had control groups.24 None of the randomized, controlled cooking interventions measured HbA1c, and only 1 focused on people with diabetes.24 These reviews also decried the use of non-validated evaluation tools to measure outcomes in previous studies.24,50 CMFD used validated surveys for outcome measures and used HbA1c as the measure of glycemia. In addition, CMFD was performed at a community clinic in an urban under-resourced neighborhood with high rates of food insecurity. Due to the location of the study site, the education was accessible, participant burden was minimized, and a racially and socioeconomically diverse sample was recruited. The study team included expertise in DSMES, MNT, and cooking skills. Finally, the provision of DSMES is a billable service, potentially enhancing sustainability.
A few limitations must be taken into account when considering the findings. First, although this sample was racially diverse, we did not have any Hispanic Americans in our study, limiting generalizability to this important population. This may have been due to English-speaking/understanding as an inclusion criteria and there is a plan to add an interpreter in future iterations. Second, CMFD did not have a research assistant or coordinator on the study team, which impacted recruitment and retention. Third, the follow-up portion of CMFD occurred during the COVID-19 pandemic. Some participants were unable to complete the follow-up surveys electronically, and our local COVID-19 regulations restricted in-person study visits, hindering HbA1c collection. The COVID-19 pandemic may have also impacted the prevalence of economically linked social risks, including food insecurity, which is known to undermine diabetes management. Initial findings are also beginning to show a general increase in HbA1c due to the COVID-19 pandemic.52 We found no difference between mean prepandemic and during pandemic HbA1c values in our sample, which may be a protective effect of our intervention. Any effect the pandemic had on our outcomes of interest would be most evident in our longitudinal analyses, as all of the waitlist periods were completed before the pandemic started. Lastly, we reported P values at the nominal level, as analyses were run without correction for multiple testing due to the hypothesis-generating nature of the secondary outcomes.
CONCLUSIONS
CMFD, a practical application of DSMES and cooking intervention with complementary food provision, improved dietary behaviors, physical activity, HRQOL, and foot care. Many outcomes improved more substantially among individuals with food insecurity compared with those without. During the post-intervention follow-up period, the food insecure group experienced greater regression, emphasizing the importance of sustained follow-up in populations made vulnerable related to 1 or more social determinants of health.
RESEARCH SNAPSHOT.
Research Question:
Does a diabetes self-management education and support cooking intervention lower hemoglobin A1c and increase diabetes self-management behaviors?
Key Findings:
Diet-related self-care and health-related quality of life improved after the intervention. Vegetable consumption increased and carbohydrate consumption decreased. The greatest numerical improvements in hemoglobin A1c and statistically significant improvements in diabetes self-management activities were in food insecure participants.
ACKNOWLEDGEMENT
The authors thank the staff and participants of Cooking Matters for Diabetes and all of the partners that made this project possible. Local Matters (local-matters.org) partnered in the design and delivery of the intervention, including the culinary instructor, cooking equipment, food provision, and Local Matters volunteers. The Ohio State University Wexner Medical Center Diabetes Education Team provided the community facility in which Cooking Matters for Diabetes was delivered.
FUNDING/SUPPORT
This study was funded by the Diabetes Care and Education Dietetics Practice Group Karen Goldstein Memorial Grant from the Academy of Nutrition and Dietetics Foundation and National Institutes of Health grants UL1TR002733 and K08CA245208. This study is registered at ClinicalTrials.gov, number NCT04152811.
Footnotes
STATEMENT OF POTENTIAL CONFLICT OF INTEREST
No potential conflict of interest was reported by the authors.
Contributor Information
Amaris Williams, Division of Endocrinology, Diabetes and Metabolism, The Ohio State University College of Medicine, Columbus..
Jennifer C. Shrodes, Division of Endocrinology, Diabetes and Metabolism, The Ohio State University College of Medicine, Columbus..
Jessica N. Radabaugh, Division of Medical Dietetics, The Ohio State University College of Medicine, Columbus..
Ashlea Braun, Department of Nutritional Sciences, School of Education and Human Sciences, Oklahoma State University, Stillwater; at the time of the study she was a postdoctoral scholar, Division of Medical Dietetics, The Ohio State University College of Medicine, Columbus..
David Kline, Department of Biostatistics and Data Science, Division of Public Health Sciences, Wake Forest School of Medicine, Winston-Salem, NC..
Songzhu Zhao, Center for Biostatistics, The Ohio State University College of Medicine.
Guy Brock, Department of Biomedical Informatics, The Ohio State University College of Medicine.
Timiya S. Nolan, The Ohio State University College of Nursing.
Jennifer A. Garner, The School of Health and Rehabilitation Sciences, The Ohio State University College of Medicine and The John Glenn College of Public Affairs, The Ohio State University, Columbus.
Colleen K. Spees, Division of Medical Dietetics, The Ohio State University College of Medicine.
Joshua J. Joseph, The Ohio State University College of Medicine, Columbus..
References
- 1.Menke A, Orchard TJ, Imperatore G, Bullard KM, Mayer-Davis E, Cowie CC. The prevalence of type 1 diabetes in the United States. Epidemiology. 2013;24(5):773–774. [DOI] [PMC free article] [PubMed] [Google Scholar]
- 2.Estimates of diabetes and its burden in the United States. National Diabetes Statistics Report 2020. Centers for Disease Control and Prevention; Published 2020. Accessed July 21, 2022. https://www.cdc.gov/diabetes/pdfs/data/statistics/national-diabetes-statistics-report.pdf [Google Scholar]
- 3.American Diabetes Association. 5. Facilitating behavior change and well-being to improve health outcomes: standards of medical care in diabetes—2020. Diabetes Care. 2020;43(suppl 1):S48–S65. [DOI] [PubMed] [Google Scholar]
- 4.Powers MA, Bardsley J, Cypress M, et al. Diabetes self-management education and support in type 2 diabetes: A joint position statement of the American Diabetes Association, the American Association of Diabetes Educators, and the Academy of Nutrition and Dietetics. Diabetes Care. 2015;38(7):1372–1382. [DOI] [PubMed] [Google Scholar]
- 5.Powers MA, Bardsley JK, Cypress M, et al. Diabetes self-management education and support in adults with type 2 diabetes: A consensus report of the American Diabetes Association, the Association of Diabetes Care and Education Specialists, the Academy of Nutrition and Dietetics, the American Academy of Family Physicians, the American Academy of PAs, the American Association of Nurse Practitioners, and the American Pharmacists Association. J Acad Nutr Diet. 2021;121(4):773–788. e9. [DOI] [PubMed] [Google Scholar]
- 6.Franz MJ, MacLeod J, Evert A, et al. Academy of Nutrition and Dietetics Nutrition practice guideline for type 1 and type 2 diabetes in adults: Systematic review of evidence for medical nutrition therapy effectiveness and recommendations for integration into the nutrition care process. J Acad Nutr Diet. 2017;117(10):1659–1679. [DOI] [PubMed] [Google Scholar]
- 7.Briggs Early K, Stanley K. Position of the Academy of Nutrition and Dietetics: The role of medical nutrition therapy and registered dietitian nutritionists in the prevention and treatment of prediabetes and type 2 diabetes. J Acad Nutr Diet. 2018;118(2):343–353. [DOI] [PubMed] [Google Scholar]
- 8.Evert AB, Dennison M, Gardner CD, et al. Nutrition therapy for adults with diabetes or prediabetes: A consensus report. Diabetes Care. 2019;42(5):731–754. [DOI] [PMC free article] [PubMed] [Google Scholar]
- 9.Watts SA, Yelverton D. An expanded paradigm of primary care diabetes chronic disease management. J Nurse Pract. 2021;17(6):677–679. [Google Scholar]
- 10.American Diabetes Association. 10. Cardiovascular disease and risk management: Standards of medical care in diabetes—2020. Diabetes Care. 2020;43(suppl 1):S111–S134. [DOI] [PubMed] [Google Scholar]
- 11.Andary R, Fan W, Wong ND. Control of cardiovascular risk factors among US adults with type 2 diabetes with and without cardiovascular disease. Am J Cardiol. 2019;124(4):522–527. [DOI] [PubMed] [Google Scholar]
- 12.Fang M, Wang D, Coresh J, Selvin E. Trends in diabetes treatment and control in U.S. adults, 1999–2018. N Engl J Med. 2021;384(23):2219–2228. [DOI] [PMC free article] [PubMed] [Google Scholar]
- 13.Joseph JJ, Deedwania P, Acharya, et al. American Heart Association Diabetes Committee of the Council on Lifestyle and Cardiometabolic Health; Council on Arteriosclerosis, Thrombosis and Vascular Biology; Council on Clinical Cardiology; and Council on Hypertension. Comprehensive Management of Cardiovascular Risk Factors for Adults With Type 2 Diabetes: A Scientific Statement From the American Heart Association. Circulation. 2022;145(9):e722–e759. [DOI] [PubMed] [Google Scholar]
- 14.Definitions of food security. Economic Research Service. US Department of Agriculture; Published May 13, 2021. Accessed May 12, 2021. https://www.ers.usda.gov/topics/food-nutrition-assistance/food-security-in-the-us/definitions-of-food-security.aspx
- 15.Coleman-Jensen A, Rabbitt MP, Gregory CA, Singh A. Statistical supplement to household food security in the United States in 2018. USDA; Published September 2019. Accessed July 21, 2022. https://www.ers.usda.gov/publications/pub-details/?pubid=94869 [Google Scholar]
- 16.Berkowitz SA, Baggett TP, Wexler DJ, Huskey KW, Wee CC. Food insecurity and metabolic control among U.S. adults with diabetes. Diabetes Care. 2013;36(10):3093–3099. [DOI] [PMC free article] [PubMed] [Google Scholar]
- 17.Seligman HK, Laraia BA, Kushel MB. Food insecurity is associated with chronic disease among low-income NHANES participants. J Nutr. 2010;140(2):304–310. [DOI] [PMC free article] [PubMed] [Google Scholar]
- 18.Seligman HK, Bindman AB, Vittinghoff E, Kanaya AM, Kushel MB. Food insecurity is associated with diabetes mellitus: Results from the National Health Examination and Nutrition Examination Survey (NHANES) 1999–2002. J Gen Intern Med. 2007;22(7):1018–1023. [DOI] [PMC free article] [PubMed] [Google Scholar]
- 19.Seligman HK, Jacobs EA, López A, Tschann J, Fernandez A. Food insecurity and glycemic control among low-income patients with type 2 diabetes. Diabetes Care. 2012;35(2):233–238. [DOI] [PMC free article] [PubMed] [Google Scholar]
- 20.Lyles CR, Wolf MS, Schillinger D, et al. Food insecurity in relation to changes in hemoglobin a1c, self-efficacy, and fruit/vegetable intake during a diabetes educational intervention. Diabetes Care. 2013;36(6):1448–1453. [DOI] [PMC free article] [PubMed] [Google Scholar]
- 21.Iacovou M, Pattieson DC, Truby H, Palermo C. Social health and nutrition impacts of community kitchens: A systematic review. Public Health Nutr. 2013;16(3):535–543. [DOI] [PMC free article] [PubMed] [Google Scholar]
- 22.Soliah LAL, Walter JM, Jones SA. Benefits and barriers to healthful eating: What are the consequences of decreased food preparation ability? Am J Lifestyle Med. 2012;6(2):152–158. [Google Scholar]
- 23.McGowan L, Caraher M, Raats M, et al. Domestic cooking and food skills: A review. Crit Rev Food Sci Nutr. 2017;57(11):2412–2431. [DOI] [PubMed] [Google Scholar]
- 24.Reicks M, Kocher M, Reeder J. Impact of cooking and home food preparation interventions among adults: A systematic review (2011–2016). J Nutr Educ Behav. 2018;50(2):148–172.e1. [DOI] [PubMed] [Google Scholar]
- 25.Flynn MM, Reinert S, Schiff AR. A six-week cooking program of plant-based recipes improves food security, body weight, and food purchases for food pantry clients. J Hunger Environ Nutr. 2013;8(1):73–84. [Google Scholar]
- 26.Ricci-Cabello I, Ruiz-Pérez I, Nevot-Cordero A, Rodríguez-Barranco M, Sordo L, Gonçalves DC. Health care interventions to improve the quality of diabetes care in African Americans: A systematic review and meta-analysis. Diabetes Care. 2013;36(3):760–768. [DOI] [PMC free article] [PubMed] [Google Scholar]
- 27.Beck J, Greenwood DA, Blanton L, et al. 2017 National standards for diabetes self-management education and support. Diabetes Care. 2017;40(10):1409–1419. [DOI] [PubMed] [Google Scholar]
- 28.American Diabetes Association. American Diabetes Association’s Education Recognition Program Review Criteria and Indicators. 10th ed. Published 2019. Accessed May 17, 2021. https://professional.diabetes.org/files/media/review_criteria_10th_edition_revised_9.2019-final.pdf
- 29.Shrodes JC, Williams A, Nolan TS, et al. Feasibility of cooking matters for diabetes: A 6-week randomized, controlled cooking and diabetes self-management education intervention. J Acad Nutr Diet. 2022;122. 00–00. [DOI] [PMC free article] [PubMed] [Google Scholar]
- 30.Toobert DJ, Hampson SE, Glasgow RE. The summary of diabetes self-care activities measure: Results from 7 studies and a revised scale. Diabetes Care. 2000;23(7):943–950. [DOI] [PubMed] [Google Scholar]
- 31.Schmitt A, Gahr A, Hermanns N, Kulzer B, Huber J, Haak T. The Diabetes Self-Management Questionnaire (DSMQ): Development and evaluation of an instrument to assess diabetes self-care activities associated with glycaemic control. Health Qual Life Outcomes. 2013;11(1):138. [DOI] [PMC free article] [PubMed] [Google Scholar]
- 32.Bradley C, Plowright R, Stewart J, Valentine J, Witthaus E. The Diabetes Treatment Satisfaction Questionnaire change version (DTSQc) evaluated in insulin glargine trials shows greater responsiveness to improvements than the original DTSQ. Health Qual Life Outcomes. 2007;5(1):57. [DOI] [PMC free article] [PubMed] [Google Scholar]
- 33.Rapley P, Passmore A, Phillips M. Review of the psychometric properties of the Diabetes Self-Efficacy Scale: Australian longitudinal study. Nurs Health Sci. 2003;5(4):289–297. [DOI] [PubMed] [Google Scholar]
- 34.Ware JE, Kosinski M, Keller SD. A 12-Item Short-Form Health Survey: Construction of scales and preliminary tests of reliability and validity. Med Care. 1996;34(3):220–233. [DOI] [PubMed] [Google Scholar]
- 35.Subar AF, Thompson FE, Kipnis V, et al. Comparative validation of the Block, Willett, and National Cancer Institute Food Frequency Questionnaires: The Eating at America’s Table Study. Am J Epidemiol. 2001;154(12):1089–1099. [DOI] [PubMed] [Google Scholar]
- 36.Healthy Eating Index. US Department of Agriculture, Food and Nutrition Service. Accessed August 11, 2022. https://www.fns.usda.gov/healthy-eating-index-hei [Google Scholar]
- 37.US Household Food Security Survey Module:Three-Stage Design, With Screeners. US Department of Agriculture, Economic Research Service; Published 2012. Accessed May 17, 2021. [Google Scholar]
- 38.Harris PA, Taylor R, Thielke R, Payne J, Gonzalez N, Conde JG. Research electronic data capture (REDCap)—A metadata-driven methodology and workflow process for providing translational research informatics support. J Biomed Inform. 2009;42(2):377–381. [DOI] [PMC free article] [PubMed] [Google Scholar]
- 39.Harris PA, Taylor R, Minor BL, et al. The REDCap consortium: Building an international community of software platform partners. J Biomed Inform. 2019;95:103208. [DOI] [PMC free article] [PubMed] [Google Scholar]
- 40.R: A Language and Environment for Statistical Computing [computer program]. R Foundation for Statistical Computing; 2021. [Google Scholar]
- 41.Greenlee H, Gaffney AO, Aycinena AC, et al. ¡Cocinar Para Su Salud!: Randomized controlled trial of a culturally based dietary intervention among Hispanic breast cancer survivors. J Acad Nutr Diet. 2015;115(5):709–723. [DOI] [PMC free article] [PubMed] [Google Scholar]
- 42.Carmody J, Olendzki B, Reed G, Andersen V, Rosenzweig P. A dietary intervention for recurrent prostate cancer after definitive primary treatment: Results of a randomized pilot trial. Urology. 2008;72(6):1324–1328. [DOI] [PubMed] [Google Scholar]
- 43.Dasgupta K, Hajna S, Joseph L, Da Costa D, Christopoulos S, Gougeon R. Effects of meal preparation training on body weight, glycemia, and blood pressure: Results of a phase 2 trial in type 2 diabetes. Int J Behav Nutr Phys Act. 2012;9(1):125. [DOI] [PMC free article] [PubMed] [Google Scholar]
- 44.Bielamowicz MK, Pope P, Rice CA. Sustaining a creative community-based diabetes education program: Motivating Texans with type 2 diabetes to do well with diabetes control. Diabetes Educ. 2013;39(1):119–127. [DOI] [PubMed] [Google Scholar]
- 45.Ruissen MM, Regeer H, Landstra CP, et al. Increased stress, weight gain and less exercise in relation to glycemic control in people with type 1 and type 2 diabetes during the COVID-19 pandemic. BMJ Open Diabetes Res Care. 2021;9(1):e002035. [DOI] [PMC free article] [PubMed] [Google Scholar]
- 46.Hawley CN, Huber CM, Best LG, et al. Cooking for health: A healthy food budgeting, purchasing, and cooking skills randomized controlled trial to improve diet among American Indians with type 2 diabetes. BMC Public Health. 2021;21(1):356. [DOI] [PMC free article] [PubMed] [Google Scholar]
- 47.Garcia AL, Reardon R, McDonald M, Vargas-Garcia EJ. Community interventions to improve cooking skills and their effects on confidence and eating behaviour. Curr Nutr Rep. 2016;5(4):315–322. [DOI] [PMC free article] [PubMed] [Google Scholar]
- 48.Reicks M, Trofholz AC, Stang JS, Laska MN. Impact of cooking and home food preparation interventions among adults: Outcomes and implications for future programs. J Nutr Educ Behav. 2014;46(4):259–276. [DOI] [PMC free article] [PubMed] [Google Scholar]
- 49.Abbott PA, Davison JE, Moore LF, Rubinstein R. Effective nutrition education for Aboriginal Australians: Lessons from a diabetes cooking course. J Nutr Educ Behav. 2012;44(1):55–59. [DOI] [PubMed] [Google Scholar]
- 50.Farmer N, Touchton-Leonard K, Ross A. Psychosocial benefits of cooking interventions: A Systematic Review. Health Educ Behav. 2018;45(2):167–180. [DOI] [PMC free article] [PubMed] [Google Scholar]
- 51.Mclaughlin C, Tarasuk V, Kreiger N. An examination of at-home food preparation activity among low-income, food-insecure women. J Am Diet Assoc. 2003;103(11):1506–1512. [DOI] [PubMed] [Google Scholar]
- 52.Ledford CJW, Roberts C, Whisenant E, et al. Quantifying worsened glycemic control during the COVID-19 pandemic. J Am Board Fam Med. 2021;34(suppl):S192–S195. [DOI] [PubMed] [Google Scholar]