

Abstract
Activation of N-methyl-D-aspartate-type glutamate receptors (NMDARs) at synapses in the CNS triggers changes in synaptic strength that underlie memory formation in response to strong synaptic stimuli. The primary target of Ca2+ flowing through NMDARs is Ca2+/calmodulin-dependent protein kinase II (CaMKII) which forms dodecameric holoenzymes that are highly concentrated at the postsynaptic site. Activation of CaMKII is necessary to trigger long-term potentiation of synaptic strength (LTP), and is prolonged by autophosphorylation of subunits within the holoenzyme. Here we use MCell4, an agent-based, stochastic, modeling platform to model CaMKII holoenzymes placed within a realistic spine geometry. We show how two mechanisms of regulation of CaMKII, ‘Ca2+-calmodulin-trapping (CaM-trapping)’ and dephosphorylation by protein phosphatase-1 (PP1) shape the autophosphorylation response during a repeated high-frequency stimulus. Our simulation results suggest that autophosphorylation of CaMKII does not constitute a bistable switch. Instead, prolonged but temporary, autophosphorylation of CaMKII may contribute to a biochemical-network-based ‘kinetic proof-reading” mechanism that controls induction of synaptic plasticity.
Introduction:
Memories are stored in the brain through creation of new neural networks that are formed by strengthening excitatory glutamatergic synapses connecting neurons that are activated together as an event is experienced (Bi and Poo, 1998; Magee and Johnston, 1997; Markram et al., 1997). Each excitatory pyramidal neuron in the forebrain contains approximately 10,000 excitatory glutamatergic synapses arrayed along several dendrites that reach into the surrounding brain tissue. Most excitatory synapses are made onto dendritic spines, which are small tubular membrane extensions with a bulbous head. Spine synapses are comprised of a release site from a presynaptic axon that makes a specialized synaptic contact with a postsynaptic spine (Fig. 1A). The spine contains highly integrated biochemical machinery that controls the size of the spine head and the number of AMPA-type glutamate receptors located at the synaptic site (Kennedy, 2013; Kennedy et al., 2005; Opazo and Choquet, 2011). Precise kinetic control of this machinery determines the changes in synaptic strength that are the basis of new neural networks. The goal of this study is to use newly available computational tools and high performance computing to begin to understand more clearly the kinetic control of spine biochemical machinery that arises from high frequency presynaptic activity. The work builds on decades of in vitro study of individual biochemical components in spines.
Figure 1.

A. Schematic diagram of a spine synapse. AMPA-type glutamate receptors (AMPARs, teal) produce a depolarizing Na+/K+ current after binding glutamate released from presynaptic vesicles upon arrival of an axonal action potential (AP). NMDA-type glutamate receptors (NMDARs, gold) contain a channel that is opened by the concurrence of glutamate release and strong depolarization (e.g. a back-propagating action potential [bAP]). Potentiated synapses (right) contain more AMPARs resulting in a larger excitatory postsynaptic potential (EPSP) upon release of glutamate. The spines of potentiated synapses increase in size and contain a more highly branched actin cytoskeleton. B. Ca2+/calmodulin-dependent protein kinase II (CaMKII) is a dodecameric holoenzyme in which twelve subunits are bound together by the interactions among the hub domains of each subunit. When Ca2+/calmodulin (Ca2+/CaM) binds to two adjacent subunits in one of the hexameric rings, a threonine residue (Thr 286) within one of the two subunits is autophosphorylated by the other subunit acting as a kinase. Autophosphorylation is believed to occur in one direction around the hexameric ring. Autophosphorylation of Thr 286 causes the subunit to remain active even when the Ca2+ concentration falls and calmodulin (CaM) unbinds. (modified from Fig. 7 of Rosenberg et al. (Rosenberg et al., 2005). C. Domain diagram of a subunit of CaMKII illustrating the catalytic domain (Kinase), the autoinhibitory segment with the CaM-binding domain, and the Hub domain. When the kinase is inactive, the inhibitory segment lies within the site that binds ATP and protein substrates. Binding of Ca2+/CaM to the CaM-binding domain moves the inhibitory segment out of the substrate-binding pocket allowing ATP to bind to the subunit. Thr-286, which can be autophosphorylated, as described in B), is contained within the autoinhibitory segment. Autophosphorylation unmasks a phenylalanine (F) and a glutamine (N) in the CaM-binding domain (shown in red), enabling a large increase in the affinity of Ca2+/CaM, known as CaM-trapping.
Spines are, on average, ~1-2 μm in length. The diameters of spine heads are highly variable, as are their volumes (Bartol et al., 2015a; see Bartol et al., 2015b). The median volume of spines in stratum radiatum of hippocampal area CA1 (the source of our model spine) is ~0.017 μm3 or ~17 x 10−18 liters (Bartol et al., 2015a). The synaptic membrane contacts (postsynaptic densities [PSDs]) between axon release sites and spines are roughly circular and their median diameter is ~200 nm (Bartol et al., 2015a). The presynaptic side of the contact contains sites at which vesicles dock at the membrane and release glutamate when the axon is depolarized. The postsynaptic membrane is undergirded by the postsynaptic density (PSD), which immobilizes the synaptic receptors for glutamate and anchors a dense network of cytosolic regulatory proteins attached to the membrane (Harris and Weinberg, 2012; Kennedy, 2000). The strength of a synapse is highly correlated with the volume of the spine head, as well as the area of the PSD and presynaptic active zone (Bourne and Harris, 2007). Larger spine heads contain more AMPA-type glutamate receptors and a larger PSD. Thus, they exhibit a larger excitatory postsynaptic potential when glutamate is released from the presynapse (Bartol et al., 2015a).
The complex regulatory biochemical machinery in spines is capable of responding to the frequency of synaptic activation by strengthening (enlarging) or weakening (shrinking) the synapse (Kennedy, 2013). The biochemical mechanisms that allow the frequency of presynaptic activity to be translated precisely into synaptic strengthening or weakening that faithfully encodes memories is still incompletely understood. The reactions that lead to functional and structural changes in spines are triggered by Ca2+ entering the spine through the ion channels of NMDA-type glutamate receptors (NMDARs) (Fig. 1A). Physiological studies show that these functional and structural changes are exquisitely tightly regulated by the frequency and amplitude of Ca2+ entry (Sjostrom and Nelson, 2002). The principal target of Ca2+ entering the spines of cortical and hippocampal excitatory synapses is Ca2+/calmodulin-dependent protein kinase II (CaMKII), which, as its name suggests, is activated when it binds Ca2+-bound calmodulin (Ca2+/CaM) formed when the concentration of Ca2+ rises above its baseline value (~100 nM, Pepke et al., 2010) (Fig. 1B). Activated CaMKII phosphorylates several additional synaptic proteins and sets in motion a cascade of reactions that lead to changes in synaptic strength the magnitude of which depend on the frequency of presynaptic action potentials (APs) and the presence of other regulatory modulators that can influence the sensitivity of the synapse to plastic changes (Kennedy, 2013; Kennedy et al., 2005). Activation of CaMKII has been shown to play a crucial role in long term potentiation (LTP) of excitatory synaptic strength in the hippocampus, and therefore in spatial learning and memory (Giese et al., 1998; Silva et al., 1992). The regulation of CaMKII by Ca2+/CaM has also been studied extensively in vitro (Hell, 2014; Meyer et al., 1992; Miller and Kennedy, 1986; Pepke et al., 2010). Our goal in this work is to begin to create a paradigm that enables the use of parameters obtained from in vitro studies of regulation of CaMKII, and of other synaptic reactions, to model the stochastic dynamics of these reactions as they are likely to occur within the tiny spaces in spines during the earliest stages of induction of synaptic plasticity. Such models will enable quantitative testing of a variety of qualitative models that have been proposed for regulation of CaMKII and synaptic plasticity (e.g. see Nicoll and Schulman, 2023).
This goal has medical importance. Several intractable mental and neurological illnesses, including Alzheimer’s disease (Selkoe, 2011), involve disruptions (“derangements”) in mechanisms of synaptic regulation (Mullins et al., 2016; Scolnick, 2017). Some of these “derangements” are likely to involve relatively subtle, but devastating, changes in the timing of synaptic reactions. Given the importance of CaMKII activation for synaptic plasticity, it is important to understand the detailed biochemical dynamics of the Ca2+-CaM-CaMKII signaling axis within spines to inform the design of new therapeutics to treat these illnesses.
To model how activation of CaMKII by Ca2+ flowing through NMDARs will proceed in the compartment formed by the postsynaptic spine, we use particle-based stochastic simulations in the program MCell4 to translate the kinetic properties of regulation of CaMKII measured in vitro into the context of a postsynaptic spine.
CaMKII is a dodecameric holoenzyme comprised of twelve individual catalytic subunits that are organized via their “hub” domains into two hexameric rings stacked together (Bennett et al., 1983; Chao et al., 2011; Rosenberg et al., 2005; Fig. 1B, C). The kinase activity of each subunit is activated independently by binding of Ca2+/CaM to its CaM-binding domain, which moves the inhibitory domain away from the catalytic pocket and thus activates kinase activity. In addition, the subunits can undergo autophosphorylation in which an active subunit phosphorylates a specific threonine residue (T-286) within its neighboring subunit if that subunit also has Ca2+/CaM bound to it (Hanson et al., 1994; Miller and Kennedy, 1986; Miller et al., 1988; Schworer et al., 1988; Thiel et al., 1988). Phosphorylation of Thr286 blocks inhibition by the regulatory domain (Colbran et al., 1989); therefore, each autophosphorylated subunit stays active as long as the Thr286 remains phosphorylated, and can, in turn, phosphorylate and activate its neighboring subunit when the neighbor binds Ca2+/CaM. Thr286 can be dephosphorylated by either of two broad-specificity protein phosphatases, phosphatase 1 (PP1) or -2a (PP2a); however, PP1 activity predominates in spines (Monroe and Heathcote, 2013; Platholi and Hemmings, 2021; Sandal et al., 2021; Shields et al., 1985; Watanabe et al., 2001).
In an important study, Meyer and Schulman (Meyer et al., 1992) found that the initial binding of Ca2+/CaM to a CaMKII subunit occurs with moderate affinity (KD = ~50 nM). However, the movement of the inhibitory segment caused by autophosphorylation substantially increases the affinity for Ca2+/CaM, a process they referred to as CaM-trapping. Putkey and Waxham (1996) later found that the off-rate of CaM is increased from 6.6 s−1 to 9x10⁻⁵ s−1, producing an ~70,000-fold increase in affinity (KD = ~1.8 pM). Tse et al. (2007) showed that autophosphorylation exposes residues Phe293 and Asn294 in the CaM-binding domain, and these residues mediate the high affinity CaM-trapping. After autophosphorylation, residues on both the N- and C-termini of CaM (Fig. 2A) bind tightly around the FNARRK sequence in the CaM-binding domain (Fig. 1C, Fig. 2).
Figure 2.

A. Ribbon diagram of the atomic structure of CaM with four bound Ca2+ ions (orange), two each at its N- and C- termini. The atoms of residues that are bound tightly to the inhibitory segment of CaMKII during trapping are represented as spheres. Rendered in PyMol from pdb #1CLL; B. Color-coding of residues comprising the inhibitory and CaM-binding domains of CaMKII subunits: Thr 286 (yellow), two K residues shielding the F and N residues (dark green), F (red), N (cyan), initial CaM-binding domain (magenta). C. Ribbon diagram of the atomic structure of an autoinhibited subunit of CaMKII (light green) with the atoms of residues that mask the CaM-trapping amino acids phenylalanine (F, red) and asparagine (N, cyan) shown as light and dark green spheres. Rendered in PyMol from pdb #3SOA; D. Ribbon diagram of “trapped” CaM bound to the extended CaM-binding domain. After autophosphorylation of Thr-286 the inhibitory segment assumes a fully extended conformation. The critical F and N residues are exposed and residues on both the N- and C-termini of CaM (blue) bind tightly around the FNARRK portion of the CaM binding domain. Rendered in PyMol from pdb #2WEL.
Various investigators have postulated that CaM-trapping leads to an enhanced non-linear increase in autophosphorylation of CaMKII during high frequency synaptic stimulation (De Koninck and Schulman, 1998; Nicoll and Schulman, 2023; Putney, 1998). Here, we test this hypothesis by investigating the impact of CaM-trapping on the dynamics of activation of CaMKII in a stochastic reaction-diffusion model instantiated in a realistic spine geometry. Computational models have the advantage of allowing tests of the importance of individual components of the model, by variation of the parameters and assumptions built into it. The tiny spatial compartment of the spine, and the low copy numbers of molecules therein make it impossible to measure enzyme activity experimentally within spine compartments without significantly perturbing the kinetics of protein-protein interactions. However, the accuracy of kinetic assumptions in a model can ultimately be tested by comparing predictions of the model to measurable downstream experimental results.
In this initial model, we have considered how CaM-trapping will affect the response of CaMKII holoenzymes distributed uniformly in a median sized spine to two 1 sec bursts of 50 Hz presynaptic stimulation, spaced 2 sec apart. We also investigate how CaM-trapping may regulate dephosphorylation of CaMKII by protein phosphatase-1 (PP1), and thus influence the kinetics of autophosphorylation of CaMKII and the response of CaMKII to different stimulation frequencies. Under these initial conditions, we show that CaM-trapping does not influence the rate of autophosphorylation of CaMKII during the intermediate-strength two-epoch stimulus. However, CaM-trapping does lead to longer persistence of binding of Ca2+/CaM species to phosphorylated CaMKII subunits (pCaMKII). CaM-trapping does not produce an increase in binding of CaM species to non-phosphorylated subunits, and therefore doesn’t increase the probability of new autophosphorylation during the second stimulus epoch.
On the other hand, we show that the amount of autophosphorylation during both the first and second epochs is exquisitely sensitive to the level of activate protein phosphatase-1 (PP1) in the model. In (Pharris et al., 2019), we postulated that binding of CaM to the regulatory domain of pCaMKII may sterically hinder the ability of PP1 to bind to and dephosphorylate the nearby phospho-T286. Here we find that when such steric hindrance is included in the model, CaM-trapping dramatically slows the rate of dephosphorylation and inactivation of pCaMKII. Thus, we propose that CaM-trapping in vivo may contribute to control of synaptic strength by a network-based mechanism of kinetic regulation that is sometimes referred to as “kinetic proofreading” (Hopfield, 1974; Huang et al., 2016).
Model development:
To examine how CaM-trapping can influence activation of CaMKII by Ca2+ flowing through active NMDARs, we created a spatial model, in which we placed CaM, CaMKII holoenzymes, and PP1 uniformly within a median-sized spine. The geometry is captured from our earlier model of calcium handling (Bartol et al., 2015b) and attached to a cylinder designed to provide a diffusion source/sink comparable to the reconstructed dendritic segment in the earlier model. We set the boundary conditions so that the holoenzymes and PP1 are confined to the spine cytosol; whereas, all other molecules populate both the spine and the attached cylinder and diffuse freely between them. We generate a calcium signal by stochastic activation of 15 NMDARs located in the middle of the PSD with a realistic synaptic stimulus consisting of two epochs of five 5 Hz bursts of 5 presynaptic action potentials (APs) at 50 Hz. The stimulus reliably causes APs in the postsynaptic soma that are followed by a back-propagating AP (bAP). We use our recently updated platform, MCell4 (Husar, 2024), which integrates the spatial simulation capabilities of MCell3 (Kerr et al., 2008) with the rule-based, network-free simulation framework of BioNetGen (Faeder et al., 2009). The integration of these two capabilities provides a versatile and powerful tool that is ideal for studying the kinetics of complex reactions within the small structure of a spine.
We combined elements from three of our recent models. The first of these earlier models, created in Mathematica, is a non-spatial model that simulated the dynamics of activation of individual monomeric subunits of CaMKII by Ca2+/CaM as the concentration of Ca2+ rises (Pepke et al., 2010). This model included states of Ca2+/CaM with one, two, three, or four bound Ca2+ ions. Its parameters were taken directly from published measurements or deduced from the thermodynamic principle of “detailed balance” of ΔG within reaction loops. The second earlier model was a spatial model that simulates Ca2+ flux into and out of spines upon activation of NMDARs (Bartol et al., 2015b). It was constructed with MCell3 within the geometry of a hippocampal dendrite reconstructed from serial sections of a 6 x 6 x 5 μm cube of neuropil viewed by electron microscopy. The model includes all of the major sources and sinks of Ca2+ ion known to be present in the membranes and cytosol of spines and dendrites. Parameters were taken from experimental literature. Predicted Ca2+ fluxes induced by excitatory post-synaptic potentials (EPSPs) and back-propagating action potentials (bAP’s) simulated in the model were validated against an experimental study by Sabatini et al. (Sabatini et al., 2002). The third earlier model was a non-spatial stochastic model of activation and autophosphorylation of CaMKII subunits within a dodecameric holoenzyme (Ordyan et al., 2020). This model employed BioNetGen language (BNGL) and the simulation algorithm NFsim, to build the structure of the holoenzyme, simulate the kinetics of interaction of its subunits with Ca2+/CaM, and simulate the subsequent autophosphorylation and dephosphorylation by phosphatase of individual subunits. Parameters and reactions of subunits in this third model were based upon those in Pepke et al. (2010). The model did not include CaM-trapping or spatial dynamics and was used to examine the potential influence of neurogranin on integration and summation of autophosphorylation following increases in Ca2+ concentration. All three models were based on reactions and parameters taken from experimental measurements. Thus, they involve relatively few arbitrary assumptions about the kinetic behavior of the simulated molecules and the parameters have been repeatedly vetted for accuracy.
In the new model presented here, reactions of CaMKII holoenzymes and CaM, specified in BNGL, were placed into the geometry of a median sized spine taken from the model of Ca2+ flux in Bartol et al., 2015b, including the Ca2+ pumps, channels, mobile and immobile Ca2+ buffers, and NMDARs. We included CaM and protein phosphatase-1 (PP1), along with the reactions leading to CaM-trapping by autophosphorylated CaMKII subunits. We compared the activation kinetics of the subunits in holoenzymes in the presence and absence of CaM-trapping. We also varied the concentration of PP1 to investigate how phosphatase concentration can alter CaMKII autophosphorylation kinetics.
The model was constructed and simulated in MCell4 (Husar, 2024, https://www.mcell.org), the newest version of the spatial modeling program MCell. This version builds on the earlier MCell-R, which integrated the use of BNGL (Faeder et al., 2009) for model specification with the spatial simulation algorithms of MCell (Tapia et al., 2019). To simulate reaction dynamics MCell-R employed the reaction methods of NFsim, which was originally developed as a non-spatial simulation platform to read and compute simulations in BNGL (Sneddon et al., 2011). NFsim’s library of functions carries out the graph operations required for efficient network-free simulation in a spatial context. In other words, it avoids the need to pre-compute a full reaction network and store each possible state in memory. Instead, it executes each rule as needed. The number of rules specified in BNGL is usually much lower than the number of possible reactions in the full network; thus, memory savings are substantial (Tapia et al., 2019). MCell4 substantially improves upon the performance and generality of MCell-R by replacing the NFsim library with a newly developed library of functions, called libBNG, which implements full integration of network-free BNGL directly in MCell. The number of possible reactions of the CaMKII holoenzyme described here would be computationally intractable in other modeling platforms. A Python API was added to MCell4 enabling the model presented here by permitting customizations to the configurations of molecules and reactions that are not easily encoded in Cell Blender, the graphical user interface for MCell (Gupta et al., 2018).
Spine Geometry and Numbers of Proteins.
We used the geometry of a median-sized spine (#37) from our previously published model of calcium transients in dendrites of hippocampal neuropil (Bartol et al., 2015a; Bartol et al., 2015b). The volume of the cytosol of the spine is 0.015 μm3 (0.015 fl) and the PSD diameter is ~200 nm. The spine membrane contains voltage-dependent Ca2+ channels (VDCCs), plasma-membrane Ca2+ pumps (PMCAs) and Na+/Ca2+ exchangers (NCXs). The spine cytosol contains an immobile Ca2+ buffer, and calbindin. The numbers and densities or concentrations of these molecule are as in (Bartol et al., 2015b). We added CaMKII holoenzymes to the cytosol of the spine at a concentration of 6.67 μM (60 holoenzymes) ; thus, individual subunits were present at a concentration of 80 μM (720 subunits, Bennett et al., 1983; Erondu and Kennedy, 1985). PP1 was added to the spine cytosol at a “baseline” concentration of 1.25 μM (12 molecules, Ingebritsen et al., 1983). CaM was added to the cytosol of both the spine and the cylinder at a concentration of 30 μM (290 CaM molecules in the spine and ~10,300 in the cylinder, Kakiuchi et al., 1982; Watterson et al., 1976). For studies of the effect of phosphatase on autophosphorylation, the concentrations of PP1 in the spine were varied from 0.65 μM to 5 μM. Details of the calculations of numbers of CaMKII, CaM, and PP1 are in Supplemental Methods. One cluster of 15 NMDARs (Fig. 3), each of which have the kinetic properties described in (Bartol et al., 2015b), was added to the area designated as PSD on the reconstructed spine membrane.
Figure 3.
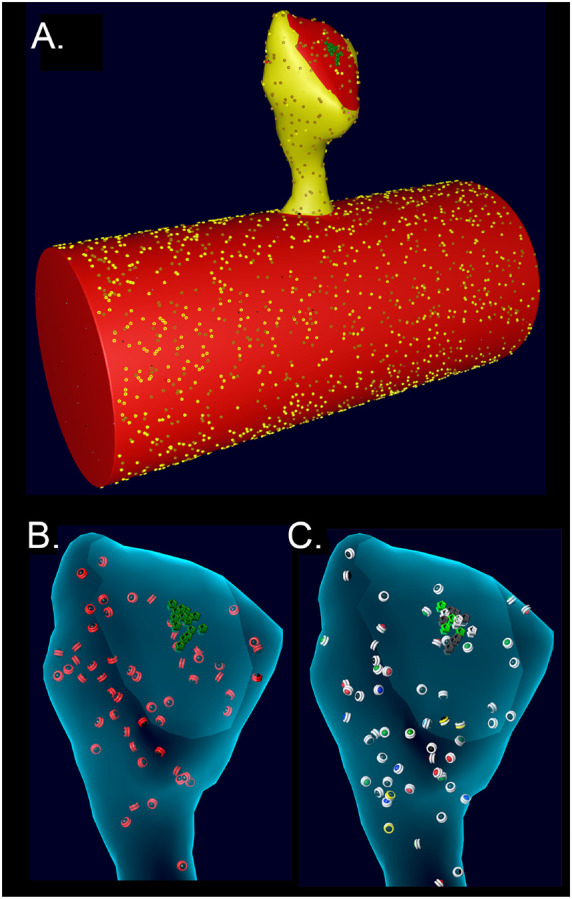
A. Spine # 37 from (Bartol et al., 2015b) attached to a cylinder with visible glyphs representing surface proteins. The PSD area on the spine and the attached cylinder are shown in red. B. A translucent view of spine #37 at instantiation showing surface NMDARs (green) and internal inactive CaMKII holoenzymes (red glyphs). C. Spine #37 at t=159 msecs after the start of a stimulus. Open NMDARs on the surface are represented as white glyphs The outer rings of the CaMKII glyphs have changed color to white indicating where CaM with 4 bound Ca2+ ions has bound to the subunits (see Results). The color of the internal spheres in the glyphs indicates the number of autophosphorylated subunits in each ring.
Boundary Conditions.
In the previous model (Bartol et al., 2015b), the spines were attached to a reconstructed dendrite. Diffusing molecules, including Ca2+ and calbindin, moved freely through the neck between the spine and the dendritic cytoplasm. The VDCCs, PMCAs, and NCXs in the dendritic membrane contributed to the decay time of the spine Ca2+ transient. In that model, we showed that in the first 100 msecs after a stimulus, approximately half of the Ca2+ entering spine #37 after an EPSP followed by a bAP exited by diffusion through the neck, either free or bound to calbindin. To create an accurate model of the response of CaMKII to Ca2+ influx, while also minimizing computational time, we imported the geometry of spine #37 and attached it to a cylinder 0.7 μm in diameter and 1.5 μm long, created in Blender. The mesh representing the attachment of the spine to the cylinder was adjusted to make it free of leaks (i.e. “water-tight”). The wall of the spine has the shape of the inner membrane leaflet, and is reflective to all the volume molecules. To create the desired boundary between the neck of the spine and the cylinder, the spine is encased in a shell constructed at a uniform distance of 20 nm from the spine membrane. The shell cuts through the interface at the junction between the spine and the cylinder so that it forms a closed barrier at the base of the spine neck. CaMKII holoenzymes and PP1 are confined to the spine by making this shell transparent to Ca2+, calmodulin, and calbindin, but reflective to CaMKII and PP1. The cylinder and spine are instantiated with the appropriate numbers of Ca2+ pumps and channels (NCX, PMCA, VDCC) in the membrane, and with cytosolic molecules Ca2+, calbindin, and immobile buffers, as described for the dendritic shaft in (Bartol et al., 2015b). The cytosolic molecules calmodulin and PP1, which were not present in (Bartol et al., 2015b), were added at the concentrations indicated above. We adjusted the length of the cylinder until the results of simulations of activation of CaMKII converged when we enlarged it further. Convergence was achieved between shaft lengths of 1.5 and 1.8 μm. Therefore, the length of the cylinder was set at 1.5 μm, ensuring that the cylinder provides a boundary equivalent to the dendritic shaft.
CaMKII holoenzyme and Calmodulin.
The CaMKII holoenzyme was modeled as a dodecamer. The individual subunits were specified in BNGL as follows: <CaMKII(l, r, c, T286~0~P, pp1~0~1,T306~0~P, cam~la~ha)>. In BNGL syntax, the name of the molecule is followed in parentheses by a set of “components”, which represent binding sites or modification sites. In this case, components l, r, and c were sites of interaction within the holoenzyme; l was a binding site at the left side of the subunit, r at the right side of the subunit, and c (center) a site that interacted with a subunit in the opposite six-membered ring (Fig. 3B). The unphosphorylated subunits were added (“instantiated”) into the model by specifying interactions at these three binding sites (Fig. 3) to comprise fully specified CaMKII holoenzymes. “T286” is the threonine autophosphorylation site that confers Ca2+-independence; it could have two states, either unphosphorylated (~0) or phosphorylated (~P). Pp1 was a binding site for the catalytic subunit of protein phosphatase-1; it could have two states, either unbound (~0) or bound (~1) to PP1. “T306” was the threonine autophosphorylation site that could be phosphorylated after CaM unbound from the subunit. The T306 site remained unphosphorylated (~0) in the present study. The “cam” component was the binding site for calmodulin; it could have two states, either low affinity (~la), or high affinity (~ha). The ~ha state was the high affinity state that appeared when a subunit was autophosphorylated at T286; i.e the “CaM-trapping” state (see below).
In BNGL syntax, a bond between two molecules is represented as a period and the components involved in binding are followed by an ! (pronounced “bang”) and a number. For example a bond between the left side of one subunit and the right side of another were represented as CaMKII(l!1, r, c, T286~0, pp1~0, T306~0, cam~la).CaMKII(l, r!1, c, T286~0, pp1~0, T306~0, cam~la). The ! could be followed by any number so long as the complementary binding components of the two parts of the complex molecule had the same number.
CaM was represented in BNGL as follows: CaM(C~0~1~2, N~0~1~2, camkii). As shown in Fig. 2A, CaM had four binding sites for Ca2+, two at the C-terminus and two at the N-terminus, so the three states for each terminus (C or N) represented zero bound Ca2+, one bound Ca2+, or two bound Ca2+. The camkii component represented the binding site for a CaMKII subunit.
Reaction rules.
Reaction rules are specified in BNGL as discrete transformations. For example, the rule “CaM(C~0,camkii) + ca ↔ CaM(C~1,camkii) k_on1C, k_off1C” encodes binding of one Ca2+ to the C-terminus of CaM for CaM not bound to CaMKII. The specified rate constants for each rule are used to compute the probability that the transformation occurs when the two molecules involved in a transformation collide, or occurs at a given time step for a unimolecular transformation. At run time, a random number generator is initialized with a seed number for each individual simulation that selects a sequence of random numbers to be used to specify the sequence of probabilities of transformations for the simulation.
The model presented here included all of the reaction rules in the model of Ca2+ handling in (Bartol et al., 2015b). In addition, we included rules for binding/unbinding of Ca2+ to each of the four sites on CaM when CaM was not bound to CaMKII, binding/unbinding of each state of CaM to a subunit of CaMKII in the holoenzyme, and binding/unbinding of Ca2+ to each of the four sites on CaM when CaM was bound to CaMKII. Binding of CaM to CaMKII increased its affinity for Ca2+, as expected from thermodynamic detailed balance. Parameters that determined the probabilities for binding among Ca2+, CaM, and subunits of CaMKII were taken from (Pepke et al., 2010). We also included rules for autophosphorylation of one subunit of CaMKII by another. Autophosphorylation at Thr286 occurred between adjacent subunits in a holoenzyme when they were both active, either because they both had bound Ca2+/CaM or because the “right-hand” subunit was already autophosphorylated. We modeled the autophosphorylation reaction as proceeding in one direction around a ring, with the “right-hand” subunit acting as the kinase and the “left-hand” subunit acting as substrate. This situation fits the structural analysis of subunit interactions during autophosphorylation (Rellos et al., 2010). Parameters that governed the probability of autophosphorylation were derived from (Shifman et al., 2006), who showed that autophosphorylation can be initiated, albeit at a relatively slow rate, by binding of CaM that has two Ca2+ ions bound only at the C-terminus or only at the N-terminus. We generated 64 permutations of the autophosphorylation rules between neighboring CaMx-bound subunits in a holoenzyme (CaMx denotes CaM with all possible numbers of bound Ca2+ ions). Pairs of subunits, both of which contained bound CaM4, underwent autophosphorylation of the left subunit at the rate k_pCaM4 (0.96 s−1, Schifman et al., 2006). All other permutations underwent autophosphorylation of the left subunit at the rate k_pCaMpartial (0.1 s−1), which is a coarse-grained approximation of the rates measured in Shifman et al (2006). We also included eight rules in which the right-hand subunit of a pair was autophosphorylated but no longer had CaM bound and the left hand subunit contained bound CaMx. For these rules, when the target subunit was bound to CaM4, the rate of autophosphorylation was k_pCaM4. When the target subunit was bound to CaM with less than 4 Ca2+ ions bound, the rate of autophosphorylation was k_pCaMpartial.
CaM-trapping.
Meyer and Schulman (Meyer et al., 1992) showed that the initial binding of Ca2+/CaM to a subunit within the CaMKII holoenzyme occurs with moderate affinity (KD = ~50 nM). However, following autophosphorylation, the inhibitory domain is moved entirely away from the substrate pocket (Rellos et al., 2010), leading to a greater than 1000-fold higher affinity for CaM, referred to as CaM-trapping (see Introduction, Meyer et al., 1992; Putkey and Waxham, 1996; Tse et al., 2007). We added reactions to our model to simulate CaM-trapping to enable comparison of simulations with and without CaM-trapping. A component state cam~la was added to CaMKII subunits representing the initial lower affinity CaM-binding site; the component state cam~ha was added representing the higher affinity site present following autophosphorylation of a subunit. We calculated the off rates of individual CaMx species from CaMKII for each state based on the necessity that ΔG = 0 around a reaction cycle ("detailed balance," e.g. see Pepke et al., 2010). We set the rate of transition from cam~la to cam~ha following autophosphorylation equal to the rate of dissociation of CaMx from the cam~la site.
Stimulus.
We used a stimulus consisting of two epochs of presynaptic action potentials. Each epoch consisted of five bursts of action potentials delivered sequentially at 5 Hz (e.g. 5 bursts per sec). Each burst contained 5 action potentials delivered at 50 Hz (e.g. 5 APs per 100 msec). The two epochs were separated by 2 sec (Fig. 5 A, B). The time series of glutamate release and of changes in the postsynaptic membrane potentials at the spine during the stimulus were simulated as follows:
Figure 5.

A. Two epochs of 5 Hz bursts of APs were applied to the presynaptic bouton as described in the text. Each burst was comprised of 5 action potentials delivered at 50 Hz. The stimulus began at 1 sec. The two epochs were separated by 2 secs. B. Data from A. between 1 and 1.15 secs. C. Glutamate concentration in the cleft after release from single vesicles during the stimulus shown in A. (Example from a single simulation initiated with seed #50, as described in the text) D. Data from C between 1 and 1.15 secs. E. Postsynaptic membrane potentials during the single simulation initiated with seed #50. F. Data from E between 1 and 1.15 secs. No glutamate release occurred prior to the third bAP; two release events occurred prior to the fourth bAP; no glutamate release occurred prior to the fifth bAP. Red dashed lines between C. and E. indicate ectopic release events and their associate postsynaptic potentials. Red dashed lines between D. and F. indicate EPSPs generated by glutamate release events depicted in D.
1. A set of realistic stochastic timings of release of glutamate from presynaptic vesicles driven by the two-epoch stimulus were computed in MCell for 50 random seeds, as described by Nadkarni et al. (2010; 2012) in a detailed model of presynaptic vesicle release. The timings of glutamate release computed in this model took into account stochastic short term plasticity of vesicle fusion, including facilitation by residual Ca2+ and depression due to depletion of docked vesicles and resulting decreases in release probability. We assumed a median vesicle size containing 1500 molecules of glutamate (See Fig. 6 in Haas et al., 2018). The releases did not occur with each presynaptic AP because for this median-sized spine we simulated the initial release probability as ~0.2. The active zone initially contained 7 docked vesicles. Release was facilitated after the first few stimuli (due to residual presynaptic Ca2+ in the active zone) and then depressed due to the reduction in the number of docked vesicles. Simulations initiated by each seed resulted in different stochastic trains of release times. Empty vesicle docking sites were reoccupied with a time constant of 5 seconds (i.e. 0.2 per second rate of redocking per site).
The precise timing of the Glu release after a presynaptic AP was stochastic and sometimes occurred 10's of ms after the AP, especially after a long train of stimuli when the [Ca2+] in the presynaptic terminal was high. If the vesicle docking sites were highly depleted and [Ca2+] was elevated in the terminal, a vesicle sometimes appeared to release "spontaneously" at the moment it docked. The sets of timings of glutamate release were indexed by their seed numbers and used to measure glutamate concentration in the cleft as described below. The release timings for each seed were stored in files and used in the python script, “glu_dependent_rates.py.”
2. We used MCell to measure the time course of glutamate concentration in the synaptic cleft at the location of the cluster of 15 NMDA receptors (Fig. 3.). We assumed release of 1500 molecules of Glu from each vesicle and also assumed that the vesicle release sites were located over the NMDAR cluster. This latter assumption meant that these calculations did not reflect the small variability in glutamate concentration at the NMDARs that would result from stochastic locations of release sites. To measure the glutamate concentration, we used the full spatial model of hippocampal neuropil described in (Bartol et al., 2015b). A measurement box was positioned in the cleft covering the extracellular faces of the receptors. The box was transparent to the diffusion of glutamate. Its depth was equal to the height of the cleft and the sides of the box enclosed the NMDAR cluster. The time course of concentration of glutamate within the box was recorded for each release. Each transient of glutamate in the box was brief with a tau of about 1.2 μs, and was the same size, ~70 mM, because we did not model the distribution of synaptic vesicle sizes. This concentration time course was used to create a pseudo-first order approximation of binding of glutamate to NMDARs, as follows. If kplus is the second order rate constant for glutamate binding to NMDARs, the rate of binding of glutamate is given by [glu] x [NMDAR] x kplus. Binding of glutamate to each NMDAR in MCell was specified as a first-order transition from an unbound NMDAR to an NMDAR with bound glutamate. The measured time course of the glutamate concentration was used to compute pseudo-first order rate constants, kplus-effective = [glu] x kplus, for each release event and for each seed, as specified in the python script, “glu_dependent_rates.py.” The time courses of kplus-effective were then used to determine the probabilities of transition of each NMDAR to the bound state for each seed during the simulation. The full kinetic model for transitions of the NMDAR channel following glutamate binding is explained in detail in (Bartol et al., 2015b).
3. The APs in the soma and associated back-propagating APs (bAPs) in the dendrites arising from the two-epoch stimulus were simulated in the program NEURON by injecting current into the axon hillock of pyramidal neuron, model “j4” (Mainen et al., 1995). The voltages experienced at a spine located on a dendritic branch ~100 μm from the soma were recorded, as described in (Keller et al., 2008) and (Bartol et al., 2015b). The spine was chosen so that the bAP arrived at the spine 10 ms after the presynaptic AP. The current injection was large enough to reliably initiate an AP in the soma and subsequent bAP, as it would if applied to an axon bundle with many synapses ending on the neuron. The ion channels included in the j4 simulation are described more fully in (Bartol et al., 2015b) and in the NEURON ModelDB (https://senselab.med.yale.edu/ModelDB/ShowModel. cshtml?model=2488). The time course of the bAP arriving at the spine was saved to the data file “post_bAP_spine_voltage.dat.”
4. A single 25 mV postsynaptic EPSP resulting from release of glutamate from one vesicle activating both AMPA and NMDA receptors was simulated in the program NEURON. The 25 mV peak was the average size for hippocampal CA1 pyramidal neurons, calculated by (Harnett et al., 2012). Because the NEURON model did not contain glutamate receptors, the excitatory postsynaptic potential (EPSP) was simulated by injecting current into the spine head as an alpha function such that a 25 mV peak EPSP was produced. The peak of the EPSP occurred about 3 ms after release and decayed with a τ of ~10 ms. The time course of the EPSP was saved to the data file “post_epsp_spine_voltage.dat.”
5. A python script (vm_dependent_rates_post.py) was written to add together the changes in membrane potential in the spine resulting from EPSPs during simulations for each seed, and from the bAP arriving 10 msecs after the AP in the soma. We assumed that the EPSP and bAP summed together linearly. There was a reliable 10 ms delay between the generation of the presynaptic spike in the soma and the arrival of the postsynaptic bAP at our single spine in simulations for each seed. In contrast, the release of glutamate and the resulting timing of the EPSP were more variable because of the stochastic elements built into the simulation of release. When glutamate was released, it was most often at 10ms before the arrival of the bAP. However, occasionally, for the reasons discussed above, glutamate release and the associated EPSP did not appear causally linked to the bAP. Two such events are shown at ~2.4 and ~6.2 sec in Fig. 5C and E, which depict results of the simulation for seed #50. NMDARs open and flux Ca2+ into the spine only when they bind glutamate at the same time that the EPSP and bAP depolarize the spine . The coincidence of these events opens the channel and relieves the Mg2+ block that prevents movement of Ca2+ through the channel (Ascher and Nowak, 1988; Vargas-Caballero and Robinson, 2004). The complex kinetics of the transitions that allow Ca2+ flux through the NMDARs are explained in detail in (Bartol et al., 2015b).
Data Analysis:
High Performance Computing.
The simulations were performed on an HPC cluster at Caltech on 50 nodes each having at least 256 Gbytes of RAM. Monte Carlo simulations in MCell4 (ref, mcell.org) rely on generation of random numbers to determine the diffusion trajectories and probabilities of each reaction. Each simulation was initiated with a different seed for the random-number generator. Output consisting of numbers of molecular states across time were stored as ASCII data files. The number of individual simulations (50) needed to obtain high confidence averages was determined by comparing the mean and standard deviation of 30, 40, and 50 simulations for calcium dynamics. Our analyses showed that there was no statistically measurable difference between the population averages for 40 and 50 seeds. We used 50 seeds for each condition in our simulation to ensure that we would obtain a full representation of all possible stochastic trajectories. All data are plotted as the mean of 50 seeds..
Output was plotted in MatPlotLib (matplotlib.org) or Prism (GraphPad, www.graphpad.com).
The time constant (τ) of exponential decay of pCaMKII caused by dephosphorylation by PP1 (Table 1) was calculated by fitting the amplitude and decay time of averaged curves of pCaMKII (Figs. 10-12) with an equation for a single exponential.
Table 1.
Values of tau for dephosphorylation of pCaMKII in the non-trapping and trapping cases were determined at different simulated concentrations of PP1 from the data shown in Figures 9 and 10, respectively, as described under Methods. The values of tau in the presence of competition for binding between CaM and PP1 were determined for the non-trapping case from the data shown in Fig. 12 B, and for the trapping case from Fig. 13. The tau for Epoch 1 was identical to that of Epoch 2 as determined by measuring the decay of pCaMKII from the peak at 4 secs to 5 secs, which was identical to that of Epoch 2 from the peak at 7.7 secs to 8.7 secs. Tau’s for CaM4, CaM2C, and CaM2C1N from Fig. 13B were 61.7, 57.2, and 59.2, respectively.
| [PP1] | Tau Non-trapping |
Tau Trapping |
Tau Non-trapping CaM vs. PP1 competition |
Tau Trapping CaM vs. PP1 competition |
||||
|---|---|---|---|---|---|---|---|---|
| Epoch 1 | Epoch 2 | Epoch 1 | Epoch 2 | Epoch 1 | Epoch 2 | Epoch 1 | Epoch 2 | |
| 0.65 μM | 5.0 s | 4.9 s | 5.01 s | 4.8 s | ||||
| 1.25 μM | 1.9 s | 1.7 s | 2.0 s | 1.8 s | 2.3 s | 1.9 s | 60.4 s | 60.4 s |
| 2.5 μM | 0.74 s | 0.65 s | 0.74 s | 0.67 s | ||||
| 5.0 μM | 0.33 s | 0.32 s | 0.38 s | 0.32 s | ||||
Figure 10:

Dynamics of formation of pCaMKII subunits and binding of CaM species to them in the presence of different concentrations of active PP1, and in the presence of CaM-trapping. A. 0.65 μM, B. 1.25 μM, C. 2.5 μM, and D. 5 μM. Each curve is the average of 50 simulations initiated with different random seeds.
Figure 12.

Formation and decay of pCaMKII and bound CaM species after the two-epoch stimulus. A. The simulations depicted in Fig. 12D were extended for an additional 10 seconds to measure the rate of dephosphorylation of pCaMKII in the presence of competition for binding between CaM and PP1. B. Data from A. plotted with magnified y-axes to show visible decay of bound CaM4, CaM2c (top) and CaM2C1N (bottom). The decay constant for dephosphorylation measured from this data are shown in Table 1.
Results:
Calcium dynamics in the spine in response to the two-epoch stimulus.
We first evaluated Ca2+ influx into the spine through the NMDARs and VDCCs in response to the two-epoch stimulus shown in Figure 5. As in our previous study (Bartol et al 2015), the model captured the complex and stochastic kinetics of NMDAR and VDCC channel openings (Fig. 6). The NMDAR channel was opened by binding of glutamate, and the Mg2+ block of Ca2+ flux was relieved by depolarization of the membrane during the bAP (Fig. 6A,B). During the first epoch, the number of open NMDAR channels decreased for the later three bursts of APs, reflecting the decrease in the number of vesicles releasing glutamate (Figure 5C). The bAPs continued to relieve the Mg2+ block for all open NMDAR channels (Fig. 6A, B). The number of open NMDAR channels decreased substantially for the second epoch due to the lower release probability from the presynaptic terminal caused by short term depression (Fig. 5C) and a small effect of NMDAR desensitization. The stimulus caused voltage-dependent openings of the single VDCC in the spine (Fig. 6C, D).
Figure 6.

Channel opening kinetics in response to the stimulus shown in Figure 5. A. The number of open, unblocked NMDARs is shown in green, and open, blocked NMDARs in blue. B. Data from A. between 1 and 1.15 s. C. Kinetics of opening of the single VDCC on the spine membrane. D. Data from C. between 1 and 1.15 s. Data are averages of 50 simulations initiated with different random seeds.
The stimulus resulted in calcium influx into the spine through NMDARs and VDCCs during the stimulus (Fig. 7). Fluxes through NMDARs and VDCCs corresponded to the channel opening dynamics shown in Fig. 6. Although the peak Ca2+ flux through the VDCC was greater than that through the NMDARs, the integrated flux through NMDARs was considerably greater than the integrated flux through the VDCC, as is evident in Fig. 7B. As a result of these fluxes, the free Ca2+ in the spine increased in response to the stimulus (Fig. 7C, D), as did all of the Ca2+-bound species of free CaM (Figs. 7S1 and 7S2). Total free Ca2+ entering during the first epoch was greater than that during the second epoch due to synaptic depression. In this model, CaM can diffuse from the shaft into the spine during the stimulus; thus, the total Ca2+-bound CaM and CaM bound to CaMKII exceeded the amount of CaM initially added to the spine alone.
Figure 7:

Calcium influx in spines in response to the stimulus shown in Figure 5. A. Calcium flux rate through NMDARs (green) and VDCC (blue). B. Data from A. between 1 and 1.15 s. C. Number of free calcium ions in the spine. D. Data from C. between 1 and 1.15 s. Each curve is the average of 50 individual seeds. The dynamics of NMDAR, VDCC, and calcium are the same in the CaM-trapping and non-trapping models. The dynamics of the different CaM species are shown in Fig. 7SA, B.
Dependence of the dynamics of CaM binding to CaMKII on CaM-trapping.
We measured the dynamics of formation of phosphorylated CaMKII subunits (pCaMKII) in the absence (Fig. 8A) and presence (Fig. 8B) of CaM-trapping. Each phosphorylated CaMKII subunit could be bound to CaM in any one of eight states; CaM with no bound Ca2+ (CaM0), or CaM with 1 to 4 bound Ca2+’s (CaM1C, CaM2C, CaM1C1N, CaM2C1N, CaM2N, CaM1C2N, and CaM4). The results show that the total accumulation of pCaMKII was independent of the presence of CaM-trapping with the stimulus applied here. Either with or without trapping, the numbers of pCaMKII subunits bound to CaM0, CaM1C, CaM1N, CaM2N, CaM1C1N, and CaM1C2N were negligible. In the presence of CaM-trapping, binding of CaM4, CaM2C, and CaM2C1N to pCaMKII was substantially prolonged, and the numbers of these bound CaM species did not fall to zero before the onset of the second epoch (Fig. 8B, D). However, because these species are bound to CaMKII subunits that are already autophosphorylated, the prolonged binding did not increase the likelihood that newly bound CaM during the second epoch would be located next to an active subunit. The presence of trapping did not significantly increase the lifetime of CaM species bound to non-phosphorylated subunits (Fig. 8S).
Figure 8:

Dynamics of formation of phosphorylated subunits of CaMKII (pCaMKII) and binding of CaM species to them in the presence and absence of CaM-trapping. A. Binding of calcium-bound states of CaM to pCaMKII in the absence of CaM-trapping. B. Binding of calcium-bound states of CaM to pCaMKII in the presence of CaM-trapping. Curves are the average of 50 simulations initiated by different seeds. The gray shading surrounding the curve depicting formation of pCaMKII (magenta) indicates +/− s.e.m. (C and D) The same curves as depicted in A and B, but with the gray shading surrounding the curve depicting formation of pCaMKII indicating +/− s.d. The large standard deviation results from the number of stochastic reactions in the model. The large variation reflects the biological reality of coupled reactions occurring among a limited number of molecules in a small cellular space. See Supplementary Material for a short movie of a simulation with glyphs as shown in Fig. 3 B,C.
Figures 8A and B show the small s.e.m. of formation of pCaMKII averaged over 50 seeds (grey shading), indicating the high accuracy of our calculation of the mean pCaMKII. In contrast, the large s.d. of pCaMKII (Fig. 8C, D, grey shading), captures the large dispersion of data that arose from the many probabilistic steps involved in formation of pCaMKII upon Ca2+ entry. This “noisiness” reflects the actual physiological variability expected for activation of CaMKII in a median-sized synapse by the stimulus that we used.
The dynamics of phosphorylation of CaMKII are highly sensitive to the concentration of active phosphatase.
The results in Fig. 8 were obtained with a concentration of 1.25 μM active PP1 in the spine. We chose this amount as a likely median concentration based on the study of (Ingebritsen et al., 1983). The PP1 catalytic subunit is regulated and localized in vivo by dozens of specialized regulatory subunits (Bollen et al., 2010; Brautigan and Shenolikar, 2018), including in synapses by neurabin (Bullock et al., 2007; Terry-Lorenzo et al., 2002) and spinophilin (Hsieh-Wilson et al., 1999). Thus, the level of PP1 activity in synaptic spines is likely to be variable and may be regulated by synaptic activity. For this reason, we varied the concentration of active PP1 in the spine during simulations to measure the sensitivity of autophosphorylation of CaMKII to levels of active PP1 during the stimulus. We found that the extent of formation of pCaMKII was extremely sensitive to the level of PP1 (Figs. 9 and 10). The number of autophosphorylated subunits (i.e. pCaMKII) remaining at 5 min, which was the time of initiation of the second epoch, was more than doubled (from 90 to 192) when the amount of active PP1 was reduced by half from 1.25 μM to 0.65 μM (Fig. 11). The number of active PP1 molecules bound to a CaMKII subunit at the peak of the first epoch was nearly linearly dependent on the concentration of PP1 between 0.65 and 1.25 μM (Fig. 10S).
Figure 9:

Dynamics of formation of pCaMKII subunits and binding of CaM species to them in the presence of different concentrations of active PP1 and in the absence of CaM-trapping. A. 0.65 μM, B. 1.25 μM, C. 2.5 μM, and D. 5 μM. Each curve is the average of 50 simulations run with different random seeds.
Figure 11.

Dynamics of formation of pCaMKII by competition for binding between PP1 and CaM, in the presence and absence of CaM-trapping. A. Data replotted from Fig. 8A (no trapping) for comparison to B. B. Dynamics of formation of pCaMKII in the presence of competition between CaM and PP1, and in the absence of trapping. C. Data replotted from Fig. 8B (trapping) for comparison to D. D. Dynamics of formation of pCaMKII in the presence of competition between CaM and PP1, and in the presence of trapping. Each curve is the average of 50 simulations with 1.25 μM PP1, initiated with different random seeds.
In the presence of 0.65 μM PP1, the residual number of pCaMKII remaining at 5 min was ~ 190 out of a total of 720 subunits (~ 25%), and was sufficient to support an absolute increase in formation of pCaMKII during the second epoch despite the reduced influx of Ca2+ (see Fig. 7C). At 25% autophosphorylation, the average number of pCaMKII subunits in a six-membered ring would be ~1.5. In the presence of 1.25 μM PP1, the average number of pCaMKII was ~90/720 (~12.5%), indicating an average of 0.75 pCaMKII in a six-membered ring. In order to become autophosphorylated, a subunit with newly bound CaMx would have to be located next to an activated subunit in the clockwise direction. When we decreased [PP1] from 1.25 to 0.65 μM, the probability of this occurring rose from ~ 0.75/5.25 (14%) to ~ 1.5/4.5 (33%). The higher probability increased the likelihood that a subunit with newly bound CaMx would become autophosphorylated by its neighbor. In addition, as the number of available unphosphorylated subunits decreased, the probability of two CaM’s binding to adjacent unphosphorylated subunits would be expected to rise slightly.
CaM-trapping may influence the rate of dephosphorylation of PCaMKII by prolonging the ability of bound CaM to inhibit binding of PP1.
The presence of CaM-trapping did not influence the rate or extent of formation of pCaMKII during the two epoch stimulus that we used here (Compare Figs. 9 and 10). However, it did significantly prolong the lifetimes of CaMKII-bound CaM4, CaM2C, and CaM2C1N. In an an earlier modeling study (Pharris et al., 2019), it was noted that the CaM-binding domain on CaMKII overlaps significantly with the region on the CaMKII regulatory domain immediately downstream of T-286, near where PP1 would bind to catalyze dephosphorylation of T-286. Therefore, they suggested that bound CaM might block or partially inhibit reversal by PP1 of CaMKII autophosphorylation. The molecular mechanism by which PP1 is targeted to T-286 is not known in detail. However, the suggestion that bound CaM might interfere with binding of PP1 is supported by structural studies of binding of the PP1 catalytic subunit to substrates (Bollen et al., 2010) and to the targeting subunit spinophilin (Ragusa et al., 2010), which show that PP1 interacts with these proteins over a wide area of its surface. This property of PP1 suggests that bound CaM could sterically hinder binding of PP1 to CaMKII near phosphorylated T-286.
To measure the potential effect of CaM-trapping on the postulated inhibition of PP1 dephosphorylation by bound CaM, we modified the reaction rules for dephosphorylation to allow PP1 to bind to a pCaMKII subunit only when the cam site was free. This situation represents the most extreme case in which bound CaM completely blocks PP1 binding. Because a PP1 holoenzyme likely binds to pCaMKII via more than one docking site (Bollen et al., 2010), it is also possible that bound CaM lowers the affinity for PP1 by steric hindrance, but does not block dephosphorylation completely. We did not investigate this latter possibility in the present study.
In both the presence and absence of CaM-trapping, inhibition of PP1 binding by CaM increased the formation of pCaMKII during the stimulus (Figs. 11B, D, Fig. 12, and Table 1). In the presence of CaM-trapping, the effect on autophosphorylation was profound (Fig. 11D, Table 1), increasing the rate-constant τ for dephosphorylation from ~1.8 s to 60.4 s and resulting in phosphorylation of approximately half of the CaMKII subunits during the first epoch (Fig. 11D, Fig. 12, and Table 1). Thus, this model predicts that the rate of decay of pCaMKII is intricately coupled to the relative strengths of interactions among CaM, PP1, and CaMKII.
Discussion
In this study, we developed an agent-based stochastic computational model to examine the first order responses of physiologically realistic numbers of CaMKII holoenzymes in a median-sized spine to Ca2+ signals produced by a two-epoch stimulus of medium strength. The present model is an extention of a previously constructed model of a hippocampal glutamatergic spine in which Ca2+ transients produced by activation of NMDAR’s were reconstructed from individual proteins (Bartol et al., 2015b). The numbers and kinetic parameters of the added CaMKII holoenzymes, CaM, and PP1 are drawn from measurements made over several years during biochemical and electrophysiological experiments cited in the text.
Several significant conclusions regarding regulation of activity of the CaMKII holoenzyme arise from this initial model. The first addresses the hypothesis that CaM-trapping may result in an enhanced, non-linear increase in autophosphorylation of CaMKII during high frequency synaptic stimulation (De Koninck and Schulman, 1998; Nicoll and Schulman, 2023; Putney, 1998). While CaM-trapping does indeed prolong the association of CaM with autophosphorylated CaMKII subunits, it does not contribute to the extent of autophosphorylation during the repeated stimuli in the 50Hz frequency range that we used here. This is because the association of CaM with non-autophosphorylated subunits is not prolonged by trapping, and, thus, the probability of autophosphorylation is not increased during the second epoch.
Our second finding is that the total amount of autophosphorylation of CaMKII during the two-epoch stimulus is highly sensitive to small changes in the level of active PP1 within the physiological range of 0.65 to 5.0 μM (e.g. Ingebritsen et al., 1983, Figs 10, 13). This finding is consistent with previous experimental evidence for a role of PP1 in regulation of synaptic plasticity. PP1 is specifically enriched in synaptic spines (Ouimet et al., 1995; Strack et al., 1997), and has been shown in several studies to regulate the direction and magnitude of changes in synaptic strength produced by different frequencies of stimulation. Under baseline conditions in slices from hippocampal area CA1, low frequency stimulation (1-3 Hz) leads to induction of long-term depression (LTD); higher frequency stimulation in the range of 25 - 100 Hz induces long-term potentiation (LTP); whereas, stimulation around 10 Hz is “neutral,” producing no change in synaptic strength (Brown et al., 2000; Dudek and Bear, 1992). However, the relationship between stimulus intensity and the direction of change in synaptic strength is altered by pharmacological agents that change the balance of protein kinase and phosphatase activity (Brown et al., 2000; Coussens and Teyler, 1996). For example, induction of LTD by stimulation at 1 Hz is blocked by application of inhibitors of PP1 activity (Mulkey et al., 1993). In contrast, several studies have found that cAMP-regulated inhibition of PP1 acts as a “gate” that determines whether LTP is produced by a given stimulus. For example, activation of the cAMP pathway by a variety of pharmacological agents permits induction of LTP by both widely spaced “HFS” stimulation (3 pulses of 900 at 100 Hz separated by 10 min, Blitzer et al., 1998) and by “θ pulse” stimulation in the 5-12 Hz range (Brown et al., 2000). When the increase in cAMP is blocked, these stimuli do not induce LTP. Activation of β-adrenergic receptors by noradrenaline increases LTP at hippocampal synapses through the cAMP pathway, suggesting that this mechanism is responsible for the enhancement of learning by noradrenaline (Thomas et al., 1996). Notably, we did not set the concentration of PP1, its specific activity, or its affinity for substrate in our model to achieve a particular outcome in the simulations. Rather, we chose what we considered to be the best estimates of these parameters from the biochemical literature. Thus, the consistency between the experimental findings that the synaptic response to stimulation frequency is sensitive to PP1 activity, and the high sensitivity of autophosphorylation of CaMKII to PP1 in our simulations suggests that, as a first approximation, our model reproduces behavior that would be expected in vivo.
Figure 13.

A. Peak concentrations of pCaMKII during the two epoch stimulus in the presence of increasing concentrations of active PP1. Data are replotted for comparison from the results shown in Fig. 10. The dotted red line at 5 sec marks the time of initiation of the second epoch of the stimulus. Averages ± s.e.m. of 50 simulations. B. Peak concentrations of pCaMKII during the two epoch stimulus including competition between binding of CaMx and PP1. Data with (T) and without CaM-trapping (NT) are replotted from the results shown in Fig. 11D. In the graph of the model that includes CaM-trapping, points at 4 and 5 sec and at 7.7 and 8.7 secs are marked with red arrows. The differences in numbers of pCaMKII at these times were used to compare the decay time after the first and second epochs. S.e.m.’s for most of the measurements are smaller than the symbols.
Our third finding is that CaM-trapping could dramatically alter the sensitivity of autophosphorylation to PP1. This finding is based on the structural prediction that binding of CaM to an autophosphorylated subunit of CaMKII is likely to sterically hinder binding of PP1 required for dephosphorylation of T286 (Pharris et al., 2019). The PP1 catalytic subunit interacts with substrates over an unusually large surface area comprising three different surface domains that surround the active site (Bollen et al., 2010). The recognition pockets for PP1 on substrates are usually more distant from the phosphorylated residue than the typical consensus recognition sequences for protein kinases. Binding of PP1 to a substrate via two or more of its surface domains can provide avidity that increases the KM and thus, the rate of dephosphorylation. Conversely, reducing interaction of a substrate with one of the surface domains will reduce the KM and slow the rate of dephosphorylation. The targeting of PP1 to subcellular domains, and its substrate specificity are regulated by association with a wide array of different subunits to form multi-subunit holoenzymes (Bollen et al., 2010). In dendritic spines, the predominant targeting subunit for PP1 is spinophilin (Allen et al., 1997; Ouimet et al., 2004), which binds to spine actin filaments (Grossman et al., 2002). Spinophilin also obstructs one of the three substrate-binding patches on the surface of the PP1 catalytic subunit (Ragusa et al., 2010). Thus, the spinophilin-PP1 holoenzyme would be expected to associate with substrates, including CaMKII, via the two remaining binding patches on the catalytic subunit (Bollen et al., 2010). The precise recognition sites for PP1 on CaMKII have not been identified. However, the location of the binding site for CaM on CaMKII is located ~ 7 residues downstream of T286 (Fig. 2). Binding of CaM is likely to, at least partially, sterically hinder access of PP1 to phosphorylated T286 on CaMKII because the spinophilin-PP1 holoenzyme, with a molecular mass of ~150 kDal, is much larger than a CaMKII subunit. To investigate the effect of competition between CaM-binding and dephosphorylation by PP1, we simulated the most extreme possibility which is complete block of dephosphorylation of T286 by bound CaM (Figs. 11-13). In the absence of CaM-trapping, this full competition increased the τ for dephosphorylation by ~10-20% (Table 1). The amount of phosphorylation of CaMKII in the presence of 1.25 μM PP1 was increased to approximately the same as in the presence of 0.65 μM PP1 (Fig. 13B). In contrast, when CaM-trapping was included in the model, dephosphorylation was dramatically slowed (Fig. 13B); the τ for dephosphorylation was increased 30-fold to 60.2 sec, reflecting the much longer koff for trapped CaM. In the presence of both full competition and CaM-trapping, the amount of phosphorylation of the CaMKII holoenzyme caused by the two-epoch 50 Hz stimulus doubled from ~200 pCaMKII subunits to 400, out of a total of 720 subunits. The effect of CaM-trapping in vivo on the rate of dephosphorylation of T286 by PP1 is likely somewhere between these two extremes. However, even the most extreme competitive effect would prolong the lifetimes of autophosphorylated subunits for only a few minutes after the Ca2+ concentration returns to baseline.
Competition between CaM-binding to pCaMKII and dephosphorylation of T286 by PP1 has not been extensively investigated. The only experimental study we are aware of that indirectly addressed the competition is (Bradshaw et al., 2003). These authors sought to provide evidence for a bistable kinase switch comprised of CaMKII and PP1. Their experiments indicated that bound CaM did not interfere with dephosphorylation of Thr286 by PP1. However, the experiments were carried out at 0° C to suppress autophosphorylation of Thr305/306; in addition, they used a ratio of PP1 to CaMKII that was considerably higher than would be predicted in vivo from the measured concentrations that we used in our simulations. In Bradshaw et al., the ratio of PP1 to CaMKII subunits was ~1 to 10 compared to ~1 to 80 in our simulations. Thus, it is possible that in the Bradshaw study, inhibition of PP1 activity by bound CaM was not evident due to the assay conditions.
Many computational models of activation of CaMKII, incorporating various levels of detail and complexity, have been created previously. One conceptually attractive idea has been particularly persistent in these studies — the notion that CaMKII may act as a bistable switch, with a high steady state activity reflecting LTP and a low steady state activity reflecting LTD (Lisman et al., 2002; Lisman and Zhabotinsky, 2001; Michalski, 2013, 2014; Miller et al., 2005; Pi and Lisman, 2008; Zhabotinsky, 2000). Because the notion of bistability focuses on steady state behavior, it is encoded in deterministic equations that specify multiple steady states (Pi and Lisman, 2008). The models include a control parameter that can change the steady state from the low stable state to the high stable state and have been used in mathematical biology to hypothesize the behavior of complex biological systems (For an introduction, see Strogatz, 2014.). As a result, the notion of bistability of CaMKII, while appealing in its simplicity, did not evolve from the measured biochemical interactions of CaMKII, CaM, protein phosphatases, or other proposed key proteins. We and others have put forward a series of models that account for the kinetics of autophosphorylation of a CaMKII monomer and of the holoenzyme that incorporate these detailed biochemical interactions (Ordyan et al., 2020; Pepke et al., 2010). In these and other previous models (Li et al., 2012; Pharris et al., 2019) bistability of pCaMKII was not observed.
We find that, while CaM-trapping alone does not increase the decay time of pCaMKII, competition between CaM-trapping and PP1 binding can lead to a prolonged, but not permanent, ‘high’ level of pCaMKII. This suggests that another form of kinetic regulation may be operating that is related to “kinetic proof-reading” (Hopfield, 1974; Huang et al., 2016). This network-based mechanism, involves a series of reversible biochemical steps that lead to an essentially irreversible one. However, the irreversible step only proceeds if the critical reversible steps, such as binding between two molecules, last long enough. The canonical example is the selection of the correct amino acid-tRNA complex that matches the next codon on ribosomal bound mRNA during protein synthesis. Only an exact match between the tRNA and mRNA codons results in binding that lasts long enough for irreversible formation of the peptide bond to occur (Hopfield, 1974).
We propose that to induce LTP, autophosphorylation of CaMKII subunits does not need to reach a high, irreversible steady state to initiate potentiation. Rather, the convergence of signals at the synapse must result in a temporary high level of autophosphorylated kinase that lasts long enough to trigger one or more downstream, essentially irreversible, steps that result in potentiation of the synapse. Such ‘irreversible’ steps might include dissolution of the protein condensate between PSD-95 and synGAP to an extent required for irreversible remodeling of the PSD with addition of more AMPA-type glutamate receptors and enlargement of the supporting actin cytoskeleton (Araki et al., 2015; Opazo and Choquet, 2011; Opazo et al., 2010; Walkup et al., 2016). Another irreversible step might be binding of a critical number of active CaMKII subunits to the carboxyl tails of GluN2B subunits of NMDA-receptors (Bayer et al., 2001; Bayer et al., 2006). Both of these events have been proposed to be essential aspects of development and maintenance of LTP.
What synaptic signal or combination of signals might produce a sufficiently prolonged high level of autophosphorylated CaMKII? The primary signal observed experimentally is repeated high frequency (50-100 Hz) synaptic activation that causes firing of the neuron (see Nicoll and Schulman, 2023; Sjostrom and Nelson, 2002). In addition, several studies have shown that activation of the cAMP pathway can inhibit PP1, prolonging the lifetime of autophosphorylated CaMKII, and permitting induction of LTP by lower frequency stimulation (Blitzer et al., 1998; Blitzer et al., 2005; Blitzer et al., 1995; Brown et al., 2000; Thomas et al., 1996). Src and Fyn protein kinases, activated by G-protein-coupled receptors, receptor tyrosine kinases, and/or cytokines increase the flux of Ca2+ through NMDARs, thereby enhancing induction of LTP by high frequency stimulation (Salter and Kalia, 2004). We propose that, by kinetic proof-reading, any combination of these signals that leads to sufficiently prolonged autophosphorylation of CaMKII can induce LTP in the hippocampus. In this way, the biochemical system ‘chooses’ which sets of signals to respond to by initiating LTP.
The model presented here is not intended to reproduce the full range of influences that regulate CaMKII activity in the spine in vivo. Rather it is intended to provide first-order quantitative information about how the CaMKII holoenzyme in a spine responds to realistic stimuli. In future studies, we will add additional elements in a step-by-step fashion to determine how these influence the dynamics of activation of CaMKII. These elements can include localization and concentration of CaMKII and PP1 in the postsynaptic density (PSD), placement of CaMKII in spines of different sizes, more prolonged and/or lower and higher frequency stimuli, additional proteins that localize CaM and compete for binding of CaM when the Ca2+ concentration rises, and proteins that regulate PP1. MCell4 is designed to allow introduction of each of these elements, as well as others, in a stepwise fashion to permit dissection of the effects of each and ultimately an understanding of their combined effects.
Supplementary Material
Figure 4.

BNGL model of the CaMKII holoenzyme. A. The BNGL code represents a CaMKII holoenzyme as it is initialized in a simulation. A single subunit is defined in BNGL as follows (see Ordyan et al., 2020): CaMKII(r,l,c,T286~0~P, pp1~0~1,T306~0~P,cam~la~ha. Components r, l ,and c represent binding sites among subunits in the holoenzyme as diagrammed in B. T286 is a component representing the autophosphorylation site threonine-286 which can be present in one of two states ~0 (unphosphorylated) or ~P (phosphorylated). Pp1 is a site for binding of protein phosphatase-1 which can be either unbound (~0) or bound to PP-1 (~1). T306 is the autophosphorylation site threonine-306. Cam represents the binding site for Ca2+/CaM which is allowed to be in either a low affinity binding-state (~la) with KD = 65 nM or the high affinity state associated with CaM-trapping (~ha) with KD = 1.8 pM. Bonded subunits are separated by a period. Bonds between components of subunits are represented by the symbol ! (bang) followed by a number. The number must agree for the two components that are bound to each other. The holoenzyme is initialized with no sites phosphorylated and all cam components in the ~la state. B. Diagram of the bonds formed among the r, l , and c sites on each subunit to encode the dodecameric holoenzyme.
Acknowledgments
We acknowledge Prof. T. J. Sejnowski for funding support for T.M.B and M.O, the Air Force Office of Scientific Research (AFOSR) Multidisciplinary University Research Initiative (MURI) grant FA9550-18-1-0051 to P.R., NIH grants MH115456 to M.B.K., DA030749 and MH129066 (CR-CNS) to T.J.S. and M.B.K., and NSF NeuroNex DBI-1707356, NSF NeuroNex DBI-2014862, and NIH MMBioS P41-GM103712 to T.J.S and T.M.B.
Bibliography
- Allen P.B., Ouimet C.C., and Greengard P. (1997). Spinophilin, a novel protein phosphatase1 binding protein localized to dendritic spines. Proc Natl Acad Sci U S A 94, 9956–9961, [DOI] [PMC free article] [PubMed] [Google Scholar]
- Araki Y., Zeng M., Zhang M., and Huganir R.L. (2015). Rapid dispersion of SynGAP from synaptic spines triggers AMPA receptor insertion and spine enlargement during LTP. Neuron 85, 173–189, doi: 10.1016/j.neuron.2014.12.023. [DOI] [PMC free article] [PubMed] [Google Scholar]
- Ascher P., and Nowak L. (1988). The role of divalent cations in theN-methyl-D-aspartate responses of mouse central neurones in culture. J Physiol 399, 247–266, [DOI] [PMC free article] [PubMed] [Google Scholar]
- Bartol T.M., Bromer C., Kinney J., Chirillo M.A., Bourne J.N., Harris K.M., and Sejnowski T.J. (2015a). Nanoconnectomic upper bound on the variability of synaptic plasticity. Elife 4, e10778, 10.7554/eLife.10778. [DOI] [PMC free article] [PubMed] [Google Scholar]
- Bartol T.M., Keller D.X., Kinney J.P., Bajaj C.L., Harris K.M., Sejnowski T.J., and Kennedy M.B. (2015b). Computational reconstitution of spine calcium transients from individual proteins. Front Synaptic Neurosci 7, article 17, 10.3389/fnsyn.2015.00017. [DOI] [PMC free article] [PubMed] [Google Scholar]
- Bayer K.U., De Koninck P., Leonard A.S., Hell J.W., and Schulman H. (2001). Interaction with the NMDA receptor locks CaMKII in an active conformation. Nature 411, 801–805., [DOI] [PubMed] [Google Scholar]
- Bayer K.U., LeBel E., McDonald G.L., O'Leary H., Schulman H., and De Koninck P. (2006). Transition from reversible to persistent binding of CaMKII to postsynaptic sites and NR2B. J Neurosci 26, 1164–1174, 10.1523/JNEUROSCI.3116-05.2006. [DOI] [PMC free article] [PubMed] [Google Scholar]
- Bennett M.K., Erondu N.E., and Kennedy M.B. (1983). Purification and characterization of a calmodulin-dependent protein kinase that is highly concentrated in brain. J Biol Chem 258, 12735–12744, [PubMed] [Google Scholar]
- Bi G., and Poo M.-M. (1998). Synaptic modifications in cultured hippocampal neurons: dependence on spike timing, synaptic strength, and postsynaptic cell type. J Neurosci 18, 10464–10472, [DOI] [PMC free article] [PubMed] [Google Scholar]
- Blitzer R.D., Connor J.H., Brown G.P., Wong T., Shenolikar S., Iyengar R., and Landau E.M. (1998). Gating of CaMKII by cAMP-regulated protein phosphatase activity during LTP. Science 280, 1940–1942, [DOI] [PubMed] [Google Scholar]
- Blitzer R.D., Iyengar R., and Landau E.M. (2005). Postsynaptic signaling networks: cellular cogwheels underlying long-term plasticity. Biol Psychiatry 57, 113–119, [DOI] [PubMed] [Google Scholar]
- Blitzer R.D., Wong T., Nouranifar R., Iyengar R., and Landau E.M. (1995). Postsynaptic cAMP pathway gates early LTP in hippocampal CA1 region. Neuron 15, 1403–1414, [DOI] [PubMed] [Google Scholar]
- Bollen M., Peti W., Ragusa M.J., and Beullens M. (2010). The extended PP1 toolkit: designed to create specificity. Trends Biochem Sci 35, 450–458, 10.1016/j.tibs.2010.03.002. [DOI] [PMC free article] [PubMed] [Google Scholar]
- Bourne J., and Harris K.M. (2007). Do thin spines learn to be mushroom spines that remember? Curr Opin Neurobiol 17, 381–386, S0959-4388(07)00063-3 [pii] 10.1016/j.conb.2007.04.009. [DOI] [PubMed] [Google Scholar]
- Bradshaw J.M., Kubota Y., Meyer T., and Schulman H. (2003). An ultrasensitive Ca2+/calmodulin-dependent protein kinase II-protein phosphatase 1 switch facilitates specificity in postsynaptic calcium signaling. Proc Natl Acad Sci U S A 100, 10512–10517, 10.1073/pnas.1932759100. [DOI] [PMC free article] [PubMed] [Google Scholar]
- Brautigan D.L., and Shenolikar S. (2018). Protein Serine/Threonine Phosphatases: Keys to Unlocking Regulators and Substrates. Annu Rev Biochem 87, 921–964, 10.1146/annurev-biochem-062917-012332. [DOI] [PubMed] [Google Scholar]
- Brown G.P., Blitzer R.D., Connor J.H., Wong T., Shenolikar S., Iyengar R., and Landau E.M. (2000). Long-term potentiation induced by theta frequency stimulation is regulated by a protein phosphatase-1-operated gate. J Neurosci 20, 7880–7887, [DOI] [PMC free article] [PubMed] [Google Scholar]
- Bullock S.A., Platholi J., Gjyrezi A., Heerdt P.M., Tung H.Y., and Hemmings H.C. Jr. (2007). Differential regulation of protein phosphatase-1(I) by neurabin. Biochem Biophys Res Commun 358, 140–144, 10.1016/j.bbrc.2007.04.076. [DOI] [PMC free article] [PubMed] [Google Scholar]
- Chao L.H., Stratton M.M., Lee I.H., Rosenberg O.S., Levitz J., Mandell D.J., Kortemme T., Groves J.T., Schulman H., and Kuriyan J. (2011). A mechanism for tunable autoinhibition in the structure of a human Ca2+/calmodulin- dependent kinase II holoenzyme. Cell 146, 732–745, 10.1016/j.cell.2011.07.038. [DOI] [PMC free article] [PubMed] [Google Scholar]
- Colbran R.J., Smith M.K., Schworer C.M., Fong Y.L., and Soderling T.R. (1989). Regulatory domain of calcium/calmodulin-dependent protein kinase II. Mechanism of inhibition and regulation by phosphorylation. J Biol Chem 264, 4800–4804, [PubMed] [Google Scholar]
- Coussens C., and Teyler T.J. (1996). Protein kinase and phosphatase activity regulate the form of synaptic plasticity expressed. Synapse 24, 97–103, . [DOI] [PubMed] [Google Scholar]
- De Koninck P., and Schulman H. (1998). Sensitivity of CaM kinase II to the frequency of Ca2+oscillations. Science 279, 227–230, [DOI] [PubMed] [Google Scholar]
- Dudek S.M., and Bear M.F. (1992). Homosynaptic long-term depression in area CA1 of hippocampus and the effects of NMDA receptor blockade. Proc Natl Acad Sci USA 89, 4363–4367, [DOI] [PMC free article] [PubMed] [Google Scholar]
- Erondu N.E., and Kennedy M.B. (1985). Regional distribution of type II Ca2+/calmodulin-dependent protein kinase in rat brain. J Neurosci 5, 3270–3277, [DOI] [PMC free article] [PubMed] [Google Scholar]
- Faeder J.R., Blinov M.L., and Hlavacek W.S. (2009). Rule-based modeling of biochemical systems with BioNetGen. Methods Mol Biol 500, 113–167, 10.1007/978-1-59745-525-1_5. [DOI] [PubMed] [Google Scholar]
- Giese K.P., Fedorov N.B., Filipkowski R.K., and Silva A.J. (1998). Autophosphorylation at Thr286 of the alpha calcium-calmodulin kinase II in LTP and learning. Science 279, 870–873, [DOI] [PubMed] [Google Scholar]
- Grossman S.D., Hsieh-Wilson L.C., Allen P.B., Nairn A.C., and Greengard P. (2002). The actin-binding domain of spinophilin is necessary and sufficient for targeting to dendritic spines. Neuromolecular Med 2, 61–69, 10.1385/NMM:2:1:61. [DOI] [PubMed] [Google Scholar]
- Gupta S., Czech J., Kuczewski R., Bartol T.M., Sejnowski T.J., Lee R.E.C., and Faeder J.R. (2018). Spatial stochastic modeling with MCell and CellBlender. arXiv arXiv:1810.00499v1 [q-bio.QM], [Google Scholar]
- Haas K.T., Compans B., Letellier M., Bartol T.M., Grillo-Bosch D., Sejnowski T.J., Sainlos M., Choquet D., Thoumine O., and Hosy E. (2018). Pre-post synaptic alignment through neuroligin-1 tunes synaptic transmission efficiency. Elife 7, 10.7554/eLife.31755. [DOI] [PMC free article] [PubMed] [Google Scholar]
- Hanson P.I., Meyer T., Stryer L., and Schulman H. (1994). Dual role of calmodulin in autophosphorylation of multifunctional CaM kinase may underlie decoding of calcium signals. Neuron 12, 943–956, [DOI] [PubMed] [Google Scholar]
- Harnett M.T., Makara J.K., Spruston N., Kath W.L., and Magee J.C. (2012). Synaptic amplification by dendritic spines enhances input cooperativity. Nature 491, 599–602, [DOI] [PMC free article] [PubMed] [Google Scholar]
- Harris K.M., and Weinberg R.J. (2012). Ultrastructure of synapses in the mammalian brain. Cold Spring Harb Perspect Biol 4, 10.1101/cshperspect.a005587. [DOI] [PMC free article] [PubMed] [Google Scholar]
- Hell J.W. (2014). CaMKII: claiming center stage in postsynaptic function and organization. Neuron 81, 249–265, doi: 10.1016/j.neuron.2013.12.024. [DOI] [PMC free article] [PubMed] [Google Scholar]
- Hopfield J.J. (1974). Kinetic proofreading: a new mechanism for reducing errors in biosynthetic processes requiring high specificity. Proc Natl Acad Sci U S A 71, 4135–4139, 10.1073/pnas.71.10.4135. [DOI] [PMC free article] [PubMed] [Google Scholar]
- Hsieh-Wilson L.C., Allen P.B., Watanabe T., Nairn A.C., and Greengard P. (1999). Characterization of the neuronal targeting protein spinophilin and its interactions with protein phosphatase-1. Biochemistry 38, 4365–4373, [DOI] [PubMed] [Google Scholar]
- Huang W.Y., Yan Q., Lin W.C., Chung J.K., Hansen S.D., Christensen S.M., Tu H.L., Kuriyan J., and Groves J.T. (2016). Phosphotyrosine-mediated LAT assembly on membranes drives kinetic bifurcation in recruitment dynamics of the Ras activator SOS. Proc Natl Acad Sci U S A 113, 8218–8223, 10.1073/pnas.1602602113. [DOI] [PMC free article] [PubMed] [Google Scholar]
- Husar A., Ordyan M., Garcia G.C., Yancey J.G., Saglam A.S., Faeder J.R., Bartol T.M., Kennedy M.B., Sejnowski T.J. (2024). MCell4 with BioNetGen: A Monte Carlo simulator of rule-based reaction-diffusion systems with python interface. PLoS Comput Biol in press, doi: 10.1101/2022/05.17.492333. [DOI] [PMC free article] [PubMed] [Google Scholar]
- Ingebritsen T.S., Stewart A.A., and Cohen P. (1983). The protein phosphatases involved in cellular regulation. 6. Measurement of type-1 and type-2 protein phosphatases in extracts of mammalian tissues; an assessment of their physiological roles. Eur J Biochem 132, 297–307, 10.1111/j.1432-1033.1983.tb07362.x. [DOI] [PubMed] [Google Scholar]
- Kakiuchi S., Yasuda S., Yamazaki R., Teshima Y., Kanda K., Kakiuchi R., and Sobue K. (1982). Quantitative determinations of calmodulin in the supernatant and particulate fractions of mammalian tissues. J Biochem 92, 1041–1048, [DOI] [PubMed] [Google Scholar]
- Keller D.X., Franks K.M., Bartol T.M. Jr., and Sejnowski T.J. (2008). Calmodulin activation by calcium transients in the postsynaptic density of dendritic spines. PLoS One 3, e2045, 10.1371/journal.pone.0002045. [DOI] [PMC free article] [PubMed] [Google Scholar]
- Kennedy M.B. (2000). Signal-processing machines at the postsynaptic density. Science 290, 750–754, doi: 10.1126/science.290.5492.750. [DOI] [PubMed] [Google Scholar]
- Kennedy M.B. (2013). Synaptic signaling in learning and memory. Cold Spring Harb Perspect Biol 8, a016824, doi: 10.1101/cshperspect.a016824. [DOI] [PMC free article] [PubMed] [Google Scholar]
- Kennedy M.B., Beale H.C., Carlisle H.J., and Washburn L.R. (2005). Integration of biochemical signalling in spines. Nat Rev Neurosci 6, 423–434, 10.1038/nrn1685. [DOI] [PubMed] [Google Scholar]
- Kerr R.A., Bartol T.M., Kaminsky B., Dittrich M., Chang J.C., Baden S.B., Sejnowski T.J., and Stiles J.R. (2008). Fast Monte Carlo Simulation Methods for Biological Reaction-Diffusion Systems in Solution and on Surfaces. In SIAM J Sci Comput, pp. 3126. [DOI] [PMC free article] [PubMed] [Google Scholar]
- Li L., Stefan M.I., and Le Novere N. (2012). Calcium input frequency, duration and amplitude differentially modulate the relative activation of calcineurin and CaMKII. PLoS One 7, e43810, 10.1371/journal.pone.0043810. [DOI] [PMC free article] [PubMed] [Google Scholar]
- Lisman J., Schulman H., and Cline H. (2002). The molecular basis of CaMKII function in synaptic and behavioural memory. Nat Rev Neurosci 3, 175–190, [DOI] [PubMed] [Google Scholar]
- Lisman J.E., and Zhabotinsky A.M. (2001). A model of synaptic memory: a CaMKII/PP1 switch that potentiates transmission by organizing an AMPA receptor anchoring assembly. Neuron 31, 191–201., [DOI] [PubMed] [Google Scholar]
- Magee J.C., and Johnston D. (1997). A synaptically controlled, associative signal for Hebbian plasticity in hippocampal neurons. Science 275, 209–213, [DOI] [PubMed] [Google Scholar]
- Mainen Z.F., Joerges J., Huguenard J.R., and Sejnowski T.J. (1995). A model of spike initiation in neocortical pyramidal neurons. Neuron 15, 1427–1439, [DOI] [PubMed] [Google Scholar]
- Markram H., Lübke J., Frotscher M., and Sakmann B. (1997). Regulation of synaptic efficacy by coincidence of postsynaptic APs and EPSPs. Science 275, 213–215, [DOI] [PubMed] [Google Scholar]
- Meyer T., Hanson P.I., Stryer L., and Schulman H. (1992). Calmodulin trapping by calcium-calmodulin dependent protein kinase. Science 256, 1199–1202, [DOI] [PubMed] [Google Scholar]
- Michalski P.J. (2013). The delicate bistability of CaMKII. Biophys J 105, 794–806, 10.1016/j.bpj.2013.06.038. [DOI] [PMC free article] [PubMed] [Google Scholar]
- Michalski P.J. (2014). First demonstration of bistability in CaMKII, a memory-related kinase. Biophys J 106, 1233–1235, 10.1016/j.bpj.2014.01.037. [DOI] [PMC free article] [PubMed] [Google Scholar]
- Miller P., Zhabotinsky A.M., Lisman J.E., and Wang X.J. (2005). The stability of a stochastic CaMKII switch: dependence on the number of enzyme molecules and protein turnover. PLoS Biol 3, e107, 10.1371/journal.pbio.0030107. [DOI] [PMC free article] [PubMed] [Google Scholar]
- Miller S.G., and Kennedy M.B. (1986). Regulation of brain type II Ca2+/calmodulin-dependent protein kinase by autophosphorylation: a Ca2+-triggered molecular switch. Cell 44, 861–870, DOI: 10.1016/0092-8674(86)90008-5. [DOI] [PubMed] [Google Scholar]
- Miller S.G., Patton B.L., and Kennedy M.B. (1988). Sequences of autophosphorylation sites in neuronal type II CaM kinase that control Ca2+-independent activity. Neuron 1, 593–604, [DOI] [PubMed] [Google Scholar]
- Monroe J.D., and Heathcote R.D. (2013). Protein phosphatases regulate the growth of developing neurites. Int J Dev Neurosci 31, 250–257, 10.1016/j.ijdevneu.2013.01.005. [DOI] [PubMed] [Google Scholar]
- Mulkey R.M., Herron C.E., and Malenka R.C. (1993). An essential role for protein phosphatases in hippocampal long-term depression. Science 261, 1051–1055, [DOI] [PubMed] [Google Scholar]
- Mullins C., Fishell G., and Tsien R.W. (2016). Unifying Views of Autism Spectrum Disorders: A Consideration of Autoregulatory Feedback Loops. Neuron 89, 1131–1156, 10.1016/j.neuron.2016.02.017. [DOI] [PMC free article] [PubMed] [Google Scholar]
- Nadkarni S., Bartol T.M., Sejnowski T.J., and Levine H. (2010). Modelling vesicular release at hippocampal synapses. In PLoS Comput Biol, pp. e1000983. [DOI] [PMC free article] [PubMed] [Google Scholar]
- Nadkarni S., Bartol T.M., Stevens C.F., Sejnowski T.J., and Levine H. (2012). Short-term plasticity constrains spatial organization of a hippocampal presynaptic terminal. In Proc Natl Acad Sci U S A, pp. 14657–14662. [DOI] [PMC free article] [PubMed] [Google Scholar]
- Nicoll R.A., and Schulman H. (2023). Synaptic memory and CaMKII. Physiol Rev 103, 2877–2925, 10.1152/physrev.00034.2022. [DOI] [PMC free article] [PubMed] [Google Scholar]
- Opazo P., and Choquet D. (2011). A three-step model for the synaptic recruitment of AMPA receptors. Mol Cell Neurosci 46, 1–8, doi: 10.1016/j.mcn.2010.08.014. [DOI] [PubMed] [Google Scholar]
- Opazo P., Labrecque S., Tigaret C.M., Frouin A., Wiseman P.W., De Koninck P., and Choquet D. (2010). CaMKII triggers the diffusional trapping of surface AMPARs through phosphorylation of stargazin. In Neuron, pp. 239–252. [DOI] [PubMed] [Google Scholar]
- Ordyan M., Bartol T., Kennedy M., Rangamani P., and Sejnowski T. (2020). Interactions between calmodulin and neurogranin govern the dynamics of CaMKII as a leaky integrator. PLoS Comput Biol 16, e1008015, 10.1371/journal.pcbi.1008015. [DOI] [PMC free article] [PubMed] [Google Scholar]
- Ouimet C.C., da Cruz e Silva E.F., and Greengard P. (1995). The alpha and gamma 1 isoforms of protein phosphatase 1 are highly and specifically concentrated in dendritic spines. Proc Natl Acad Sci U S A 92, 3396–3400, 10.1073/pnas.92.8.3396. [DOI] [PMC free article] [PubMed] [Google Scholar]
- Ouimet C.C., Katona I., Allen P., Freund T.F., and Greengard P. (2004). Cellular and subcellular distribution of spinophilin, a PP1 regulatory protein that bundles F-actin in dendritic spines. J Comp Neurol 479, 374–388, 10.1002/cne.20313. [DOI] [PubMed] [Google Scholar]
- Pepke S., Kinzer-Ursem T., Mihalas S., and Kennedy M.B. (2010). A dynamic model of interactions of Ca2+, calmodulin, and catalytic subunits of Ca2+/calmodulin-dependent protein kinase II. PLoS Comput Biol 6, e1000675, doi: 10.1371/journal.pcbi.1000675. [DOI] [PMC free article] [PubMed] [Google Scholar]
- Pharris M.C., Patel N.M., VanDyk T.G., Bartol T.M., Sejnowski T.J., Kennedy M.B., Stefan M.I., and Kinzer-Ursem T.L. (2019). A multi-state model of the CaMKII dodecamer suggests a role for calmodulin in maintenance of autophosphorylation. PLoS Comput Biol 15, e1006941, 10.1371/journal.pcbi.1006941. [DOI] [PMC free article] [PubMed] [Google Scholar]
- Pi H.J., and Lisman J.E. (2008). Coupled phosphatase and kinase switches produce the tristability required for long-term potentiation and long-term depression. J Neurosci 28, 13132–13138, 10.1523/JNEUROSCI.2348-08.2008. [DOI] [PMC free article] [PubMed] [Google Scholar]
- Platholi J., and Hemmings H.C. Jr. (2021). Modulation of dendritic spines by protein phosphatase-1. Adv Pharmacol 90, 117–144, 10.1016/bs.apha.2020.10.001. [DOI] [PMC free article] [PubMed] [Google Scholar]
- Putkey J.A., and Waxham M.N. (1996). A peptide model for calmodulin trapping by calcium/calmodulin-dependent protein kinase II. J Biol Chem 271, 29619–29623, [DOI] [PubMed] [Google Scholar]
- Putney J.W. Jr. (1998). Calcium signaling: up, down, up, down…wha's the point? Science 279, 191–192, 10.1126/science.279.5348.191. [DOI] [PubMed] [Google Scholar]
- Ragusa M.J., Dancheck B., Critton D.A., Nairn A.C., Page R., and Peti W. (2010). Spinophilin directs protein phosphatase 1 specificity by blocking substrate binding sites. Nat Struct Mol Biol 17, 459–464, 10.1038/nsmb.1786. [DOI] [PMC free article] [PubMed] [Google Scholar]
- Rellos P., Pike A.C.W., Niesen F.H., Salah E., Lee W.H., von Delft F., and Knapp S. (2010). Structure of the CaMKIIdelta /Calmodulin Complex Reveals the Molecular Mechanism of CaMKII Kinase Activation. PLoS Biol 8, e1000426, 10.1371/journal.pbio.1000426. [DOI] [PMC free article] [PubMed] [Google Scholar]
- Rosenberg O.S., Deindl S., Sung R.J., Nairn A.C., and Kuriyan J. (2005). Structure of the autoinhibited kinase domain of CaMKII and SAXS analysis of the holoenzyme. Cell 123, 849–860, [DOI] [PubMed] [Google Scholar]
- Sabatini B.L., Oertner T.G., and Svoboda K. (2002). The life cycle of Ca2+ions in dendritic spines. Neuron 33, 439–452, [DOI] [PubMed] [Google Scholar]
- Salter M.W., and Kalia L.V. (2004). Src kinases: a hub for NMDA receptor regulation. Nat Rev Neurosci 5, 317–328, [DOI] [PubMed] [Google Scholar]
- Sandal P., Jong C.J., Merrill R.A., Song J., and Strack S. (2021). Protein phosphatase 2A - structure, function and role in neurodevelopmental disorders. J Cell Sci 134, 10.1242/jcs.248187. [DOI] [PMC free article] [PubMed] [Google Scholar]
- Schworer C.M., Colbran R.J., Keefer J.R., and Soderling T.R. (1988). Ca2+/calmodulin-dependent protein kinase II. Identification of a regulatory autophosphorylation site adjacent to the inhibitory and calmodulin-binding domains. J Biol Chem 263, 13486–13489, [PubMed] [Google Scholar]
- Scolnick E.M. (2017). The Path to New Therapies for Schizophrenia and Bipolar Illness. FASEB J 31, 1254–1259, 10.1096/fj.201700028. [DOI] [PubMed] [Google Scholar]
- Selkoe D.J. (2011). Alzheimer's disease. Cold Spring Harb Perspect Biol 3, 10.1101/cshperspect.a004457. [DOI] [PMC free article] [PubMed] [Google Scholar]
- Shields S.M., Ingebritsen T.S., and Kelly P.T. (1985). Identification of protein phosphatase 1 in synaptic junctions: dephosphorylation of endogenous calmodulin-dependent kinase II and synapse-enriched phosphoproteins. J Neurosci 5, 3414–3422, 10.1523/JNEUROSCI.05-12-03414.1985. [DOI] [PMC free article] [PubMed] [Google Scholar]
- Shifman J.M., Choi M.H., Mihalas M., Mayo S.L., and Kennedy M.B. (2006). Ca2+/Calmodulin-Dependent Protein Kinase II (CaMKII) is Activated by Calmodulin with Two Bound Calciums. Proc Natl Acad Sci USA 103, 13968–13973, doi: 10.1073/pnas.0606433103. [DOI] [PMC free article] [PubMed] [Google Scholar]
- Silva A.J., Paylor R., Wehner J.M., and Tonegawa S. (1992). Impaired spatial learning in α-calcium-calmodulin kinase II mutant mice. Science 257, 206–211, [DOI] [PubMed] [Google Scholar]
- Sjostrom P.J., and Nelson S.B. (2002). Spike timing, calcium signals and synaptic plasticity. Curr Opin Neurobiol 12, 305–314, 10.1016/s0959-4388(02)00325-2. [DOI] [PubMed] [Google Scholar]
- Sneddon M.W., Faeder J.R., and Emonet T. (2011). Efficient modeling, simulation and coarse-graining of biological complexity with NFsim. Nat Methods 8, 177–183, 10.1038/nmeth.1546. [DOI] [PubMed] [Google Scholar]
- Strack S., Barban M.A., Wadzinski B.E., and Colbran R.J. (1997). Differential inactivation of postsynaptic density-associated and soluble Ca2+/calmodulin-dependent protein kinase II by protein phosphatases 1 and 2A. J Neurochem 68, 2119–2128, [DOI] [PubMed] [Google Scholar]
- Strogatz S., H. (2014). Nonlinear Dynamics and Chaos: With Applications To Physics, Biology, Chemistry, and Engineering. Journal of Statistical Physics Vol. 78, [Google Scholar]
- Tapia J.J., Saglam A.S., Czech J., Kuczewski R., Bartol T.M., Sejnowski T.J., and Faeder J.R. (2019). MCell-R: A Particle-Resolution Network-Free Spatial Modeling Framework. Methods Mol Biol 1945, 203–229, 10.1007/978-1-4939-9102-0_9. [DOI] [PMC free article] [PubMed] [Google Scholar]
- Terry-Lorenzo R.T., Elliot E., Weiser D.C., Prickett T.D., Brautigan D.L., and Shenolikar S. (2002). Neurabins recruit protein phosphatase-1 and inhibitor-2 to the actin cytoskeleton. J Biol Chem 277, 46535–46543, 10.1074/jbc.M206960200. [DOI] [PubMed] [Google Scholar]
- Thiel G., Czernik A.J., Gorelick F., Nairn A.C., and Greengard P. (1988). Ca2+/calmodulin-dependent protein kinase II: identification of threonine-286 as the autophosphorylation site in theasubunit associated with the generation of Ca2+-independent activity. Proc Natl Acad Sci USA 85, 6337–6341, [DOI] [PMC free article] [PubMed] [Google Scholar]
- Thomas M.J., Moody T.D., Makhinson M., and O'Dell T.J. (1996). Activity-dependent b-adrenergic modulation of low frequency stimulation induced LTP in the hippocampal CA1 region. Neuron 17, 475–482, [DOI] [PubMed] [Google Scholar]
- Tse J.K., Giannetti A.M., and Bradshaw J.M. (2007). Thermodynamics of calmodulin trapping by Ca2+/calmodulin-dependent protein kinase II: subpicomolar Kd determined using competition titration calorimetry. Biochemistry 46, 4017–4027, 10.1021/bi700013y. [DOI] [PubMed] [Google Scholar]
- Vargas-Caballero M., and Robinson H.P. (2004). Fast and slow voltage-dependent dynamics of magnesium block in the NMDA receptor: the asymmetric trapping block model. J Neurosci 24, 6171–6180, 10.1523/JNEUROSCI.1380-04.2004. [DOI] [PMC free article] [PubMed] [Google Scholar]
- Walkup W.G., Mastro T.L., Schenker L.T., Vielmetter J., Hu R., Iancu A., Reghunathan M., Bannon B.D., and Kennedy M.B. (2016). A model for regulation by SynGAP-alpha1 of binding of synaptic proteins to PDZ-domain 'Slots' in the postsynaptic density. Elife 5, e16813, 10.7554/eLife.16813. [DOI] [PMC free article] [PubMed] [Google Scholar]
- Watanabe T., Huang H.B., Horiuchi A., da Cruze Silva E.F., Hsieh-Wilson L., Allen P.B., Shenolikar S., Greengard P., and Nairn A.C. (2001). Protein phosphatase 1 regulation by inhibitors and targeting subunits. Proc Natl Acad Sci U S A 98, 3080–3085, 10.1073/pnas.051003898. [DOI] [PMC free article] [PubMed] [Google Scholar]
- Watterson D.M., Harrelson W.G. Jr., Keller P.M., Sharief F., and Vanaman T.C. (1976). Structural similarities between the Ca2+-dependent regulatory proteins of 3':5'-cyclic nucleotide phosphodiesterase and actomyosin ATPase. J Biol Chem 251, 4501–4513, [PubMed] [Google Scholar]
- Zhabotinsky A.M. (2000). Bistability in the Ca(2+)/calmodulin-dependent protein kinase-phosphatase system. Biophys J 79, 2211–2221, 10.1016/S0006-3495(00)76469-1. [DOI] [PMC free article] [PubMed] [Google Scholar]
Associated Data
This section collects any data citations, data availability statements, or supplementary materials included in this article.