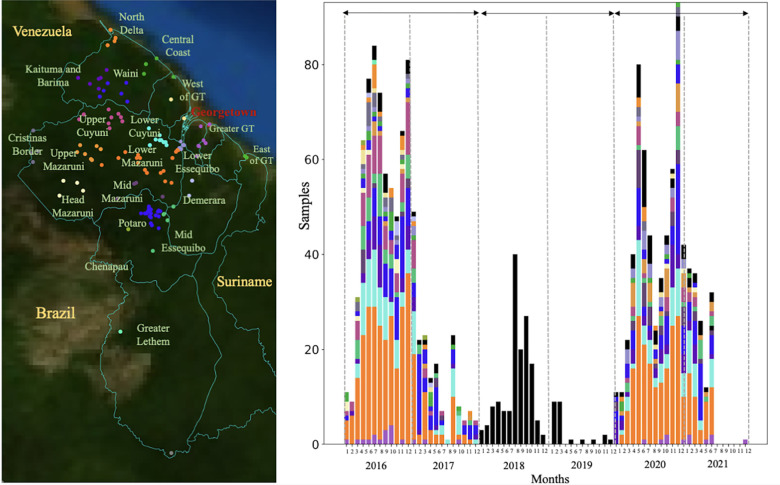
Figure 1.
Spatial and temporal distribution of Plasmodium falciparum samples in Guyana. a) Spatial clusters (n=20) delimited using an informed approach following access using roads and rivers. b) temporal distribution of samples (n=1,409) colored by patient travel history. Three sampling periods could be observed 2016/2017 (n=773), 2018/2019 where samples were collected as part of a therapeutic efficacy study (TES) (n=174) with no information on patient travel history, and 2020/2021 (n=531).

