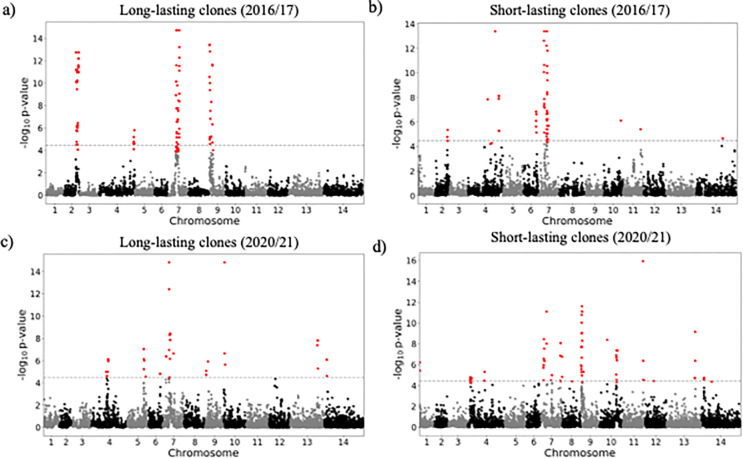
Figure 6.
Selection signals from isoRelate in long-lasting clones (sampled over three months) and short-lived clones sampled over two study periods (a-b) 2016/2017 and (c-d) 2020/2021. Dashed lines represent the threshold for the different selection signals investigated using a false discovery rate of 0.01.

