Abstract
The purpose of this research project was to evaluate the use of 3-dimensional (3-D) super-resolution ultrasound (SR-US) imaging to assess any early changes in breast cancer after treatment with a vascular-disrupting agent (VDA). A Vevo 3100 ultrasound system (FUJIFILM VisualSonics Inc) equipped with an MX 201 transducer was used for image acquisition. A total of 2.5 × 10⁷ microbubbles (MBs) were injected into the tail vein of anesthetized breast cancer-bearing mice using repeat bolus injections every 5 min. A total of 10 stacks of ultrasound images were collected as the transducer was mechanically moved across the tumor at 0.6 mm intervals yielding a 6-mm thick volume. At each tumor location, a stack contained 1 × 10⁴ frames of ultrasound data that were acquired at 463 frames/sec and stored as in-phase/quadrature (IQ) format. After motion correction, each temporal stack of ultrasound images was processed separately for clutter signal removal, which was followed by MB localization and enumeration before generation of the final SR-US image. After reconstruction of the 3-D SR-US volume dataset, the tumor microvasculature was enhanced using a multiscale vessel enhancement filter. Vessels from the resultant microvascular network were then segmented using an adaptive thresholding method. Finally, mean microvascular density (MVD) measurements from each tumor volume were computed as a summarizing statistic. While no differences were found between baseline SR-US image-derived measures of MVD (p = 0.76), these same measurements were significantly lower at 24 h after VDA treatment (p < 0.001). Overall, 3-D SR-US imaging detected early tumor changes following treatment with a vascular-targeted drug.
Keywords: angiogenesis, breast cancer, microbubble contrast agents, super-resolution ultrasound, ultrasound imaging
I. INTRODUCTION
Breast cancer is a common disease found in women (30% of new cases) and has the second highest annual mortality rate (14% of cancer deaths) [1]. Monitoring response to treatment is a key element in the management of breast cancer. Treatments using a small molecule vascular disrupting agent (VDA) function by selectively attacking both endothelial cells and pericytes to stop neovascular formations and to disable already established angiogenic networks, respectively [2]. These VDAs cause an acute and pronounced shutdown of blood vessels resulting in an almost complete stop of blood flow, ultimately leading to selective tumor necrosis [3]. A collection of promising preclinical studies has prompted various clinical trials in human subjects [4]–[6].
Dynamic contrast-enhanced ultrasound (DCE-US) is a noninvasive imaging modality that allows the analysis of tissue microvascular networks like tumor angiogenesis [7]. Early response to various anticancer drug treatments can be detected using the hallmark features of tissue microvascular structures depicted in DCE-US images [8]–[11]. An issue with the use of any traditional ultrasound imaging strategy is that the diffraction limit impedes accurate visualization of blood vessels that have sizes on the micrometer scale. While one can increase the frequency of the ultrasound transmit pulses, the tradeoff for improved spatial resolution is decreased penetration depth. Notwithstanding, with the recent development of super-resolution ultrasound (SR-US) imaging techniques, it is now possible to discern individual tumor microvascular structures of size below the diffraction limit and at tissue depth [12]. In practice after administration of an intravascular microbubble (MB) contrast agent, a lengthy series of DCE-US images are acquired. After spatiotemporal filtering to remove any background tissue signal, individual MBs are localized and enumerated to form the final SR-US image [13], [14]. This process can be repeated at multiple closely spaced tissue cross-sections to generate a 3-dimensional (3-D) SR-US map to depict microvascular networks in volume space [15].
The tumor microenvironment is known to be very heterogeneous. This cancer heterogeneity is suspected to play a major role in the differing spatial tissue response to systemic treatment and development of any drug resistance [16]. Therefore, use of a cross-sectional imaging mode such as ultrasound to assess tumor response to treatment may give a faulty assessment of patient prognosis. Follow-up repeat measurements after treatment initiation are also problematic as the same tissue cross-section is rarely found if ever. Collectively, these issues and concerns highlight the prospect of 3-D SR-US for assessing tumor response to microvascular-targeted treatments alone or in combination with other chemotherapeutic drugs. To that end, the objective of the present study was to investigate the use of 3-D SR-US imaging of breast cancer-bearing mice for assessing response to a VDA treatment regimen.
II. MATERIALS AND METHODS
All studies were approved by the Institutional Animal Care and Use Committee (IACUC) at the University of Texas at Dallas. Breast cancer cells derived from the mammary gland tissue of a mouse (4T1, ATCC, Manassas, VA) were cultured in RPMI 1640 medium supplemented with 10% fetal bovine serum while incubated at 37°C in a humidified 5% CO2 atmosphere. Female BALB/C mice (N = 6; Charles river Laboratories, Wilmington, MA) were anesthetized by 1 to 2% isoflurane inhalation. Cancer cells (2×10⁵) in 20 μL of PBS solution mixed with Matrigel (Corning Life Sciences, Corning, NY) were injected into the left lower mammary fat pad. Experiments were started after tumors had grown to 6 mm in size (approximately 14 d). DCE-US imaging was performed using a Vevo 3100 scanner (FUJIFILM VisualSonics Inc, Toronto, Canada) equipped with a MX201 linear array transducer operating at a central frequency of 15 MHz. Grayscale ultrasound imaging was performed at baseline and 24 h after injection with saline (control) or VDA drug treatment (combretastatin A-4 phosphate, CA4P). Tumor tissue was imaged by collecting cross-sectional US images from 10 closely spaced (0.6 mm) locations as controlled by a mechanical positioning system. In-phase/quadrature (IQ) data (1 × 10⁴ frames) was acquired at 464 frames per sec for each spatial location.
Injections of Lycopersicon esculentum agglutinin (tomato lectin) labeled with Texas red (Vector Laboratories, Burlingame, CA) were made intravascularly through the tail vein. Animals were then euthanized and excised tumor tissue samples were fixed in formalin and cut for 10 μm sections. Whole tissue cross-sections were optically scanned and digitized at 20x magnification (Axio Observer 7, Carl Zeiss Microscopy, White Plains, NY).
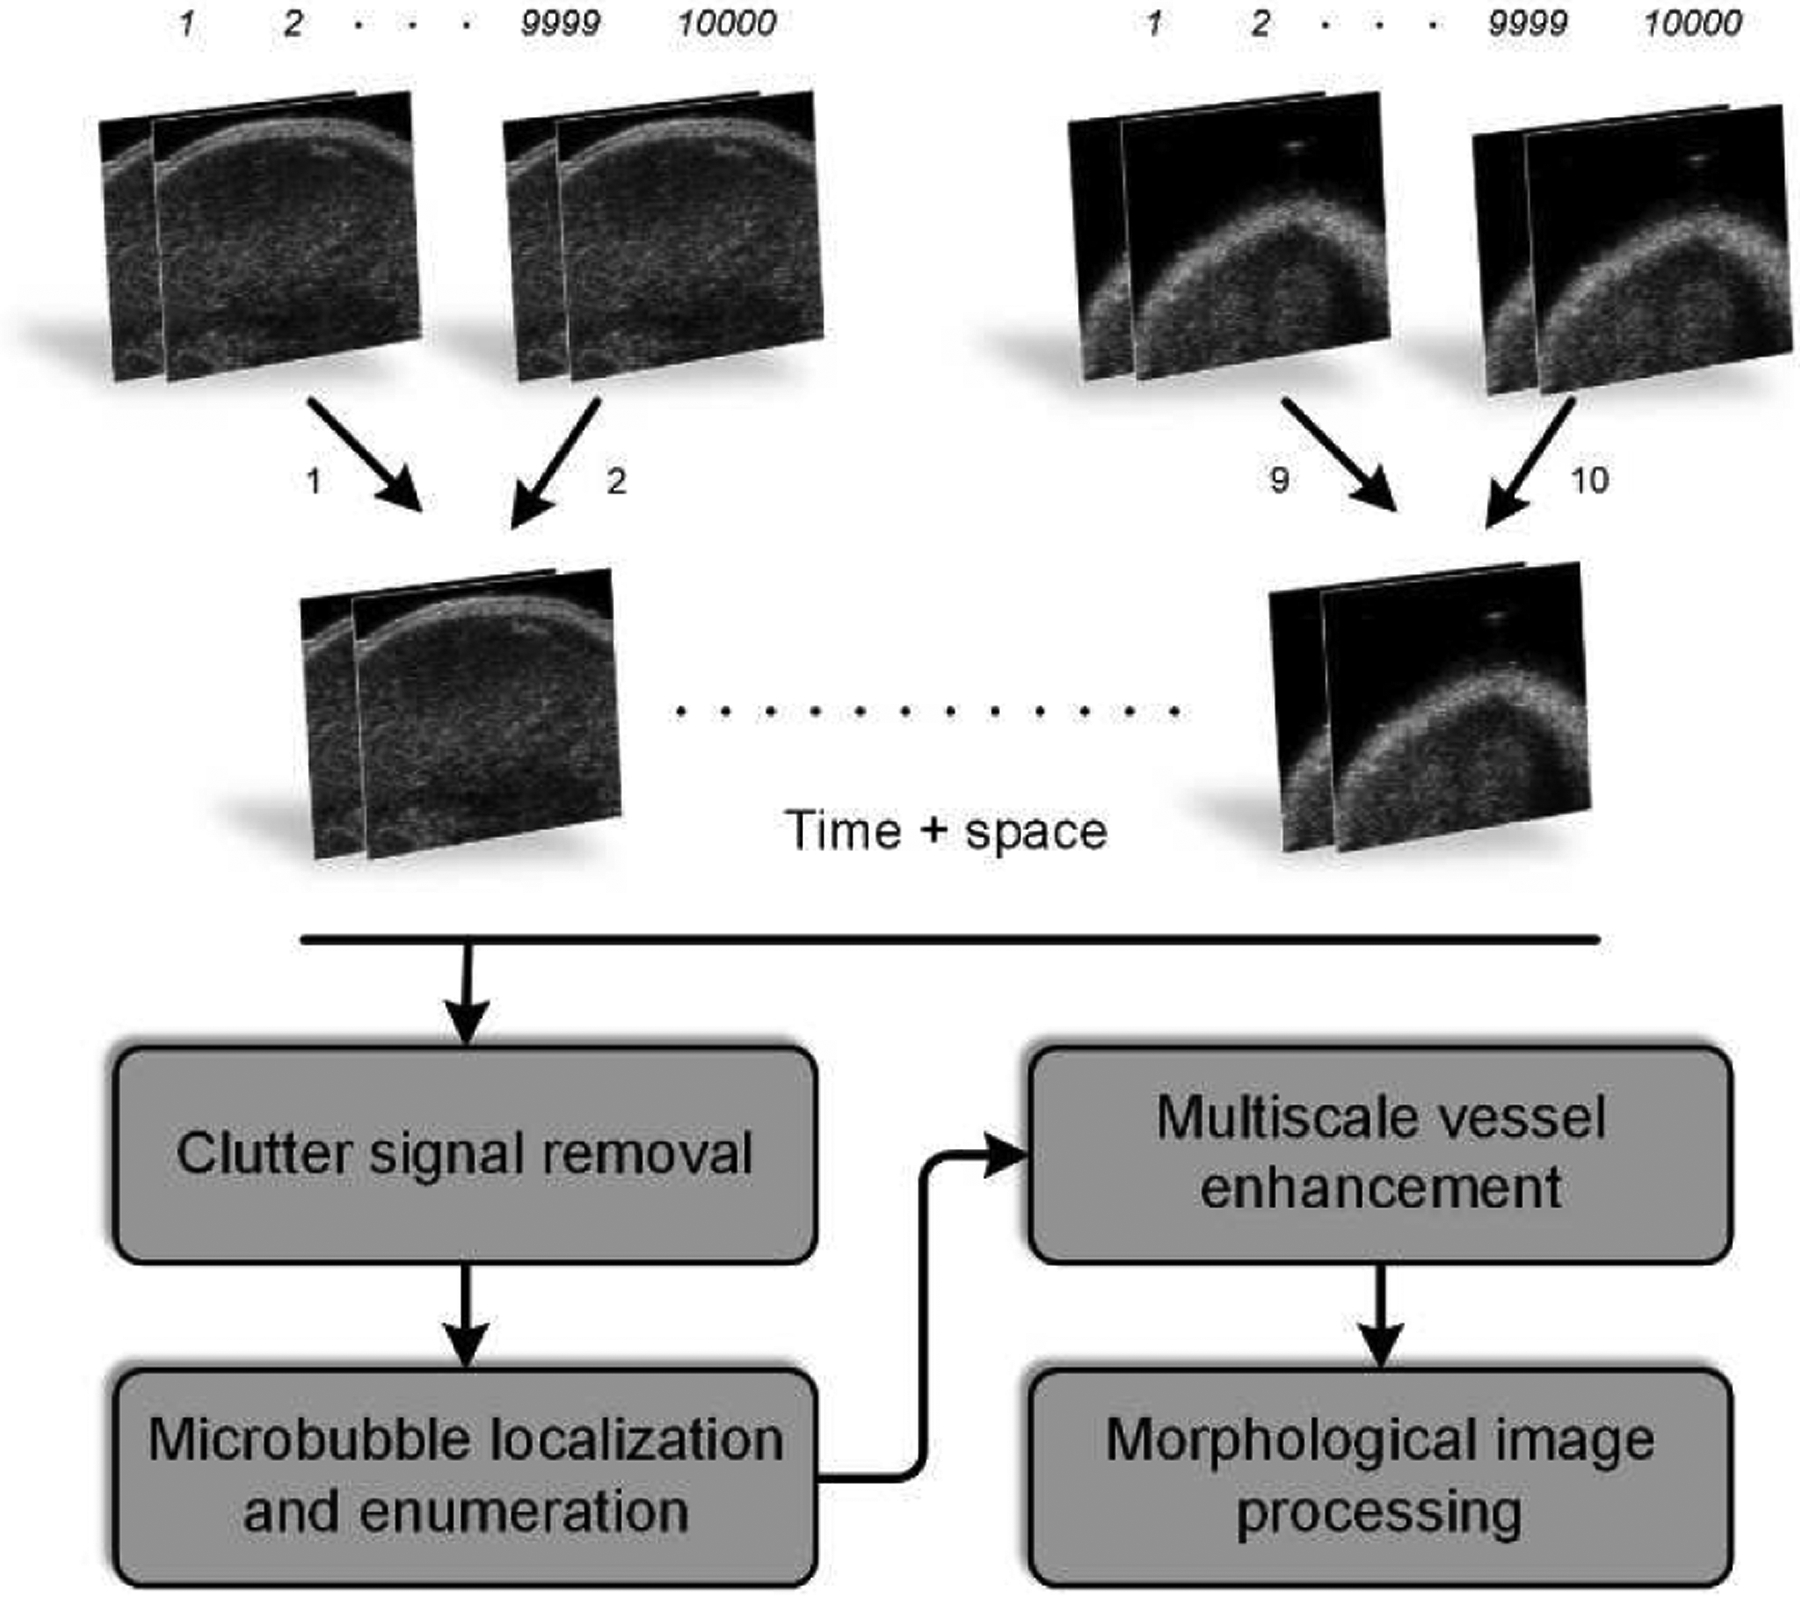
As summarized in Figure 1, custom MATLAB software (MathWorks Inc, Natick, MA) was implemented for all DCE-US image processing steps [15]. Briefly, spatially co-registered IQ frames were motion-corrected using a multistage motion correction strategy [17], [18]. Next, a singular value filter (SVF) was applied to each DCE-US imaging plane [19]. This helped remove any stationary speckle (tissue) from the MB signals. Individual MBs were then localized and counted from each of the DCE-US frames to form a SR-US map at each tumor spatial location. These SR-US images were then used to reconstruct a 3-D volume before applying a multiscale vessel enhancement filter [20]. This filter improved the tubular structures in 3-D space before segmentation. After applying a maximum intensity projection (MIP) to each 3D SR-US image volume, a binary version was created by an adaptive thresholding algorithm and a microvessel density (MVD) metric was computed as a ratio of the vascular voxels in the tumor region-of-interest (ROI) to the voxel count of the entire tumor space.
Fig. 1.

Flowchart diagramming the dynamic contrast-enhanced ultrasound (DCE-US) image acquisition and processing procedure that was used to generate 3-dimensional (3-D) super-resolution ultrasound (SR-US) maps.
III. RESULTS AND DISCUSSION
3-D SR-US maps derived from sequences of DCE-US images has considerable potential for monitoring early therapy response. Previous research on 3-D SR-US imaging using acoustic angiography demonstrated that SR-US increases the ability to differentiate normal from tumor tissue [21]. Similarly, in this present work, SR-US image derived from volumetric DCE-US data in a preclinical setup improves the information content about tumor angiogenic networks compared to any 2-D ultrasound imaging cross-section alone. The use of motion correction improved image alignment (determined by increased correlation coefficient values) and microvascular visualization.
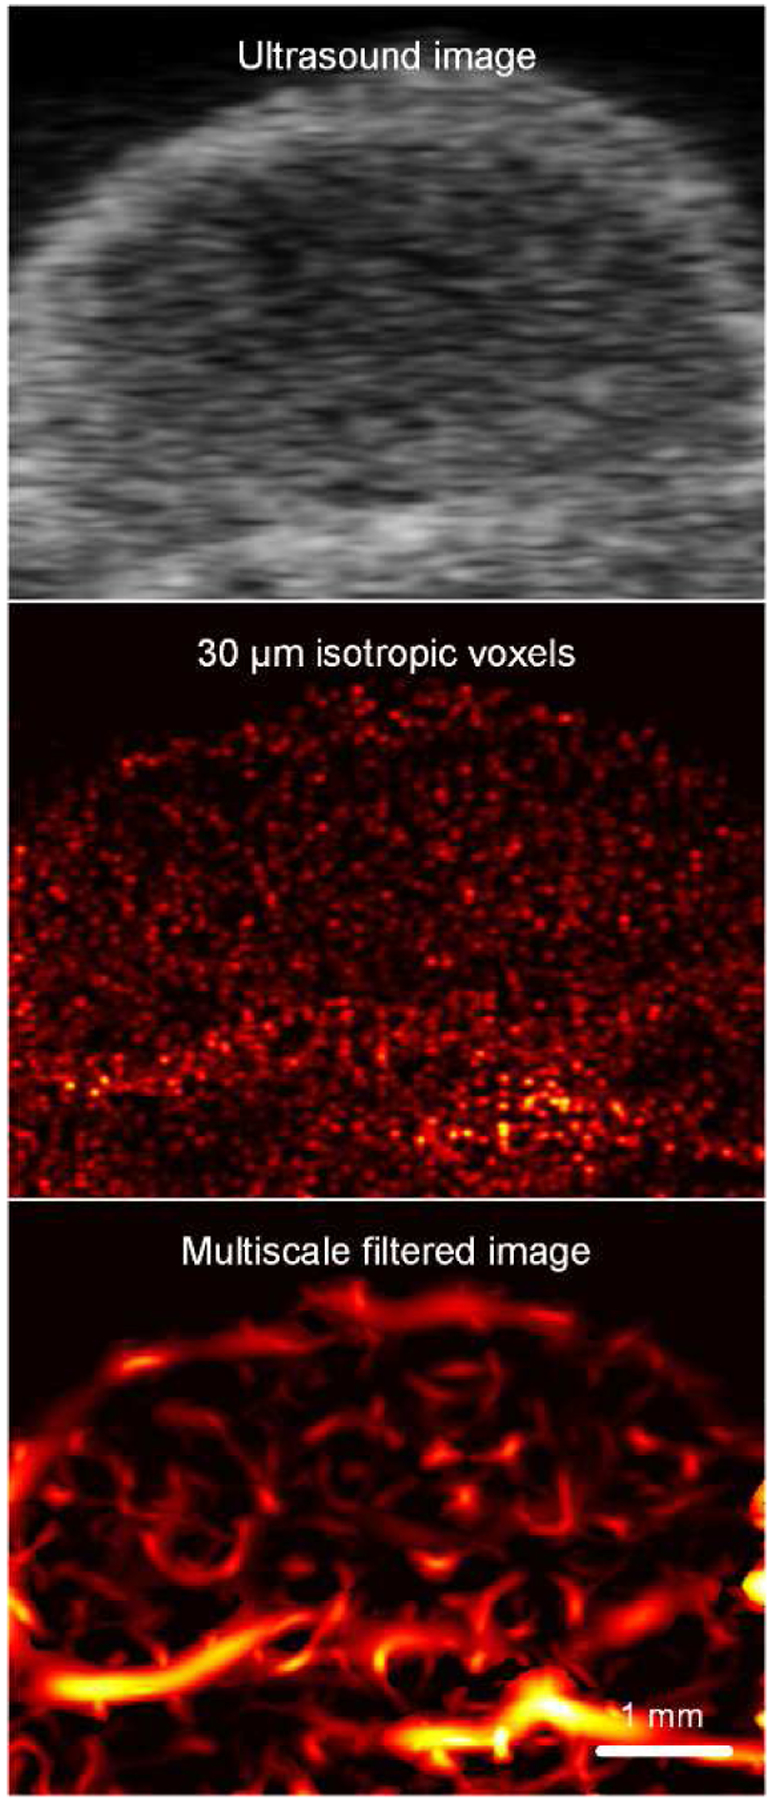
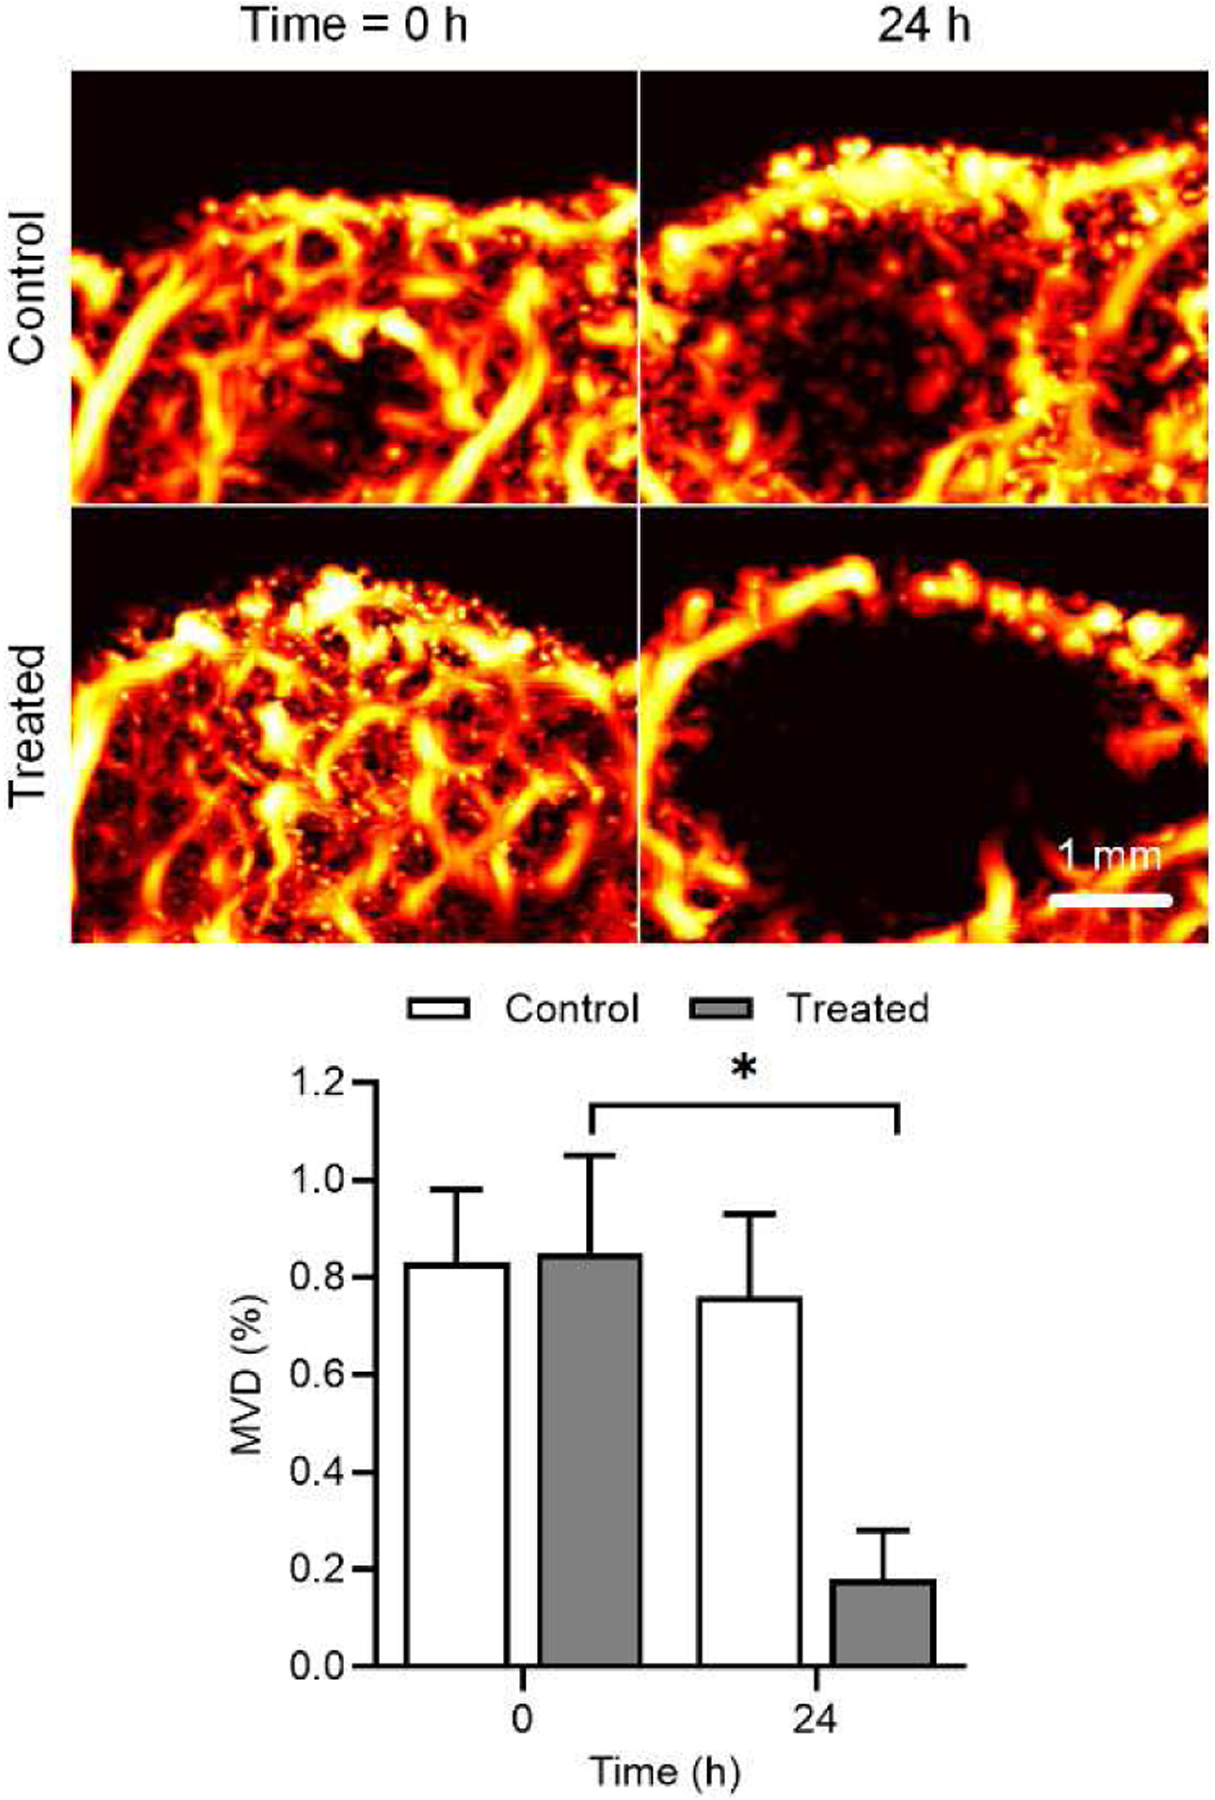
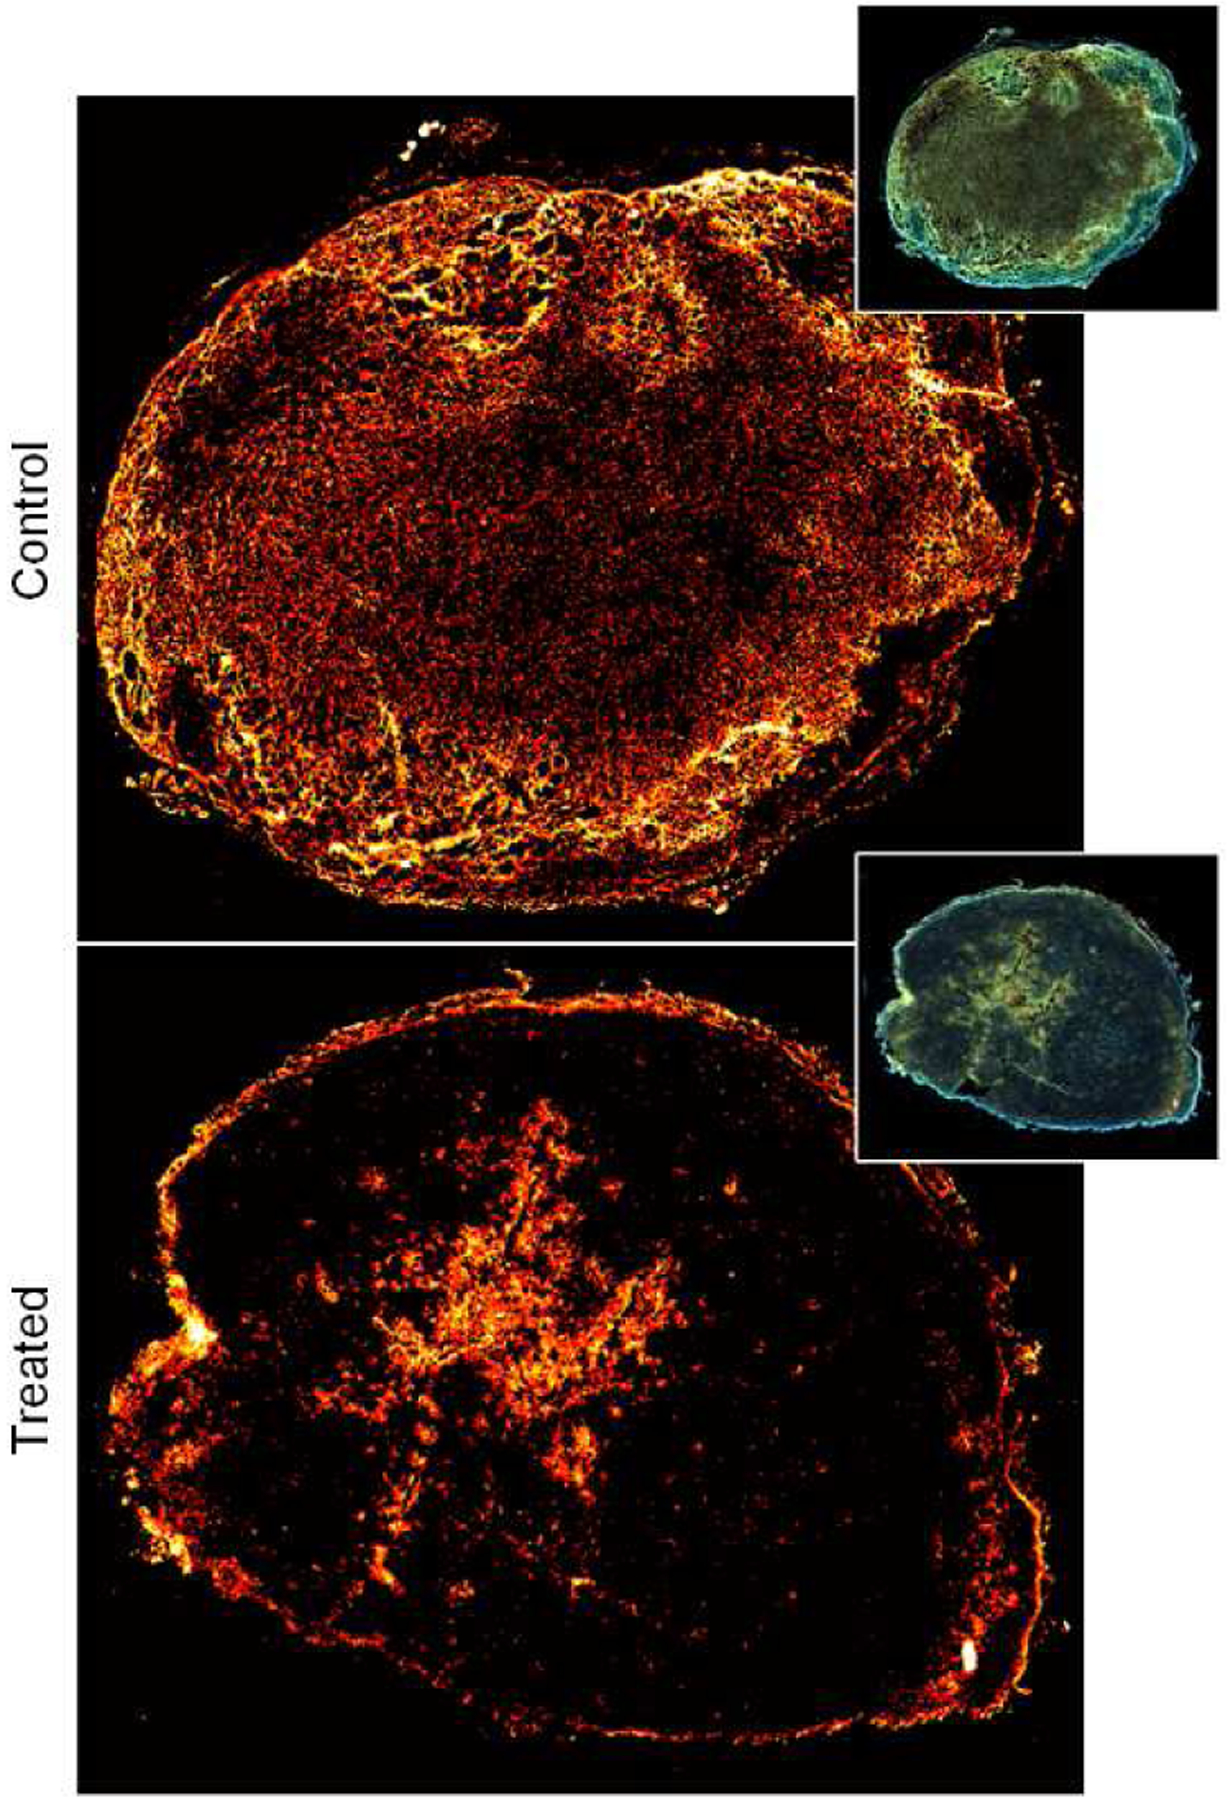
Figure 2 illustrates differences between a grayscale ultrasound image and cross-sectional SR-US images after isotropic voxel volume reconstruction (also known as scan conversion) and multiscale vessel enhancement processing. First, we observe an increased spatial resolution and that microvascular details are enhanced. Figure 3 depicts a set of ultrasound images from breast cancer-bearing mice administered control or a VDA drug. While there were no discernible differences from SR-US image-derived MVD measures at baseline (p = 0.76), the effect of CA4P is clearly visible 24 h after drug dosing in the treated animal. More specifically, the tumor core was necrotic and nearly depleted of all microvascular structures. Compared to controls, MVD measurements were reduced by 76.2% at 24 h after VDA treatment and significantly lower than baseline data (p < 0.001), which was consistent with previous studies using vascular-targeted drugs [22], [23]. Inspection of representative histology images presented in Figure 4 detail microvascular patterns in control and VDA-treated tumors. Overall, it was observed that control tumors had a dense microvascular network particularly around the tumor periphery. Conversely, tumors treated with the VDA drug were considerably devoid of patent blood vessels, which was consistent with the in vivo SR-US images.
Fig. 2.

Matched grayscale ultrasound images before and after scan conversion and use of multiscale vessel enhancement processing applied to SR-US images to improve visualization of the tumor microvascular network.
Fig. 3.

Representative maximum intensity projection (MIP) map from a spatial sequence of SR-US images acquired from breast cancer-bearing mice (top). From control and treated animals, SR-US image-derived microvessel density (MVD) values were summarized and revealed a significant reduction in the group given the vascular-disrupting agent (bottom).
Fig. 4.

Representative patterns of tomato lectin labeling and visualization of microvascular structures in control (top) or treated (bottom) tumor tissue sections. Note the lack of patent (open) blood vessels in the tumor treated with a vascular-disrupting agent.
The ultrasound imaging protocol for this study provided a sufficient number of image frames for MB event detection and SR-US image reconstruction in 3-D space. While more ultrasound images could have been acquired, that would have required the administration of more MBs and prolonged image acquisition and data saving time. The goal here was to minimize both to an acceptable point. We could realistically expect that more ultrasound frames would increase the volume resolution. Notwithstanding, 1 × 10⁴ ultrasound frames per tissue cross-section were sufficient for SR-US imaging and visualization of the tumor microvascular network in volume space.
Tissue clutter filtering is a key component of the SR-US image reconstruction procedure. Using an SVF method with a smaller data kernel instead of the entire image frame helped with computer memory consumption during tissue signal filtering [19]. This approach is also advantageous because it incorporates both local and global spatiotemporal information about the stationary tissue artifact and MB signals. Given a substantial computational burden associated with 3-D SR-US image processing, the use of machine learning algorithms promise to considerably accelerate the MB localization and enumeration procedure steps [24], [25]. Such improvements in computation time would free up resources that could otherwise be used for more advanced SR-US image processing like MB tracking and calculation of true blood velocity in volume space [26]. While not explored in the present study, 3-D SR-US volumes could also be processed further with different morphological image analysis methods like skeletonization to create a simplified version of the tumor microvascular network [15]. This would introduce a more quantitative analysis of these microvascular structures and could help reporting of repeat measurements like during the early assessment of tumor response to therapy.
IV. CONCLUSIONS
A spatial sequence of DCE-US images can be processed to generate a SR-US volume dataset. In breast cancer-bearing animals, 3-D SR-US imaging was able to visualize the entire tumor burden and supporting microvascular network. Furthermore, SR-US imaging was shown to be a useful tool for detecting an early tumor response to VDA treatment.
ACKNOWLEDGEMENTS
This research was supported in part by National Institutes of Health (NIH) grant R01EB025841 and award RP180670 from the Cancer Prevention and Research Institute of Texas (CPRIT) to establish the Small Animal Imaging Facility at the University of Texas at Dallas. The authors acknowledge the Texas Advanced Computing Center (TACC) at the University of Texas at Austin for providing computational resources that have contributed to the research results reported in this paper.
REFERENCES
- [1].Siegel RL, Miller KD, Fuchs HE, and Jemal A, “Cancer statistics, 2021,” CA Cancer J Clin, vol. 71, no. 1, pp. 7–33, 2021. [DOI] [PubMed] [Google Scholar]
- [2].Siemann DW and Shi W, “Efficacy of combined antiangiogenic and vascular disrupting agents in treatment of solid tumors,” Int J Radiat Oncol Biol Phys, vol. 60, no. 4, pp. 1233–1240, 2004. [DOI] [PubMed] [Google Scholar]
- [3].McKeage MJ and Baguley BC, “Disrupting established tumor blood vessels: An emerging therapeutic strategy for cancer,” Cancer, vol. 116, no. 8, pp. 1859–1871, 2010. [DOI] [PubMed] [Google Scholar]
- [4].Hinnen P and Eskens F. a. L. M., “Vascular disrupting agents in clinical development,” Br J Cancer, vol. 96, no. 8, pp. 1159–1165, 2007. [DOI] [PMC free article] [PubMed] [Google Scholar]
- [5].McKeage MJ, “Clinical trials of vascular disrupting agents in advanced non-small-cell lung cancer,” Clin Lung Cancer, vol. 12, no. 3, pp. 143–147, 2011. [DOI] [PubMed] [Google Scholar]
- [6].Smolarczyk R, Czapla J, Jarosz-Biej M, Czerwinski K, and Cichoń T, “Vascular disrupting agents in cancer therapy,” Eur J Pharmacol, vol. 891, p. 173692, 2021. [DOI] [PubMed] [Google Scholar]
- [7].Saini R and Hoyt K, “Recent developments in dynamic contrast-enhanced ultrasound imaging of tumor angiogenesis,” Imaging Med, vol. 6, no. 1, pp. 41–52, 2014. [DOI] [PMC free article] [PubMed] [Google Scholar]
- [8].Hoyt K, Sorace A, and Saini R, “Quantitative mapping of tumor vascularity using volumetric contrast-enhanced ultrasound,” Invest Radiol, vol. 47, no. 3, pp. 167–174, 2012. [DOI] [PMC free article] [PubMed] [Google Scholar]
- [9].Hoyt K, Sorace A, and Saini R, “Volumetric contrast-enhanced ultrasound imaging to assess early response to apoptosis-inducing anti-death receptor 5 antibody therapy in a breast cancer animal model,” J Ultrasound Med, vol. 31, no. 11, pp. 1759–1766, 2012. [DOI] [PMC free article] [PubMed] [Google Scholar]
- [10].Hoyt K, Umphrey H, Lockhart M, Robbin M, and Forero-Torres A, “Ultrasound imaging of breast tumor perfusion and neovascular morphology,” Ultrasound Med Biol, vol. 41, no. 9, pp. 2292–2302, 2015. [DOI] [PMC free article] [PubMed] [Google Scholar]
- [11].Hoyt K et al. , “Determination of breast cancer response to bevacizumab therapy using contrast-enhanced ultrasound and artificial neural networks,” J Ultrasound Med, vol. 29, no. 4, pp. 577–585, 2010. [DOI] [PMC free article] [PubMed] [Google Scholar]
- [12].Errico C et al. , “Ultrafast ultrasound localization microscopy for deep super-resolution vascular imaging,” Nature, vol. 527, no. 7579, p. 499, 2015. [DOI] [PubMed] [Google Scholar]
- [13].Ghosh D, Xiong F, Sirsi SR, Shaul PW, Mattrey RF, and Hoyt K, “Toward optimization of in vivo super-resolution ultrasound imaging using size-selected microbubble contrast agents,” Med Phys, vol. 44, no. 12, pp. 6304–6313, 2017. [DOI] [PMC free article] [PubMed] [Google Scholar]
- [14].Ghosh D et al. , “Super-resolution ultrasound imaging of skeletal muscle microvascular dysfunction in an animal model of type 2 diabetes,” J Ultrasound Med, vol. 38, no. 5, pp. 2589–2599, 2019. [DOI] [PMC free article] [PubMed] [Google Scholar]
- [15].Özdemir İ, Johnson K, Mohr-Allen S, Peak KE, Varner V, and Hoyt K, “Three-dimensional visualization and improved quantification with super-resolution ultrasound imaging - Validation framework for analysis of microvascular morphology using a chicken embryo model,” Phys Med Biol, vol. 66, no. 8, p. 085008, 2021. [DOI] [PMC free article] [PubMed] [Google Scholar]
- [16].Vasan N, Baselga J, and Hyman DM, “A view on drug resistance in cancer,” Nature, vol. 575, no. 7782, pp. 299–309, 2019. [DOI] [PMC free article] [PubMed] [Google Scholar]
- [17].Oezdemir I, Shaw C, Eisenbrey JR, and Hoyt K, “Improved quantitative contrast-enhanced ultrasound imaging of hepatocellular carcinoma response to transarterial chemoembolization,” Proc IEEE Int Symp Biomedical Imaging, vol. 1, pp. 1737–1740, 2019. [DOI] [PMC free article] [PubMed] [Google Scholar]
- [18].Oezdemir I, Wessner CE, Shaw CM, Eisenbrey JR, and Hoyt K, “Faster motion correction of clinical contrast-enhanced ultrasound imaging using deep learning,” Proc IEEE Ultrason Symp, pp. 1–4, 2020. [Google Scholar]
- [19].Mauldin FW, Lin D, and Hossack JA, “A singular value filter for rejection of stationary artifact in medical ultrasound,” Proc IEEE Ultrason Symp, pp. 359–362, 2010. [Google Scholar]
- [20].Frangi AF, Niessen WJ, Vincken KL, and Viergever MA, “Multiscale vessel enhancement filtering,” MICCAI, pp. 130–137, 1998. [Google Scholar]
- [21].Lin F, Shelton SE, Espíndola D, Rojas JD, Pinton G, and Dayton PA, “3-D ultrasound localization microscopy for identifying microvascular morphology features of tumor angiogenesis at a resolution beyond the diffraction limit of conventional ultrasound,” Theranostics, vol. 7, no. 1, pp. 196–204, 2017. [DOI] [PMC free article] [PubMed] [Google Scholar]
- [22].Abma E et al. , “Power Doppler ultrasound and contrast-enhanced ultrasound demonstrate non-invasive tumour vascular response to anti-vascular therapy in canine cancer patients,” Sci Rep, vol. 9, no. 1, p. 9262, 2019. [DOI] [PMC free article] [PubMed] [Google Scholar]
- [23].Maguire CJ et al. , “Synthesis of dihydronaphthalene analogues inspired by combretastatin A-4 and their biological evaluation as anticancer agents,” Medchemcomm, vol. 9, no. 10, pp. 1649–1662, 2018. [DOI] [PMC free article] [PubMed] [Google Scholar]
- [24].Brown KG, Ghosh D, and Hoyt K, “Deep learning of spatiotemporal filtering for fast super-resolution ultrasound imaging,” IEEE Trans Ultrason Ferroelectr Freq Control, vol. 67, no. 9, pp. 1820–1829, 2020. [DOI] [PMC free article] [PubMed] [Google Scholar]
- [25].Brown K, Waggener SC, Redfern AD, and Hoyt K, “Deep learning implementation of super-resolution ultrasound imaging for tissue decluttering and contrast agent localization,” Proc IEEE Ultrason Symp, pp. 1–4, 2020. [DOI] [PMC free article] [PubMed] [Google Scholar]
- [26].Johnson K, Oezdemir I, and Hoyt K, “Three-dimensional evaluation of microvascular networks using contrast-enhanced ultrasound and microbubble tracking,” Proc IEEE Ultrason Symp, pp. 1–3, 2020. [DOI] [PMC free article] [PubMed] [Google Scholar]


