Abstract
Purpose:
After epicardial cardiac implantable electronic devices (CIEDs) are implanted in pediatric patients, they become ineligible to receive MRI exams due to an elevated risk of RF heating. We investigated if simple modifications in the trajectories of epicardial leads could substantially and reliably reduce RF heating during MRI at 1.5 T, with benefits extending to abandoned leads.
Methods:
Electromagnetic simulations were performed to assess RF heating of two common 35-cm epicardial lead trajectories exhibiting different degrees of coupling with MRI incident electric fields. Experiments in anthropomorphic phantoms implanted with commercial CIEDs confirmed the findings. Both electromagnetic simulations and experimental measurements were performed using head-first and feet-first positioning and various landmarks. Transfer function approach was used to assess the performance of suggested modifications in realistic body models.
Results:
Simulations (head-first, chest landmark) of a 35-cm epicardial lead with a trajectory where the excess length of the lead was looped and placed on the inferior surface of the heart showed an 87-fold reduction in the 0.1g-averaged SAR compared to the lead where the excess length was looped on the anterior surface. Repeated experiments with a commercial epicardial device confirmed this. For fully implanted systems following low-SAR trajectories there was a 16-fold reduction in the average temperature rise; and a 28-fold reduction for abandoned leads. The transfer function method predicted a 7-fold reduction in the RF heating in 336 realistic scenarios.
Conclusion:
Surgical modification of epicardial lead trajectory can substantially reduce RF heating at 1.5 T, with benefits extending to abandoned leads.
Keywords: Cardiovascular implantable electronic devices (CIEDs), epicardial leads, RF heating, safety
Introduction
Congenital heart defects (CHD) are the most common birth defect in the United States, affecting 1 in every 100 babies born yearly (1). Infants and children with CHD may require cardiac implantable electronic devices (CIEDs) such as pacemakers and implantable cardioverter-defibrillators, some receiving an implant within hours, or even minutes, from birth (2). The optimal approach to affixing a CIED to the heart of a young patient is to open the chest and surgically suture the cardiac lead to the myocardium (“epicardial leads”), as opposed to passing it through veins and affixing it to the inside of the heart (“endocardial leads”). Unfortunately, once epicardial leads have been implanted, patients face restrictions against MRI exams due to the elevated risk of radiofrequency (RF) heating of epicardial leads (3–5). MR-conditional CIEDs with endocardial leads have been approved by the FDA for adults, allowing patients to receive MRIs under conditions that assure safety. However, no MR-conditional system is currently available for children where epicardial leads are used more frequently than in adults (5). This leaves the most vulnerable patient population unable to receive the same standard of care as adults. In addition, children with CHD often require complex decision-making and would derive particular benefits from MRI’s sensitivity.
Advances in medical device technology have greatly mitigated the risks associated with static and gradient fields. This includes, for example, the reduction of ferromagnetic material to reduce the risk of device dislodgement due to static magnetic fields (6) and enhanced device programming to reduce the risk of cardiac stimulation from MRI-induced gradient currents (7). RF-induced heating, on the other hand, remains a safety issue. The main concern is the “antenna effect”, a phenomenon in which the electric field of the transmit RF couples with implanted leads and amplifies the specific absorption rate (SAR) of the radiofrequency energy in the tissue surrounding the lead’s tip (8,9). The strength of this coupling depends, among other factors, on the relative orientation of the lead with respect to the transmit electric field, . As such, the trajectory of an implanted lead substantially affects its MR-induced RF heating (10–15). This has important ramifications for patient safety as surgical guidelines are silent about how to position the excessive length of implanted leads within the body. Consequently, surgeons place the leads based on personal experience and surgical convenience, causing a substantial patient-to-patient variation in the trajectory of the lead and, by proxy, large variations in MR-induced RF heating.
Recent studies in patients with deep brain stimulation (DBS) devices have shown that modification of lead trajectory can substantially reduce MRI-induced RF heating (10,12,16). Specifically, it was shown that introducing loops in the extracranial trajectory of a DBS lead reduced local SAR at the lead tips during MRI at 1.5 T and 3 T and that the degree of the reduction in SAR depended on the location of the loop on the skull (12,16,17). Here we investigated if the concept of lead trajectory modification could be extended to reduce RF heating of epicardial leads in pediatric CIED patients, that is, if specific epicardial lead trajectories are more favorable in terms of MRI safety. To do this, we first performed electromagnetic simulations to identify lead trajectories that exhibited reduced coupling with the incident at 1.5 T. We then quantified the RF power deposition in the tissue surrounding tips of simplified lead models routed along low- and high-coupling trajectories and verified our findings experimentally in a multi-material anthropomorphic pediatric phantom implanted with a commercial epicardial CIED with a 35-cm lead. Finally, we performed a sensitivity analysis to assess the effect of perturbations in lead trajectories and body characteristics, and examined whether safety gains due to trajectory modification would translate to abandoned epicardial leads.
Our work is the first to suggest that an easy-to-implement surgical modifications can substantially and reliably reduce RF heating of epicardial leads in children. The results, however, are only valid for the specific lead model and the MRI platform examined herein and should not be generalized without further investigations.
Theoretical framework
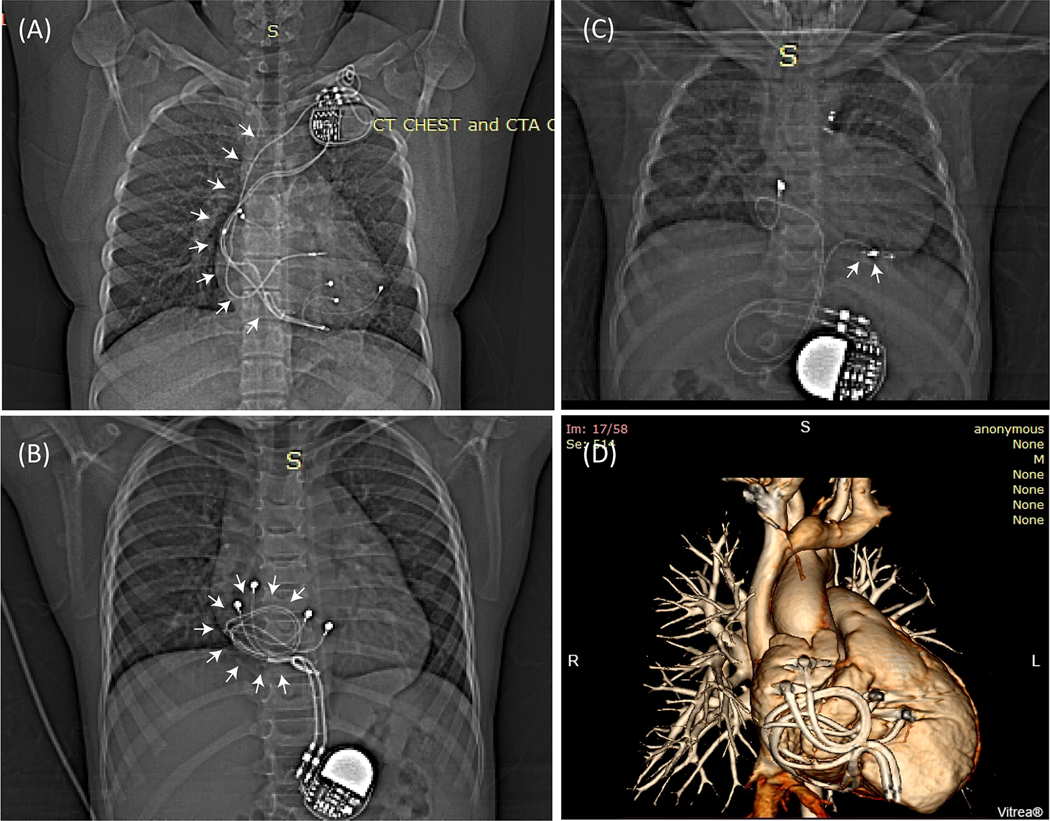
Two types of CIED leads are commonly used in clinical practice depending on the patient’s anatomy and body size: Adults and older children typically receive endocardial systems, where the leads are passed through the subclavian vein to reach the interior of the heart, with the implantable pulse generator (IPG) placed in the left or right subpectoral pocket (Figure 1 A). Infants and young children (who have small veins) mostly receive an epicardial system, which requires sternotomy to sew the cardiac lead directly to the myocardium with the IPG placed deep to the rectus abdominus muscle (Figure 1B). Because venous anatomy is relatively similar among the population, the trajectory of endocardial leads is not highly variable from patient to patient. In contrast, there is a much larger degree of freedom in placing epicardial leads, causing a substantial patient-to-patient variation in epicardial lead trajectories. As the magnitude and phase of the tangential component of MRI incident electric field along a lead’s trajectory are shown to be indicators of lead’s RF heating (13,14,18–20), one would expect to see a large variation in RF heating of epicardial leads; conversely, new opportunities to increase patient safety through surgical modification of lead trajectories.
Figure 1:
(A) Patient with an endocardial CIED. The majority of the lead’s trajectory (white arrows) passes through the subclavian vein with minimal variation in trajectory between patients. (B) Patient with two epicardial leads looped on the anterior surface of the heart, and (C) Patient with an epicardial lead looped on the inferior surface of the heart. (D) 3D view of two epicardial leads looped on the anterior surface of the heart as shown in (B).
In order to assess typical epicardial lead trajectories, we reviewed chest X-ray images of 100 pediatric patients implanted with CIEDs in our institution. Appropriate human subjects’ protection was provided by the respective review boards for Ann & Robert H. Lurie Children’s Hospital and Northwestern University. We identified two common categories of epicardial lead placement. In the first, excess length was looped and placed on the anterior surface of the heart (Figure 1B). In the second, the excess length of the lead was placed on or towards the inferior surface of the heart (Figure 1C). Because these two categories represented lead trajectories that were orthogonal with respect to the incident field, we expected their RF heating to vary substantially, making one trajectory the preferred trajectory for MRI safety. Specifically, a recent study on DBS leads had shown that the variation in RF heating at lead tips could be explained by a metric that quantified the relationship between the MRI incident field (i.e., the field in the absence of the implant) and the lead’s orientation (16). To investigate whether such a metric could also predict relative RF heating of different epicardial lead trajectories, we performed electromagnetic simulations to calculate the tangential component of the incident field (referred to as Etan) along each representative trajectory as:
| [1] |
where is the incident electric field and is a unit vector tangential to the lead’s path (note that is the electric field in the absence of the implanted lead). We then calculated the peak-to-peak value of the induced voltage along each trajectory as:
| [2] |
We expect that a lead placed along a trajectory with a lower would generate lower SAR and lower RF heating at its tip when exposed to a B1 field.
Note, however, that although could provide a useful tool for a fast comparison of different trajectories in terms of their potential for RF heating, it cannot give an accurate prediction of absolute value of RF heating for a specific lead model. Such predictions require additional information on the lead’s structure and response to the incident electric field as reflected in the lead’s transfer function (14,21–23). In this work, we also measured and validated the transfer function of a commercial epicardial lead (Medtronic CapSure Epi 4965, 35 cm) connected to an implantable pulse generator (Medtronic Azure™ XT DR MRI SureScan) and investigated whether the RF heating in realistic body models with different tissue properties predicted by the transfer function showed the same trend seen in our simulations and phantom experiments.
Abandoned leads
Over the lifetime of a CIED, leads may be disconnected and abandoned due to fracture, insulation breaks, or abnormal pacing or sensing (24,25). Although detached from the pulse generator, non-functional leads usually remain in place due to risks associated with lead extraction. Previous studies have shown an elevated risk of RF heating in abandoned leads, especially when they are capped at the proximal end (26). Theoretically, disconnecting the lead from the battery and capping (i.e., insulating) its proximal end would change the electrical length and termination boundary of the cable and thus, affecting the degree of coupling with the MRI electric field. To assess whether improvements in MRI safety due to trajectory modification would translate from fully implanted systems to abandoned leads, we also performed experiments with a capped abandoned epicardial lead.
Method
Electromagnetic simulations
Identifying epicardial lead trajectories that minimally couple with MRI incident electric field
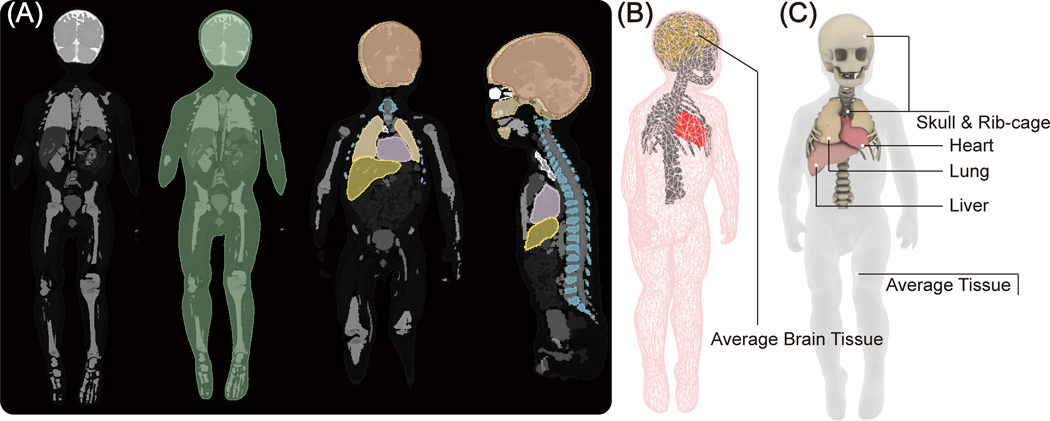
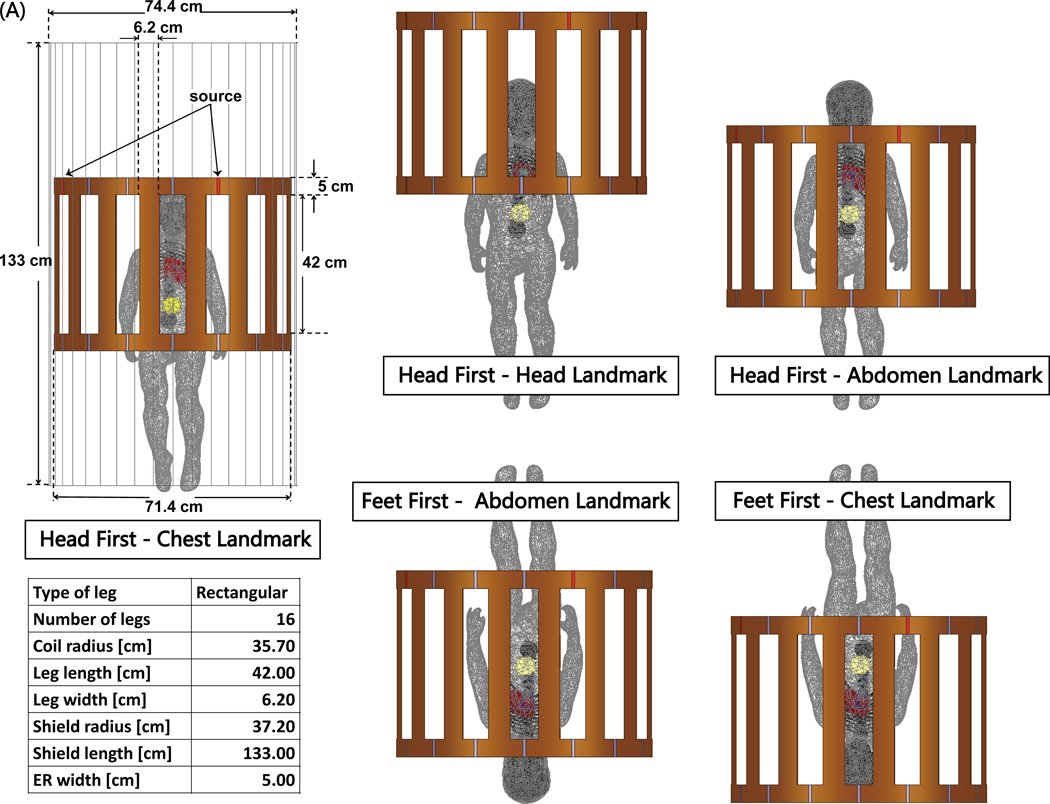
Electromagnetic simulations were implemented in ANSYS Electronics Desktop 2020 R2 (ANSYS Inc., Canonsburg, PA). A pediatric body model consisting of average tissue, skull, brain, ribcage, and heart was created from segmented MRI images of a 29-month-old child (27) and post-processed to form a tetrahedral mesh for finite element simulations (see Figure 2A and 2B). A model of a 16-rung high-pass birdcage coil with dimensions mimicking a Siemens 1.5 T Aera body coil was created based on technical specifications provided by the vendor and tuned to 63.6 MHz (28). The pediatric body model was positioned inside the coil at three imaging landmarks corresponding to head, chest, and abdomen imaging. For the chest and abdomen landmarks, we also simulated feet-first scanning by flipping the phantom (see Figure 3).
Figure 2:
(A) Segmented MRI of a 29-month-old child was used to create 3D models of the child’s silhouette, skull, brain, ribcage, heart, liver and lungs. (B) The tetrahedral meshes were post processed for finite element simulations. Simulations include five major tissues, including silhouette, skull, brain, ribcage, and heart, which were assigned to four different electric properties to represent the body heterogeneity. (C) The simulated body model used for transfer function prediction. Two additional tissues, the liver and lungs, were included near the heart to more accurately mimic realistic scenarios.
Figure 3:
(A) The body model consisting of average tissue (σ = 0.47 S/m; εr = 80), heart (σ = 0.68 S/m; εr = 107), brain (σ = 0.40 S/m; εr = 76), skull and ribcage (σ = 0.06 S/m; εr = 16.6), placed inside a model of Siemens 1.5 T Aera body coil. Five different body positions inside the coil: three head-first positions with chest, head and abdomen landmarks; two feet-first positions at chest and abdomen landmarks.
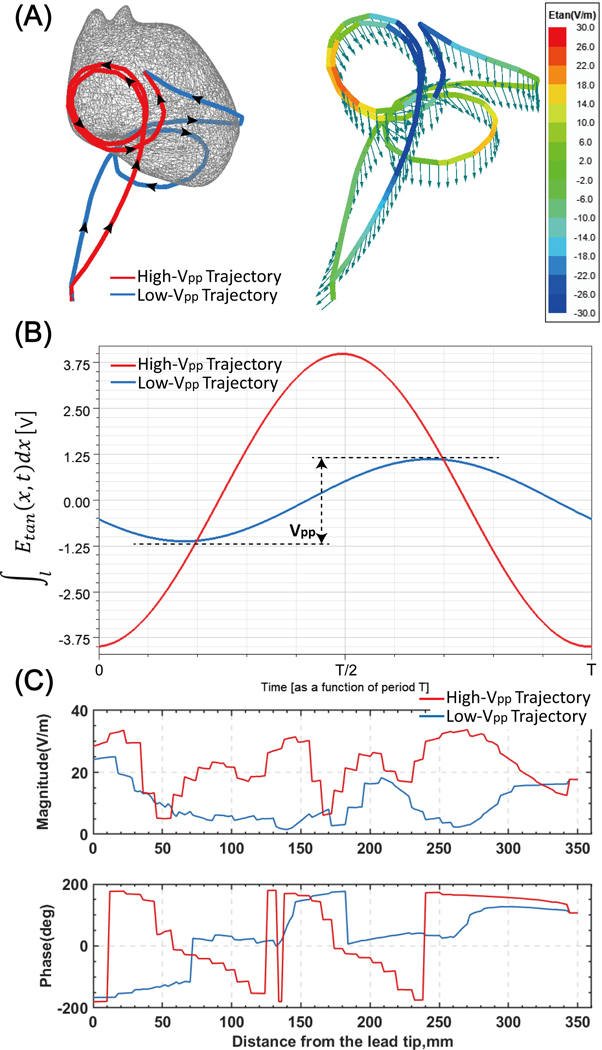
For each imaging landmark and patient positioning, we calculated and along the two representative epicardial lead trajectories as shown in Figure 4. Here, green arrows show the incident electric field at a certain time point along each trajectory. Figure 4A also shows (t) as a color field overlaid on each lead trajectory. Note that the magnitude of is a function of time, as the orientation of the electric field changes while the field vector rotates over a full cycle. Figure 4B shows the time evolution of Figure 4B shows the time evolution of for each lead trajectory.
Figure 4:
(A) Left: Two representative epicardial lead trajectories with loops on the anterior surface (high-Vpp trajectory) and inferior surface of the heart (low-Vpp trajectory) superimposed on one heart model. Right: Green arrows show the incident electric field along the trajectory of each lead. Etan is also overlaid on each lead trajectory as a color field. (B) The time evolution of induced voltage for each trajectory. Plots correspond to simulations performed with the body positioned head-first and at the chest imaging landmark. (C) Magnitude and phase of Etan along each lead trajectory.
CIED modeling and SAR calculation
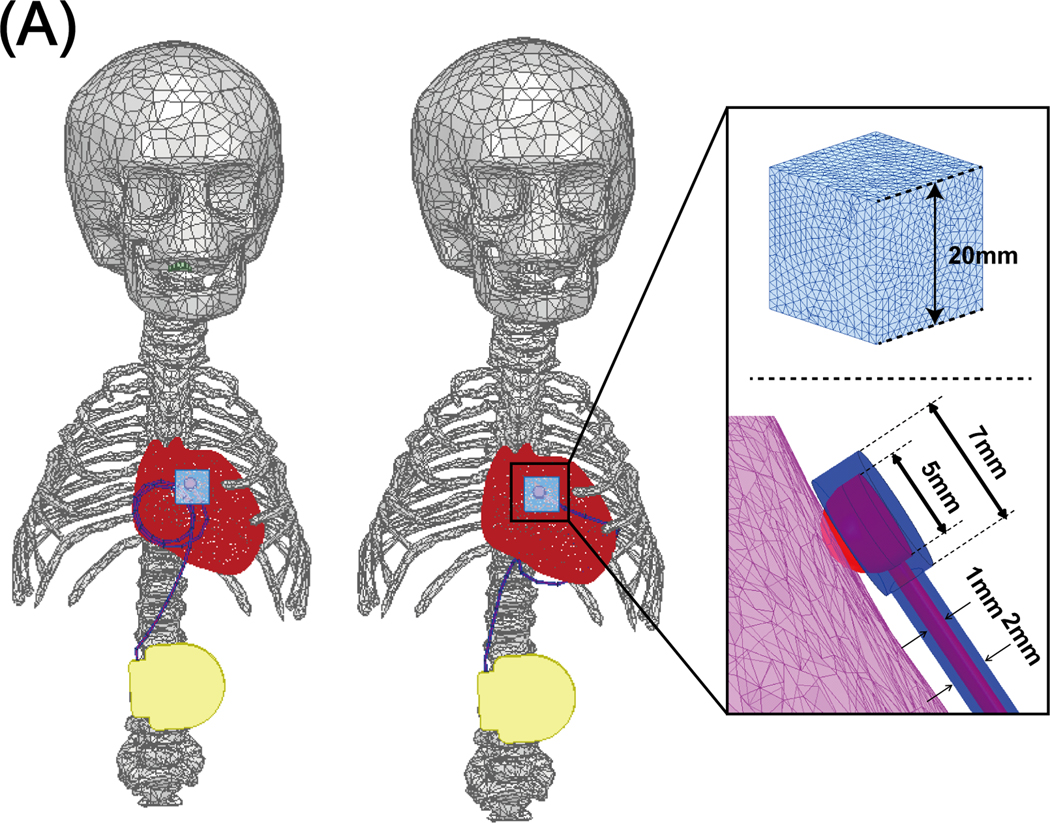
To investigate whether an epicardial lead positioned along a low- trajectory deposits less power in the tissue around its tip compared to a lead placed along a high- trajectory, we modeled two full CIEDs, each consisting of an implantable pulse generator (IPG) and a 35-cm insulated lead, positioned along high- or low- trajectories. Each lead was modeled as a solid wire made of platinum-iridium (𝜎= 4 × 10⁶ S/m), embedded in a 0.5-mm thick urethane insulation. The tip was modeled as a semi-spherical conductor mimicking Medtronic EPI 4965 lead model (Medtronic CapSure® EPI 4965). Simulations were performed at the same landmarks mentioned above. For all simulations, the input power of the coil was adjusted to generate an average on an axial plane passing through the coil’s iso-center. The 0.1g-averaged SAR (referred to as 0.1gSAR) was calculated using HFSS built-in SAR module that implements IEEE/IEC STD 62704–4 recommendation (29). The maximum of 0.1g SAR was recorded inside a cubic region of 20 mm× 20 mm× 20 mm surrounding the lead tip and was used to compare the two trajectories, as shown in Figure 5. To enhance the simulation accuracy, the initial mesh was set such that the maximum element size was < 0.5 mm on the entire lead core, < 2 mm on the IPG, in the cubical tissue region surrounding the lead tip, and the lead insulation, <10 mm in the heart, brain, ribcage, and skull tissue, and <20 mm everywhere else in the body model. ANSYS Electronics Desktop follows an adaptive mesh scheme with the successive refinement of the initial mesh between iterative passes. Scattering parameters (S-parameters) are evaluated at each port and compared to the previous pass at each adaptive pass. Simulations were considered to be converged when the magnitude of the change in S-parameters between the two consecutive passes fell below a set threshold of 0.001. All simulations converged within five adaptive passes. The convergence of absorbed RF power density was then verified by measuring the maximum of 0.1gSAR for both trajectories with different convergence thresholds (see Supporting Information Table S1), showing less than 0.3% change in the 0.1gSAR. Supporting Information Table S2 gives mesh statistics for each trajectory. Total simulation time was about 4 hours for both high- trajectory and low- trajectory on a DELL server with 1.5 TB memory and 2_Xenon(R) Gold 6140 CPUs, each having 32 processing cores.
Figure 5:
Epicardial leads with a loop positioned at the anterior (left model) and inferior (right model) surface of the heart along with a close-up of the lead tip/heart tissue interface and their corresponding parameters.
Experiments
Design and construction of the anthropomorphic pediatric phantom
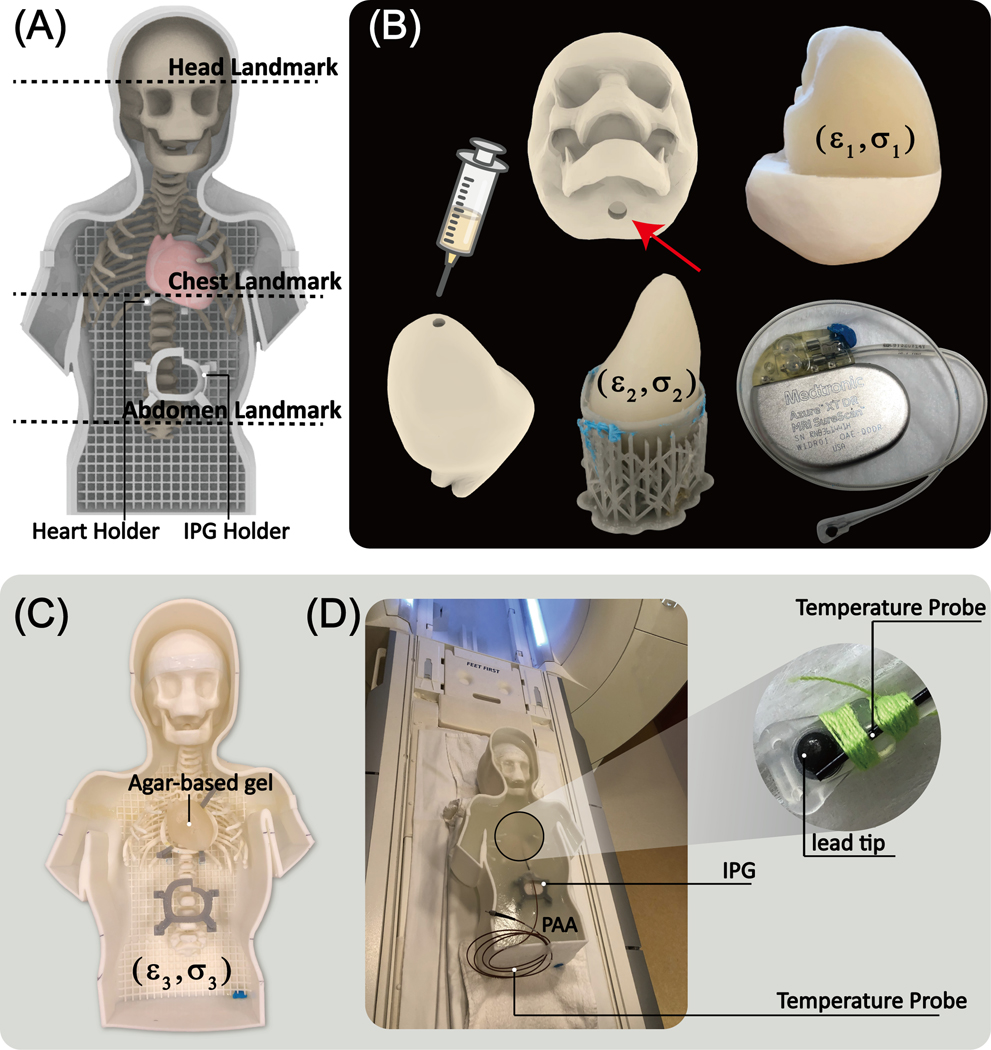
To examine whether the results of simulations with simplified lead models would translate to experiments with realistic devices, we designed and fabricated a pediatric phantom consisting of a human-shaped container, skull, ribcage, and heart from the same MR images that were used to create the body model for simulations. Images of the 29-month-old infant were post-processed in 3D slicer (Slicer 4.10, http://slicer.org) to generate smoothed masks of different body parts, which were further processed in a CAD tool (Rhino 6.0, Robert McNeel & Associates, Seattle, WA) to create 3D-printable objects as illustrated in Figure 6. The skull structure consisted of two separable coronal halves so that it could be filled with tissue-mimicking gel with average electrical properties of brain tissue. Similarly, a two-part mold was created from segmented images of the heart and filled with agar-doped saline solution. To create the filling solution for the heart, edible agar (Landor Trading, Montreal, Canada, gel strength = 900 g/cm2) was gradually added to 4.0 gNaCl/L saline solution while the mixture was stirred on a hot plate. Once agar was fully dissolved (32g/L for the brain; 40g/L for the heart), the mixture was cooled to 60 degrees Celsius, injected into the heart mold with a syringe, and left to cool to room temperature. Once solidified, the agar-based heart structure was taken out of the mold and placed on a custom-made holder inside the phantom. The rest of the body was filled with 8 L of a gel consisting of 8g/L polyacrylamide (PAA) solution and 1.55gNaCl/L saline. The electric properties of tissue-mimicking material were measured using a dielectric kit (N1501A) and a vector network analyzer (Keysight Technologies, Santa Rosa, CA) to be εr=76, σ=0.44 S/m for the brain tissue, εr=76, σ=0.65 S/m for the heart, and εr=87, σ=0.48 S/m for the PAA gel representing average tissue filling the phantom container.
Figure 6:
(A) Assembled phantom with two self-designed holders and three different landmarks. (B) The skull mold was 3D printed to fill in the agar gel mimicking the brain tissue (ε1=76, σ1=0.44S/m) through the hole, enabling the conductive connection between gel inside the skull and outside. The heart mold consisted of two coronal halves attached to create a closed container filled with agar-based solution (ε2=76, σ2=0.65S/m). Once the gel solidified, the semi-solid heart structure was removed and placed on a 3D printed holder inside the phantom (C). The rest of the phantom container was filled with PAA mimicking average tissue (ε3=87, σ3=0.48S/m). A 35 cm epicardial lead (Medtronic CapSure® EPI 4965) connected to a Medtronic Azure™ XT DR MRI SureScan pulse generator was used in the experiments. (D) A fiber optic temperature probe (OSENSA, Vancouver, BC, Canada) was secured at the tip of the lead using thread.
Epicardial lead trajectories and RF exposure experiments
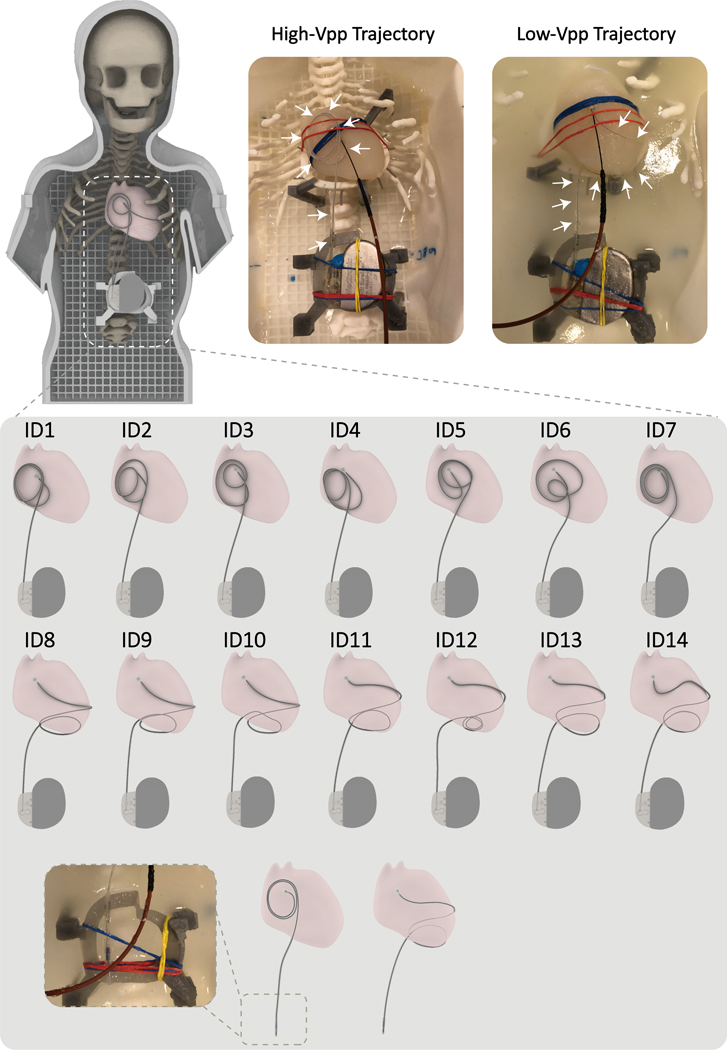
RF heating measurements were performed in a 1.5 T Siemens Aera scanner (Siemens Healthineers, Erlangen, Germany). A 35 cm unipolar epicardial lead (Medtronic CapSure® EPI 4965) was connected to a Medtronic Azure™ XT DR MRI SureScan pulse generator placed in the phantom’s abdomen approximately 10 cm caudal to the center of the heart. Fiber optic temperature probes (OSENSA, Vancouver, BC, Canada) were secured at the tip of the lead using threads. The lead’s tip was fixated to the surface of the heart phantom in a position analogous to the right atrial epicardium, and the rest of the lead was looped and placed either on the anterior surface of the heart or the inferior surface of the heart. Experiments were performed with the phantom placed at the 5 positions described above, namely, head-first with head, chest, and abdomen at the iso-center as well as feet-first with chest and abdomen at the isocenter. To examine the effect of trajectory modification on abandoned leads, we ran additional experiments where the lead was routed on high- and low- trajectories, but the battery was removed, and the lead was capped at its proximal end (Figure 7).
Figure 7:
Top: The 3D printed anthropomorphic pediatric phantom and representative high-SAR (High-Vpp Trajectory) and low-SAR (Low-Vpp Trajectory) trajectories. Bottom: Each representative trajectory was replicated 7 times for sensitivity analysis. Abandoned lead trajectory configurations are also shown in the last row.
To assess the sensitivity of results to perturbations in lead positioning, we repeated experiments with the phantom positioned head-first and at chest landmark which showed the highest RF heating with seven slightly different instances of each representative high- trajectory and low- trajectory (14 trajectories in total). Trajectories are illustrated in Figure 7. In all experiments, RF heating measurements were performed using a high-SAR T1-weighted turbo spin-echo (T1-TSE) sequence (TE=7.3 ms, TR= 897 ms, B1+ = 5 μT, TA= 280 s).
Transfer function measurement and validation
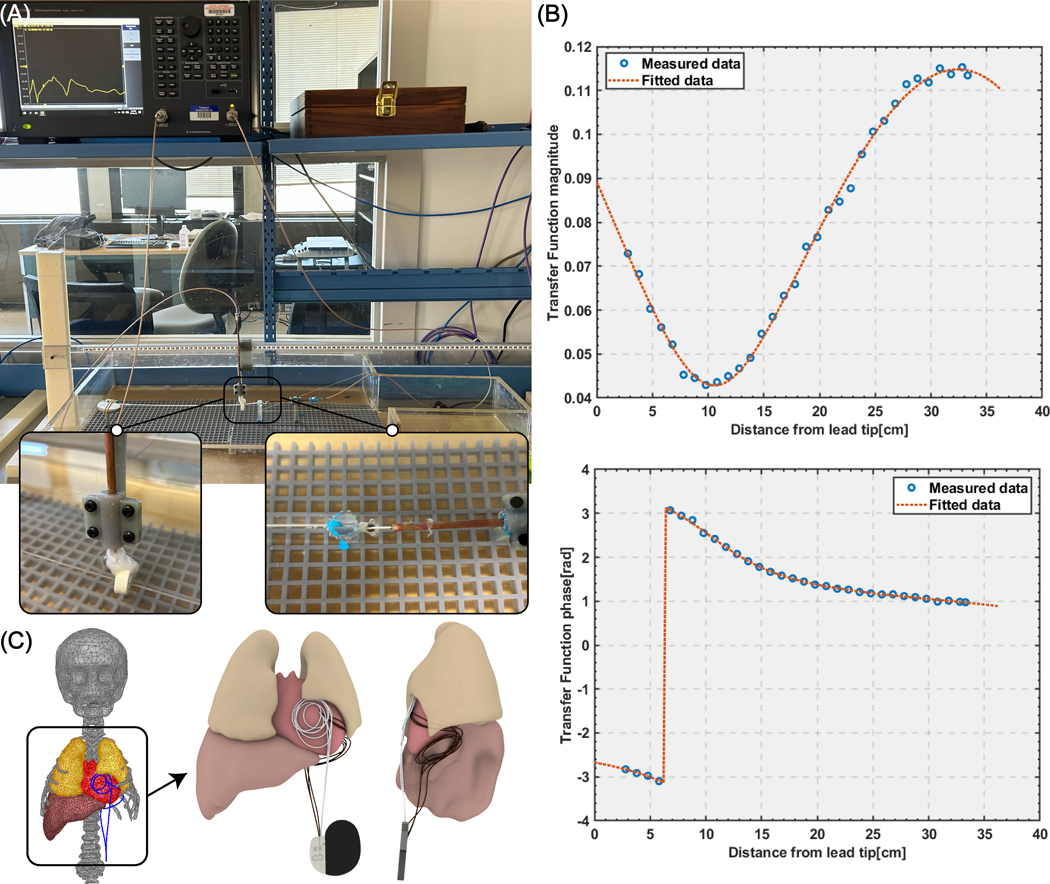
To investigate whether the results predicted by the Vpp metric and simulations with simplified lead models would stand valid when accounting for realistic lead geometry, we measured the transfer function of the lead + IPG system and assessed its RF heating in 12 human body models with different tissue conductivity and permittivity when the lead was routed along high-Vpp (N=7) and low-Vpp (N=7) trajectories. The transfer function was measured with a two-port Vector Network analyzer (VNA) (VNA 5063, Keysight Technologies, CA, USA). The receive probe was prepared from rg402 semirigid coaxial cable, in which the central conductor was wound around a ferromagnetic torus (made of 4C65 ferrite which has an inner diameter of 14mm, an outer diameter of 23 mm, and a height of 8 mm) and soldered to the shield similar to what was reported in an earlier study (22). The transmit probe was also prepared from rg402 semirigid coaxial cable from which 6 mm of the shield and dielectric were removed exposing the tip to create a monopole antenna. The reciprocal method of estimating transfer function was used to measure the lead transfer function (30). The lead was connected to the IPG at its proximal end and passed through the receive probe and the lead + IPG system was submerged in an ASTM phantom filled with saline solution imitating electrical properties of the tissue (electrical conductivity 0.5 S/m and permittivity of ). To increase mechanical stability of the setup and improve the coupling of the probes through the cable, the excitation was done with the excitation monopole touching the electrode of the lead where the temperature measurements are usually done. The measurement setup is shown in Figure 8A. The VNA was calibrated using 85032F standard mechanical calibration kit (Keysight Technologies, CA, USA) on both ports and the complex S-parameter S21 was measured at different positioning of the receiving probe along the lead with 1 cm intervals. Figure 8B shows the magnitude and phase of the transfer function. The measured transfer function was calibrated and validated extensively, first following the standard procedure described in (23), and then through additional experiments to demonstrate the validity of its predictions in a heterogenous media. Details of transfer function calibration and validations are given in the Supporting Information.
Figure 8:
(A) Transfer function measurement setup. (B) The magnitude and phase of the transfer function. (C) High-Vpp trajectory and low-Vpp trajectory positioned in the human body model; RF heating was assessed for seven trajectories with small perturbations in each trajectory group.
After validating the transfer function, it was employed to predict the RF heating of the lead + IPG ensemble in 12 realistic body models (Figure 2C). These models had varying conductivity and permittivity of different tissue classes, which were randomly altered to fall within ±100% of their nominal values. The RF heating of seven anterior and seven inferior lead trajectories were predicted for both head-first and feet-first positions at chest imaging landmark (see Figure 8C). The Supporting Information Tables S3 and S4 provide comprehensive details about the characteristics of the body models and the transfer function predictions.
Results
Vpp, SAR, and ΔT
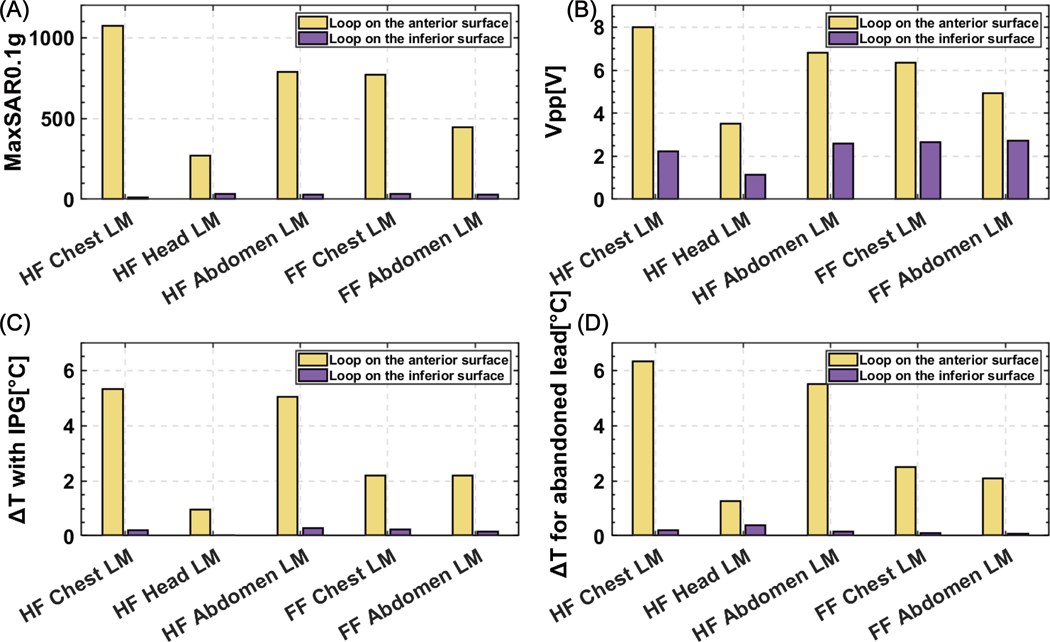
For all imaging landmarks and patient positions, Vpp was lower for the loop placed on the inferior surface of the heart compared to the loop placed on the anterior surface of the heart. Vpp was higher in the head-first position compared to the feet-first position and higher for chest and abdomen landmarks compared to the head landmark. The maximum of 0.1gSAR around the lead tip and measured ΔT showed a similar trend as seen in Figure 9. Interestingly, Vpp correlated well with both simulated SAR (R=0.98) and measured ΔT (R=0.94), indicating it could be a useful tool for a fast comparison of different lead trajectories regarding their potential for RF heating.
Figure 9:
(A) Maximum of 0.1g-averaged SAR (MaxSAR0.1g) and (B) Vpp were calculated around the tip of the lead for an anterior and inferior loop trajectory for five different scanning positions; (C) Temperature rise at the tip of the lead connected to the IPG and (D) Temperature rise at the tip of the abandoned lead was recorded during the RF exposure.
In-vitro temperature measurements: Full system
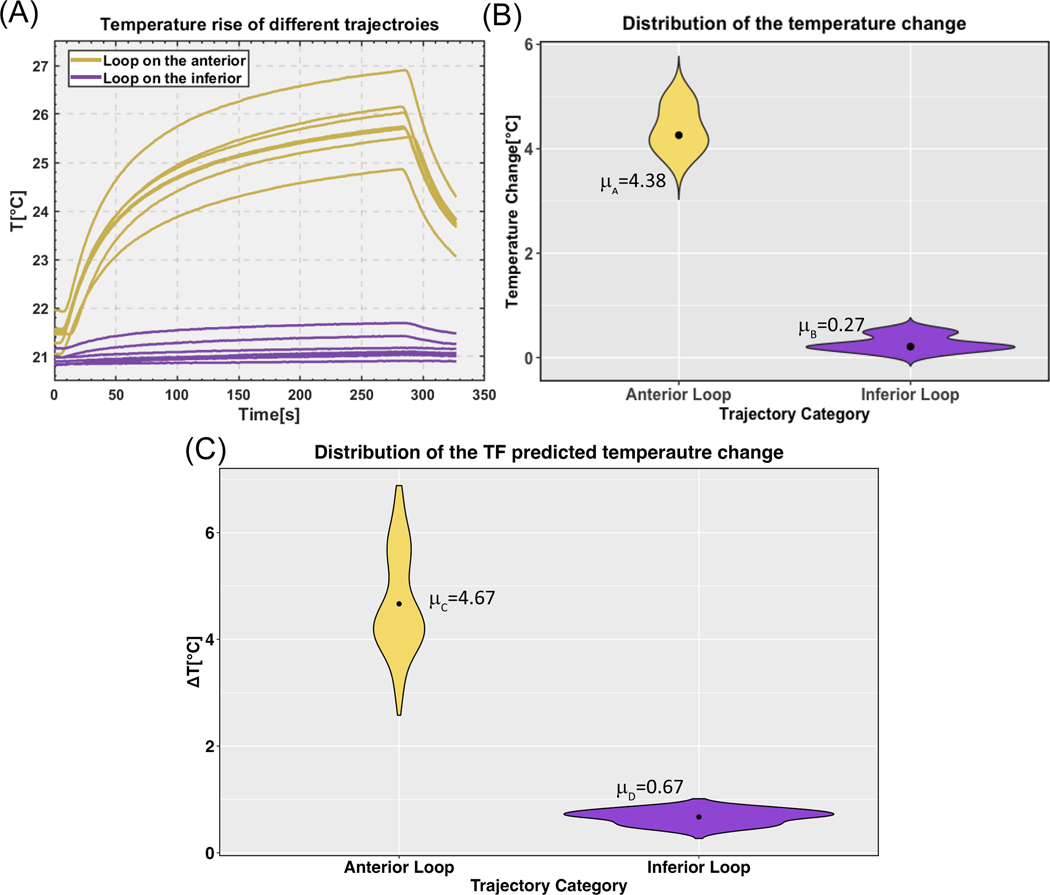
We repeated temperature measurements at the tip of the lead for phantom in head-first chest landmark position with the fourteen lead trajectories depicted in Figure 7. Supporting Information Table S5 summarizes the results. The mean ± standard deviation of RF heating was 4.380.43 °C for trajectories with the loop on the anterior surface of the heart and 0.270.16 °C for trajectories with the loop on the inferior surface of the heart, showing a 16-fold difference in the mean RF heating values. Figure 10A and 10B show the temporal profile of ΔTs as well as violin plots of the data distribution. Both groups were normally distributed as calculated by the Shapiro-Wilk normality test (P>0.05). A one-tailed independent t-test at a significant level of showed that the group with loops on the anterior surface of the heart generated significantly higher heating compared to the group with loops on the inferior surface of the heart (P-value = 9.9e-9).
Figure 10:
(A) Temperature rise at the tip of a 35-cm epicardial lead with fourteen different trajectories (all illustrated in Figure 7). (B) Violin plots of the temperature rise distributions with the mean value plotted for each trajectory category. (C) Violin plots of the transfer function predicted temperature rise distributions with the mean value for each trajectory category (data pooled over both head-first and feet-first orientations).
In-vitro temperature measurements: Abandoned epicardial lead
For the abandoned capped lead using a head-first orientation chest landmark, the ΔT was 6.31°C when the lead was routed along the high-Vpp trajectory and 0.22°C when the lead was routed along the low-Vpp trajectory. This indicates a trend that RF heating can be reduced when utilizing theoretically predicted low-SAR trajectories. A similar trend was observed for all other patient positions and imaging landmarks (Figure 9D).
In-vivo predictions
A total of 336 realistic scenarios were examined to predict RF heating in twelve anatomically realistic body models in both head-first and feet-first orientations at chest imaging landmark using the transfer function. For each body model, 14 trajectories were assessed, with seven leads looped on the anterior surface of the heart and seven on or towards the inferior surface of the heart. The mean ± standard deviation of the predicted RF heating was 4.67 ± 0.95°C for trajectories routed on the anterior surface of the heart and 0.67 ± 0.14°C for trajectories routed on the inferior surface of the heart (data pooled over both head-first and feet-first orientations). The Shapiro-Wilk normality test revealed that the group of trajectories on the anterior surface was non-normally distributed (P<0.05), whereas the trajectories on or towards the inferior surface exhibited a normal distribution (P>0.05). The results of an unpaired two-sample Mann-Whitney Wilcoxon test demonstrated a significant difference in median RF heating between the anterior and inferior trajectory groups, with the former showing higher heating (P<2.2e-16). Figure 10C shows a violin plot representing the predicted temperature rises distribution for both trajectory categories, corresponding to a B1+ = 5 μT.
Discussion
Substantial restrictions exist for patients with epicardial leads who are referred for MRI due to the elevated risk of RF heating at the tissue/lead tip interface during MRI. Recent phantom studies have reported up to 76 °C of temperature rise at tips of epicardial leads during MRI at 1.5 T (3), which is concerning as children are the most likely recipients of epicardial CIED systems, and as RF lesions during early childhood can expand as the heart grows over time. (31). The problem is exacerbated by the fact that there is no straightforward method to extract epicardial leads, so children who receive these leads may be excluded from the benefits of MRI for life, even if a subsequent FDA-approved endocardial system is placed when they are older.
Efforts to make MRI accessible to patients with conductive implants have a long history, as is clear from the spate of patents published in the past two decades (32–41). Most of the work has focused on modifying the implant itself, e.g., in the case of active implants by increasing the lead’s impedance or altering the material to reduce induced RF currents (41–44). This has had limited success, and the restrictions on MRI remain. Importantly, changing the lead’s design has a substantially high cost-to-benefit ratio for the manufacturer: safety gains are modest at best, whereas slight alterations in design or materials trigger the lengthy and costly process of re-obtaining FDA approval for biocompatibility, non-toxicity, and mechanical stability. Because of this, in addition to the pediatric market is smaller than the adult market, manufacturers have been less willing to invest in MR-Conditional devices tailored for the pediatric population. Alternatively, several groups have focused on changing the MRI technology itself through field-shaping methods that create regions of the low-electric field and then steer those regions (either mechanically or electronically) to coincide with the implant (18,19,45–49). Although promising, these techniques are still in the early stages of development, and their widespread application will take years to come. Finally, recent studies have shown that vertical MRI platforms generate less heating around tips of neuromodulation devices due to orthogonal E fields and thus, could offer a safer alternative (50,51). However, studies have yet to be replicated for cardiac devices.
It is well established that the trajectory of an implanted lead and its orientation with respect to MRI electric fields substantially affects the RF heating (14,15). The idea that the lead trajectory can be manipulated at the time of implant to reduce RF heating potentially was originally suggested for neuromodulation devices (52) and later proved promising in patients with deep brain stimulation devices (16). Specifically, it was recently reported that a simple lead trajectory modification could be successfully implemented in the surgical routine of implanting deep brain stimulation leads to reduce RF heating by 3-fold during MRI at 3 T (53). Here we demonstrated that a similar simple yet highly effective technique could be adopted in children with epicardial leads to substantially reduce the risk of RF heating of the device during MRI at 1.5 T. Most importantly, we found that the reduction in RF heating was not sensitive to smaller perturbations in the lead trajectory. That is, as long as implanted leads are routed along a trajectory that roughly follows the theoretically optimum path, RF heating will be substantially reduced, even if the subtle surgical details differ from patient-to-patient. This is reassuring, as surgical constraints are likely to prevent the ideal implementation of theoretically optimal trajectories in practice. We also found that the improved safety margin would translate from fully implanted systems to abandoned leads, extending the benefits to the common clinical scenarios where lead fracture has occurred or where a patient has transitioned to an endocardial CIED, but retains the leads from the defunct epicardial system throughout life.
This study is limited in that the results cannot be extrapolated to other lead models or other MRI field strengths. This is because RF heating is a resonance phenomenon that also depends on the lead’s length, and thus, the path that minimizes the field coupling for one lead could be different for a lead with a dissimilar length. In this study, we examined the 35-cm lead because it is our pediatric hospital’s most frequently used length. However, epicardial leads come in a variety of lengths ranging from 15 cm to 85 cm, each warranting a separate investigation. In addition, we tested a unipolar lead, but some clinically implanted epicardial leads are bipolar leads which should be examined in future studies.
Overall, the results of this study indicate that a simple, easy-to-implement surgical trajectory of epicardial leads could substantially reduce their RF heating during MRI at 1.5 T in a robust and reproducible way, with benefits extending to abandoned leads.
Supplementary Material
Figure S1: (A)Trajectory used to calculate the calibration factor C (B) Simulation setup.
Figure S2: Configurations of 15 different orthogonal trajectories used to validate our transfer function measurements. The dot at the end of each trajectory represents the tip of the lead.
Figure S3: Bar plot showing experimentally measured values of temperature rise compared to the corresponding values predicted from the transfer function in the box phantom.
Figure S4: (A) Six trajectories with bends and loops were implanted in the pediatric phantom for experiments. (B) Pediatric phantom simulation consisting of the model of the heart and PAA. (C) Bar plot showing experimentally measured values of temperature rise compared to the corresponding values predicted from the transfer function in the pediatric phantom.
Table S1: The maximum of 0.1gSAR for anterior and inferior loop trajectories during head-first, chest landmark positioning across different convergence thresholds.
Table S2: Mesh statistics for anterior and inferior loop trajectories in the head-first, chest landmark position.
Table S3: Characteristics of the body models and the transfer function predictions for two trajectory categories, namely anterior trajectory and inferior trajectory in the head-first orientation at chest landmark. Mean values for each trajectory category and category ratios were calculated.
Table S4: Characteristics of the body models and the transfer function predictions for two trajectory categories, namely anterior trajectory and inferior trajectory in the feet-first orientation at chest landmark. Mean values for each trajectory category and category ratios were calculated.
Table S5: Temperature measurements at the tip of the lead for the phantom in a head-first, chest landmark position with the fourteen lead trajectories depicted in Figure 7.
Acknowledgment:
This work was supported, in part, by in-kind lead donations from the Medtronic Corporation (Minneapolis, MN) and by funding from the NIH (K23HL130554, R01EB030324, and R01EB034377). The authors gratefully acknowledge Mr. Jonathan Edmonson from Medtronic for his invaluable contributions and insightful discussions.
Reference:
- 1.CDC. Data and statistics on congenital heart defects 2021. [Google Scholar]
- 2.Konta L, Chubb MH, Bostock J, Rogers J, Rosenthal E. Twenty-Seven Years Experience With Transvenous Pacemaker Implantation in Children Weighing <10 kg. Circ Arrhythm Electrophysiol 2016;9(2):e003422. [DOI] [PubMed] [Google Scholar]
- 3.Balmer C, Gass M, Dave H, Duru F, Luechinger R. Magnetic resonance imaging of patients with epicardial leads: in vitro evaluation of temperature changes at the lead tip. Journal of Interventional Cardiac Electrophysiology 2019;56(3):321–326. [DOI] [PubMed] [Google Scholar]
- 4.Jiang F, Bhusal B, Sanpitak P, Webster G, Popescu A, Kim D, Bonmassar G, Golestanirad L. A comparative study of MRI-induced RF heating in pediatric and adult populations with epicardial and endocardial implantable electronic devices. 2022. [DOI] [PMC free article] [PubMed] [Google Scholar]
- 5.Epstein AE, DiMarco JP, Ellenbogen KA, Estes NM, Freedman RA, Gettes LS, Gillinov AM, Gregoratos G, Hammill SC, Hayes DL. ACC/AHA/HRS 2008 guidelines for device-based therapy of cardiac rhythm abnormalities: a report of the American College of Cardiology/American Heart Association Task Force on Practice Guidelines (Writing Committee to Revise the ACC/AHA/NASPE 2002 Guideline Update for Implantation of Cardiac Pacemakers and Antiarrhythmia Devices) developed in collaboration with the American Association for Thoracic Surgery and Society of Thoracic Surgeons. Journal of the American College of Cardiology 2008;51(21):e1–e62. [DOI] [PubMed] [Google Scholar]
- 6.Shellock FG, Fischer L, Fieno DS. Cardiac pacemakers and implantable cardioverter defibrillators: in vitro magnetic resonance imaging evaluation at 1.5-tesla. Journal of Cardiovascular magnetic resonance 2007;9(1):21–31. [DOI] [PubMed] [Google Scholar]
- 7.Sommer T, Naehle CP, Yang A, Zeijlemaker V, Hackenbroch M, Schmiedel A, Meyer C, Strach K, Skowasch D, Vahlhaus C. Strategy for Safe Performance of Extrathoracic Magnetic Resonance Imaging at 1.5 Tesla in the Presence of Cardiac Pacemakers in Non–Pacemaker-Dependent Patients A Prospective Study With 115 Examinations . Circulation 2006;114(12):1285–1292. [DOI] [PubMed] [Google Scholar]
- 8.Nyenhuis JA, Park S-M, Kamondetdacha R, Amjad A, Shellock FG, Rezai AR. MRI and implanted medical devices: basic interactions with an emphasis on heating. IEEE Transactions on device and materials reliability 2005;5(3):467–480. [Google Scholar]
- 9.Park S, Kamondetdacha R, Amjad A, Nyenhuis J. MRI safety: RF-induced heating near straight wires. IEEE transactions on magnetics 2005;41(10):4197–4199. [Google Scholar]
- 10.Bhusal B, Nguyen BT, Sanpitak PP, Vu J, Elahi B, Rosenow J, Nolt MJ, Lopez-Rosado R, Pilitsis J, DiMarzio M, Golestanirad L. Effect of Device Configuration and Patient’s Body Composition on the RF Heating and Nonsusceptibility Artifact of Deep Brain Stimulation Implants During MRI at 1.5 T and 3T. Journal of Magnetic Resonance Imaging 2021;53(2):599–610. [DOI] [PubMed] [Google Scholar]
- 11.Vu J, Nguyen BT, Bhusal B, Baraboo J, Rosenow J, Bagci U, Bright MG, Golestanirad L. Machine Learning-Based Prediction of MRI-Induced Power Absorption in the Tissue in Patients With Simplified Deep Brain Stimulation Lead Models. IEEE Transactions on Electromagnetic Compatibility 2021;63(5):1757–1766. [DOI] [PMC free article] [PubMed] [Google Scholar]
- 12.Golestanirad L, Angelone LM, Iacono MI, Katnani H, Wald LL, Bonmassar G. Local SAR near deep brain stimulation (DBS) electrodes at 64 and 127 MH z: A simulation study of the effect of extracranial loops. Magnetic resonance in medicine 2017;78(4):1558–1565. [DOI] [PMC free article] [PubMed] [Google Scholar]
- 13.Kazemivalipour E, Bhusal B, Vu J, Lin S, Nguyen BT, Kirsch J, Nowac E, Pilitsis J, Rosenow J, Atalar E, Golestanirad L. Vertical open-bore MRI scanners generate significantly less radiofrequency heating around implanted leads: A study of deep brain stimulation implants in 1.2T OASIS scanners versus 1.5T horizontal systems. Magnetic Resonance in Medicine 2021;86(3):1560–1572. [DOI] [PMC free article] [PubMed] [Google Scholar]
- 14.Park SM, Kamondetdacha R, Nyenhuis JA. Calculation of MRI-induced heating of an implanted medical lead wire with an electric field transfer function. J Magn Reson Imaging 2007;26(5):1278–1285. [DOI] [PubMed] [Google Scholar]
- 15.Achenbach S, Moshage W, Diem B, Bieberle T, Schibgilla V, Bachmann K. Effects of magnetic resonance imaging on cardiac pacemakers and electrodes. Am Heart J 1997;134(3):467–473. [DOI] [PubMed] [Google Scholar]
- 16.Golestanirad L, Kirsch J, Bonmassar G, Downs S, Elahi B, Martin A, Iacono MI, Angelone LM, Keil B, Wald LL, Pilitsis J. RF-induced heating in tissue near bilateral DBS implants during MRI at 1.5 T and 3T: The role of surgical lead management. Neuroimage 2019;184:566–576. [DOI] [PMC free article] [PubMed] [Google Scholar]
- 17.Vu J, Bhusal B, Rosenow J, Pilitsis J, Golestanirad L. Modifying surgical implantation of deep brain stimulation leads significantly reduces RF-induced heating during 3 T MRI. Annu Int Conf IEEE Eng Med Biol Soc 2021;2021:4978–4981. [DOI] [PubMed] [Google Scholar]
- 18.Golestanirad L, Keil B, Angelone LM, Bonmassar G, Mareyam A, Wald LL. Feasibility of using linearly polarized rotating birdcage transmitters and close-fitting receive arrays in MRI to reduce SAR in the vicinity of deep brain simulation implants. Magnetic resonance in medicine 2017;77(4):1701–1712. [DOI] [PMC free article] [PubMed] [Google Scholar]
- 19.Golestanirad L, Kazemivalipour E, Keil B, Downs S, Kirsch J, Elahi B, Pilitsis J, Wald LL. Reconfigurable MRI coil technology can substantially reduce RF heating of deep brain stimulation implants: First in-vitro study of RF heating reduction in bilateral DBS leads at 1.5 T. PloS one 2019;14(8):e0220043. [DOI] [PMC free article] [PubMed] [Google Scholar]
- 20.Yeung CJ, Susil RC, Atalar E. RF heating due to conductive wires during MRI depends on the phase distribution of the transmit field. Magnetic Resonance in Medicine: An Official Journal of the International Society for Magnetic Resonance in Medicine 2002;48(6):1096–1098. [DOI] [PubMed] [Google Scholar]
- 21.Mattei E, Censi F, Calcagnini G, Lucano E, Angelone LM. A combined computational and experimental approach to assess the transfer function of real pacemaker leads for MR radiofrequency-induced heating. Magma 2021;34(4):619–630. [DOI] [PubMed] [Google Scholar]
- 22.Missoffe A, Aissani S. Experimental setup for transfer function measurement to assess RF heating of medical leads in MRI: Validation in the case of a single wire. Magn Reson Med 2018;79(3):1766–1772. [DOI] [PubMed] [Google Scholar]
- 23.Zheng J, Wang Z, Wang Q, Hu S, Gu Z, Kainz W, Chen J. Developing AIMD Models Using Orthogonal Pathways for MRI Safety Assessment. IEEE Transactions on Electromagnetic Compatibility 2020;62(6):2689–2695. [Google Scholar]
- 24.Henrikson CA, Brinker JA. How to prevent, recognize, and manage complications of lead extraction. Part I: avoiding lead extraction—infectious issues. Heart Rhythm 2008;5(7):1083–1087. [DOI] [PubMed] [Google Scholar]
- 25.Henrikson CA, Brinker JA. How to prevent, recognize, and manage complications of lead extraction. Part II: Avoiding lead extraction—Noninfectious issues. Heart Rhythm 2008;5(8):1221–1223. [DOI] [PubMed] [Google Scholar]
- 26.Mattei E, Gentili G, Censi F, Triventi M, Calcagnini G. Impact of capped and uncapped abandoned leads on the heating of an MR-conditional pacemaker implant. Magnetic resonance in medicine 2015;73(1):390–400. [DOI] [PubMed] [Google Scholar]
- 27.Jeong H, Ntolkeras G, Alhilani M, Atefi SR, Zöllei L, Fujimoto K, Pourvaziri A, Lev MH, Grant PE, Bonmassar GJPo. Development, validation, and pilot MRI safety study of a high-resolution, open source, whole body pediatric numerical simulation model. 2021;16(1):e0241682. [DOI] [PMC free article] [PubMed] [Google Scholar]
- 28.Sanpitak P, Bhusal B, Nguyen BT, Vu J, Chow K, Bi X, Golestanirad L. On the accuracy of Tier 4 simulations to predict RF heating of wire implants during magnetic resonance imaging at 1.5 T. 2021. IEEE. p 4982–4985. [DOI] [PubMed] [Google Scholar]
- 29.IEEE/IEC 62704–4-2020 International Standard - Determining the peak spatial-average specific absorption rate (SAR) in the human body from wireless communication devices, 30 MHz to 6 GHz – Part 4: General requirements for using the finite element method for SAR calculations. 2020. [Google Scholar]
- 30.Feng S, Qiang R, Kainz W, Chen J. A Technique to Evaluate MRI-Induced Electric Fields at the Ends of Practical Implanted Lead. IEEE Transactions on Microwave Theory and Techniques 2015;63(1):305–313. [Google Scholar]
- 31.Saul JP, Hulse JE, Papagiannis J, Van Praagh R, Walsh EP. Late enlargement of radiofrequency lesions in infant lambs. Implications for ablation procedures in small children. Circulation 1994;90(1):492–499. [DOI] [PubMed] [Google Scholar]
- 32.Villaseca E, Dublin G; Electromagnetic trap for a lead. US20030144720A12002.
- 33.Zeijlemaker; Method and apparatus for shielding coating for MRI resistant electrode systems. US20030144718A12002.
- 34.Atalar E, Allen J, Bottomley P, Eldelstein W, Karmarkar PV; MRI-safe high impedance lead systems. US8055351B22006.
- 35.Wahlstrand CD, Hoegh TB, Hrdlicka GA, Cross TE, Olsen JM; Lead electrode for use in an MRI-safe implantable medical device. US7174219B22007.
- 36.Vase A, Sethna DN; Implantable medical lead configured for improved mri safety. US Patent US20090270956A12008.
- 37.Olsen JM, Hrdlicka GA, Wahlstrand CD, Hoegh TB; Lead electrode for use in an MRI-safe implantable medical device. US Patent US7877150B22010.
- 38.Bottomley PA, Kumar A, Edelstein WA, Allen JM, Karmarkar PV. Designing passive MRI-safe implantable conducting leads with electrodes. Medical physics 2010;37(7Part1):3828–3843. [DOI] [PubMed] [Google Scholar]
- 39.Stevenson RA, Halperin HR, Lardo AC, Dabney WS, Kondabatni KK, Frysz CA, Johnson RS, Moschiano HN; Implantable lead bandstop filter employing an inductive coil with parasitic capacitance to enhance MRI compatibility of active medical devices. US8145324B12012.
- 40.Bottomley PA, Karmarkar PV, Allen JM, Edelstein WA; MRI and RF compatible leads and related methods of operating and fabricating leads. US20080243218A12016.
- 41.McCabe S, Scott J. A Novel Implant Electrode Design Safe in the RF Field of MRI Scanners. IEEE Transactions on Microwave Theory and Techniques 2017;65(9):3541–3547. [Google Scholar]
- 42.Golestanirad L, Angelone LM, Kirsch J, Downs S, Keil B, Bonmassar G, Wald LL. Reducing RF-induced heating near implanted leads through high-dielectric capacitive bleeding of current (CBLOC). IEEE transactions on microwave theory and techniques 2019;67(3):1265–1273. [DOI] [PMC free article] [PubMed] [Google Scholar]
- 43.Golestanirad L, Bonmassar G, Wald LL; MRI-safe implantable leads with high-dielectric coating. US Provisional Pat. Ser. No. PCT/US2019/0183992019.
- 44.Serano P, Angelone LM, Katnani H, Eskandar E, Bonmassar G. A novel brain stimulation technology provides compatibility with MRI. Scientific reports 2015;5(1):1–10. [DOI] [PMC free article] [PubMed] [Google Scholar]
- 45.Eryaman Y, Guerin B, Akgun C, Herraiz JL, Martin A, Torrado-Carvajal A, Malpica N, Hernandez-Tamames JA, Schiavi E, Adalsteinsson E. Parallel transmit pulse design for patients with deep brain stimulation implants. Magnetic resonance in medicine 2015;73(5):1896–1903. [DOI] [PMC free article] [PubMed] [Google Scholar]
- 46.Guerin B, Angelone LM, Dougherty D, Wald LL. Parallel transmission to reduce absorbed power around deep brain stimulation devices in MRI: Impact of number and arrangement of transmit channels. Magnetic resonance in medicine 2020;83(1):299–311. [DOI] [PMC free article] [PubMed] [Google Scholar]
- 47.McElcheran CE, Yang B, Anderson KJ, Golenstani-Rad L, Graham SJ. Investigation of parallel radiofrequency transmission for the reduction of heating in long conductive leads in 3 Tesla magnetic resonance imaging. PLoS One 2015;10(8):e0134379. [DOI] [PMC free article] [PubMed] [Google Scholar]
- 48.McElcheran C, Golestanirad L, Iacono M, Wei P-S, Yang B, Anderson K, Bonmassar G, Graham S. Numerical simulations of realistic lead trajectories and an experimental verification support the efficacy of parallel radiofrequency transmission to reduce heating of deep brain stimulation implants during MRI. Scientific reports 2019;9(1):1–14. [DOI] [PMC free article] [PubMed] [Google Scholar]
- 49.Kazemivalipour E, Keil B, Vali A, Rajan S, Elahi B, Atalar E, Wald LL, Rosenow J, Pilitsis J, Golestanirad L. Reconfigurable MRI technology for low-SAR imaging of deep brain stimulation at 3T: Application in bilateral leads, fully-implanted systems, and surgically modified lead trajectories. NeuroImage 2019;199:18–29. [DOI] [PMC free article] [PubMed] [Google Scholar]
- 50.Golestanirad L, Kazemivalipour E, Lampman D, Habara H, Atalar E, Rosenow J, Pilitsis J, Kirsch J. RF heating of deep brain stimulation implants in open-bore vertical MRI systems: A simulation study with realistic device configurations. Magnetic resonance in medicine 2020;83(6):2284–2292. [DOI] [PMC free article] [PubMed] [Google Scholar]
- 51.Vu BB J, Nguyen B, Sanpitak P, Nowac E, Pilitsis J, Rosenow J, Golestanirad L. Field orientation matters: vertical open-bore scanners significantly reduce RF heating around implanted deep brain stimulation devices. Proc Intl Soc Mag Reson Med 30 2022;577. [Google Scholar]
- 52.Baker KB, Tkach J, Hall JD, Nyenhuis JA, Shellock FG, Rezai AR. Reduction of Magnetic Resonance Imaging-Related Heating in Deep Brain Stimulation Leads Using a Lead Management Device. Neurosurgery 2005;57(4):392–396. [DOI] [PubMed] [Google Scholar]
- 53.Vu J, Bhusal B, Rosenow J, Pilitsis J, Golestanirad L. Modifying surgical implantation of deep brain stimulation leads significantly reduces RF-induced heating during 3 T MRI. 2021 43rd Annual International Conference of the IEEE Engineering in Medicine & Biology Society (EMBC): IEEE; 2021. p 4978–4981. [DOI] [PubMed] [Google Scholar]
Associated Data
This section collects any data citations, data availability statements, or supplementary materials included in this article.
Supplementary Materials
Figure S1: (A)Trajectory used to calculate the calibration factor C (B) Simulation setup.
Figure S2: Configurations of 15 different orthogonal trajectories used to validate our transfer function measurements. The dot at the end of each trajectory represents the tip of the lead.
Figure S3: Bar plot showing experimentally measured values of temperature rise compared to the corresponding values predicted from the transfer function in the box phantom.
Figure S4: (A) Six trajectories with bends and loops were implanted in the pediatric phantom for experiments. (B) Pediatric phantom simulation consisting of the model of the heart and PAA. (C) Bar plot showing experimentally measured values of temperature rise compared to the corresponding values predicted from the transfer function in the pediatric phantom.
Table S1: The maximum of 0.1gSAR for anterior and inferior loop trajectories during head-first, chest landmark positioning across different convergence thresholds.
Table S2: Mesh statistics for anterior and inferior loop trajectories in the head-first, chest landmark position.
Table S3: Characteristics of the body models and the transfer function predictions for two trajectory categories, namely anterior trajectory and inferior trajectory in the head-first orientation at chest landmark. Mean values for each trajectory category and category ratios were calculated.
Table S4: Characteristics of the body models and the transfer function predictions for two trajectory categories, namely anterior trajectory and inferior trajectory in the feet-first orientation at chest landmark. Mean values for each trajectory category and category ratios were calculated.
Table S5: Temperature measurements at the tip of the lead for the phantom in a head-first, chest landmark position with the fourteen lead trajectories depicted in Figure 7.


