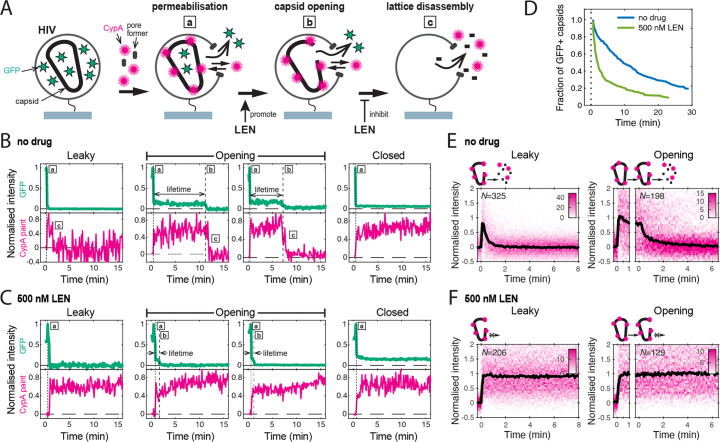
Figure 2. Single-molecule HIV capsid uncoating kinetics measured by TIRF microscopy.
(A) Schematic diagram of a viral particle at different stages of uncoating detected in the assay. HIV particles were produced using a proviral construct with internal GFP that is released from the viral Gag protein during maturation and packaged as a solution phase marker inside the two compartments bound by the viral membrane and the capsid, respectively. These GFP-loaded HIV particles are immobilised on the coverslip surface and permeabilised in the presence of AF568-labelled CypA while recording fluorescence traces at the locations of individual HIV particles by TIRF microscopy. Permeabilisation of the viral membrane (step a) with a pore-forming protein leads to loss of ~80–90% of the GFP signal corresponding to the pool of GFP outside the capsid. AF568-CypA molecules diffuse through the membrane pores and bind to the capsid to reach a level that is proportional to the number of CA subunits in the capsid. Capsid opening (step b) leads to loss of the residual GFP that is inside the capsid. CA lattice disassembly (step c) is apparent from the rapid loss of the CypA paint signal. (B, C) Example GFP release (blue-green) and CypA paint (magenta) traces for particles with capsids that are already leaky (i.e. contain defects and release all GFP in one step), undergo opening at various times after permeabilisation or remain closed throughout the observation period. In the absence of drug (B), the CypA paint intensity decays rapidly when the capsid is no longer closed (complete loss of GFP signal). In the presence of 500 nM LEN (C), the CypA paint signal remains constant even when the GFP signal is completely lost showing that the drug stabilises the ruptured capsid. (D) Analysis of the capsid lifetimes from all single-molecule GFP release traces in the field of view to yield capsid survival curves (including ‘opening’ and ‘closed’, excluding ‘leaky’). The faster decay in the presence of 500 nM LEN compared to no drug control shows that LEN induces rupture of the capsid. Data from a representative experiment (total number of traces): no drug (615); 500 nM LEN (281). (E, F) Analysis of all single-molecule CypA paint traces to yield heatmaps (magenta) and median traces (black line) of the CypA intensity measured at particles with leaky (left) or opening (right) capsids in the absence (E) or presence of 500 nM LEN (F). LEN prevents dissociation of CA from the lattice of capsids that are no longer closed cones. The number of HIV particles (N) for each condition is specified in the top left corner of the corresponding heatmap.


