1. Preamble
Trends in the epidemiology and outcomes for heart failure (HF) are critically important and have not been explicated and compiled in a comprehensive contemporary document. There have been concerning trends in the incidence, prevalence, mortality, and HF hospitalization rates over the past decade. Therefore, the specific goals of this document are:
To establish a clear and comprehensive synthesis of trends in HF epidemiology and outcomes as a foundation for clinical care, resource allocation, and research.
To address differences in HF epidemiology and outcomes according to sex, race, ethnicity, and age.
To identify current knowledge gaps and limitations in HF epidemiologic data and to forecast the future impact and burden of HF.
The emphasis of the document is epidemiological trends in the United States (US), but when applicable, global trends are also included.
1.1. Writing Committee Composition and Methodology
The Heart Failure Society of America (HFSA) commissioned this document and selected the members of the Data in Heart Failure Committee. The Data in Heart Failure Committee (Biykem Bozkurt, MD, PhD [Chair], Kelly Bosak, PhD, APRN, ANP-BC, Gregg C. Fonarow, MD, Jennifer E. Ho, MD, Paul Heidenreich, MD, Alanna A. Morris, MD, MSc, Robert Page III, PharmD, Josef Stehlik, MD, MPH, Lynne Stevenson, MD), identified the additional 18 writing group members of the document. The writing committee consisted of individuals with domain expertise in HF, both the epidemiology of and outcomes in HF. Each member completed writing assignments as primary or secondary authors, and HFSA Data Committee members served as senior advisors for primary or secondary authors for assigned sections and provided guidance and edits. The writing group members focused on contemporary data and recent publications, when available, and validated data sources. The writing group members reviewed and synthesized available published data regarding HF epidemiology, incidence, prevalence, rates of HF and all-cause mortality and hospitalizations, and differences according to sex, race/ethnicity, and age. A succinct and high-level summary is included for each section.
The writing group convened virtual consensus conferences to review and build consensus on the available data. The work of the writing committee was accomplished via teleconference and Web conference meetings, along with email correspondence. The review work was distributed among subgroups of the writing committee based on interest and expertise. The proceedings of the workgroups were then assembled, resulting in the final document. Terminologies for sex, gender, race, and ethnicity were used in reference to the terminologies used in the original publication. All members reviewed and approved the final document.
2. Incidence, Prevalence, and Lifetime Risk Estimates of HF in the United States
2.1. Summary
Approximately 6.7 million Americans over 20 years of age have HF, and the prevalence is expected to rise to 8.5 million Americans by 2030.
The lifetime risk of HF has increased to 24%; approximately 1 in 4 persons will develop HF in their lifetime.
The prevalence rate of HF among US adults is approximately 1.9% to 2.6% for the overall population and is higher among older patients. The prevalence rate is expected to increase to 8.5% among 65- to 70-year-olds.
The prevalence of HF with preserved ejection fraction (HFpEF) across populations is increasing, with significant differences by race and ethnicity, and men experience a higher lifetime risk HFpEF.
Approximately 33% of the US adult population without known symptomatic HF is at-risk for HF (Stage A HF) and 24%–34% have pre-HF (Stage B HF). The risk of developing HF in individuals with obesity and hypertension has increased.
2.2. Lifetime Risk of HF
In the Framingham Heart Study (FHS) cohort, the lifetime risk of HF increased to 23.7% during the second 25-year epoch (1990–2014) from 19.0% in the first 25-year epoch (1965–1989) (Fig. 1, Table 1).
Fig. 1.
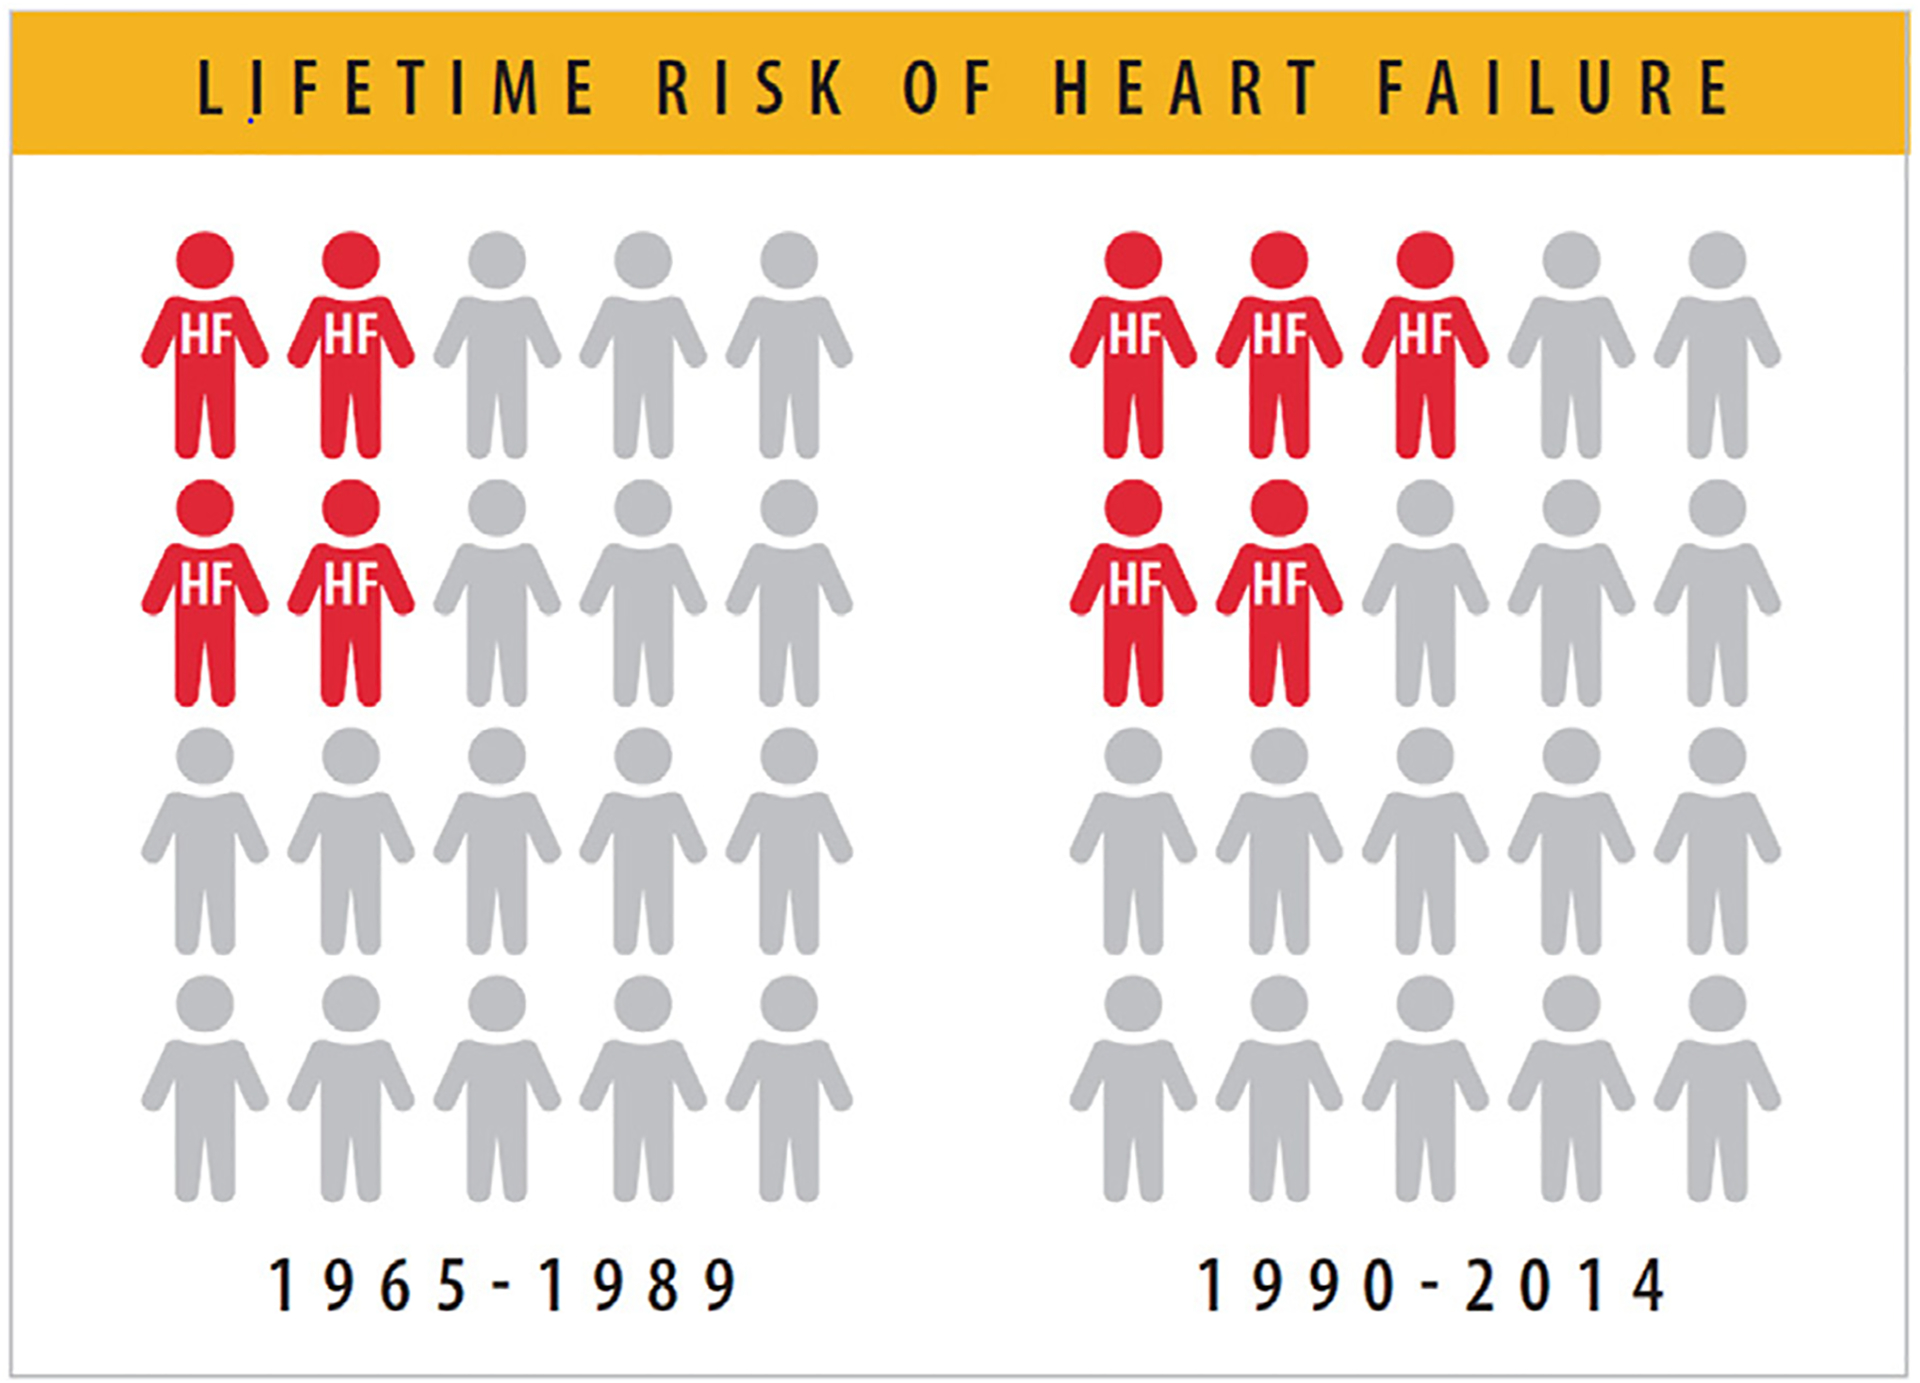
Lifetime risk of HF has increased from 1 in 5 to 1 in 4 people. HF = heart failure. Modified from Vasan RS, Enserro DM, Beiser AS, Xanthakis V. Lifetime risk of heart failure among participants in the Framingham Study. J Am Coll Cardiol 2022;79:250–63.
Table 1.
Estimation of Lifetime Risk of HF
| Author, publication year | Vasan 20221 | Huffman 20139 | Pandey 20182 |
|---|---|---|---|
| Years studied | Framingham Heart Study: 1965–2014 | Chicago Heart Association Detection Project in Industry: 1967–2003; Atherosclerosis Risk in Communities: 1987–2005; Cardiovascular Health Study: 1989 – 2004 |
Cardiovascular Health Study: Multiethnic Study of Atherosclerosis |
| Methods | Lifetime risk evaluated at up to 45 years of follow up | Lifetime risk for developing HF at index age 45 y to age 95 y (CHA) or through age 75 y (ARIC) with death free of HF as a competing event. | Lifetime risk at index age 45 y determined using a life-table analysis with a modified Kaplan-Meier method using death free of HF as a competing risk |
| Lifetime Risk for HF | 1965–1989:19.0% 1990–2014: 23.7% |
Chicago Heart Association 30.2% for white men, 20.1% for Black men, 32.3% for white women, and 23.7% for Black women. Atherosclerosis Risk in Communities: 19.1% for White men, 21.3% for Black men, 13.4% for White women, 23.9% for Black women |
Men: 27.4%; Women: 23.8% Non-Black: 24.9%; Black: 22.4% |
| Lifetime Risk in HF Subtypes |
HF Subtypes from 1990–2014 HFpEF: 19.3% HFrEF: 11.4% |
N/A | HFpEF: Men: 10.4%, Women 10.7% Black: 7.7%, Non-Black: 11.2% HFrEF: Men 10.6%; Women 5.8% Black: 7.7%, Non-Black: 7.9% |
CHA = Chicago Heart Association Detection Project in Industry; CHS = Cadiovascular Health Study, FHS = Framingham Heart Study; HF = heart failure; HFpEF = heart failure with preserved ejection fraction; HFrEF = heart failure with reduced ejection fraction (HFpEF); MESA = Multi-Ethnic Study of Atherosclerosis
Vasan RS, Enserro DM, Beiser AS, Xanthakis V. Lifetime Risk of Heart Failure Among Participants in the Framingham Study. JAm Coll Cardiol. 2022 Jan 25;79(3):250–63.
Pandey A, Omar W, Ayers C, LaMonte M, Klein L, Allen NB, et al. Sex and Race Differences in Lifetime Risk of Heart Failure with Preserved Ejection Fraction and Heart Failure With Reduced Ejection Fraction. Circulation. 2018 Apr 24;137(17):1814–23.
Huffman MD, Berry JD, Ning H, Dyer AR, Garside DB, Cai X, et al. Lifetime Risk for Heart Failure Among White and Black Americans: Cardiovascular Lifetime Risk Pooling Project. JAm Coll Cardiol. 2013 Apr 9;61(14):1510–7.
During the second 25-year epoch (1990–2014), the lifetime risk of HFpEF (19.3%) was higher than HF with reduced ejection fraction (HFrEF) (11.4%).1 In the FHS Cohort, the lifetime risk of HF has risen across participants of both sexes (from 18.9% to 22.6% in women and from 19.1% to 25.3% in men).1 Similarly, the lifetime risk of HF in the Multi-Ethnic Study of Atherosclerosis (MESA) and Cardiovascular Health Study (CHS) cohort ranged from 23.8% in women to 27.4% in men and varied by race and ethnicity (Table 1; Fig. 2). Among HF sub-types, the lifetime risk of HFpEF was greater than the lifetime risk of HFrEF in women (10.7% vs 5.8%, respectively), whereas lifetime risk of HFpEF was similar to HFrEF in men (Fig. 2),2 but these vary by race and ethnicity.3
Fig. 2.
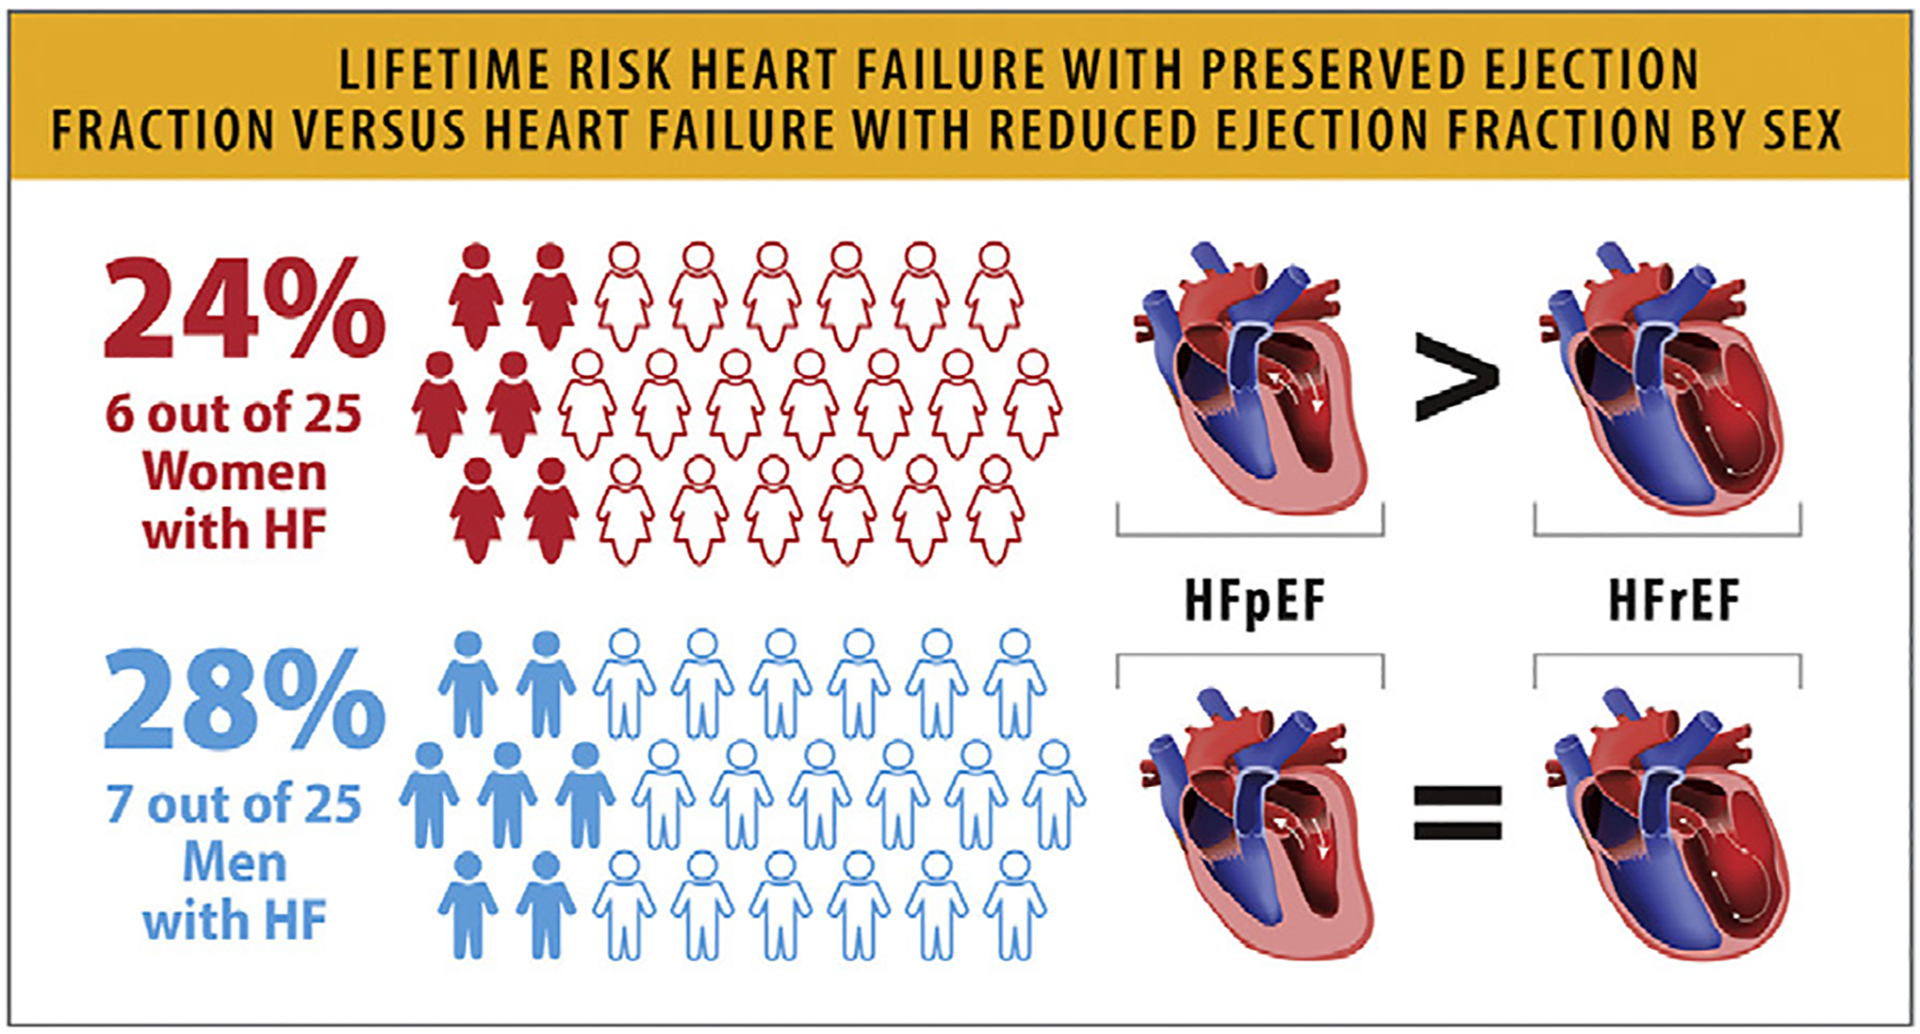
Lifetime risk of HFpEF vs HFrEF by sex. HF = heart failure; HFpEF = heart failure with preserved ejection fraction; HFrEF = heart failure with reduced ejection fraction. Modified from Pandey A, Omar W, Ayers C, LaMonte M, Klein L, Allen NB, et al. Sex and race differences in lifetime risk of heart failure with preserved ejection fraction and heart failure with reduced ejection fraction. Circulation 2018;137:1814–23.
The risk of developing HF in overweight or obese body mass index categories and participants with intermediate blood pressure (systolic blood pressure ≥130 but <140 mm Hg or diastolic blood pressure ≥80 but <90 mm Hg); and/or hypertension was 24%–62% higher during the second epoch (1990–2014) relative to corresponding risk factor strata in the first epoch (1965–1989).1
The 10-year risk of HF, assessed via the Pooled Cohort Equations to Prevent Heart Failure among a representative sample of Americans from the National Health and Nutrition Examination Survey (NHANES), increased from 1.0% in 1999 to 3.0% in 2015.4
2.3. Incidence of HF
The incidence of HF varies according to different populations and different time frames (Table 2). Differences in data sources, population demographics and composition (including age, comorbidities, sex, race, and ethnicity), HF ascertainment methodology, and periodic differences likely play a role in this variation. A decline in overall HF incidence has been reported in Medicare beneficiaries over the age of 65 from 35.7/1000 person-years (PY) to 6.5/1000 PY from 2011 to 2016 (Table 2).5 Olmsted County in Minnesota, with relatively homogeneous demographics, also demonstrated a declining incidence from 2000 to 2010 (Table 2).6 The 3-generational FHS population, which is predominantly composed of participants of White race, did not have a changing incidence from 1990 to 2009.7 On the other hand, a modest increased incidence of HF has been reported in the Atherosclerosis Risk in Communities (ARIC) cohort with populations intentionally selected from 4 different cohorts with more diverse demographic and geographic characteristics (Table 2). In the ARIC study, there was an initial focus on atherosclerosis and complications, and HF adjudication was slightly different from other studies. Some of the variations in the overall incidence and prevalence of HF across different studies can be explained by the variation of representation of HFpEF in different populations as it becomes the dominant phenotype.8 A trend for increasing prevalence of HFpEF was recognized across different populations. The rise in HFpEF prevalence can be attributed to increasing risk factors for HF, such as obesity and diabetes, but also to the difficulty of discrimination of HF from other causes of dyspnea and leg swelling in patients with obesity or large body habitus.
Table 2.
Incidence Estimates of Heart Failure in the United States
| Author, publication year | Tsao, 20187 | Gerber, 20156 | Khera, 201712 | Chang, 20183 | Khera, 20205 |
|---|---|---|---|---|---|
| Years studied | 1990–2009 | 2000–2010 | 2002–2013 | 2005–2014 | 2011–2016 |
| Population | Participants in FHS and CHS | Olmsted County, Minnesota | Medicare beneficiaries over 65 years of age | Participants in ARIC aged 55 or older | Participants in FHS and CHS |
| Diagnostic criteria | Physician adjudicated | Inpatient or outpatient ICD 9 codes with case validation in a subset of patients | Inpatient or outpatient ICD 9 codes | Random sample of eligible heart failure hospitalizations with ICD 9 codes with manual abstraction. | Medicare beneficiaries over 65 years of age |
| Incidence of All Heart Failure | 1990–1999: 19.7 per 1.000PY 2000–2009: 18.9 per 1.000PY |
Age and sex-adjusted incidence of HF 3/1000PY in 2000 to 2/1000PY in 2010 | 38.7 per 1,000 persons in 2002 to 26.2 per 1,000 persons in 2013 |
All Heart Failure: Black Women: 17.2/1,000 PY; Black Men: 19.9/1000PY; White Women: 10.8/1000 PY; White Men: 14/1000 PY |
Inpatient or outpatient ICD 9 and 10 codes |
| Change in HF Incidence | No statistically significant change | Mean annual percentage change: −4.6% 37.5% decline over study term |
32% decline | Over the 10-year study period: +4.3% in Black women, +3.7% in Black men, +1.9% in White women, +2.6% in White men |
35.7 per 1,000 persons in 2011 to 26.5 per 1,000 persons in 2016. |
| Incidence of HF Subtype (per 1,000PY) | HFpEF: 2000–2009: 6.8 HFrEF: 2000–2009: 6.2 |
HFpEF: in Women: 2002: 1.7; 2010:1.4 HFpEF: in Men: 2002: 1.4; 2010: 1.0 HFrEF: for Women: 2002: 1.5; 2010: 0.8 HFrEF: in Men: 2002:1.8; 2010:1.5 |
N/A | HFpEF: Black Women 12.3, Black men 9.7 White Women 7.8, White Men 6.3 HFrEF: Black Women 13.9, Black Men: 24.8 White Women: 5.5, White Men 12.3 |
26% reduction |
| Change in HF Subtype Incidence over time | Comparing 2000–2009: HFpEF: +53% HFrEF: −20% |
From 2000–2010 HFpEF: −28% HFrEF: −45% |
N/A | HFpEF: Black Women: +8.2%, Black men: +5.7% White Women: +5.9%, White Men: +4.6% HFrEF: Black Women: +2%, Black men: +2.8% White Women: no change, White Men: +2.6% |
N/A |
ARIC = Atherosclerosis Risk in Communities Study; CHS = Cardiovascular Health Study; FHS = Framingham Heart Study; HF = heart failure; HFpEF = heart failure with preserved ejection fraction; HFrEF = heart failure with reduced ejection fraction (HFpEF); ICD = International Classification of Diseases; PY = patient years
Chang PP, Wruck LM, Shahar E, Rossi JS, Loehr LR, Russell SD, et al. Trends in Hospitalizations and Survival of Acute Decompensated Heart Failure in Four US Communities (2005–2014): ARIC Study Community Surveillance. Circulation. 2018 Jul 3;138(1):12–24.
Khera R, Kondamudi N, Zhong L, Vaduganathan M, Parker J, Das SR, et al. Temporal Trends in Heart Failure Incidence Among Medicare Beneficiaries Across Risk Factor Strata, 2011 to 2016. JAMA Netw Open. 2020 Oct 1;3(10):e2022190.
Gerber Y, Weston SA, Redfield MM, Chamberlain AM, Manemann SM, Jiang R, et al. A Contemporary Appraisal of The Heart Failure Epidemic in Olmsted County, Minnesota, 2000 to 2010. JAMA Intern Med. 2015 Jun;175(6):996–1004.
Tsao CW, Lyass A, Enserro D, Larson MG, Ho JE, Kizer JR, et al. Temporal Trends in the Incidence and Mortality Associated with Heart Failure with Preserved and Reduced Ejection Fraction. JACC Heart Fail. 2018 Aug;6(8):678–85.
Khera R, Pandey A, Ayers CR, Agusala V, Pruitt SL, Halm EA, et al. Contemporary Epidemiology of Heart Failure in Fee-For-Service Medicare Beneficiaries Across Healthcare Settings. Circ Heart Fail. 2017 Nov;10(11):e004402.
After age 45, HF incidence ranges from 6.0/1000 PY among the ARIC participants (between 1987 and 2005) to 7.9/1000 PY among the Chicago Heart Association Detection Project in Industry participants (between 1967 and 2003). After the index age of 65 years, the incidence is significantly higher, at 21.1/1000 PY as reported in the CHS participants (between 1989 and 2004).9
2.4. Prevalence of HF
According to data from NHANES 2017–2020, approximately 6.7 million Americans over 20 years of age have HF, which has increased from former reports of 6.0 million (Fig. 3). HF prevalence progressively rises across each decade of life, with an up to 4-fold higher prevalence (8.0%–9.1%) among US adults older than 65 years compared with age less than 65. The overall prevalence of HF among US adults has ranged from 1.9% to 2.6% for the overall population based on self-reported data from NHANES (Table 3).10
Fig. 3.
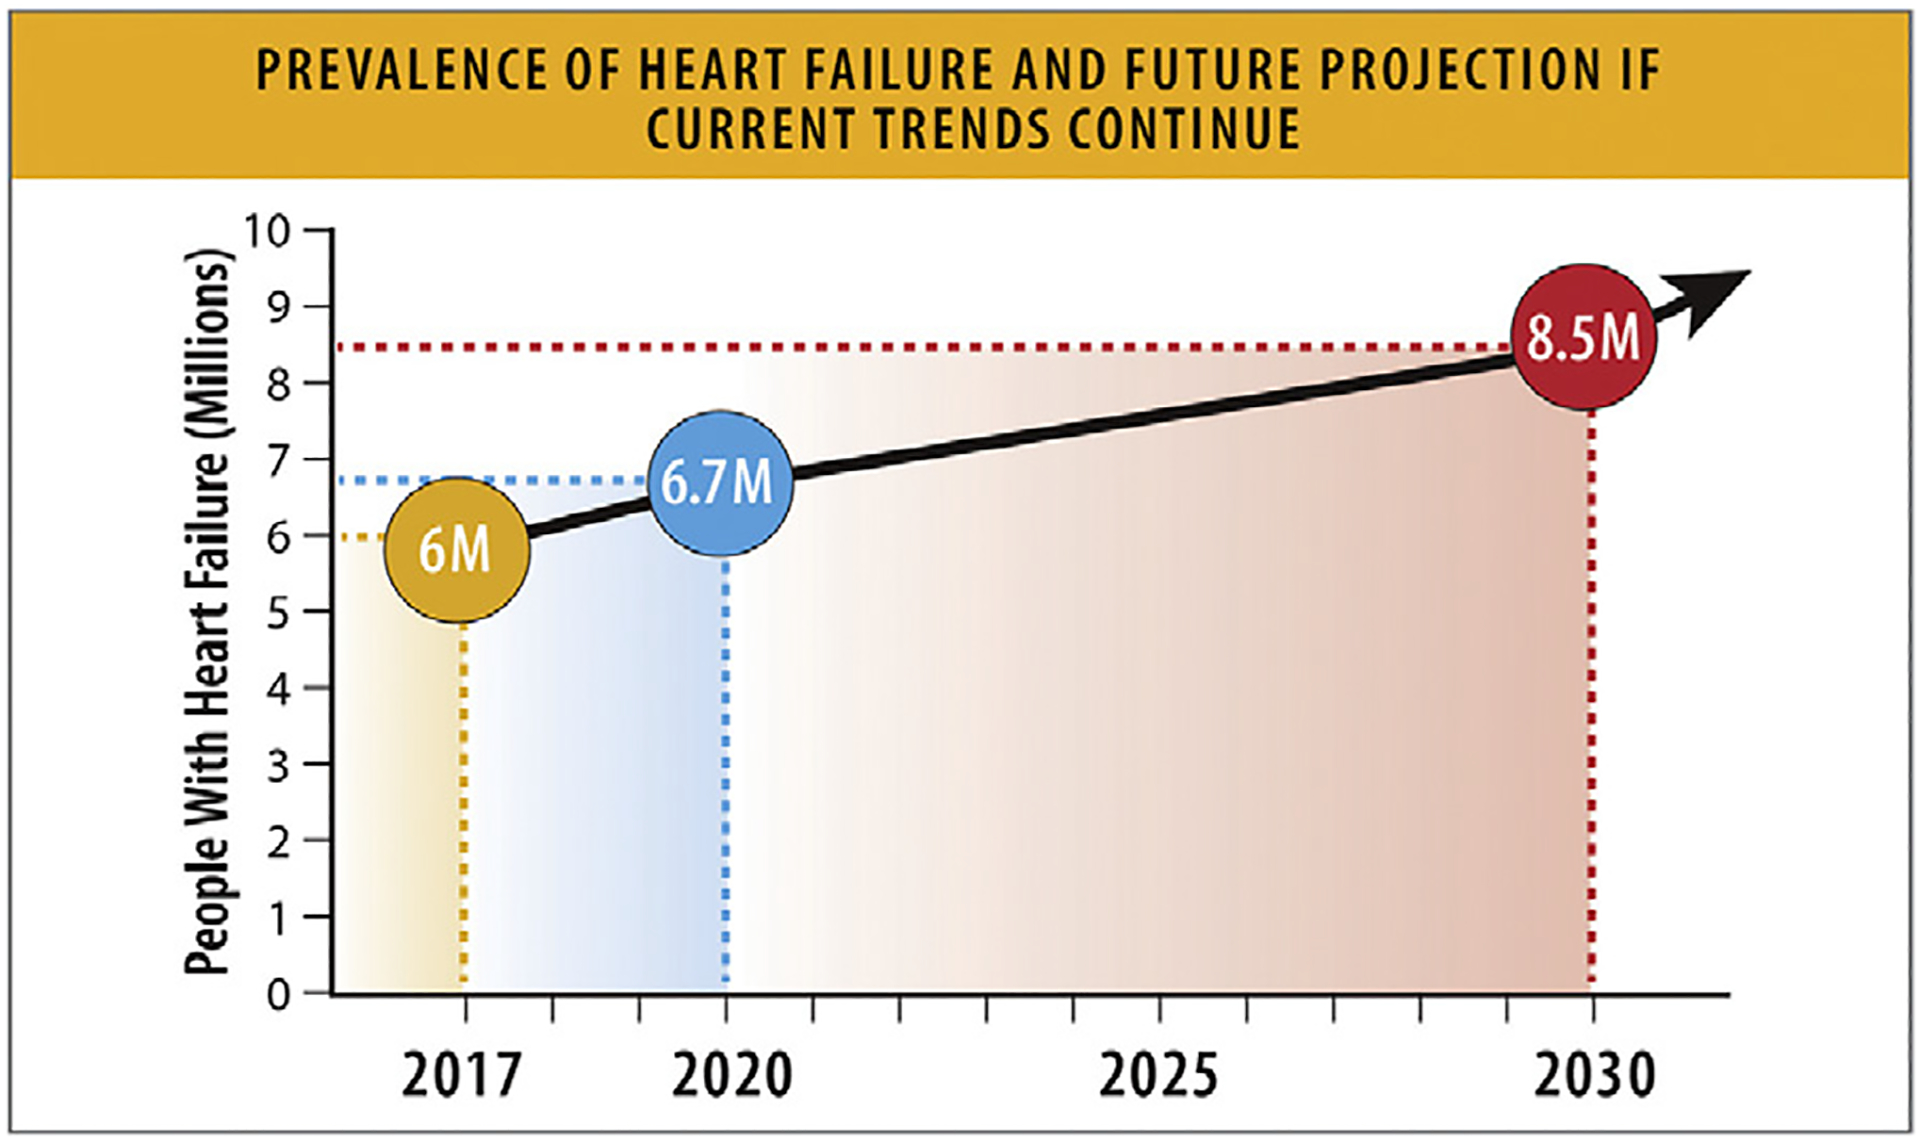
Prevalence of HF and future projection if current trends continue. HF = heart failure. Modified from Van Nuys KE, Xie Z, Tysinger B, Hlatky MA, Goldman DP. Innovation in heart failure treatment: life expectancy, disability, and health disparities. JACC Heart Fail 2018;6:401–9 and Heidenreich PA, Albert NM, Allen LA, Bluemke DA, Butler J, Fonarow GC, et al. Forecasting the impact of heart failure in the United States: a policy statement from the American Heart Association. Circ Heart Fail 2013;6:606–19.
Table 3.
Prevalence of HF in the United States
| Author, publication year | Siontis 202210 | Siontis 202210 | Rethy 202211 | Khera, 201712 | Chang, 20183 |
|---|---|---|---|---|---|
| Years studied | 1999–2018 | 1999–2018 | 1/2001–12/31/2016 | 2002–2013 | 2005–2014 |
| Population | NHANES survey (all participants) | NHANES survey of patients over the age of 65 | NHANES survey of nonpregnant adults 35 years or older | Medicare beneficiaries over 65 years of age | Participants in ARIC aged 55 or older |
| Diagnostic criteria | Patient self-report | Patient self-report | Patient self-report | Inpatient or outpatient ICD 9 codes | Random sample of eligible heart failure hospitalizations with ICD 9 codes with manual abstraction |
| Prevalence | 19 per 1000 persons in 1999 26 per 1000 persons in 2017 No significant change overtime |
55 per 1000 persons in 1999 98 per 1000 persons in 2004 64 per 1000 persons in 2017 |
31.8 per 1000 persons in 2001–2005 30.4 per 1000 persons in 2013–2016 No significant change overtime |
162 per 1,000 in 2004 172 per 1,000 in 2013 Significant increase over time |
Black Women: 30.5/1,000PY Black Men: 38.1/1,000PY White Women: 15.2/1,000PY White Men: 20.7/1,000PY Significant increase over the study period (+1.9% per year in White women to +4.3% per year in Black women) |
ARIC = Atherosclerosis Risk in Communities Study; HF = heart failure; ICD = International Classification of Diseases; NHANES = National Health and Nutrition Examination Survey; PY = person years
Chang PP, Wruck LM, Shahar E, Rossi JS, Loehr LR, Russell SD, et al. Trends in Hospitalizations and Survival of Acute Decompensated Heart Failure in Four US Communities (2005–2014): ARIC Study Community Surveillance. Circulation. 2018 Jul 3;138(1):12–24.
Siontis GC, Bhatt DL, Patel CJ. Secular Trends in Prevalence of Heart Failure Diagnosis over 20 Years (from the US NHANES). Am J Cardiol. 2022 Jun 1;172:161–4.
Rethy L, Petito LC, Vu THT, Kershaw K, Mehta R, Shah NS, et al. Trends in the Prevalence of Self-reported Heart Failure by Race/Ethnicity and Age From 2001 to 2016. JAMA Cardiol. 2020 Dec 1;5(12):1425–9.
Khera R, Pandey A, Ayers CR, Agusala V, Pruitt SL, Halm EA, et al. Contemporary Epidemiology of Heart Failure in Fee-For-Service Medicare Beneficiaries Across Healthcare Settings. Circ Heart Fail. 2017 Nov;10(11):e004402.
Based on self-report among participants of NHANES, the prevalence of HF for the overall population remained similar over time, from 31.8/1000 persons in 2001–2005 to 30.4/1000 persons in 2013–2016.11 However, among participants over the age of 65, the prevalence of HF has increased from 55/1000 persons in 1999 to 98/1000 persons in 2004 and declined to 64/1000 persons in 2017.10 By another report, among Medicare beneficiaries over the age of 65, the prevalence of HF assessed by claims-based diagnosis in the inpatient or outpatient setting increased from 162/1000 in 2004 to 172/1000 in 2013 (Table 3).12
Among participants of the ARIC study above the age of 55, the age-adjusted prevalence of HF was higher among Black men (38.1/1000 PY) and Black women (30.5/1000 PY) vs White men (20.7/1000 PY) and White women (15.2/1000 PY) from 2005 to 2014.3 Prevalence of HF rose significantly (between 2% to 5% increase per year) across the study period. Prevalence of HF remains understudied in American Indian and Alaska Native populations (Table 3).13
2.5. Future Burden of HF
The prevalence of HF is expected to rise to 8.5 million Americans in 2030, based on NHANES data and US Census Bureau projected population counts (Fig. 3).14 The impact of coronavirus disease 2019 (COVID-19) on future risk of HF is still being assessed and may further increase the burden of HF.
If HF prevalence remains constant by age, the percentage of the US population with HF is projected to rise from 2.4% in 2012 to 3.0% in 2030 (Fig. 3).15 By another estimate, based on 2010–2012 Health and Retirement Study historical data, the prevalence of HF is expected to increase from 4.3% in 2010 to 8.5% in 2030 among 65- to 70-year-olds.14
2.6. HF Prevalence across HF Stages
Data are substantially limited regarding the prevalence of HF stratified by HF stages: Stage A (at-risk) HF, Stage B (pre-HF), Stage C (clinical HF), and Stage D (advanced HF). Additionally, the criteria and definitions of HF stages are evolving, adding further complexity to prevalence estimates by HF stages.16,17
In an analysis of the Coronary Artery Risk Development in Young Adults cohort, the prevalence of Stage A and B HF increased with age, from the year-5 follow-up cohort (mean age 30 years) to the year-30 follow-up cohort (mean age 55 years), from 24% to 76% in Black men, 13% to 64% in White men, 34% to 81% in Black women, and 13% to 56% in White women.18
In the FHS (mean age: 51 ± 16 years), the prevalence of Stage A HF was 36.5%, Stage B was 24.2%, Stages C/D were 1.2%, and healthy without HF or HF risk was 38% (Fig. 4).19
Fig. 4.
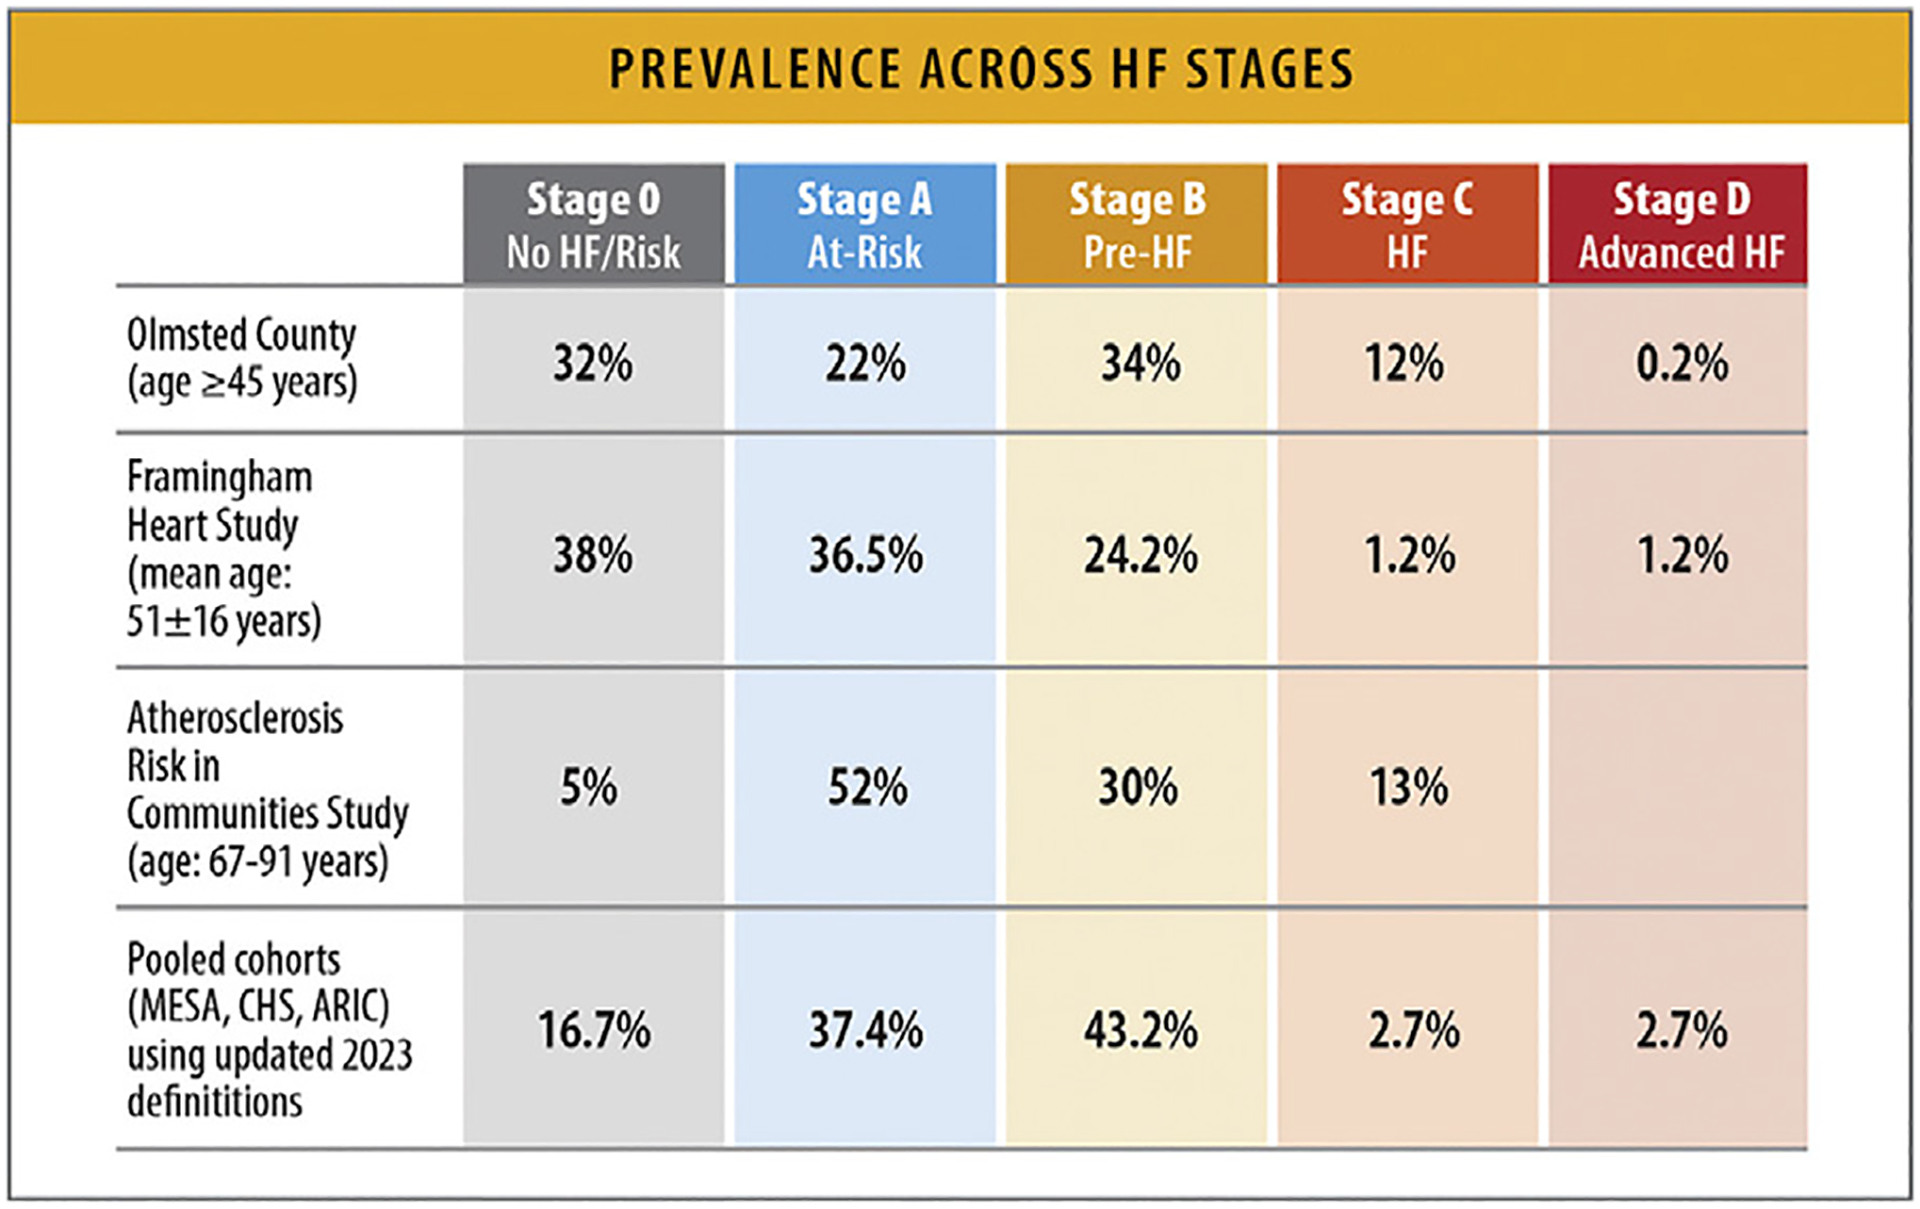
Prevalence across HF stages. ARIC = Atherosclerosis Risk in Communities Study; CHS = Cardiovascular Health Study; HF = heart failure; FHS = Framingham Heart Study; MESA = Multi-Ethnic Study of Atherosclerosis. Modified from Xanthakis V, Enserro DM, Larson MG, Wollert KC, Januzzi JL, Levy D, et al. Prevalence, neurohormonal correlates, and prognosis of heart failure stages in the community. JACC Heart Fail 2016;4:808–15; and Ammar KA, Jacobsen SJ, Mahoney DW, Kors JA, Redfield MM, Burnett JC, et al. Prevalence and prognostic significance of heart failure stages: application of the American College of Cardiology/American Heart Association heart failure staging criteria in the community. Circulation 2007;115:1563–70; and Shah AM, Claggett B, Loehr LR, Chang PP, Matsushita K, Kitzman D, et al. Heart failure stages among older adults in the community: the Atherosclerosis Risk in Communities Study. Circulation 2017;135:224–40.
In a study from Olmsted County, Minnesota, among participants aged 45 years and older, the prevalence of Stage A HF was 22%, Stage B was 34%, Stage C was 12%, and Stage D was 0.2%. Healthy without HF or HF risk (Stage 0) was 32% (Fig. 4).20
Among older patients aged 67–91 years from the ARIC study, 52% had Stage A HF, 30% had Stage B HF, and 13% had Stage C HF, with only 5% of participants being without HF risk factors of structural heart disease (Fig. 4).21
Among ARIC study participants (mean age: 75.8 years) without prevalent HF, but with HF risk factors (Stage A), a strategy using abnormal N-terminal pro-B-type natriuretic peptide or high-sensitivity troponin levels and abnormal cardiac structure/function by echocardiography for the new definition of Stage B HF17 reclassified 81.3% of the individuals from Stage A to Stage B, with 21.1% meeting criteria for elevated biomarkers only. Incorporating biomarkers based on the new HF guideline reclassified approximately 1 in 5 older adults with Stage A to Stage B (Fig. 4).22
Among middle-aged Black participants in the ARIC cohort, 20% had Stage A HF, 67% had Stage B HF, and 8.6% had Stage C/D HF. Approximately 98% of the participants classified as Stage B HF had evidence of left ventricular hypertrophy at baseline.23
A pooled analysis from the MESA, CHS, and ARIC cohorts, the 2023 updated AHA/ACC/HFSA definitions of HF stages, which incorporates elevation in cardiac biomarkers to classify pre-HF or Stage B HF, identified 37.4% of participants with Stage A, 43.2% with Stage B, and 2.7% with Stage C/D HF. Compared with 2013, the 2022 updated definition identified a greater proportion of individuals with Stage B HF with a disproportionate increase in prevalence noted among women as well as Hispanic and Black individuals (Fig. 4).24 With the exception of the FHS population, most of these cohorts represented homogenous populations.
2.7. Trends in Increasing Risk Factors for HF
The incidence and burden of risk factors for HF is increasing over time. The proportion of individuals with HF exhibiting 3 or more comorbidities increased from 68% in 2002–2004 to 87% in 2012–2014. The risk factors with the greatest increases in prevalence are hypertension, obesity, and smoking.25
At least one-third of US adults can be defined as Stage A HF or at-risk for HF and have at least 1 HF risk factor.19–21,26 An increasing number of risk factors is associated with increased risk of HF, particularly for minoritized racial and ethnic groups.27
According to data from Olmsted County, Minnesota, between 1979 and 2002, the prevalence of hypertension, obesity, and smoking increased over time. Population attributable risk (PAR) for developing HF was highest for coronary heart disease (CHD) and hypertension; each accounted for 20% of HF cases in the population, although CHD accounted for the greatest proportion of cases in men (PAR 23%) and hypertension was of greatest importance in women (PAR 28% in women vs 13% in men). PAR for tobacco smoking was 14%, obesity was 12%, and diabetes was 12%.28 Despite the decline in myocardial infarction incidence and severity,28,29 incidence of HF following infarction remains unchanged.30
The PAR% for hypertension, obesity, diabetes mellitus, and CHD vary according to race and ethnicity (Fig. 5). For HFpEF, approximately two-thirds of the PAR is associated with hypertension and obesity, whereas diabetes mellitus and CHD make up approximately one-fourth of the PAR%. For Black women, hypertension and obesity were associated with more than 90% of the PAR%, and for Hispanic women, the same risk factors were associated with approximately 72% of the PAR%. For HFrEF, hypertension showed the strongest PAR% in all 3 race/ethnicity groups.31 Not only is the contribution of risk factors of hypertension, diabetes, obesity, hypercholesterolemia, and smoking to incident HF greater in Black patients than White patients, but this difference seems to be increasing over time.32
Fig. 5.
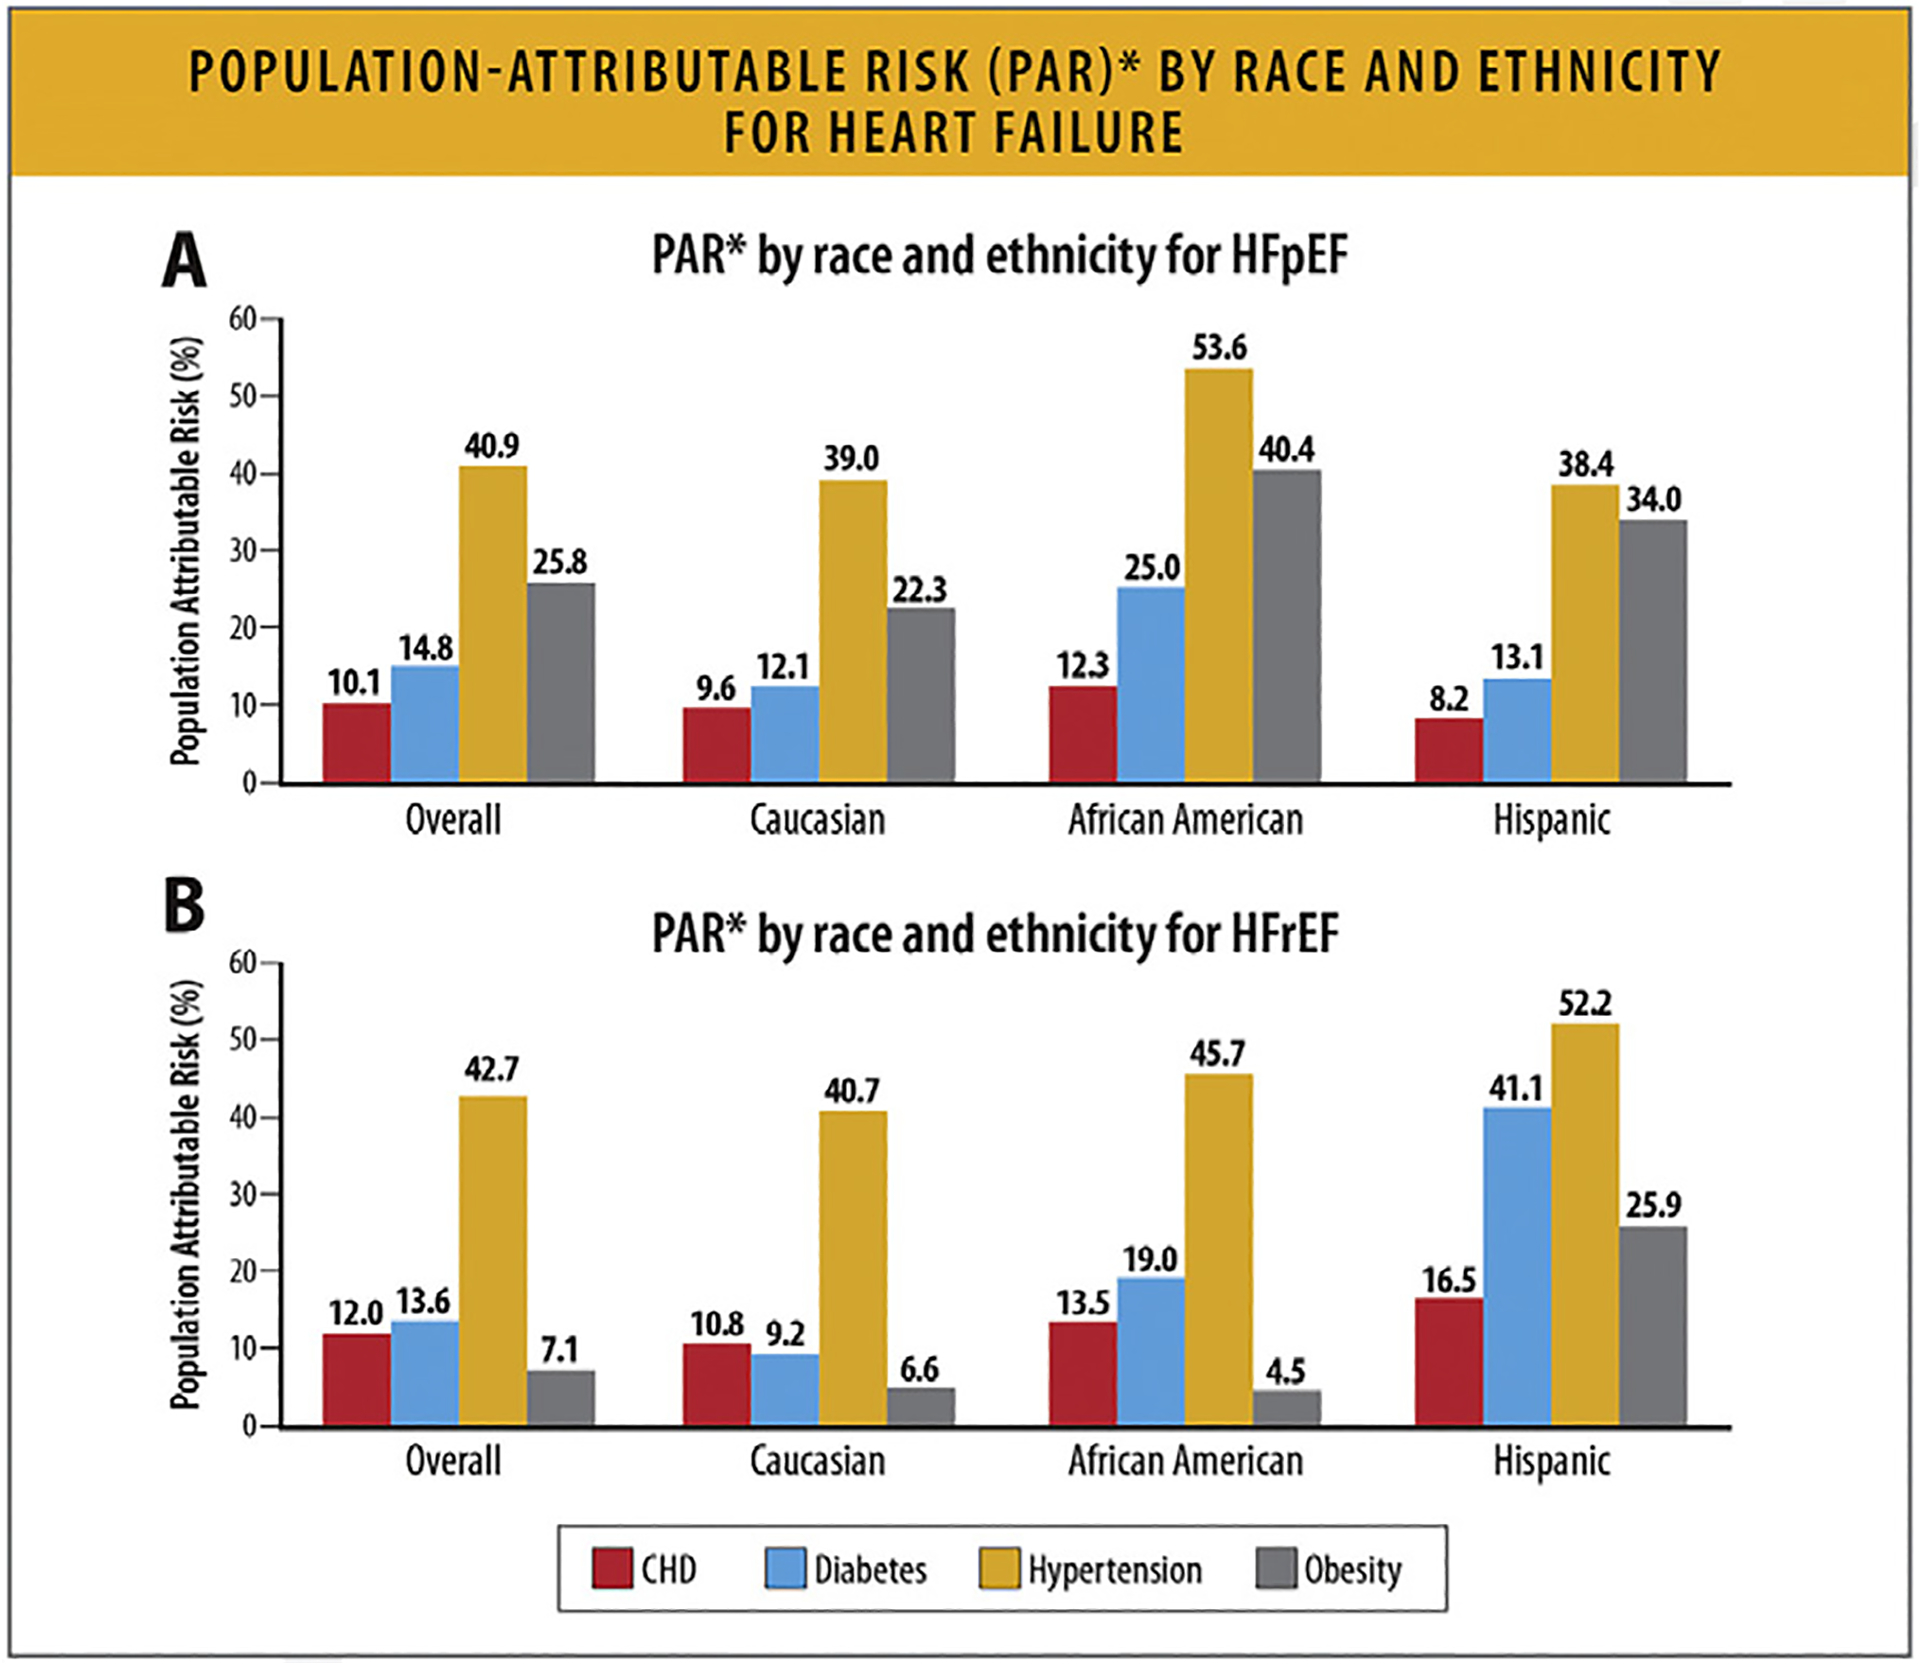
PAR* by race and ethnicity for HF. (A) PAR* by race and ethnicity for HFpEF. *Sum of PAR% within race/ethnicity may be >100% as incidence rates are not adjusted for other risk factors. (B) PAR* by race, and ethnicity for HFrEF. *Sum of PAR% within race/ethnicity may be >100% as incidence rates are not adjusted for other risk factors. CHD = coronary heart disease; HF = heart failure; PAR = population attributable risk. Modified from Eaton CB, Pettinger M, Rossouw J, Martin LW, Foraker R, Quddus A, et al. Risk factors for incident hospitalized heart failure with preserved versus reduced ejection fraction in a multiracial cohort of postmenopausal women. Circ Heart Fail 2016;9:e002883.
3. Topline Global Trends, Risk Factors, Comorbidities, and Prediction of Future HF State
3.1. Summary
Overall HF prevalence is increasing globally, but HF incidence, prevalence, etiology, and outcomes vary across different regions around the globe.
HF prevalence estimates around the world range from 1% to 3% of the overall population.
The prevalence of risk factors for HF including hypertension, obesity, and smoking are increasing globally over time. The proportion of individuals with HF exhibiting 3 or more comorbidities increased from 68% in 2002–2004 to 87% in 2012–2014.
Disparities in social determinants of health (SDoH) and health inequities are important HF risk factors and result in increased mortality and other adverse outcomes in individuals at risk for HF or with HF.
3.2. Worldwide Prevalence and Incidence of HF
Worldwide, it is estimated that 56.2 million (95% confidence interval [CI] 46.4 to 67.8 million) people are living with HF.33 Prevalence estimates around the world range from 1% to 3% of the overall population (Fig. 6).34 Globally, HF prevalence is increasing (per the Global Burden of Disease [GBD] study, a 29.4% increase from 2010 to 2019 [95% CI 27.5–34.2]) and varies greatly by country. HF prevalence is reportedly lowest in countries such as Thailand, South Korea, Japan, and the Philippines ranging from 0.4% to 2.0% (Fig. 6).34 Conversely, prevalence rates are highest for countries such as Spain, Taiwan, Indonesia, and Portugal ranging from 4.4% to 6.8%. No prevalence estimates are available from certain areas of the world including northern and sub-Saharan Africa.34
Fig. 6.
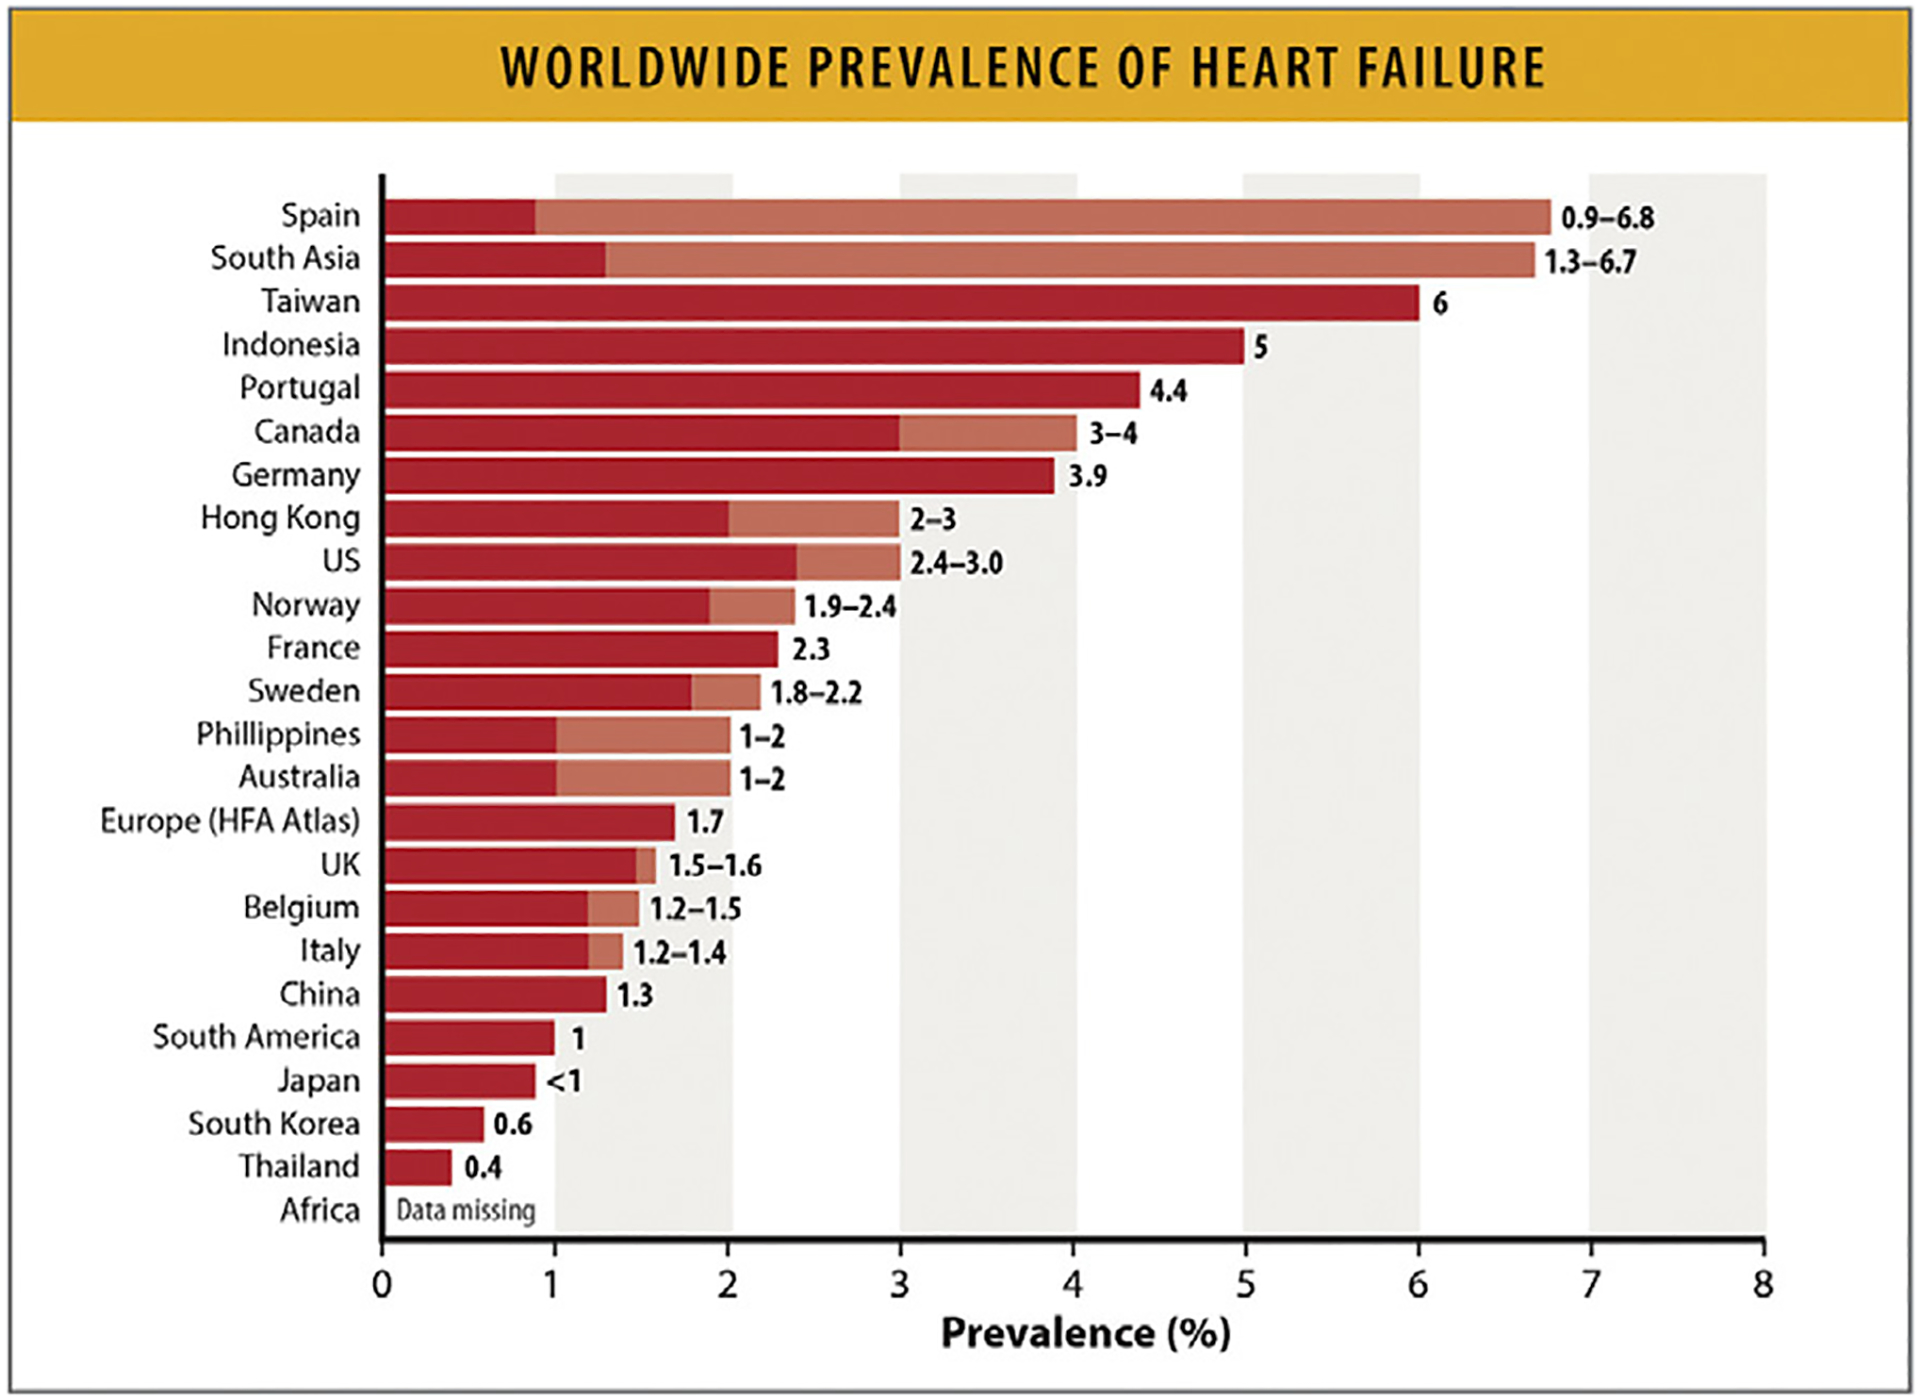
Worldwide prevalence of HF. Values represent age-adjusted prevalence rates from different countries (for some countries a prevalence range is noted and data are derived from more than 1 study. Shades of color represent the ranges of prevalence. HF = heart failure; HFA = Heart Failure Association; US = United States. Modified from Savarese G, Becher PM, Lund LH, Seferovic P, Rosano GMC, Coats AJS. Global burden of heart failure: a comprehensive and updated review of epidemiology. Cardiovasc Res 2023;118:3272–87.
Compared with prevalence estimates, global HF incidence data are very limited. Data from Europe and North America reflect an incidence of approximately 2–3 cases/1000 PY.
3.2.1. Differences in Age Distribution of Patients With HF.
People living with HFrEF from the Asia-Pacific regions and Latin American region are 10 years younger compared with European and North Americans living with HFrEF.35 In sub-Saharan Africa, more than one-half of the individuals with HF are under 55 years of age.35 Data from Denmark also suggest that the mean age at the time of HF onset is declining, with the proportion of individuals aged less than 50 years having doubled from 3% in 1995 to 6% in 2012.36 It is difficult to determine whether this apparently earlier onset may reflect improved awareness of both the public and the clinicians to early evidence of HF, or whether there are other biological or epidemiological factors playing a role.
Data are limited related to different phenotypes of HF according to ejection fraction (EF) classifications. Prevalence data drawn from different global databases for the 3 HF EF phenotypes are shown in Table 4.37–41
Table 4.
Prevalence of HF by EF Classes Among Different Populations
| HFrEF EF <40% |
HFmEF EF = 40–49% |
HFpEF EF ≥50% |
|
|---|---|---|---|
| European Society of Cardiology (ESC) long-term registry (N= 9138) 37 | 60% | 24% | 16% |
| Global Congestive Heart Failure Registry (G-CHF) (N=23,047) 38 | 54% | 21% | 24% |
| Asian Sudden Cardiac Death in Heart Failure Registry (ASIAN-HF) (N=6480) 39 | 81% | NR% | ~16% |
| Japan (N=1245) 40 | 36% | 21% | 43% |
| HF in Five African Countries: INTERnational Congestive Heart Failure Study (INTER-CHF) Study (N=1294) 48 | 53.7% | 30.1% | 16.2% |
| China Hypertension Survey (N=338) 41 | 40% | 23% | 36% |
| Management of Cardiac Failure program in Northern Sydney Australia (n=5236) 58 | 47.8% | 14.9% | 37.4% |
ASIAN-HF = Asian Sudden Cardiac Death in Heart Failure Registry; ESC = European Society of Cardiology; G-CHF = Global Congestive Heart Failure Registery; HF = heart failure; HFmrEF = heart failure with mildly reduced ejection fraction; HFpEF = heart failure with preserved ejection fraction; HFrEF = heart failure with reduced ejection fraction ; INTER-CHF = INTERnational Congestive Heart Failure Study; N = Total number of HF patients enrolled, NR = not reported.
Chioncel 0, Lainscak M, Seferovic PM, Anker SD, Crespo-Leiro MG, Harjola VP, et al. Epidemiology and One-Year Outcomes in Patients with Chronic Heart Failure and Preserved, Mid-Range And Reduced Ejection Fraction: An Analysis Of The Esc Heart Failure Long-Term Registry. Eur J Heart Fail. 2017 Dec;19(12):1574–85.
Joseph P, Dokainish H, McCready T, Budaj A, Roy A, Ertl G, et al. A Multinational Registry to Study the Characteristics and Outcomes of Heart Failure Patients: The Global Congestive Heart Failure (G-CHF) Registry. Am Heart J. 2020 Sep;227:56–63.
MacDonald MR, Tay WT, Teng THK, Anand I, Ling LH, Yap J, et al. Regional Variation of Mortality in Heart Failure with Reduced and Preserved Ejection Fraction Across Asia: Outcomes in the ASIAN-HF Registry. J Am Heart Assoc. 2020 Jan 7;9(1):e012199.
Shiga T, Suzuki A, Haruta S, Mori F, Ota Y, Yagi M, et al. Clinical Characteristics of Hospitalized Heart Failure Patients with Preserved, Mid-Range, and Reduced Ejection Fractions in Japan. ESC Heart Fail. 2019 Jun;6(3):475–86.
Hao G, Wang X, Chen Z, Zhang L, Zhang Y, Wei B, et al. Prevalence of Heart Failure and Left Ventricular Dysfunction in China: The China Hypertension Survey, 2012–2015. Eur J Heart Fail. 2019 Nov;21(11):1329–37.
Karaye KM, Dokainish H, ElSayed A, Mondo C, Damasceno A, Sliwa K, et al. Clinical Profiles and Outcomes of Heart Failure in Five African Countries: Results from INTER-CHF Study. Glob Heart. 2021;16(1):50.
Wang N, Hales S, Barin E, Tofler G. Characteristics and Outcome for Heart Failure Patients with Mid-Range Ejection Fraction. J Cardiovasc Med (Hagerstown). 2018 Jun;19(6):297–303.
3.3. Global Trends in HF Risk Factors, Etiology, Comorbidities, and SDoH
Globally, leading risk factors for developing incident HF include advancing age, ischemic heart disease, hypertension, obesity, diabetes mellitus, and smoking.26,42–46 Ischemic etiology is more often identified as an underlying cause of HF than nonischemic etiology in Europe and North America (>50%), whereas nonischemic cardiomyopathy is identified as the most common cause in the Caribbean, sub-Saharan Africa, and Latin America.47 In the largest HF study in Africa that included in- and outpatients from the West, East, North, Central and South African subregions, the most common etiologies of HF were hypertensive heart disease (35%) and ischemic heart disease (20%).48 Risk factors vary according to age, race, ethnicity, and HF subtype.42,47,49,50 Ongoing research is identifying inflammatory signals and fibrosis markers, as well as genomic and proteomic risk factors for HF.51–53
Disparities in SDoH, including structural racism, inequities of living conditions, risk assessment and control, access to healthy food, insurance, care, and resources, and distributions of power and money impact an individual’s health and HF risk across the globe in different regions of the world.54 Lower levels of income, support, and educational attainment have been associated with higher rates of incident myocardial infarction, stroke, and cardiovascular death in individuals with HF.55
Area deprivation is associated with a higher risk of HF, just as neighborhood redlining (a discriminatory practice in which services are withheld from potential customers who reside in neighborhoods classified as “hazardous” to investment) has been long associated with an increased risk of cardiovascular disease.56–58
4. HF Estimates by Race/Ethnicity, Age, and Sex
4.1. Summary
The incidence and prevalence of HF is higher among Black individuals compared with other racial and ethnic groups. The prevalence of HF has increased among Black and Hispanic individuals over time.
The prevalence of HF is higher among young and middle-aged Black adults compared with young and middle-aged White adults.
In the overall population, HF is most prevalent among adults greater than 60 years old.
There are important sex differences in HF risk factors. Diabetes mellitus, hypertension, and tobacco use have a stronger association with HF in women, while CHD has a stronger association with HF in men.
The global number of HF cases has increased with more HF cases in women compared with men.
4.2. HF Prevalence and Incidence by Race/Ethnicity
The incidence of HF varies according to race and ethnicity. In MESA, Black individuals had the highest HF incidence rate (4.6/1000 PY ) (Fig. 7).59 Hispanic, White, and Chinese individuals had incidence rates of 3.5, 2.4, and 1.0/1000 PY, respectively. In the Southern Community Cohort Study, Black women, Black men, White women, and White men had similar incidence rates (35.6, 34.9, 34.8, and 37.3/1000 PY, respectively).60 In NHANES, the prevalence of HF was highest for non-Hispanic Black individuals followed by non-Hispanic White and Mexican American individuals (Fig. 8).11
Fig. 7.
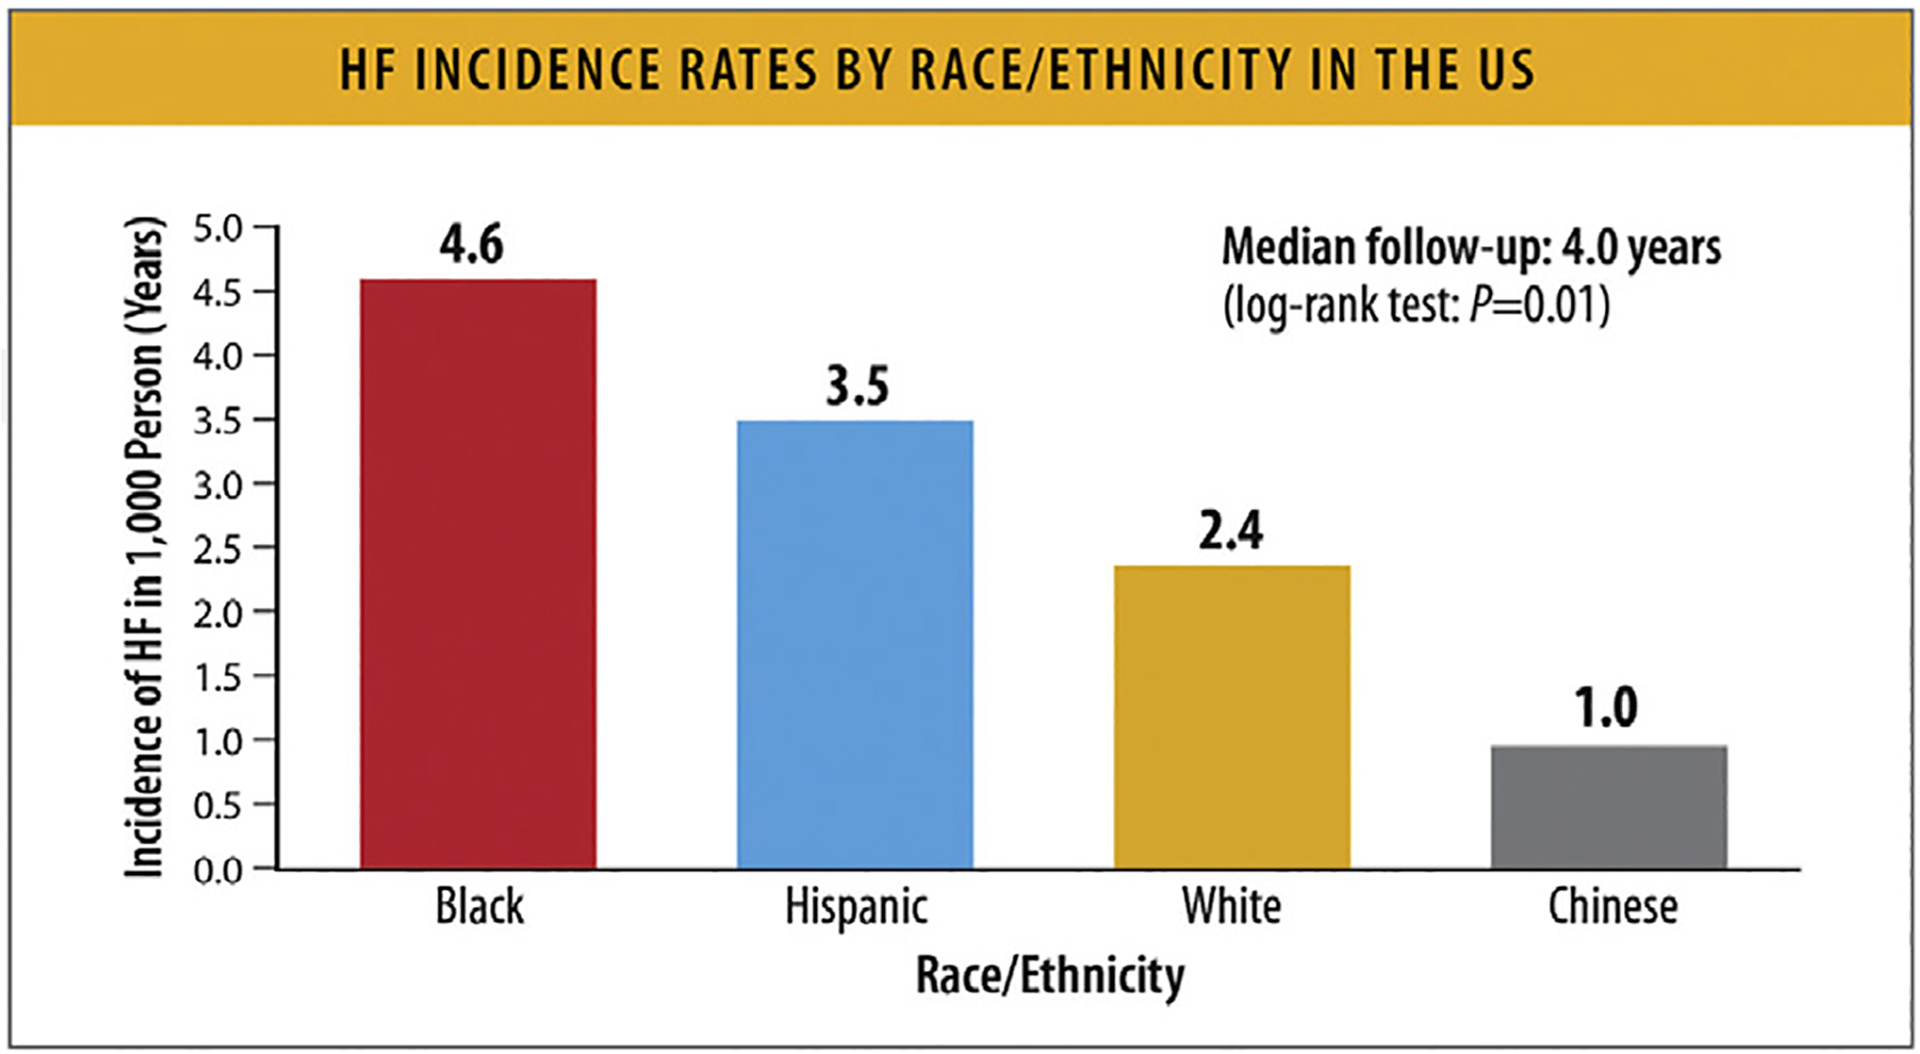
HF incidence rates by race/ethnicity in the United States. HF = heart failure; PY = person-years. Modified from Piña IL, Jimenez S, Lewis EF, Morris AA, Onwuanyi A, Tam E, et al. Race and ethnicity in heart failure: JACC focus seminar 8/9. J Am Coll Cardiol 2021;78:2589–98.
Fig. 8.
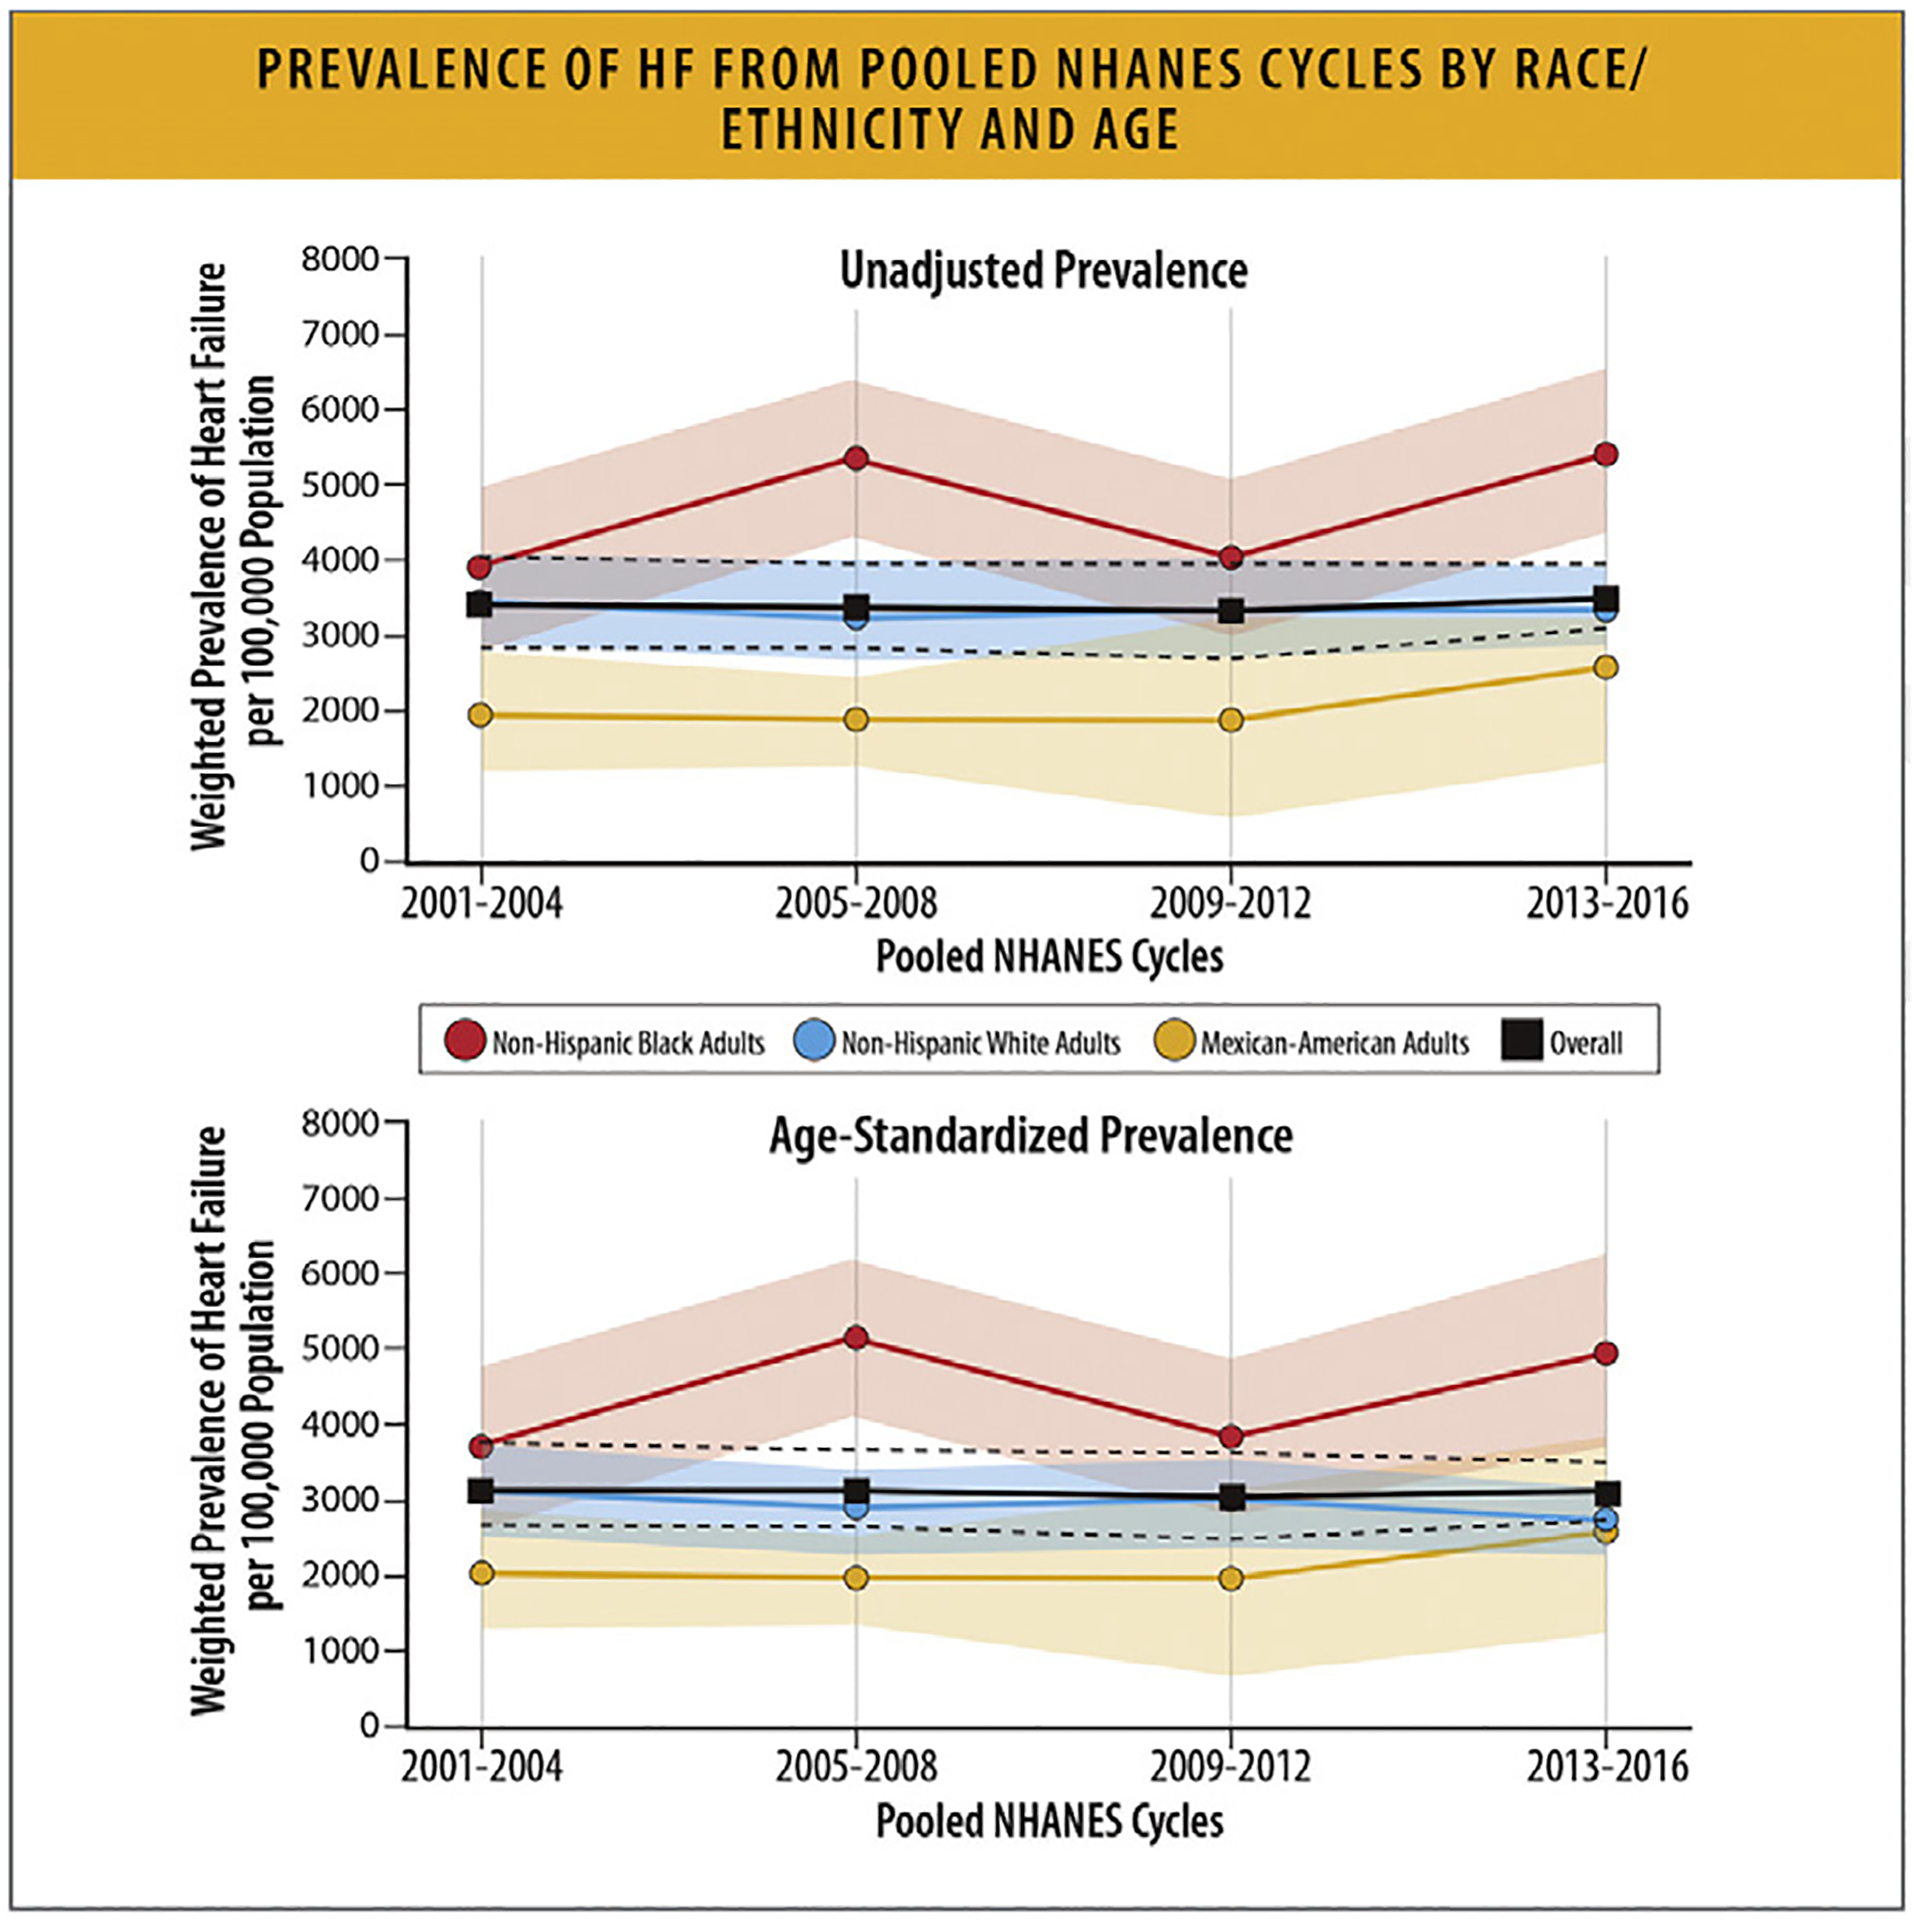
Prevalence of HF from pooled NHANES cycles by race/ethnicity and age. HF = heart failure; NHANES = National Health and Nutrition Examination Survey. Modified from Rethy L, Petito LC, Vu THT, Kershaw K, Mehta R, Shah NS, et al. Trends in the prevalence of self-reported heart failure by race/ethnicity and age from 2001 to 2016. JAMA Cardiol 2020;5:1425–9.
Temporal trends in HF prevalence also vary by race and ethnicity. This difference is in part due to a disproportionate burden of cardiometabolic HF risk factors and healthcare disparities among certain racial and ethnic groups.61 In NHANES, the overall prevalence of HF did not change between 2001 and 2016. However, among non-Hispanic Black and Mexican American individuals, HF prevalence increased from 2001 to 2016 compared with no change for non-Hispanic White individuals (Fig. 8). The higher prevalence of cardiometabolic risk factors in Black and Hispanic populations is related to disparities in SDoH and structural racism. Discrimination is linked to higher allostatic loads, telomere shortening, oxidative stress, and tissue inflammation, all of which contribute to accelerated aging and earlier development of disease.61,62
More epidemiologic studies are needed to estimate the incidence and prevalence of HF for Asian American and American Indian individuals.
4.3. HF Prevalence across Different Age Populations
Globally, HF is most prevalent among adults greater than 60 years of age; the risk of developing HF is 20-fold higher among adults 60 years of age and older compared with those under 60 years of age.63
HF is more prevalent among younger and middle-aged Black adults (age 35–64 years; 3864/100,000) compared with young and middle-aged White adults (1297/100,000).11 Current estimates of HF prevalence in the US by age categories are presented in Figs. 9A and 9B. Based on 2017–2020 NHANES pre-COVID data, the prevalence estimates for HF were: 0.35% (95% CI 0.17%–0.73%) for adults 20–39 years of age, 1.73% (95% CI 1.23%–2.42%) for adults 40–59 years of age, 4.93% (95% CI 3.58%–6.76%) for adults 60–69 years of age, 6.96% (95% CI 5.36%–8.98%) for adults 70–79 years of age, and 10.14% (95% CI 7.83%–13.04%) for adults 80 years of age and older.64
Fig. 9.
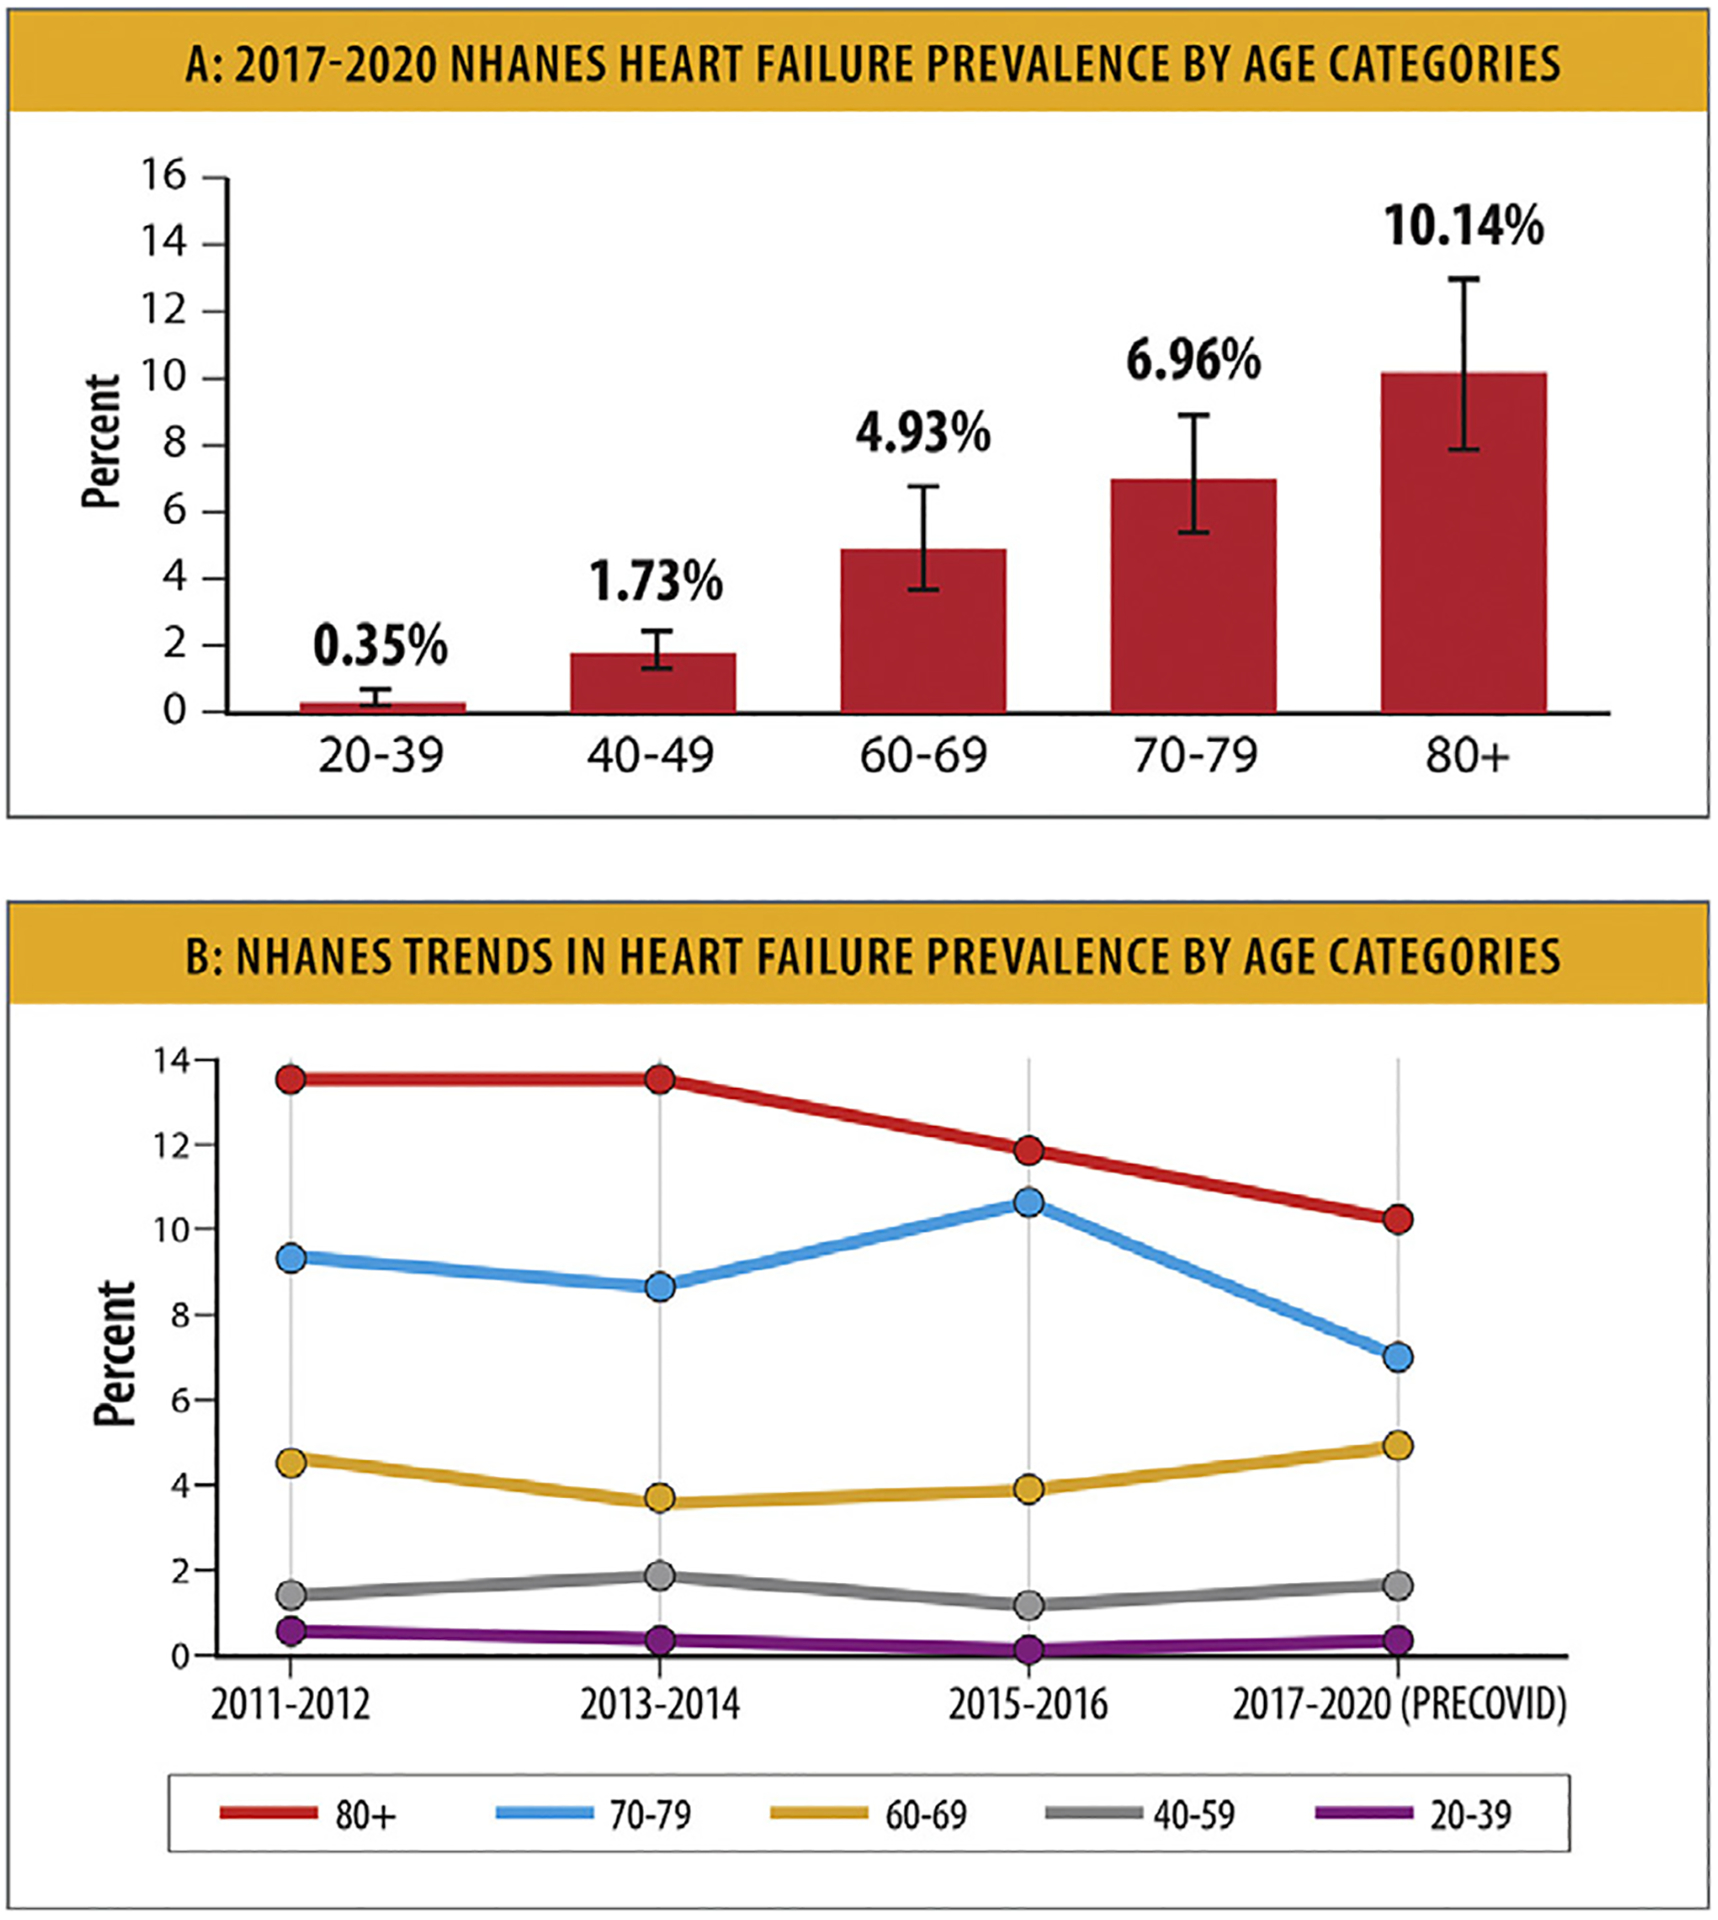
NHANES trends in heart failure prevalence. (A) 2017 to 2020 NHANES HF prevalence by age categories. (B) NHANES trends in HF prevalence by age categories. HF = heart failure; NHANES = National Health and Nutrition Examination Survey. Modified from Centers for Disease Control and Prevention National Center for Health Statistics. Centers for Disease Control and Prevention. 2023 [cited 2023 Feb 2]. National Health and Nutrition Examination Survey (NHANES) Public Use Data Files. Available from: https://www.cdc.gov/nchs/nhanes/index.htm
Trends in HF prevalence in the US by age categories are presented in Fig. 9B. Based on 2011–2012 to 2017–2020 pre-COVID NHANES data, there was a downward trend in the prevalence of HF over time among adults aged 80 years and older, as well as among adults aged 70–79 years.64
4.4. HF Prevalence and Risk in Women vs Men
Based on data from 195 countries from 1990 to 2017 in the GBD study, the global number of HF cases in 2017 was 64.3 million (95% uncertainty interval [UI] 57.2–71.6), of whom 34.8 million (95% UI 30.9–39.1) were women and 29.5 million (95% UI 26.3–32.9) were men (Fig. 10 and Table 5).65
Fig. 10.
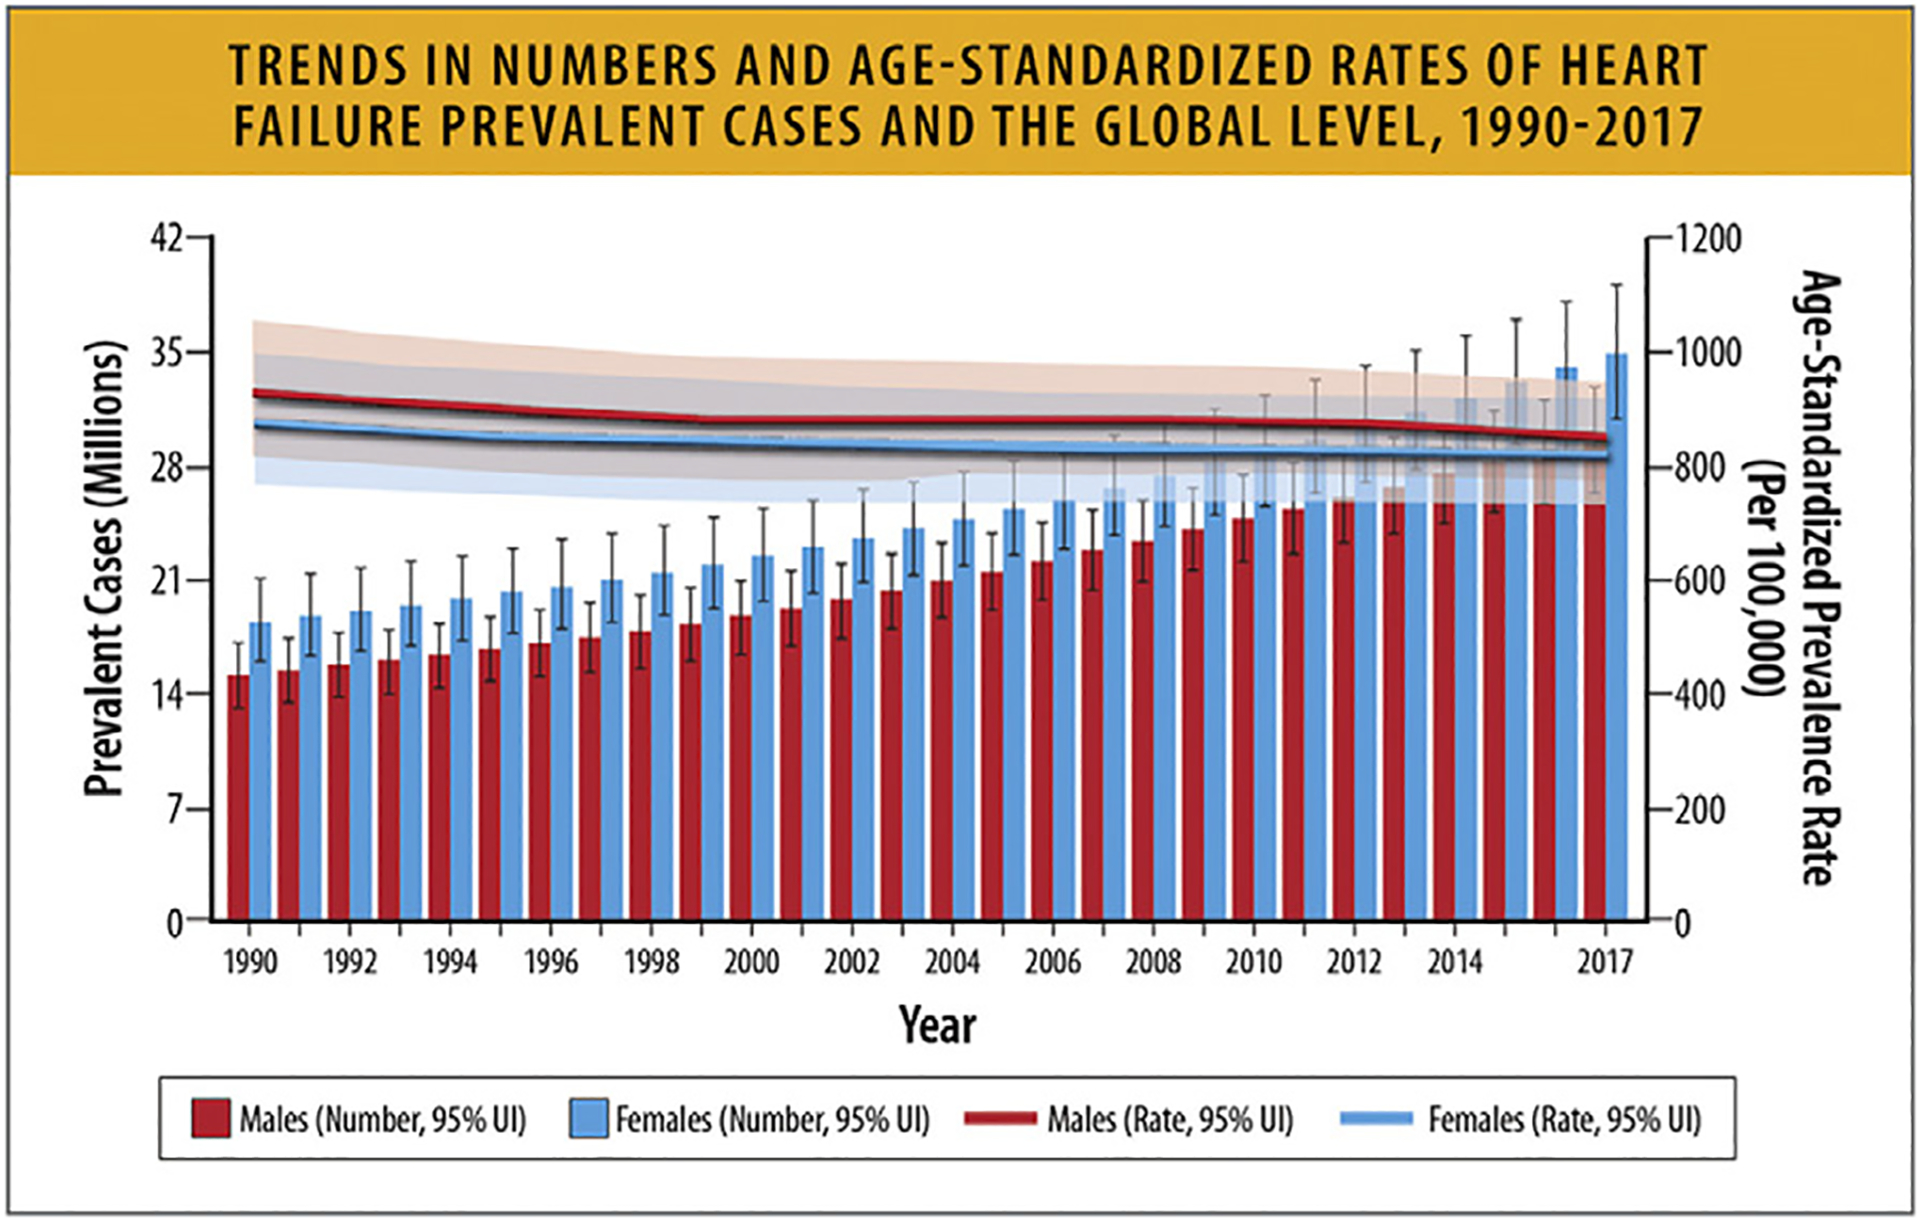
Trends in numbers and age-standardized rates of heart failure prevalent cases and the global level, 1990 to 2017. UI = uncertainty interval. Modified from Bragazzi NL, Zhong W, Shu J, Abu Much A, Lotan D, Grupper A, et al. Burden of heart failure and underlying causes in 195 countries and territories from 1990 to 2017. Eur J Prev Cardiol 2021;28:1682–90.
Table 5.
Sex Specific Age-Standardized Prevalence Rate of HF Based on Underlying Disease
| Global | Male | Female | |
|---|---|---|---|
| All causes | 831.0 (738.6 to 926.2) | 844.6 (752.5 to 936.0) | 817.5 (724.4 to 916.0) |
| Ischemic heart disease | 220.1 (187.8 to 255.8) | 259.7 (221.7 to 302.5) | 186.3 (158.3 to 218.5) |
| Hypertensive heart disease | 217.9 (184.1 to 254.1) | 172.3 (145.8 to 201.5) | 255.0 (216.5 to 296.9) |
| Chronic obstructive pulmonary disease | 194.5 (159.2 to 230.8) | 208.5 (170.0 to 248.5) | 182.6 (149.7 to 218.7) |
| Other cardiomyopathy | 53.9 (46.7 to 62.1) | 53.1 (45.9 to 61.2) | 54.5 (47.1 to 62.6 |
| Non-rheumatic degenerative mitral valve disease | 22.8 (14.7 to 32.6) | 22.1 (14.5 to 31.8) | 23.4 (15.1 to 33.8) |
| Other cardiovascular and circulatory diseases | 20.3 (16.6 to 24.3) | 22.9 (18.8 to 27.6) | 18.0 (14.8 to 21.7) |
| Alcoholic cardiomyopathy | 19.9 (16.8 to 23.3) | 27.7 (23.4 to 32.4) | 12.6 (10.6 to 14.7) |
| NonOrheumatic calcific aortic valve disease | 18.9 (12.2 to 27.5) | 20.4 (13.0 to 29.6) | 17.7 (11.3 to 26.3) |
| Other cardiovascular and circulatory diseases | 20.3 (16.6 to 24.3) | 22.9 (18.8 to 27.6) | 18.0 (14.8 to 21.7) |
| Rheumatic heart disease | 14.9 (12.6 to 17.4) | 11.0 (9.3 to 12.8) | 18.4 (15.5 to 21.6) |
| Myocarditis | 13.7 (11.8 to 15.8) | 11.4 (9.7 to 13.1) | 15.9 (13.6 to 18.2) |
| Congenital heart anomalies | 7.5 (5.9 to 9.5) | 7.8 (6.0 to 9.8) | 7.3 (5.7 to 9.2) |
| Endocarditis | 7.4 (6.3 to 8.5) | 6.8 (5.8 to 7.9) | 7.8 (6.6 to 9.1) |
| Interstitial lung disease and pulmonary sarcoidosis | 5.4 (4.1 to 6.5) | 5.9 (4.5 to 7.3) | 5.0 (3.9 to 6.0) |
| Endocrine, metabolic, blood, and immune disorders | 5.1 (4.2 to 6.1) | 4.9 (4.1 to 5.8) | 5.2 (4.3 to 6.3) |
| Other hemoglobinopathies and hemolytic anemias | 4.2 (3.4 to 5.0) | 3.8 (3.1 to 4.7) | 4.6 (3.8 to 5.5) |
| Chagas disease | 3.7 (2.4 to 5.3) | 4.8 (3.4 to 6.4) | 2.7 (1.6 to 4.2) |
| Other non-rheumatic valve diseases | 0.350 (0.287 to 0.421) | 0.291 (0.239 to 0.347) | 0.394 (0.322 to 0.476) |
| G6PD deficiency | 0.249 (0.206 to 0.301) | 0.346 (0.283 to 0.420) | 0.162 (0.133 to 0.195) |
| Silicosis | 0.140 (0.116 to 0.168) | 0.305 (0.252 to 0.363) | 0.006 (0.005 to 0.008) |
| Coal workers pneumoconiosis | 0.089 (0.075 to 0.104) | 0.186 (0.157 to 0.217) | 0.010 (0.008 to 0.011) |
| Asbestosis | 0.073 (0.061 to 0.086) | 0.141 (0.117 to 0.165) | 0.024 (0.019 to 0.029) |
| Other pneumoconiosis | 0.053 (0.045 to 0.062) | 0.093 (0.079 to 0.109) | 0.021 (0.017 to 0.025) |
| Thalassemias | 0.050 (0.039 to 0.063) | 0.050 (0.039 to 0.063) | 0.049 (0.036to 0.064) |
G6PD = Glucose-6-phosphate dehydrogenase
Bragazzi NL, Zhong W, Shu J, Abu Much A, Lotan D, Grupper A, et al. Burden of Heart Failure and Underlying Causes In 195 Countries and Territories from 1990 to 2017. Eur J Prev Cardiol. 2021 Dec 29;28(15):1682–90.
The global number of HF cases in women and men increased from 1990 to 2017. More women had HF than men between 1990–2017 with prevalence increasing with age and peaking at ages 70–74 years in men and 75–79 years in women. In 2017, more women had HF compared with men after 69 years of age (Fig. 11).65
Fig. 11.
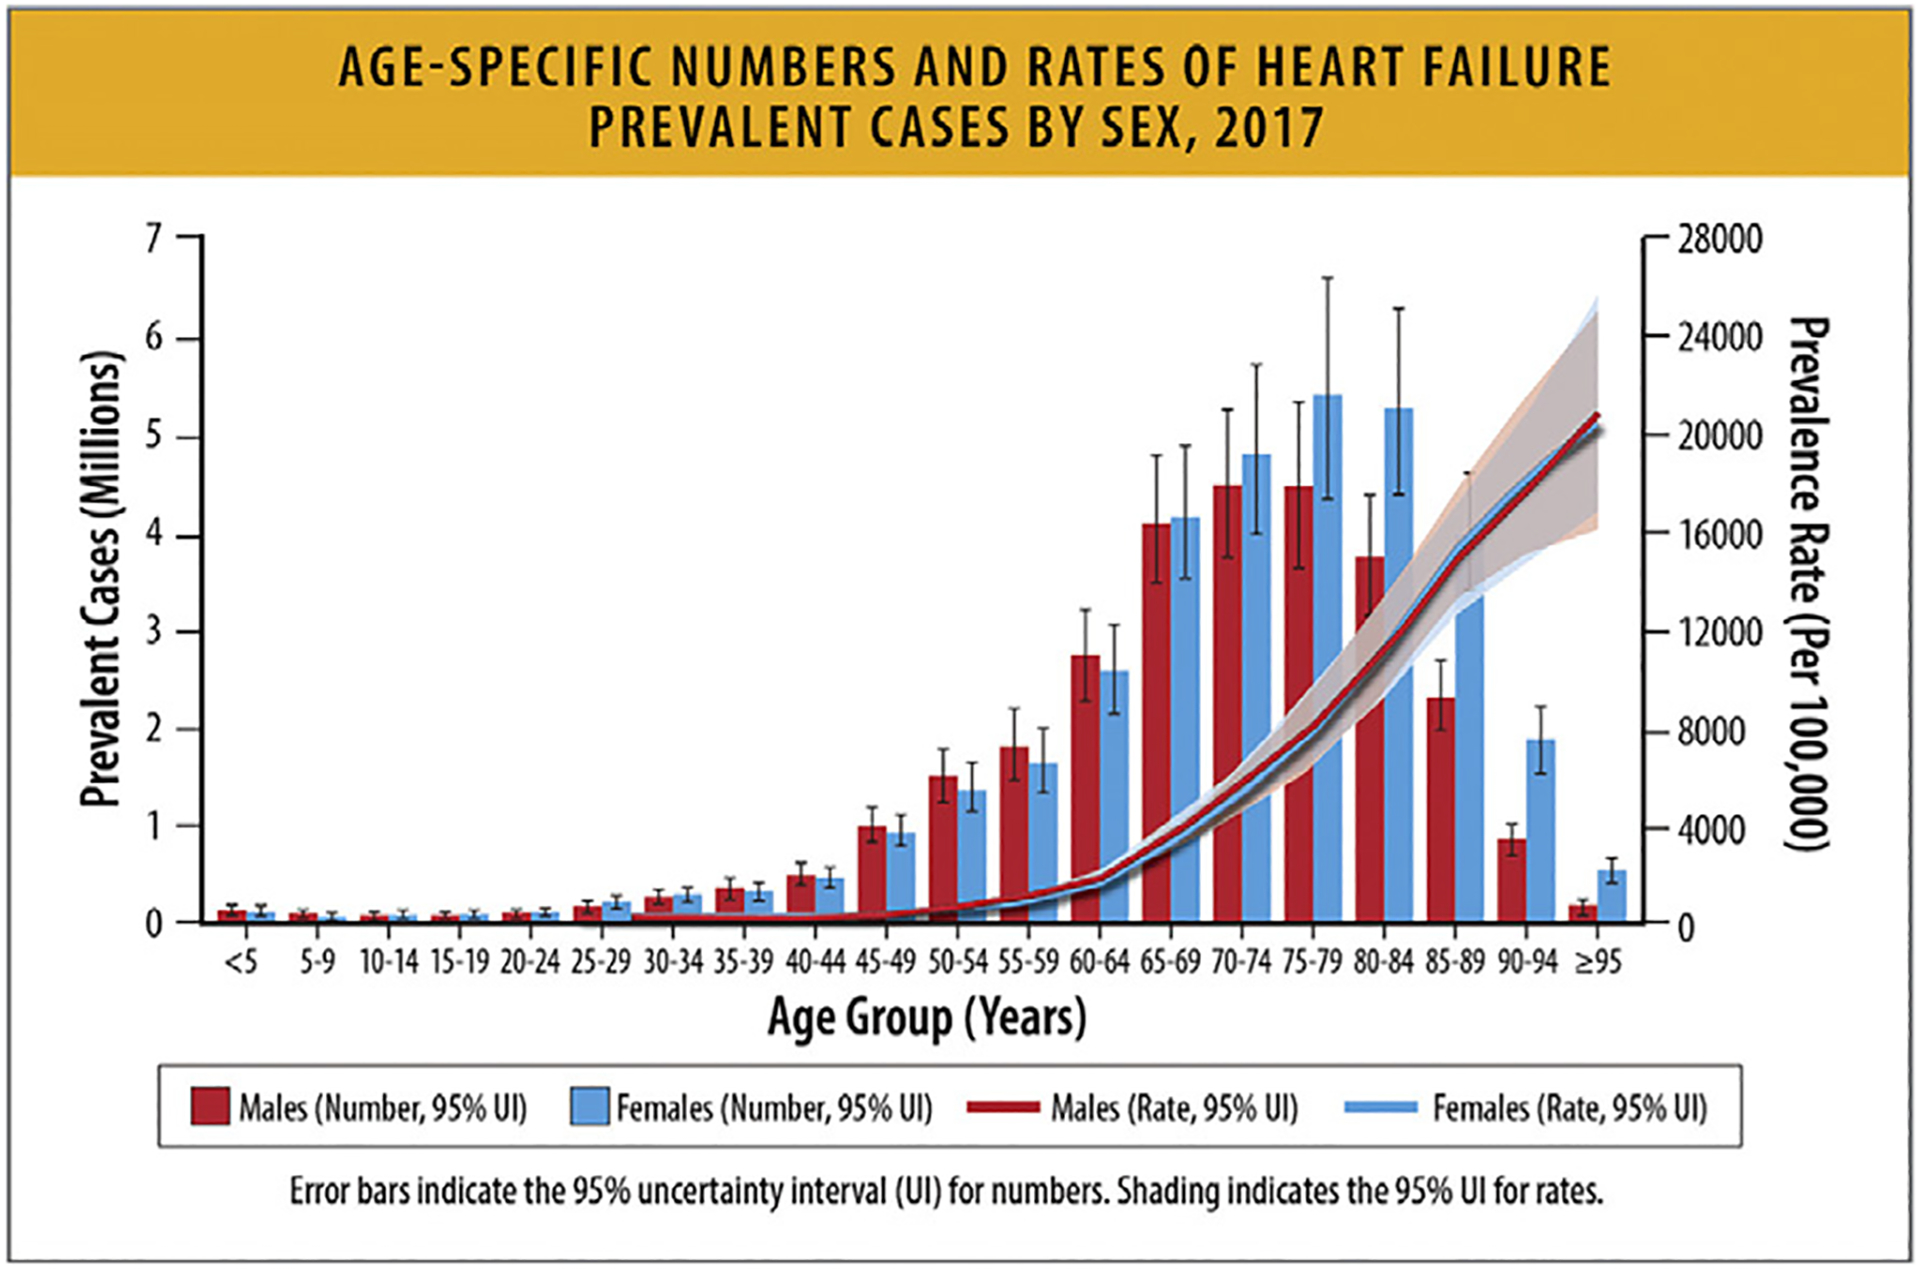
Age-specific numbers and rates of heart failure prevalent cases by sex, 2017. HF = heart failure; UI = uncertainty interval. Modified from Bragazzi NL, Zhong W, Shu J, Abu Much A, Lotan D, Grupper A, et al. Burden of heart failure and underlying causes in 195 countries and territories from 1990 to 2017. Eur J Prev Cardiol 2021;28:1682–90.
In the US, the incidence of HF is greater in women compared with men, but the prevalence is less in women when age includes all patients 20 years of age or older. In 2017, women had more hypertensive heart disease and rheumatic heart disease compared with men, whereas men had more ischemic heart disease, chronic obstructive pulmonary disease, alcoholic cardiomyopathy, and Chagas disease compared with women (Table 5).65
There are important sex differences in HF risk factors. Based on longitudinal data from 22,756 non-HF participants followed for 12.5 years in 4 cohorts (FHS, the Prevention of Renal and Vascular End Stage Disease Study, MESA, and CHS), traditional HF risk factors were similarly associated with incident HF in both sexes, with the exception of age, which was more strongly associated with HF in women, and body mass index, which was more strongly associated with HF risk among men (Table 6).66 Interestingly, the 2023 AHA/ACC/HFSA HF classification reclassified a greater proportion of women than men from stage A to stage B with incorporation of biomarker cutpoints.24
Table 6.
Associations of Clinical Risk factors with Incident Failure: Men vs Women
| sHR (95% Cl) | p Value | sHR (95% Cl) | p Value | p int | |
|---|---|---|---|---|---|
| Age (per 10 yrs) | 1.80 (1.67–1.95) | <0.001 | 2.07 (1.89–2.28) | <0.001 | 0.001 |
| Smoking | 1.36 (1.14–1.63) | 0.001 | 1.50 (1.25–1.81) | <0.001 | 0.845 |
| Diabetes mellitus | 1.49 (1.28–1.72) | <0.001 | 1.76 (1.49–2.09) | <0.001 | 0.164 |
| Hypertension | 1.67 (1.45–1.93) | <0.001 | 1.98 (1.68–2.34) | <0.001 | 0.073 |
| Body mass index (per 4 kg/m2) | 1.28 (1.21–1.36) | <0.001 | 1.18 (1.12–1.24) | <0.001 | 0.020 |
| Atrial fibrillation | 1.83 (1.37–2.44) | <0.001 | 2.58 (1.62–4.13) | <0.001 | 0.153 |
| Myocardial infarction | 2.19 (1.85–2.60) | <0.001 | 1.69 (1.28–2.22) | <0.001 | 0.349 |
| Left ventricular hypertrophy | 2.11 (1.62–2.75) | <0.001 | 1.76 (1.36–2.26) | <0.001 | 0.515 |
| Left bundle branch block | 2.43 (1.62–3.63) | <0.001 | 3.14 (2.13–4.64) | <0.001 | 0.281 |
| C-statistic | 0.80 (0.79–0.82) | – | 0.83 (0.81–0.84) | – | – |
Fine-Gray models were adjusted for the competing risk of death, and for the following variables: age, smoking, diabetes mellitus, hypertension, body mass index, atrial fibrillation, myocardial infarction, and left ventricular hypertrophy/left bundle branch block; strata statement included. Interaction p value (pjnt) denotes sex·covariate interaction on a multiplicative scale in the total population. AF = atrial fibrillation; BMI = body mass index; Cl = confidence interval; HF = heart failure; Ml = myocardial infaction; sHR = subdistribution hazard ration per unit change in the clinical covariate
Suthahar N, Lau ES, Blaha MJ, Paniagua SM, Larson MG, Psaty BM, et al. Sex-Specific Associations of Cardiovascular Risk Factors and Biomarkers with Incident Heart Failure. J Am Coll Cardiol. 2020 Sep 22;76(12):1455–65.
5. HF-Related Mortality Rates
5.1. Summary
HF mortality rates have been increasing since 2012.
HF was a contributing cause in 415,922 deaths in the US in 2020.
There is significant underestimation of HF-related mortality from national data derived from death certificates.
HF is associated with a loss of 15 years of median survival for adults aged 65–90 years of age compared with the general US population.
Age-adjusted HF mortality rates are highest for non-Hispanic Black individuals. Black, American Indian, and Alaska Native individuals with HF have the highest all-cause age-adjusted mortality compared with other racial and ethnic groups. From 2010 to 2020, HF mortality rates have increased for Black women and men at a rate faster than any other racial or ethnic group, particularly for individuals below the age of 65.
Age-adjusted mortality rates (AAMRs) for HF have increased in the last decade with similar patterns of increase in women and men.
A greater relative annual increase in HF-related mortality rates has been noted for younger (35–64 years) compared with older (65–84 years) adults.
Rural areas demonstrate higher HF mortality rates for both younger and older age groups compared with urban areas.
5.2. Serious Under-Reporting of HF-related Mortality
Reported rates of mortality that rely on the underlying causes of death identified in death certificates grossly underestimate HF-related mortality.67 Although one-third of all cardiovascular deaths are usually attributable to HF, the reported absolute number of deaths with HF as an underlying cause of death was only 85,855, whereas the total number of cardiovascular deaths were 928,741 deaths in the US by 2020.68
Coding guidelines deem that HF does not generally represent an underlying cause of death, but rather a mediator between death and disease. Thus, HF represents a mode of death attributable to other conditions (eg, CHD, hypertension, cardiomyopathy) and is often redistributed to these causes.69 As such, when considering HF as a cause of mortality in any mention in death certificates in the United States, HF was at least a contributing cause in 415,922 deaths in 2020.68 This suggests that approximately 72%–79% of deaths that could be attributed to HF are not actually being reported or captured as HF-related deaths. With 6.7 million HF patients in US in 2020, a 9% annual all-cause mortality rate would be estimated to represent 603,000 deaths annually from any cause.
Current research on the epidemiology and mortality related to HF or in patients living with HF is limited. US national estimates rely on death certificates through the National Center for Health Statistics (NCHS), which are publicly accessible through the Centers for Disease Control and Prevention (CDC) Wide-ranging Online Data for Epidemiologic Research (WONDER; available from https://wonder.cdc.gov/mcd.html).70 Death certificates include an underlying cause of death and can include up to 20 contributing causes of death in the multiple cause of death files. The underlying cause of death is defined by the World Health Organization as “the disease or injury which initiated the train of events leading directly to death, or the circumstances of the accident or violence which produced the fatal injury.” Death certificates, however, are subject to substantial variability in completeness and accuracy, especially in delineating HF as an underlying cause or contributing cause of death. Other epidemiological surveys of mortality rates and trends are derived from selected populations of patients (eg, geographically confined, similar insurance). Furthermore, datasets may have less granular information regarding the duration of HF illness, and prognosis and mortality trajectories might be distinct among those with de novo or recently diagnosed vs established chronic HF. The setting of data capture (whether in in-hospital/acute care settings vs in ambulatory care) might also substantially alter mortality estimates.
These factors underline the importance of process changes both at the administrative and coding level. The sections below provide a review of the current published data to date. To fully capture deaths related to HF, including all deaths where HF is listed as a contributing cause of death, is critical. Sensitivity analyses may include all deaths with a cardiovascular cause as the underlying cause of death, and HF as a contributing cause, to ensure specificity for cardiovascular deaths.
Until these changes are implemented, it is important to recognize that the reported deaths related to HF likely represent only 21%–28% of the true deaths attributable to HF.
5.3. Recent Published Estimates of HF Mortality
As stated elsewhere in this article, in 2020, HF as an underlying cause of death was listed in 85,855 deaths (44,958 women71 and 40,897 men) and HF was at least a contributing cause in 415,922 deaths in the US.2 AAMRs were subject to substantial regional variability, with highest rates observed in the Midwest and South.72 Nonmetropolitan areas also seemed to have higher HF-related mortality rates compared with metropolitan areas.72
5.4. Worldwide Mortality Rates Related to HF
Globally, based on estimates from GBD, there were 370,000 deaths attributable to cardiomyopathy and myocarditis in 2020 (Table 7). Again, these numbers likely represent a very small percentage of deaths attributable to cardiomyopathies and myocarditis as the diagnostic and coding criteria widely vary.
Table 7.
Global Prevalence and Mortality of Cardiomyopathy and Myocarditis by Sex, 202079
| Deaths (95% Ul) | Prevalence (95% Ul) | Deaths (95% Ul) | Prevalence (95% Ul) | Deaths (95% Ul) | Prevalence (95% Ul) | |
|---|---|---|---|---|---|---|
| Total number (millions), 2020 | 0.37 (0.33 to 0.41) | 6.11 (5.02 to 7.22) | 0.23 (0.20 to 0.25) | 3.41 (2.81 to 4.04) | 0.14 (0.12 to 0.17) | 2.70 (2.23 to 3.22) |
| Percent change in total number, 1990–2020 | 43.01 (29.79 to 55.73) | 59.95 (53.96 to 66.69) | 57.86 (42.26 to 74.64) | 61.68 (55.04 to 68.81) | 24.56 (10.88 to 37.41) | 57.81 (51.84 to 64.72) |
| Percent change in total number, 2010–2020 | −0.95 (−6.03 to 4.03) | 18.24 (15.58 to 21.14) | −1.07 (−7.37 to 5.36) | 17.23 (14.36 to 20.43) | −0.76 (−6.61 to 5.54) | 19.54 (16.56 to 22.98) |
| Rate per 100,000, age standardized, 2020 | 4.69 (4.15 to 5.11) | 76.92 (63.29 to 91.56) | 6.20 (5.53 to 6.85) | 88.75 (73.37 to 104.96) | 3.32 (2.73 to 3.81) | 65.88 (54.01 to 78.66) |
| Percent change in rate, age standardized 1990–2020 | −37.21 (−42.14 to −32.33) | −7.07 (−11.11 to −3.50) | −31.01 (−36.65 to −24.75) | −6.25 (−10.08 to −2.95) | −45.57 (−51.30 to −40.75) | −7.90 (−12.50 to −3.75) |
| Percent change (%) in rate, age standardized 2010–2020 | −23.86 (−27.57 to −20.17) | −1.40 (−3.11 to 0.19) | −22.81 (−27.35 to −18.16) | −2.48 (−4.45 to 0.71) | −25.15 (−29.40 to −20.44) | −0.08 (−2.33 to 1.96) |
During each annual GBD Study cycle, population health estimates are produced for the full time series. Improvements in statistical and geospatial modeling methods and the addition of new data sources may lead to changes in past results across GBD Study cycles. GBD= Global Burden of Disease Study; UI = uncertainty interval.
Institute for Health Metrics and Evaluation. Global Burden of Disease Study. 2020 [cited 2023 Jul 9], Cardiomyopathy and myocarditis – Level 3 cause. Available from: https://www.healthdata.org/results/gbd_summaries/2019/cardiomyopathy-and-myocarditis-level-3-cause
Global mortality rates vary widely based on geographic region. In the prospective international Registry to assess medical Practice with lOngitudinal obseRvation for Treatment of Heart Failure, patients discharged after acute HF presentation, 20% died within 1-year after discharge globally, ranging from 16% in Eastern Europe to 22% in the Eastern Mediterranean, Africa, and Latin America (Fig. 12).73 Mortality patterns appear to vary by income, with lower income countries and countries with greatest income inequality displaying highest post-discharge mortality rates. Consistent marked regional heterogeneity was seen in the INTERnational Congestive Heart Failure Study, a prospective cohort study that included mostly ambulatory HF patients from 16 countries, with the highest 1-year mortality observed in Africa (34%) and India (23%), and lowest in the Middle East (9%).74
Fig. 12.
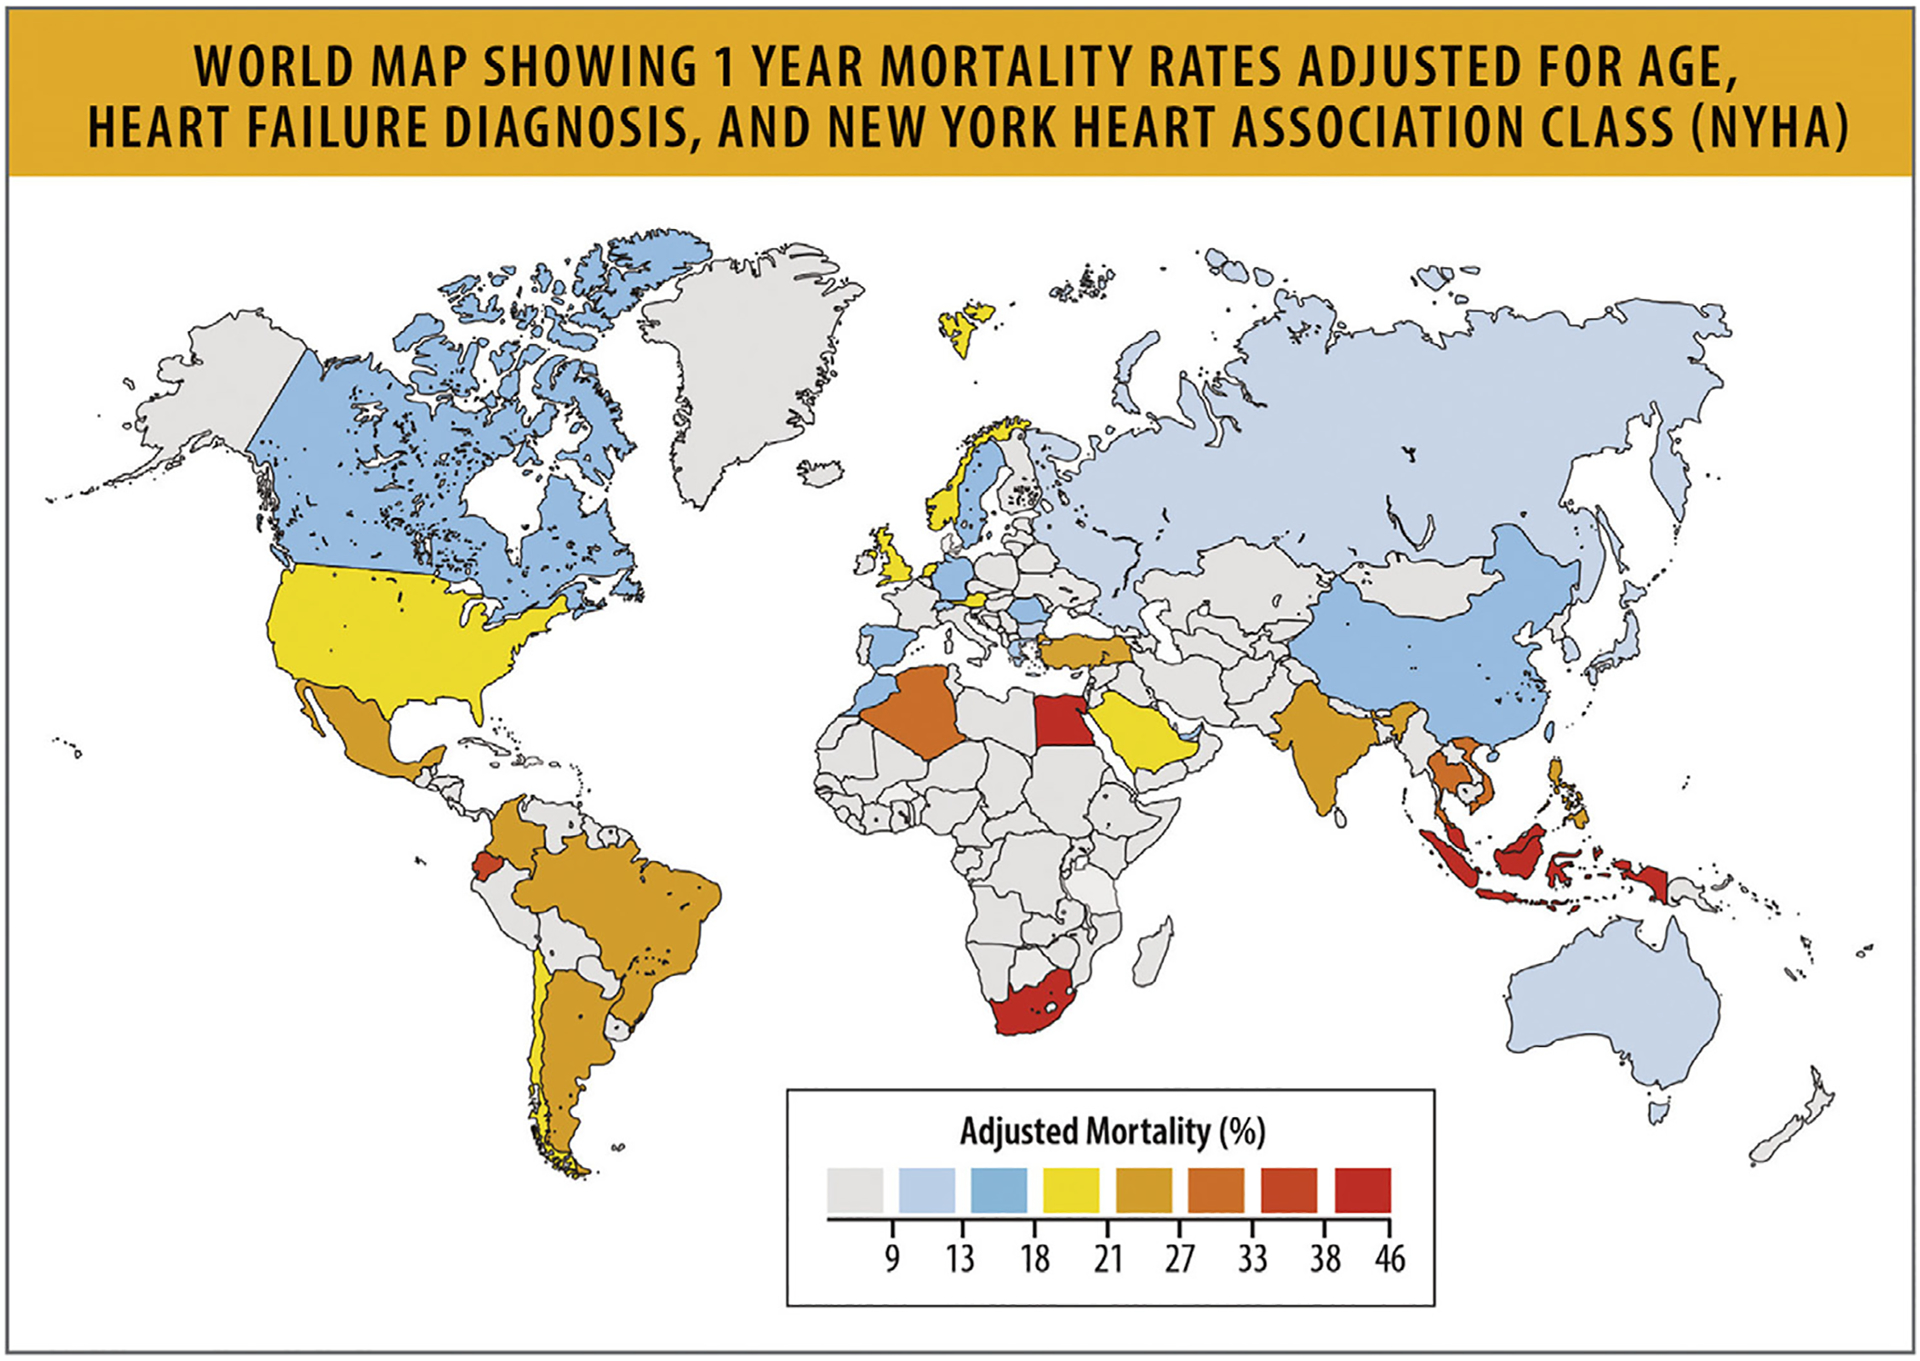
World map showing 1-year mortality rates adjusted for age, HF diagnosis, and NYH) functional class.15 HF = heart failure; NYHA = New York Heart Association; UI = uncertainty interval. Modified from Tromp J, Beusekamp JC, Ouwerkerk W, van der Meer P, Cleland JGF, Angermann CE, et al. Regional differences in precipitating factors of hospitalization for acute heart failure: insights from the REPORT-HF Registry. Eur J Heart Fail 2022;24:645–52.
Similarly, recent data from the Global Congestive Heart Failure registry showed that age- and sex-adjusted death rates are lowest in high-income countries (7.8/100PY [95% CI 7.5–8.2]) compared with upper-middle income countries (9.3/100PY [95% CI 8.8–9.9]), lower- and middle-income countries (15.7/100PY [95% CI 15.0–16.4]), and low-income countries (19.1/100PY [95% CI 17.6–20.7]).75
5.5. Temporal Trends in HF Mortality
While some US epidemiological studies have suggested modest longitudinal improvements in HF mortality in the past, these observations have been inconsistent and appear to have slowed or even reversed in recent years.
5.6. Historical Trends in Mortality
Based on historical data from CDC WONDER, among older adults 75 years and older, AAMRs attributable to HF declined from 1999 to 2012.72 Similar early slight improvements in 1-year post-discharge mortality from 1998 to 2008 were observed among older Medicare beneficiaries hospitalized for HF.76 In contrast, data from patients presenting with incident diagnoses of HF in Olmsted County, Minnesota from 2000 to 2010 showed that all-cause mortality at 5-year follow-up did not decline over time.6
5.7. Recent Trends in Mortality
However, since 2012, AAMRs attributable to HF in older adults appear to have increased through 2019 (Fig. 13).72 Examining age-adjusted HF-related cardiovascular disease death rates (where cardiovascular disease was the underlying cause of death and HF was a contributing cause), mortality rates declined from 1999 to 2012 and subsequently appear to have increased through 2017.71 Total deaths attributable to HF in 2020 (85,855) are substantially higher than in 2010 (57,757), which might in part be driven by these recent trends, but also by changes in the population prevalence of patients living with HF.77 Although numerous reports have affirmed that patients with HF with acute COVID-19 illness experienced worse outcomes and high inpatient mortality rates, the long-term implications of the COVID-19 pandemic on overall burden of HF mortality remains to be seen.78
Fig. 13.
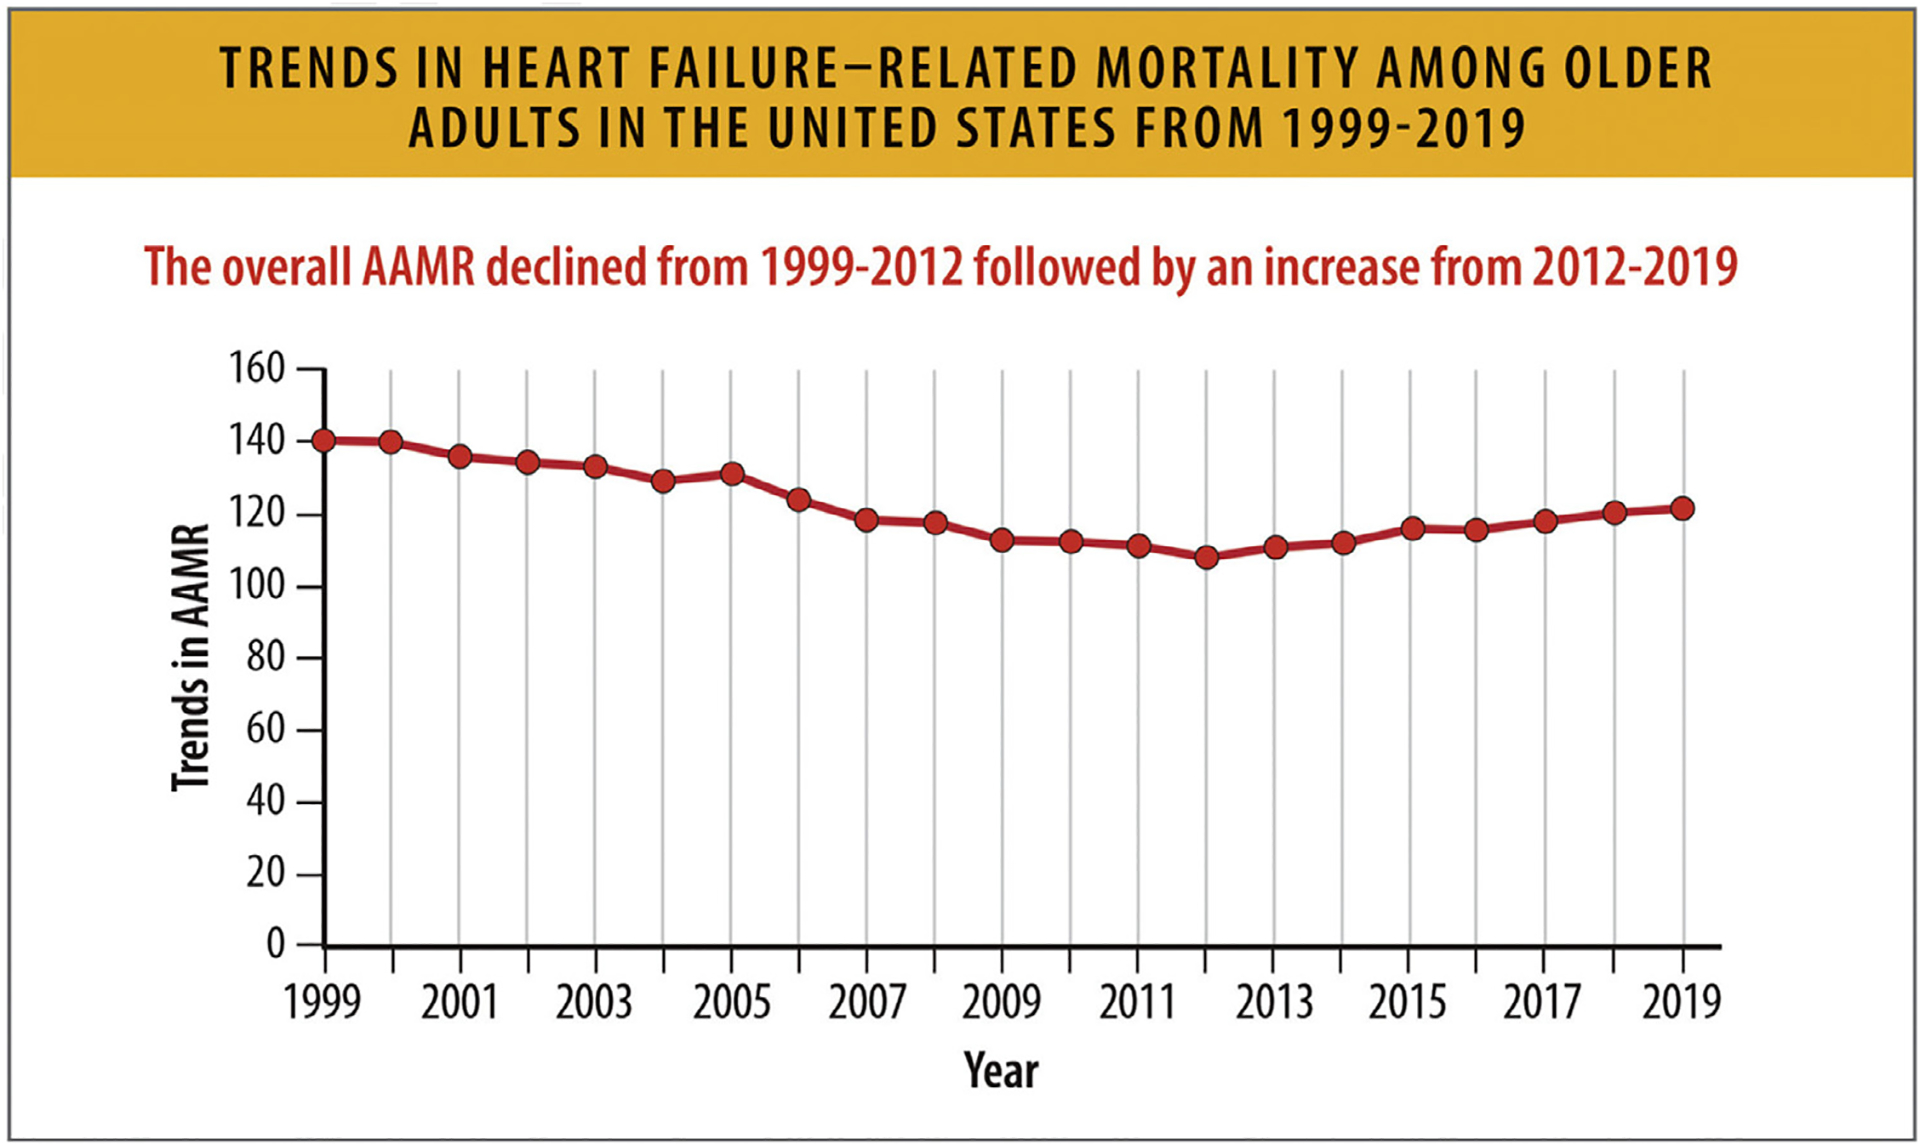
Trends in HF-related mortality among older adults in the United States from 1999 to 2019. AAMR = age-adjusted mortality rates, HF = heart failure; US = United States; UI = uncertainty interval. Modified from Siddiqi TJ, Khan Minhas AM, Greene SJ, Van Spall HGC, Khan SS, Pandey A, et al. Trends in heart failure-related mortality among older adults in the United States From 1999–2019. JACC Heart Fail 2022;10:851–9.
Mortality trends over time for specific global regions are not widely available. There is little detail in most national or global mortality data about the etiology of the HF. For instance, the most comprehensive data available are from the GBD study, which provides aggregated modeled data estimates for death and disability related to cardiomyopathy and myocarditis (Table 7). However, most cardiomyopathies are classified as other, and only alcohol-related cardiomyopathy is described in detail.68 Prevalence and causes of cardiomyopathy vary widely by country due to both differences in endemic disease and in reporting of incidence and death. In keeping with this, substantial regional variation in the burden of other cardiomyopathies was observed in the most recent iterations of the GBD. Disaggregation of etiology-specific estimates around burden of disease is needed in future iterations, and is anticipated to impact overall HF outcome statistics.79
5.8. HF Mortality Rates According to Race and Ethnicity
HF mortality rates vary by racial and ethnic groups in the US. From 2010 to 2020, age-adjusted HF mortality rates increased for all racial and ethnic groups, but Black individuals had the highest mortality from HF (Table 8).80 Age-adjusted HF mortality rates were highest for non-Hispanic Black individuals at 41.4/100,000 followed by non-Hispanic White individuals at 33.1/100,000, non-Hispanic American Indian or Alaska Native individuals at 21.1/100,000, Hispanic individuals at 18.18/100,000 and non-Hispanic Asian or Pacific Islander individuals at 12.9/100,000 in 2020.80 From 2010 to 2020, HF mortality rates increased for Black women and men at a rate higher than any other racial or ethnic group, particularly for individuals below the age of 65.77,80
Table 8.
US HF Age-Adjusted Mortality Rate Per 100,000 Among Individuals Aged ≥25 Years
| Non-Hispanic American Indian or Alaska Native | Non-Hispanic Asian or Pacific Islander | Non-Hispanic Black or African American | Non-Hispanic White | Hispanic | |
|---|---|---|---|---|---|
| Heart Failure | |||||
| 2020 | 21.1 (18.8–23.4) | 12.9 (12.3–13.5) | 41.4 (40.6–42.2) | 33.1 (32.9–33.4) | 18.8 (18.2–19.4) |
| 2015 | 23.2 (20.4–26.0) | 11.2 (10.6–11.9) | 35.9 (35.1–36.8) | 32.1 (31.8–32.3) | 17.5 (16.9–18.1) |
| 2010 | 24.6 (21.2–28.1) | 10.3 (9.5–11.1) | 30.5 (29.7–31.4) | 27.5 (27.3–27.8) | 15.4 (14.7–16.1) |
| All-Cause Mortality | |||||
| 2010 | 1503.2 (1484.3–1522.1) | 710.6 (706.1–715.1) | 1640.2 (1635.2–1645.2) | 1256.1 (1254.5–1257.8) | 1088.9 (1084.8–1093.0) |
| 2010 | 1194.9 (1176.1–1213.6) | 593.4 (588.7–598.2) | 1300.5 (1295.7–1305.3) | 1134.8 (1133.3–1136.4) | 786.3 (782.3–790.2) |
| 2010 | 1213.2 (1191.4–1235.0) | 639.8 (633.9–645.7) | 1369.7 (1364.3–1375.0) | 1137.0 (1135.4–1138.6) | 837.1 (832.4–841.9) |
Heart failure is indicated by codes ICD-10150.0,150.1,150.9. The parentheses represent 95% confidence intervals (Cl). Cl = confidence internal; ICD = International Classification of Diseases; HF = heart failure; US = United states
Centers for Disease Control and Prevention. CDC WONDER, [cited 2023 Jul 9]. Underlying Cause of Deaths, 1999–2020. Available from: https://wonder.cdc.gov/Deaths-by-Underlying-Cause.html
All-cause mortality rates among patients with HF are also higher for Black individuals compared with other racial and ethnic groups (Table 8).80 Age-adjusted all-cause mortality rates declined for all racial/ethnic groups from 2010 to 2015, but increased above 2010 rates for all groups by 2020.80 All-cause AAMRs in 2020 were highest in Black individuals (1,640.2/100,000) followed by non-Hispanic American Indian or Alaska Native (1,503.2/100,000), non-Hispanic White (1,256.1/100,000), Hispanic (1,088.9/100,000), and non-Hispanic Asian or Pacific Islander (710.6/100,000) individuals.
In the US (35–84 years), there were higher increases in mortality in rural areas (average annual percentage change = +1.3% [0.9%–1.8%] than in urban areas (+1.2% [0.7%–1.7%]).81
5.9. HF Mortality Rates According to Sex
AAMRs for cardiovascular deaths related to HF declined between 1999 and 2012 with an inflection point and subsequent increases for both women and men (Table 9, Figs. 14, and 15).77 Men have a higher AAMR for cardiovascular deaths related to HF and all-cause deaths related to HF (Figs. 14 and 15).71,73 In 2020, there were a total of 207,527 deaths (AAMR 84.6 per 100,000 population) in women and 208,395 deaths (AAMR 120.2) in men with HF as a underlying or contributing cause.82 Of those, 122,782 in women (AAMR 49.6) and 121,940 (AAMR 70.9) in men had a cardiovascular cause as the underlying cause of death (Table 9).
Table 9.
Absolute Deaths and AAMRs or HF Mortality Stratified by Sex
| Males | Females | ||||
|---|---|---|---|---|---|
| Year | Absolute Deaths, n | AAMR per 100,000 population | Year | Absolute Deaths, n | AAMR per 100,000 population |
| All-cause deaths related to heart failure | |||||
| 2018 | 178988 | 108.8 | 2018 | 187476 | 78.3 |
| 2019 | 186204 | 110.2 | 2019 | 191395 | 78.9 |
| 2020 | 208395 | 120.2 | 2020 | 207527 | 84.6 |
| Cardiovascular deaths related to heart failure | |||||
| 2018 | 113212 | 69.4 | 2018 | 178988 | 49.6 |
| 2019 | 118055 | 70.4 | 2019 | 186204 | 49.8 |
| 2020 | 121940 | 70.9 | 2020 | 208395 | 49.6 |
AAMR = age-adjusted mortality rates; HF = heart failure
Centers for Disease Control and Prevention and National Center for Health Statistics. National Vital Statistics System: Public Use Data File Documentation: Mortality Multiple Cause-Of-Death Micro-Data Files, 2017 [Internet]. 2022 [cited 2023 Feb 2], Available from: https://www.cdc.gov/nchs/nvss/mortality_public_use_data.htm
Fig. 14.
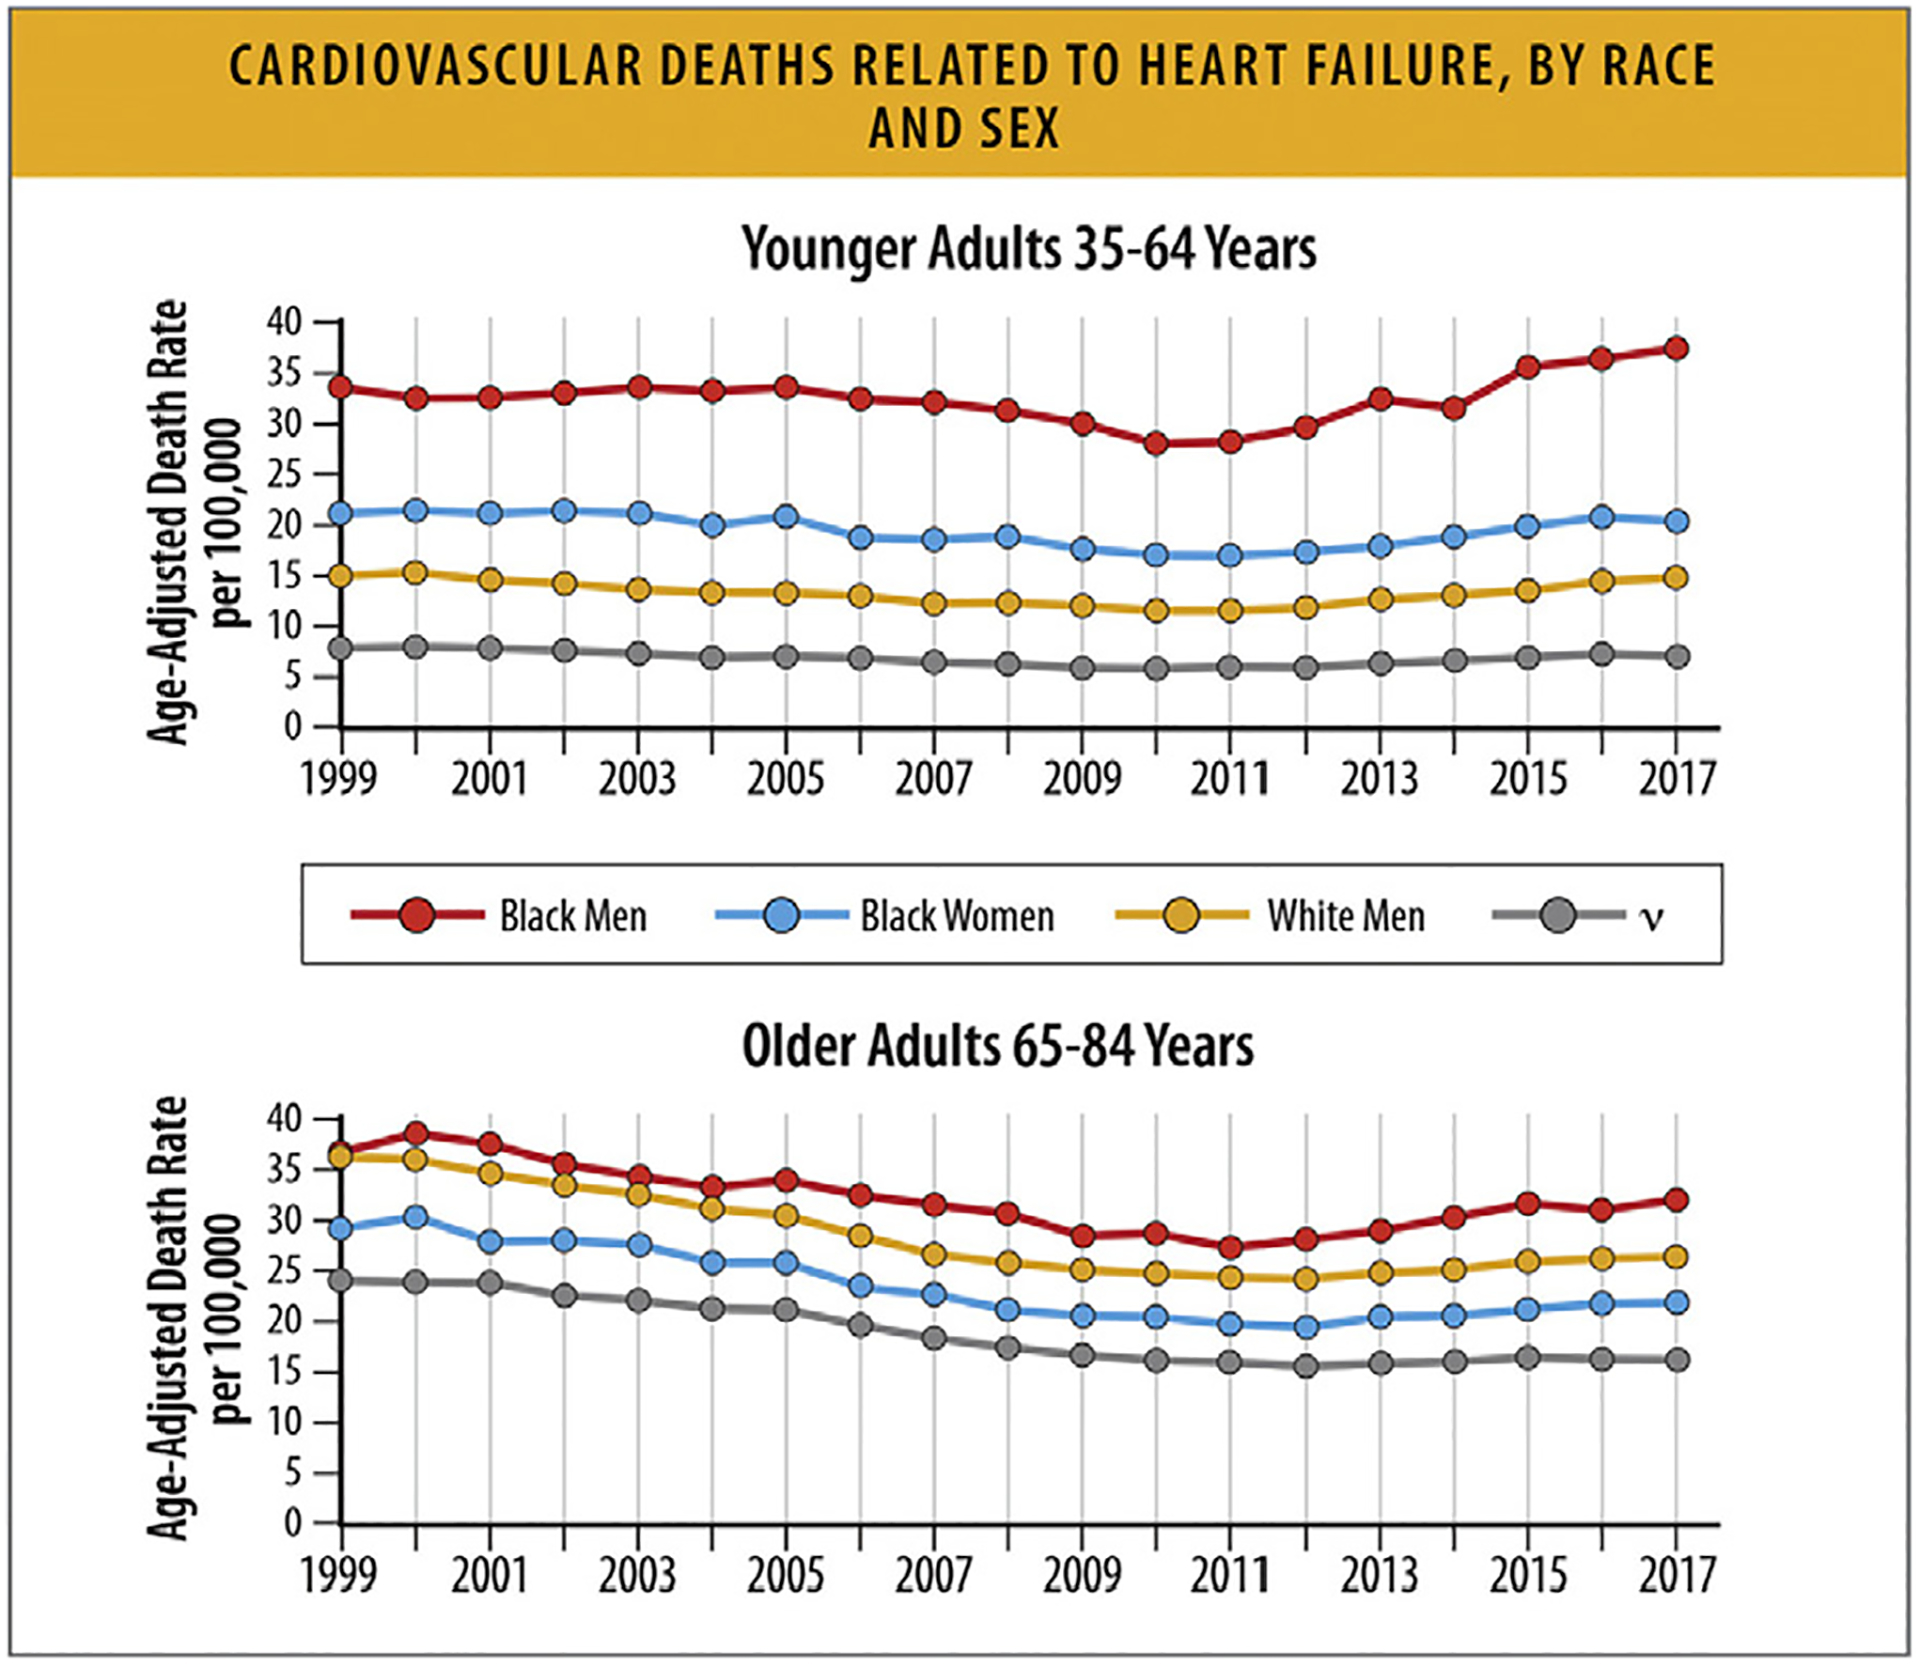
Cardiovascular deaths related to HF, by race and sex. HF = heart failure. Modified from Glynn P, Lloyd-Jones DM, Feinstein MJ, Carnethon M, Khan SS. Disparities in cardiovascular mortality related to heart failure in the United States. J Am Coll Cardiol 2019;73:2354–5; and Tromp J, Beusekamp JC, Ouwerkerk W, van der[C0]Meer P, Cleland JGF, Angermann CE, et al. Regional differences in precipitating factors of hospitalization for acute heart failure: insights From the REPORT-HF Registry. Eur J Heart Fail 2022;24:645–52.
Fig. 15.
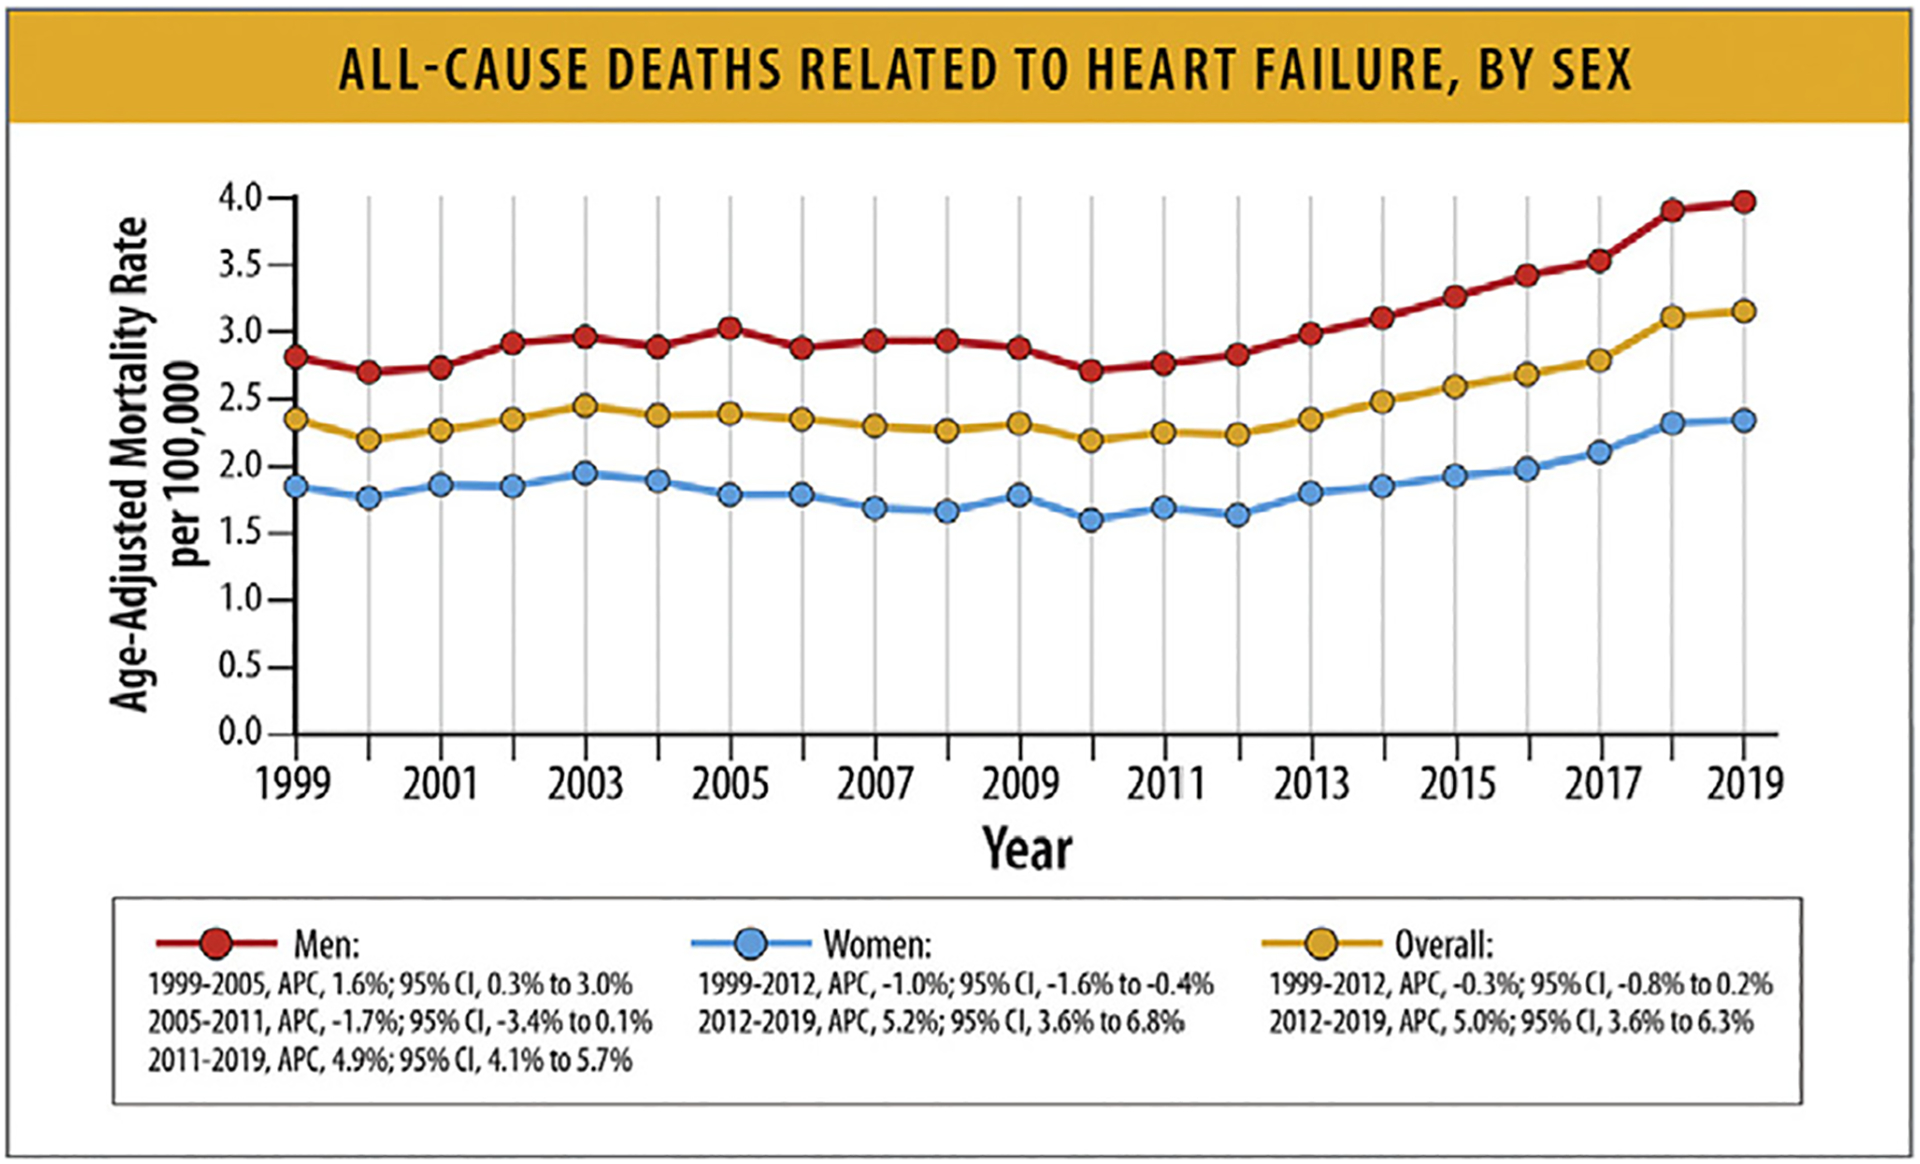
All-cause deaths related to HF, by sex.12 APC = annual percentage change; CI = confidence interval; HF = heart failure. Modified from Glynn P, Lloyd-Jones DM, Feinstein MJ, Carnethon M, Khan SS. Disparities in cardiovascular mortality related to heart failure in the United States. J Am Coll Cardiol 2019;73:2354–5; and Tromp J, Beusekamp JC, Ouwerkerk W, van der Meer P, Cleland JGF, Angermann CE, et al. Regional differences in precipitating factors of hospitalization for acute heart failure: insights from the REPORT-HF Registry. Eur J Heart Fail 2022;24:645–52.
Among patients hospitalized with acute decompensated HF in the Get With the Guidelines (GWTG)-Heart Failure registry between January 1, 2005, and September 29, 2010, in-hospital mortality was not different by sex by HF subtypes (EF <40%, 2.69% women vs 2.89% men; EF ≥50%, 2.61% women vs 2.62% men).83 Among patients in the Scientific Registry of Transplant Recipients who underwent heart transplantation from January 1, 2004, to July 1, 2018, all-cause mortality was not different by sex at a median follow-up of 3.9 years (2020 deaths out of 7779 women and 6258 deaths out of 22,828 men (Fig. 16).84
Fig. 16.
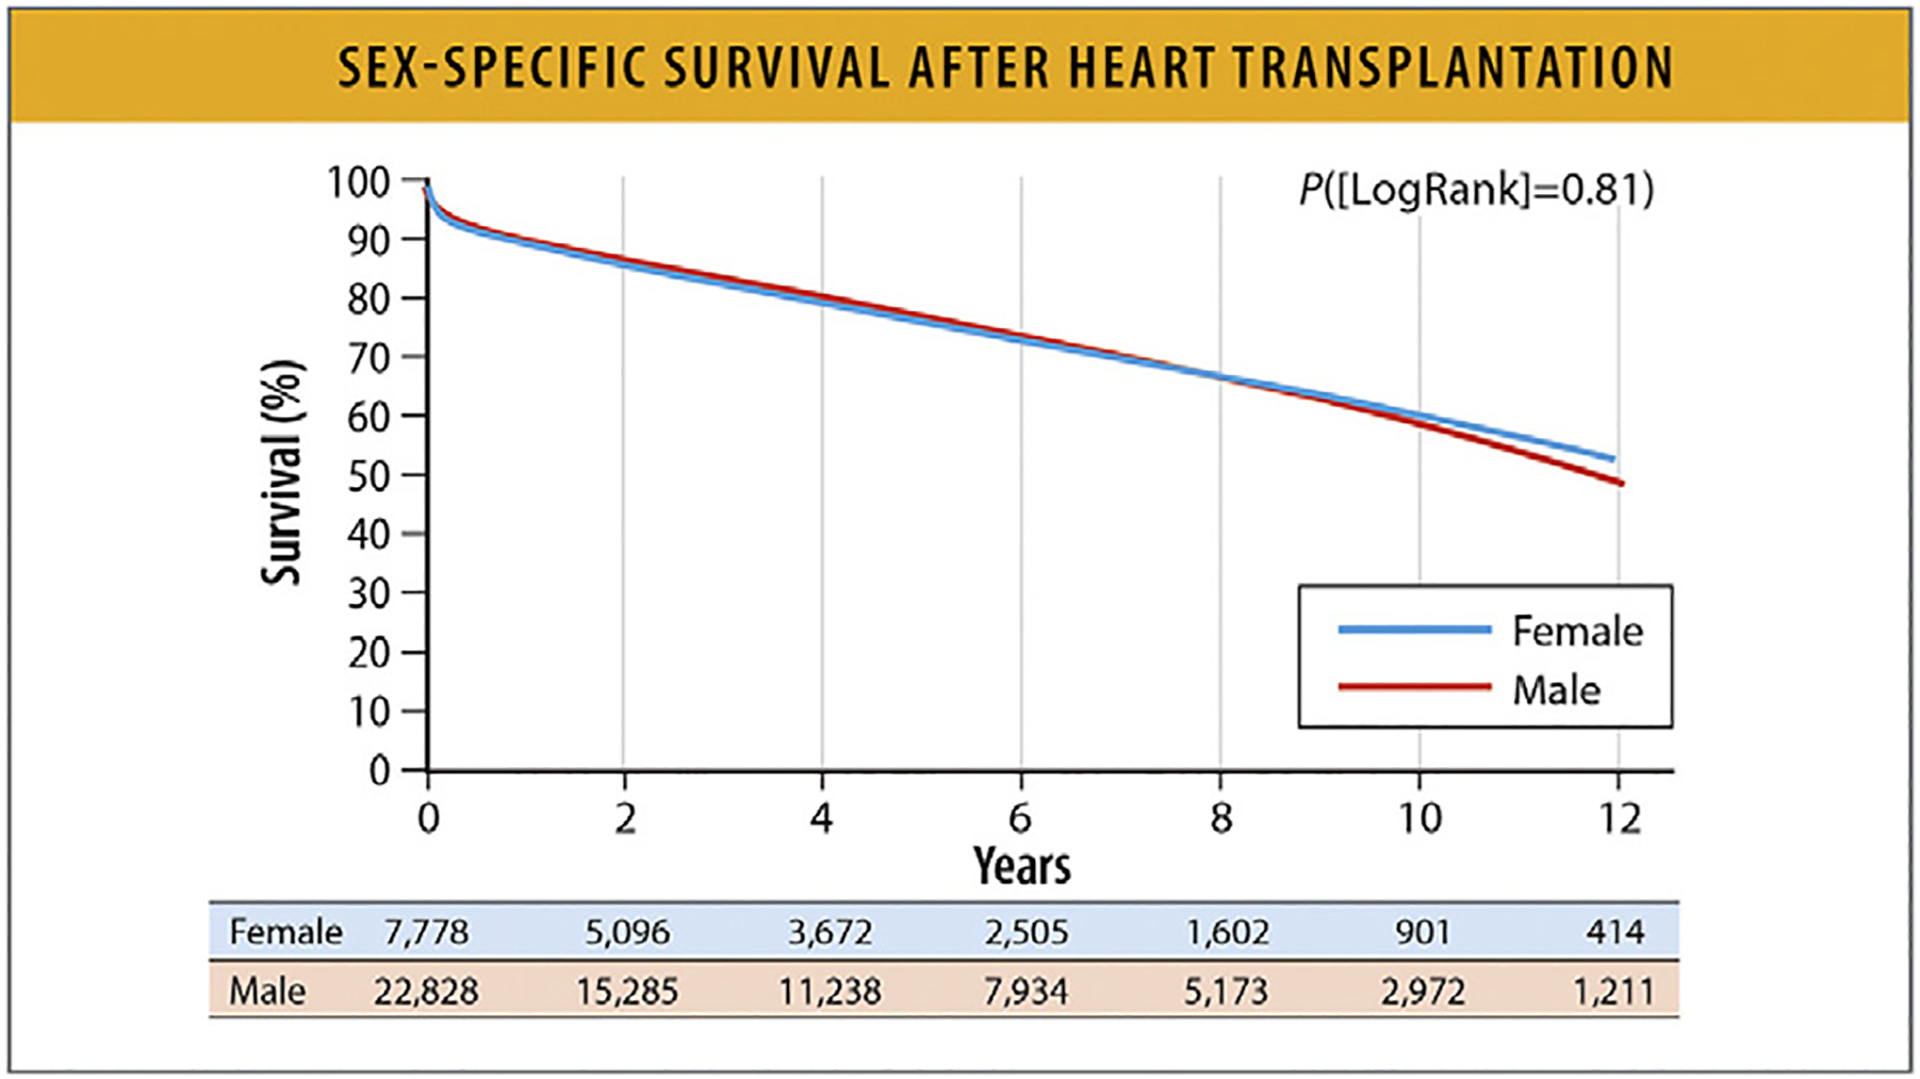
Sex-specific survival after heart transplantation.18 Modified from Hsich EM, Blackstone EH, Thuita LW, McNamara DM, Rogers JG, Yancy CW, et al. Heart transplantation: an in-depth survival analysis. JACC Heart Fail 2020;8:557–68.
5.10. HF Mortality Rates According to Age
In general, HF mortality declined from 2000 to 2012 for all age groups, then increased from 2012 to 2018. National data on HF mortality rates by age are generally available through 2018. These reports, mainly from the CDC WONDER database, show that HF mortality rates declined from 2000 to 2012 for all age groups, and then steadily but differentially increased through 2018 across different age groups.82
HF-related mortality is much higher in older (age 65–84 years) compared with younger (age 35–64 years) patients (Fig. 17).82 Over time, a greater relative annual increase in HF-related mortality was seen in younger (35–64 years) compared with older (65–84 years) adults in the US (Fig. 17).82
Fig. 17.
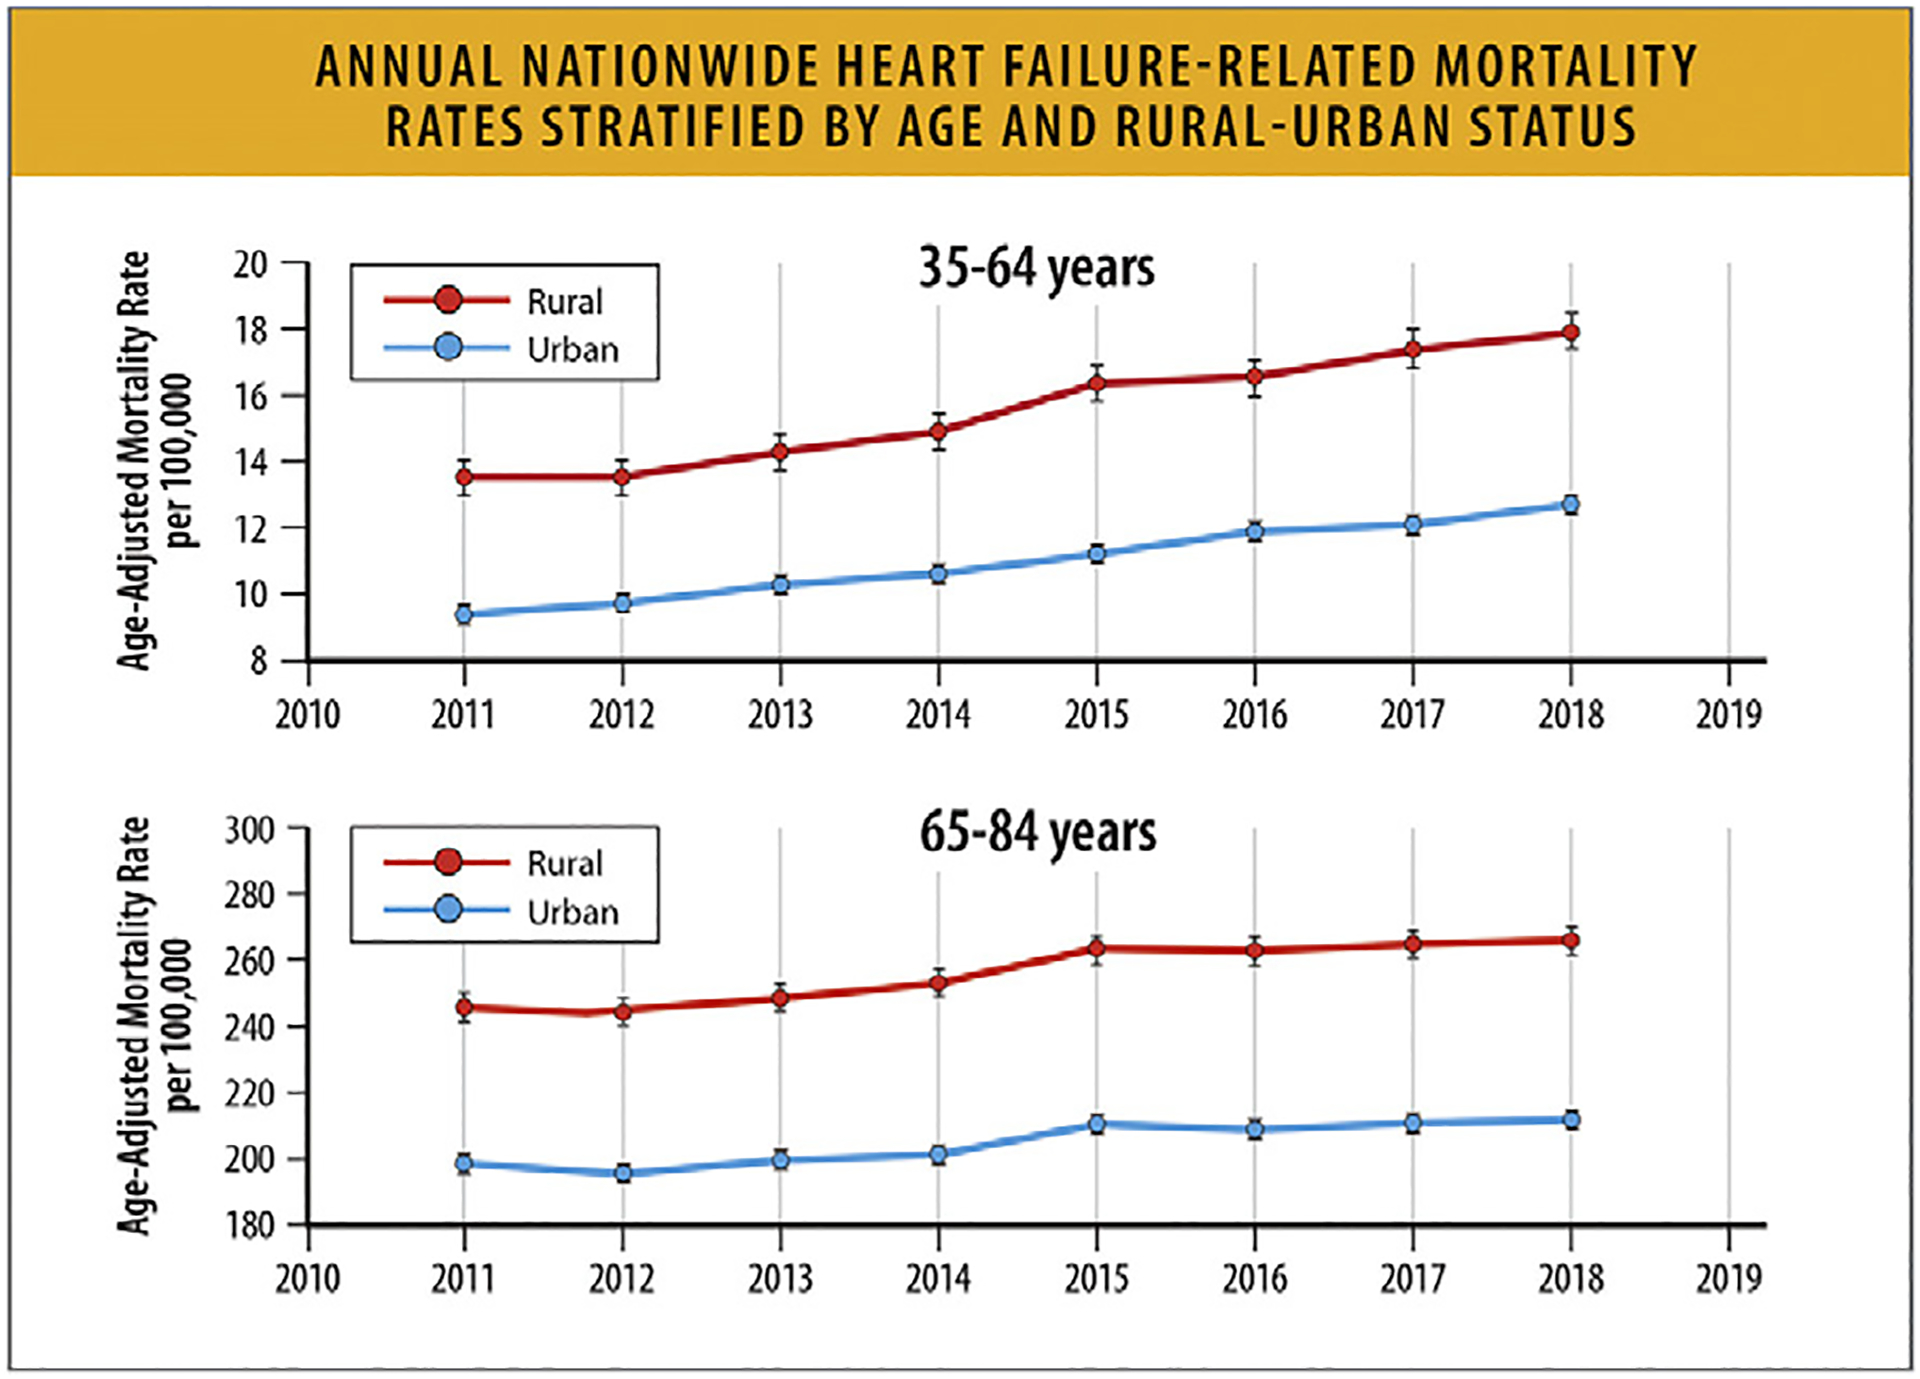
Annual nationwide HF-related mortality rates stratified by age and rural–urban status, CDC WONDER 2011–2018.81 CDC = Centers for Disease Control and Prevention; HF = heart failure; WONDER = Wide-ranging Online Data for Epidemiologic Research. Modified from Pierce JB, Shah NS, Petito LC, Pool L, Lloyd-Jones DM, Feinglass J, et al. Trends in heart failure-related cardiovascular mortality in rural versus urban United States counties, 2011–2018: a cross-sectional study. PLoS One 2021;16:e0246813.
According to an analysis of CDC WONDER data that focused on young adults between the ages of 15–44 years, between the dates of 1999–2019, overall AAMR per 100,000 young adults increased from 2.36 in 1999 to 3.16 in 2019 (Fig. 18). HF AAMR was higher in men compared with women and Black individuals compared with other racial and ethnic groups.69
Fig. 18.
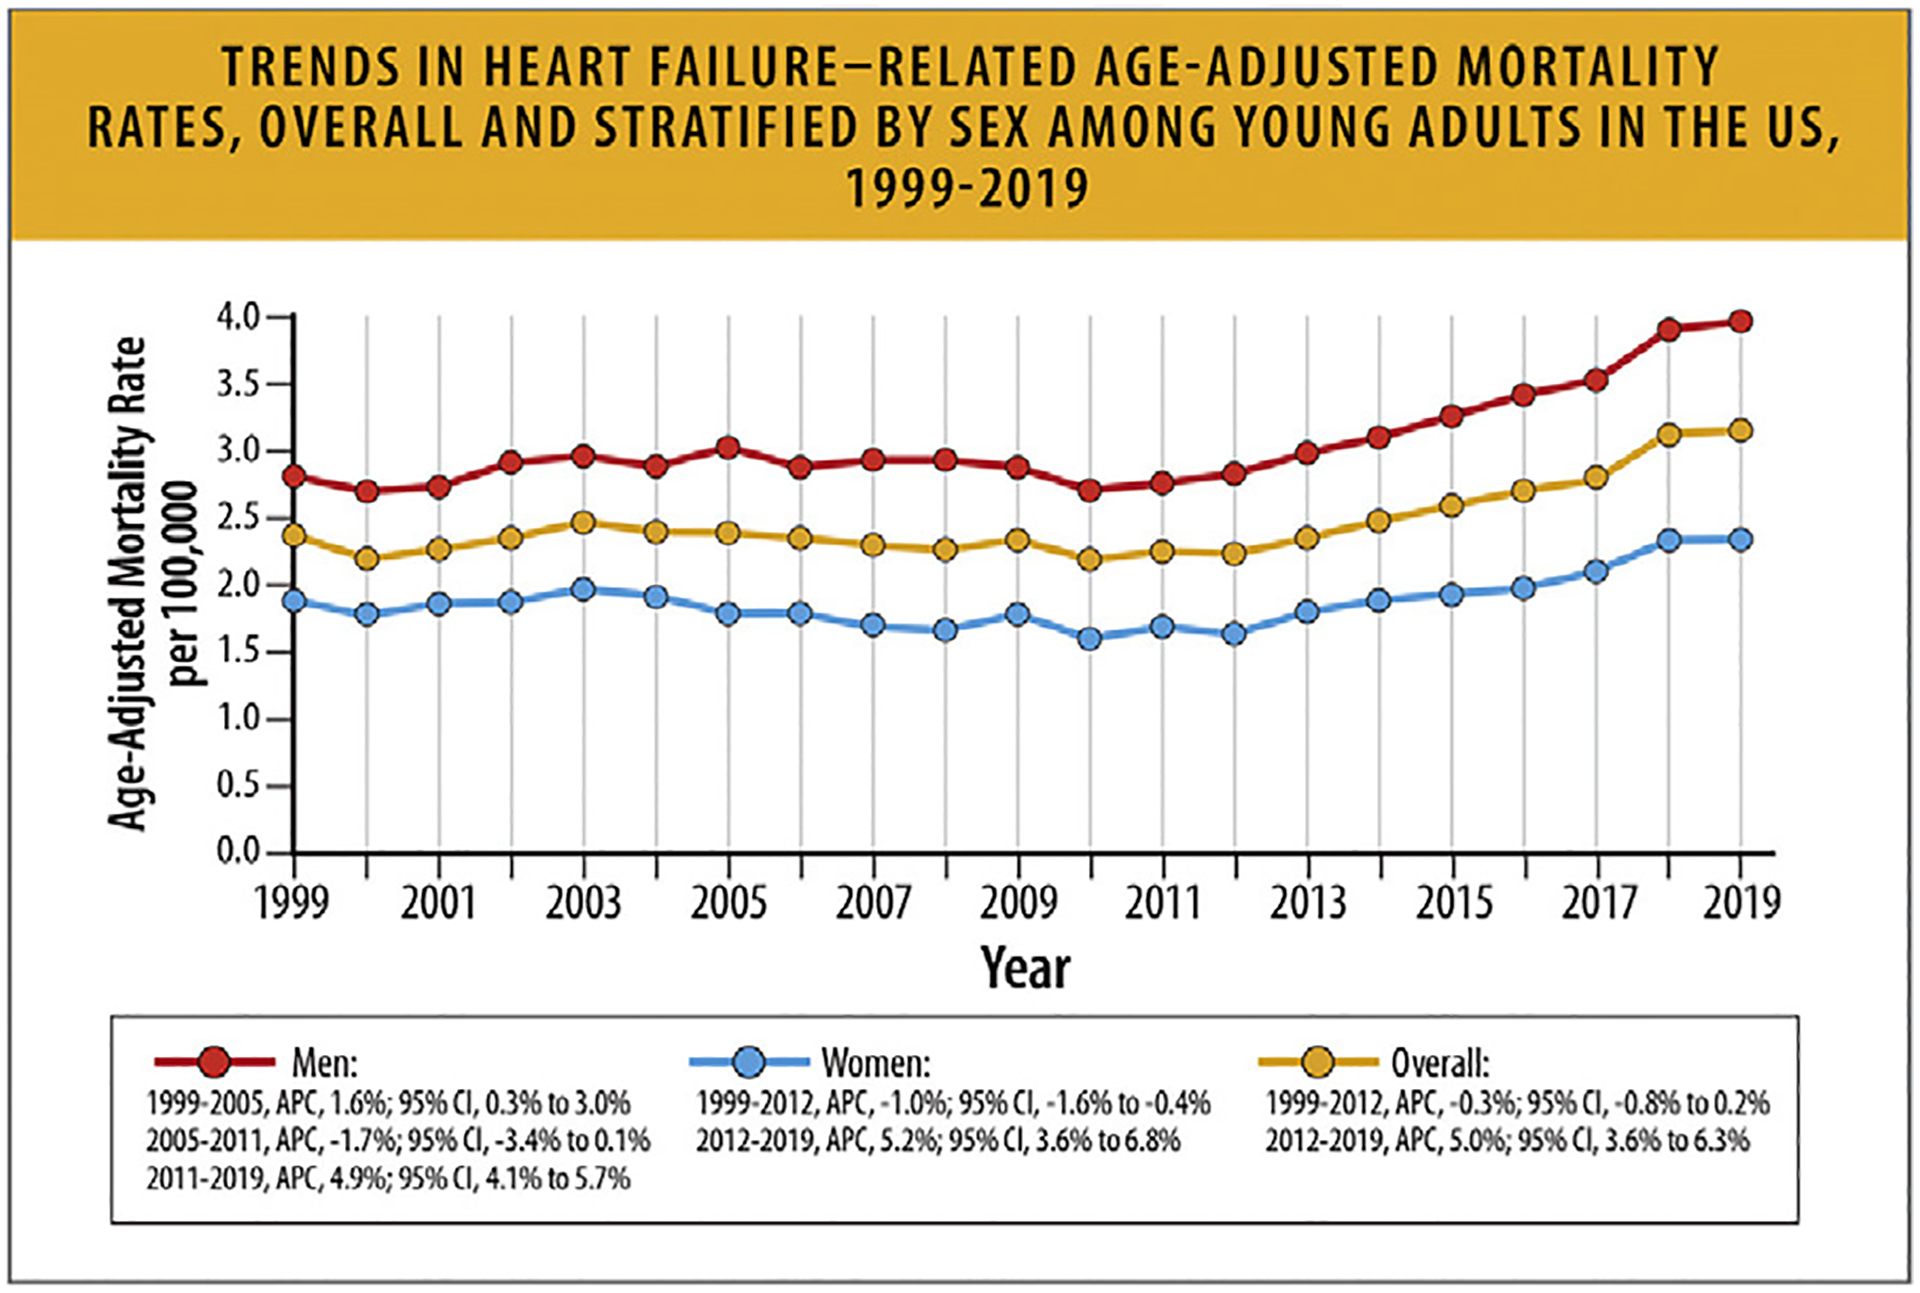
Trends in HF-related age-adjusted mortality rates, overall and stratified by sex among young adults in the United States, 1999 to 2019.3 APC = annual percentage change; CI = confidence interval; HF = heart failure; US = United States. Modified from Jain V, Minhas AMK, Morris AA, Greene SJ, Pandey A, Khan SS, et al. Demographic and regional trends of heart failure-related mortality in young adults in the United States, 1999–2019. JAMA Cardiol 2022;7:900–4.
According to another analysis of CDC WONDER data that focused on older adults, age 75 years and older between 1999 and 2019, overall AAMR declined from 141.0 in 1999 to 108.3 in 2012, but then increased to 121.3 in 2019 (Fig. 19). AAMR varied by sex (men > women), race (higher in non-Hispanic White individuals), and region (highest in Midwest).72
Fig. 19.
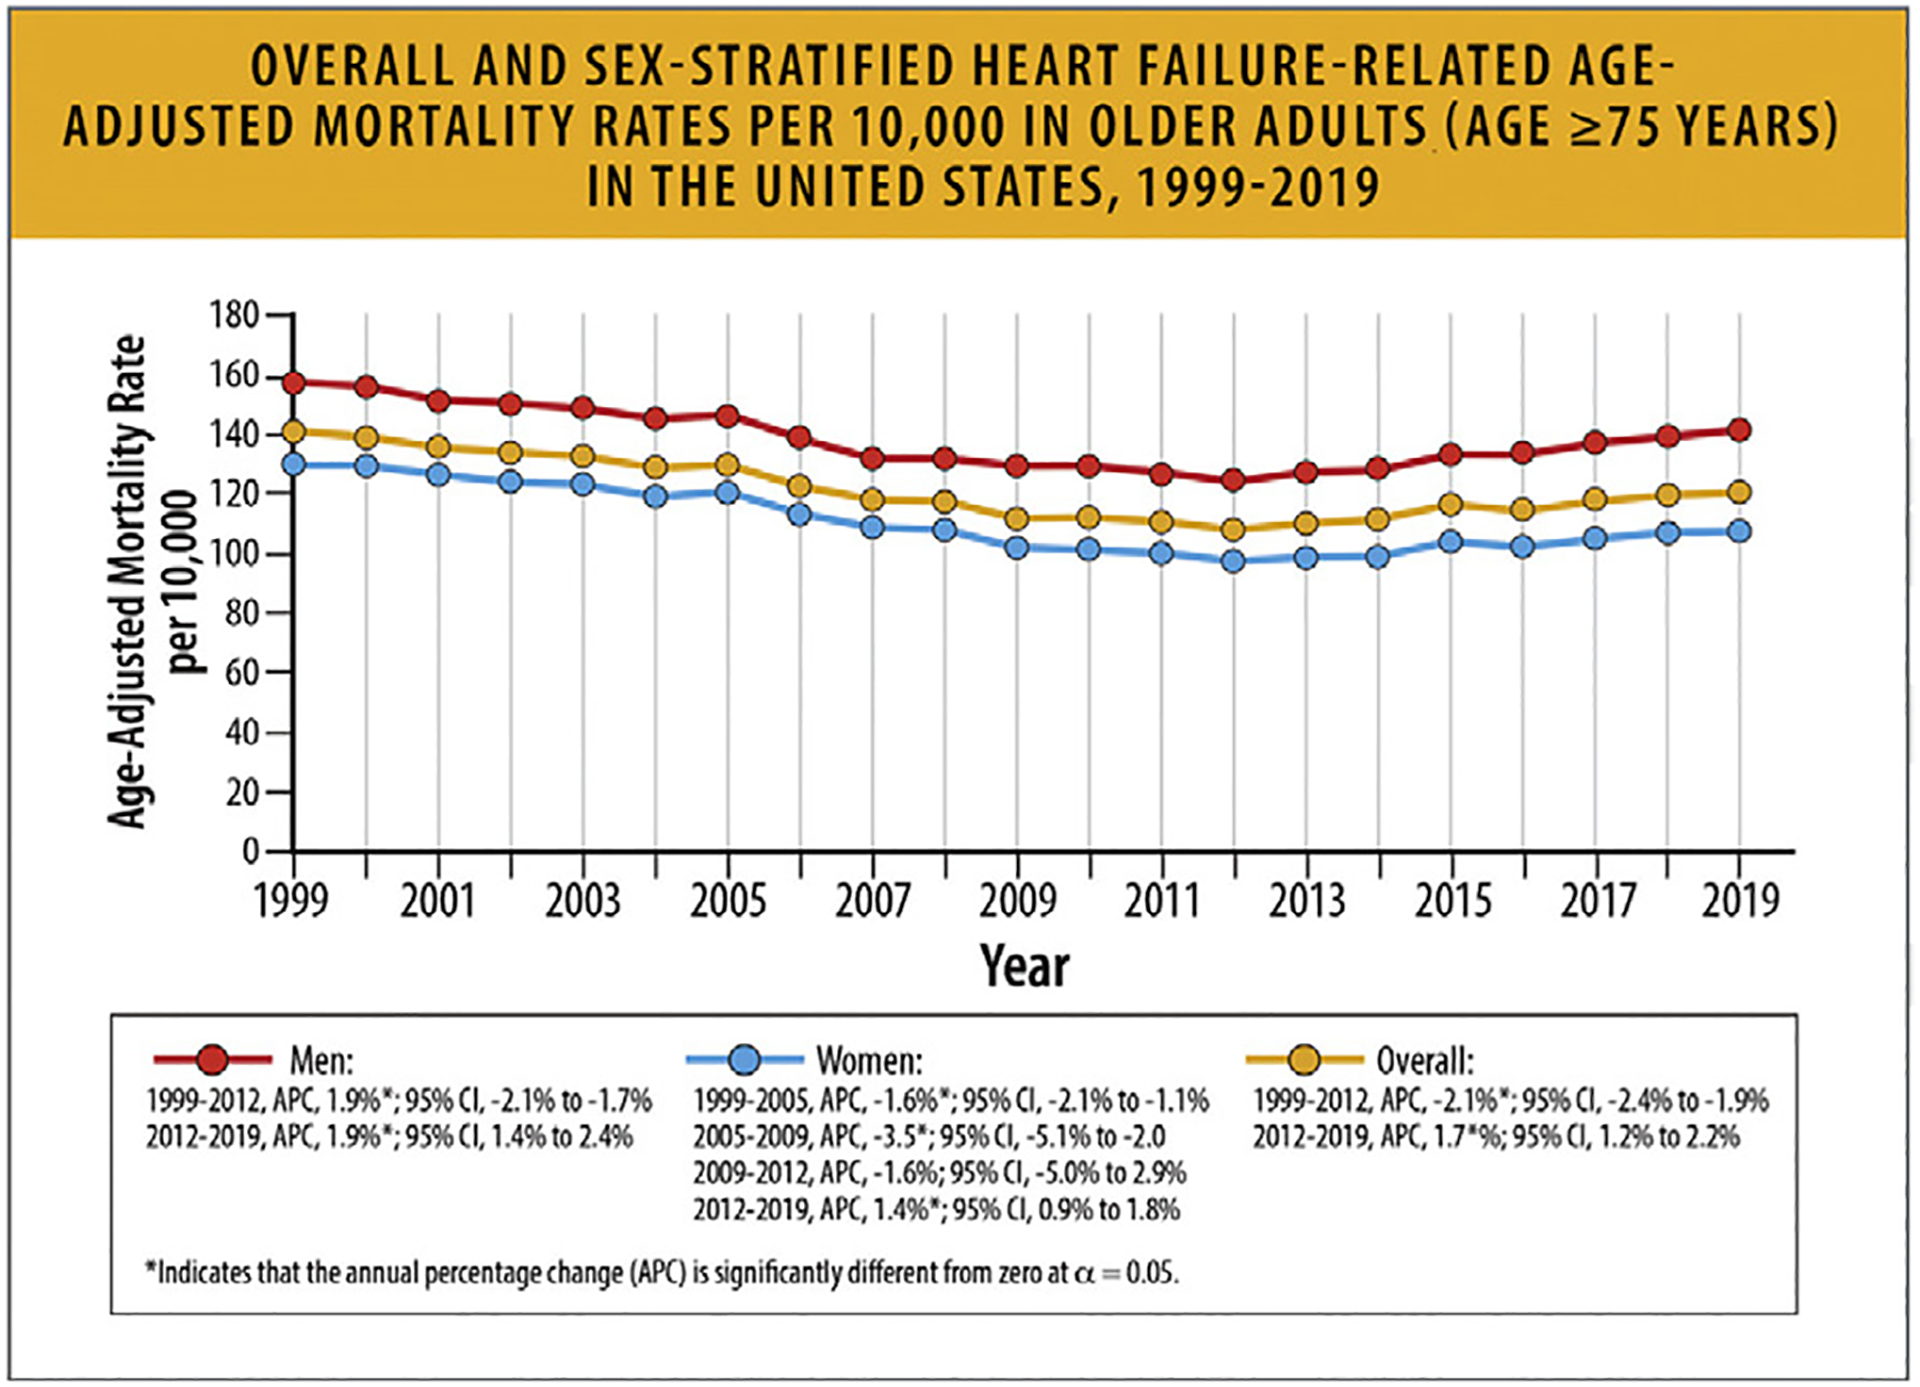
Overall and sex-stratified hf-related age-adjusted mortality rates per 10,000 in older adults (age ≥ 75 years) in the United States, 1999–2019.6 HF = heart failure; US = United States. Modified from TJ, Khan Minhas AM, Greene SJ, Van Spall HGC, Khan SS, Pandey A, et al. Trends in heart failure-related mortality among older adults in the United States from 1999–2019. JACC Heart Fail 2022;10:851–9.
Rural areas demonstrate higher HF mortality for both younger and older age groups, and HF-related mortality rates have increased over time since 2012 (Table 10 and Fig. 17).81 Regardless of rural-urban status, a greater relative annual increase in HF-related mortality rates occurred for younger compared with older adults (Table 10).
Table 10.
AAMR and Average Annual Change in HF-Related Mortality Between Rural and Urban Adults81
| Overall | Age 35–64 y | Age 65–84 y | |||||||
|---|---|---|---|---|---|---|---|---|---|
| AAMR 2011 (per 100,000 population)* | AAMR 2018 (per 100,000 population)* | AAPC† | AAMR 2011 (per 100,000 population)* | AAMR 2018 (per 100,000 population)* | AAPC† | AAMR 2011 (per 100,000 population)* | AAMR 2018 (per 100,000 population)* | AAPC† | |
| Rural ‡ | |||||||||
| Overall | 65.3 (64.3–66.3) | 73.2 (72.2–74.2) | +1.9 (1.4–2.4) | 13.6 (13.1–14.1) | 18.0 (17.5–18.6) | +4.6 (3.7–5.5) | 244.7 (240.8–248.7) | 264.5 (260.7–268.3) | +1.3 (0.9–1.8) |
| Black women | 80.5 (74.8–86.3) | 88.7 (83.0–94.5) | +1.9 (0.8–3.1) | 27.0 (23.5–30.5) | 32.7 (28.8–36.7) | +4.2 (1.6–6.7) | 266.3 (243.7–288.9) | 283.1 (261.5–304.7) | +1.0 (0.2–1.9) |
| White women | 51.4 (50.2–52.5) | 55.7 (54.5–56.9) | +1.3 (0.6–2.0) | 8.5 (7.9–9.0) | 11.0 (10.3–11.6) | +4.1 (2.6–5.6) | 200.2 (195.2–205.1) | 210.9 (206.1–215.7) | +0.9 (0.2–1.5) |
| Black men | 106.4 (98.5–114.2) | 131.1 (123.3–138.9) | +3.2 (1.9–4.5) | 35.9 (31.8–40.0) | 52.3 (47.4–57.3) | +6.1 (3.7–8.5) | 350.8 (318.7–382.8) | 404.4 (374.2–434.7) | +2.0 (1.1–2.9) |
| White men | 77.2 (75.6–78.8) | 86.8 (85.3–88.4) | +2.0 (1.5–2.5) | 15.6 (14.8–16.4) | 20.8 (19.8–21.7) | +4.5 (37–5.4) | 291.0 (284.5–297.6) | 316.1 (309.8–322.4) | +1.5 (1.1–2.0) |
| Urban ‡ | |||||||||
| Overall | 51.8 (51.4–52.2) | 57.2 (56.8–57.6) | +1.7 (1.2–2.1) | 9.5 (9.3–9.7) | 12.8 (12.6–13.0) | +4.4 (4.0–4.9) | 198.5 (196.8–200.2) | 198.5 (196.8–200.2) | +1.2 (0.7–1.7) |
| Black women | 56.2 (54.5–57.9) | 64.6 (63.0–66.1) | +2.3 (1.7–2.9) | 15.4 (54.5–57.9) | 19.8 (18.9–20.7) | +3.6 (27–4.5) | 197.7 (190.8–204.5) | 197.7 (190.8–204.5) | +1.9 (1.3–2.6) |
| White women | 39.5 (39.0–40.0) | 40.5 (40.0–41.0) | +0.7 (0.1–1.2) | 5.2 (5.0–5.4) | 6.4 (6.2–6.6) | +3.4 (2.4–4.4) | 158.6 (156.5–160.7) | 158.6 (156.5–160.7) | +0.3 (-0.3–1.0) |
| Black men | 80.9 (78.4–83.3) | 101.9 (99.5–104.2) | +3.3 (2.6–3.9J | 27.1 (25.9–28.3) | 37.7 (36.4–39.1) | +4.8 (3.8–5.7) | 267.4 (257.4–277.3) | 267.4 (257.4–277.3) | +2.7 (1.9–3.5) |
| White men | 62.0 (61.3–62.7) | 69.0 (68.4–69.7) | +1.8 (1.4–2.1) | 10.2 (9.9–10.5) | 13.8 (13.5–14.1) | +4.6 (4.2–4.9) | 241.8 (238.8–244.8) | 241.8 (238.8–244.8) | +1.3 (0.9–1.8) |
AAMR per 100,000 calculated by direct method using 2000 US Census as the standard population
Average annual percent change calculated using Joinpoint Regression Program version 4.7 (National Cancer Institute)
Rural-urban status grouped based on the 2013 NCHS Urban-Rural Classification Scheme for Counties
AAMR = age-adjusted mortality rate; AAPC = average annual percentage change; HF = heart failure; NCI = National Cancer Institute
Pierce JB, Shah NS, Petito LC, Pool L, Uoyd-Jones DM, Feinglass J, et al. Trends in Heart Failure-Related Cardiovascular Mortality in Rural Versus Urban United States Counties, 2011–2018: A Cross-Sectional Study. PLoS One. 2021;16(3):e0246813.
According to historical data from National Vital Statistics System (NVSS) provided by the NCHS between 2000 and 2014, HF-related death rates declined from 2000 to 2012 for all age groups (45–64, 65–74, 75–84, and ≥85 years) and for both women and men. The death rate increased for all age (and sex) subgroups from 2012 to 2014. In 2014, the death rate was highest for adults 85 years and older (2333.5 deaths per 100,000 population for women and 2842.9 for men), followed by adults aged 75–84 (504.7 for women and 720.0 for men), adults aged 65–74 (124.6 for women and 201.8 for men), and adults aged 45–64 (24.0 for women and 41.3 for men) (Fig. 20).85
Fig. 20.
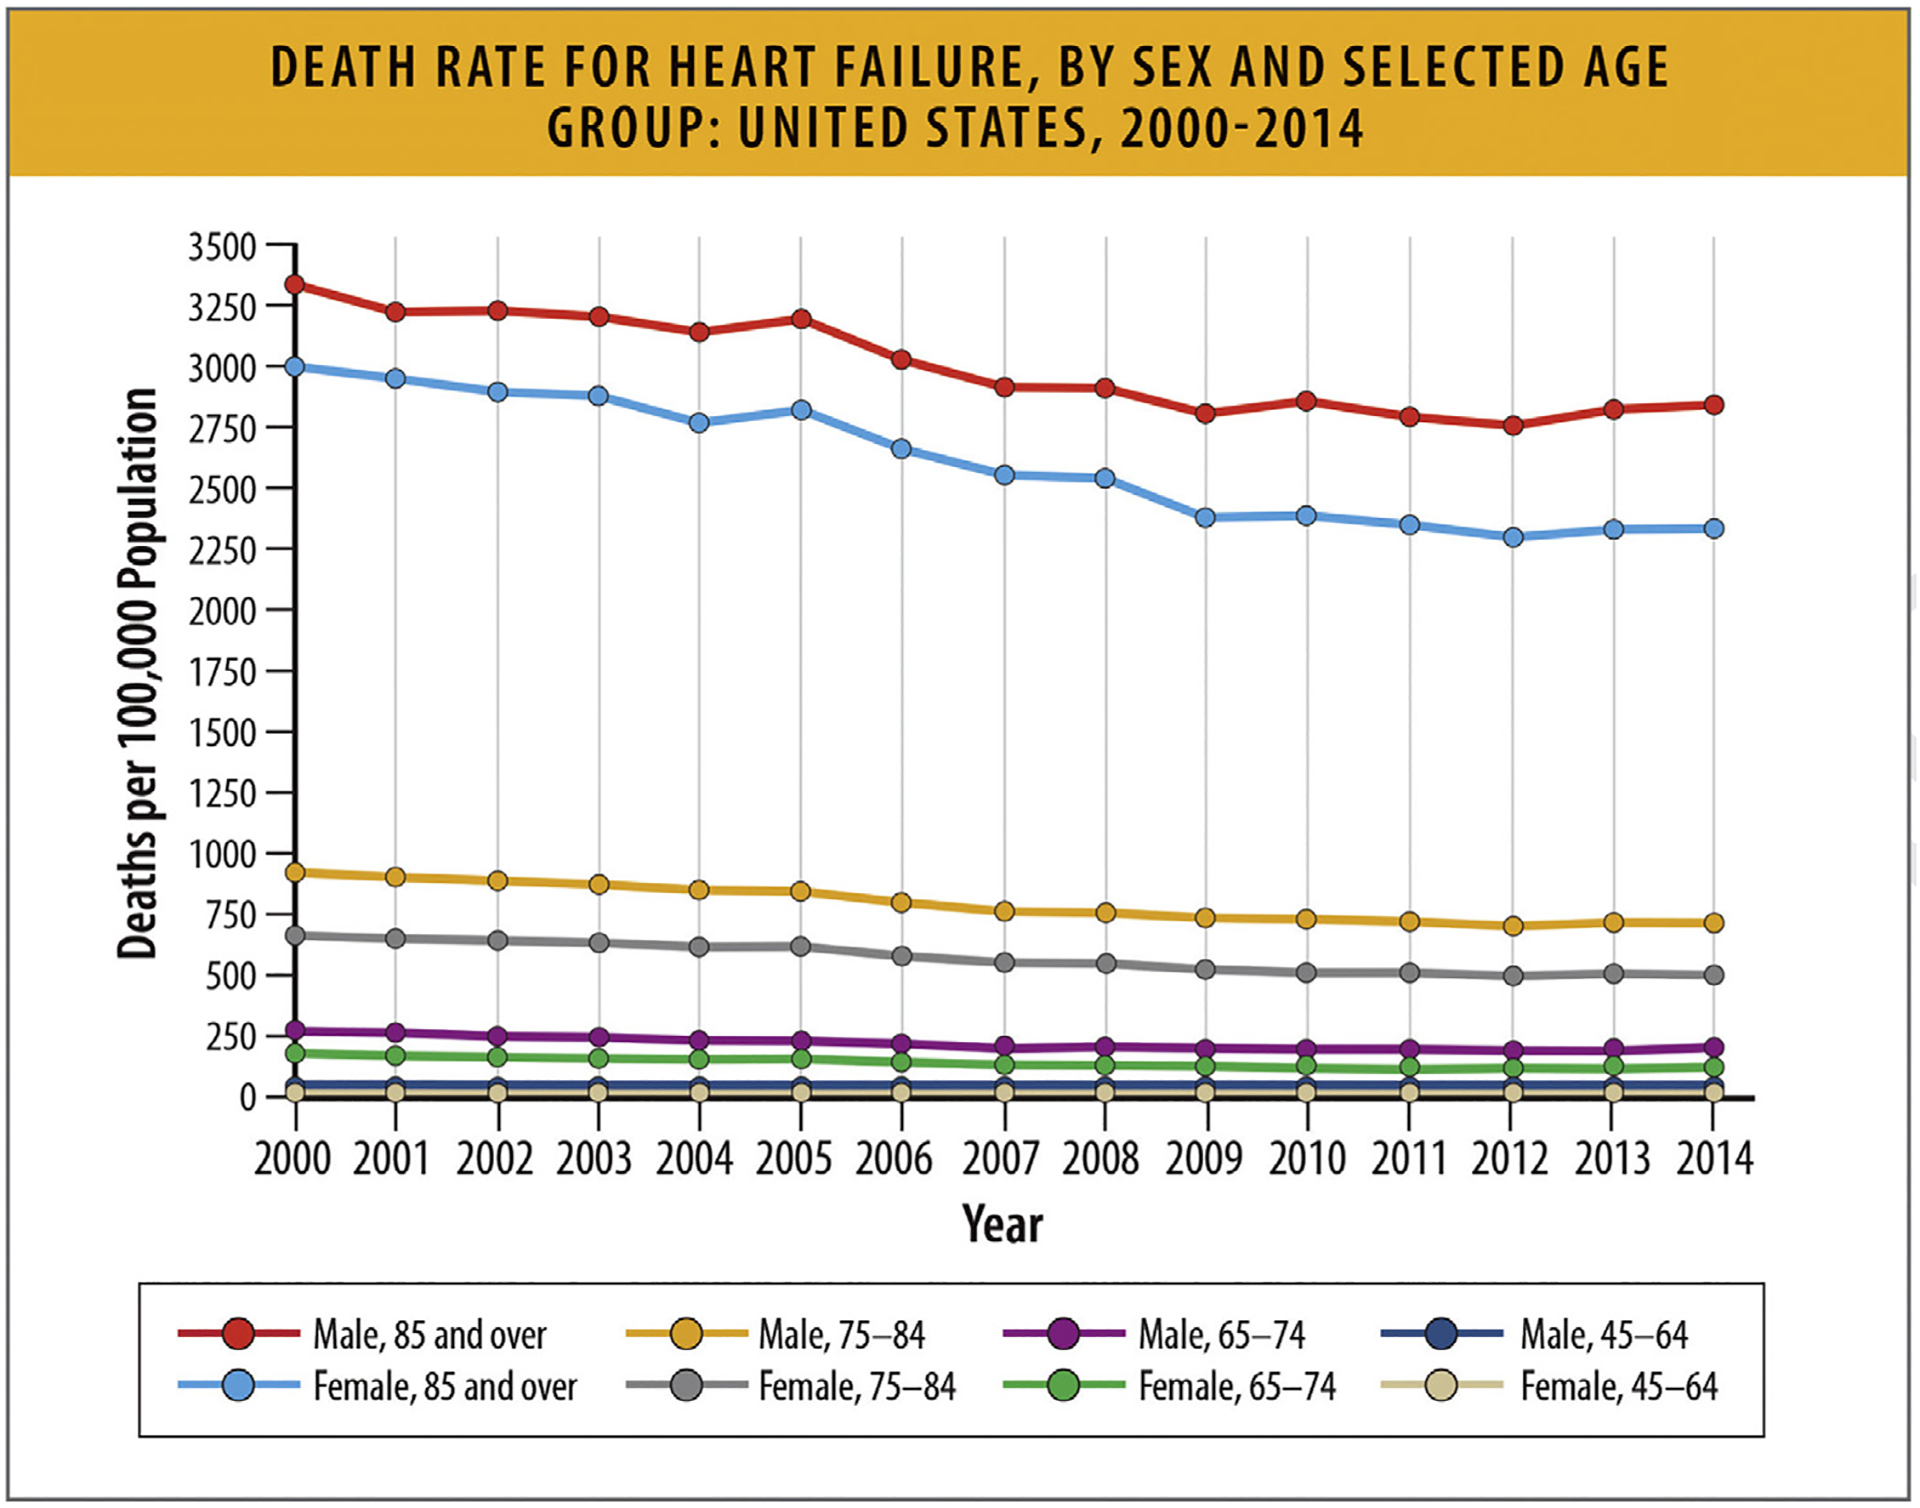
Death rate for HF, by sex and selected age group: United States, 2000–2014. HF = heart failure. From Ni H, Xu J. Recent trends in heart failure-related mortality: United States, 2000–2014. NCHS Data Brief 2015;231:1–8.
According to data from the NVSS between 1991 and 2015, HF-mortality increases with increasing age—it is much higher in adults aged 80 years and older, and adults 70–79 years, compared with younger age groups (Fig. 21).86
Fig. 21.
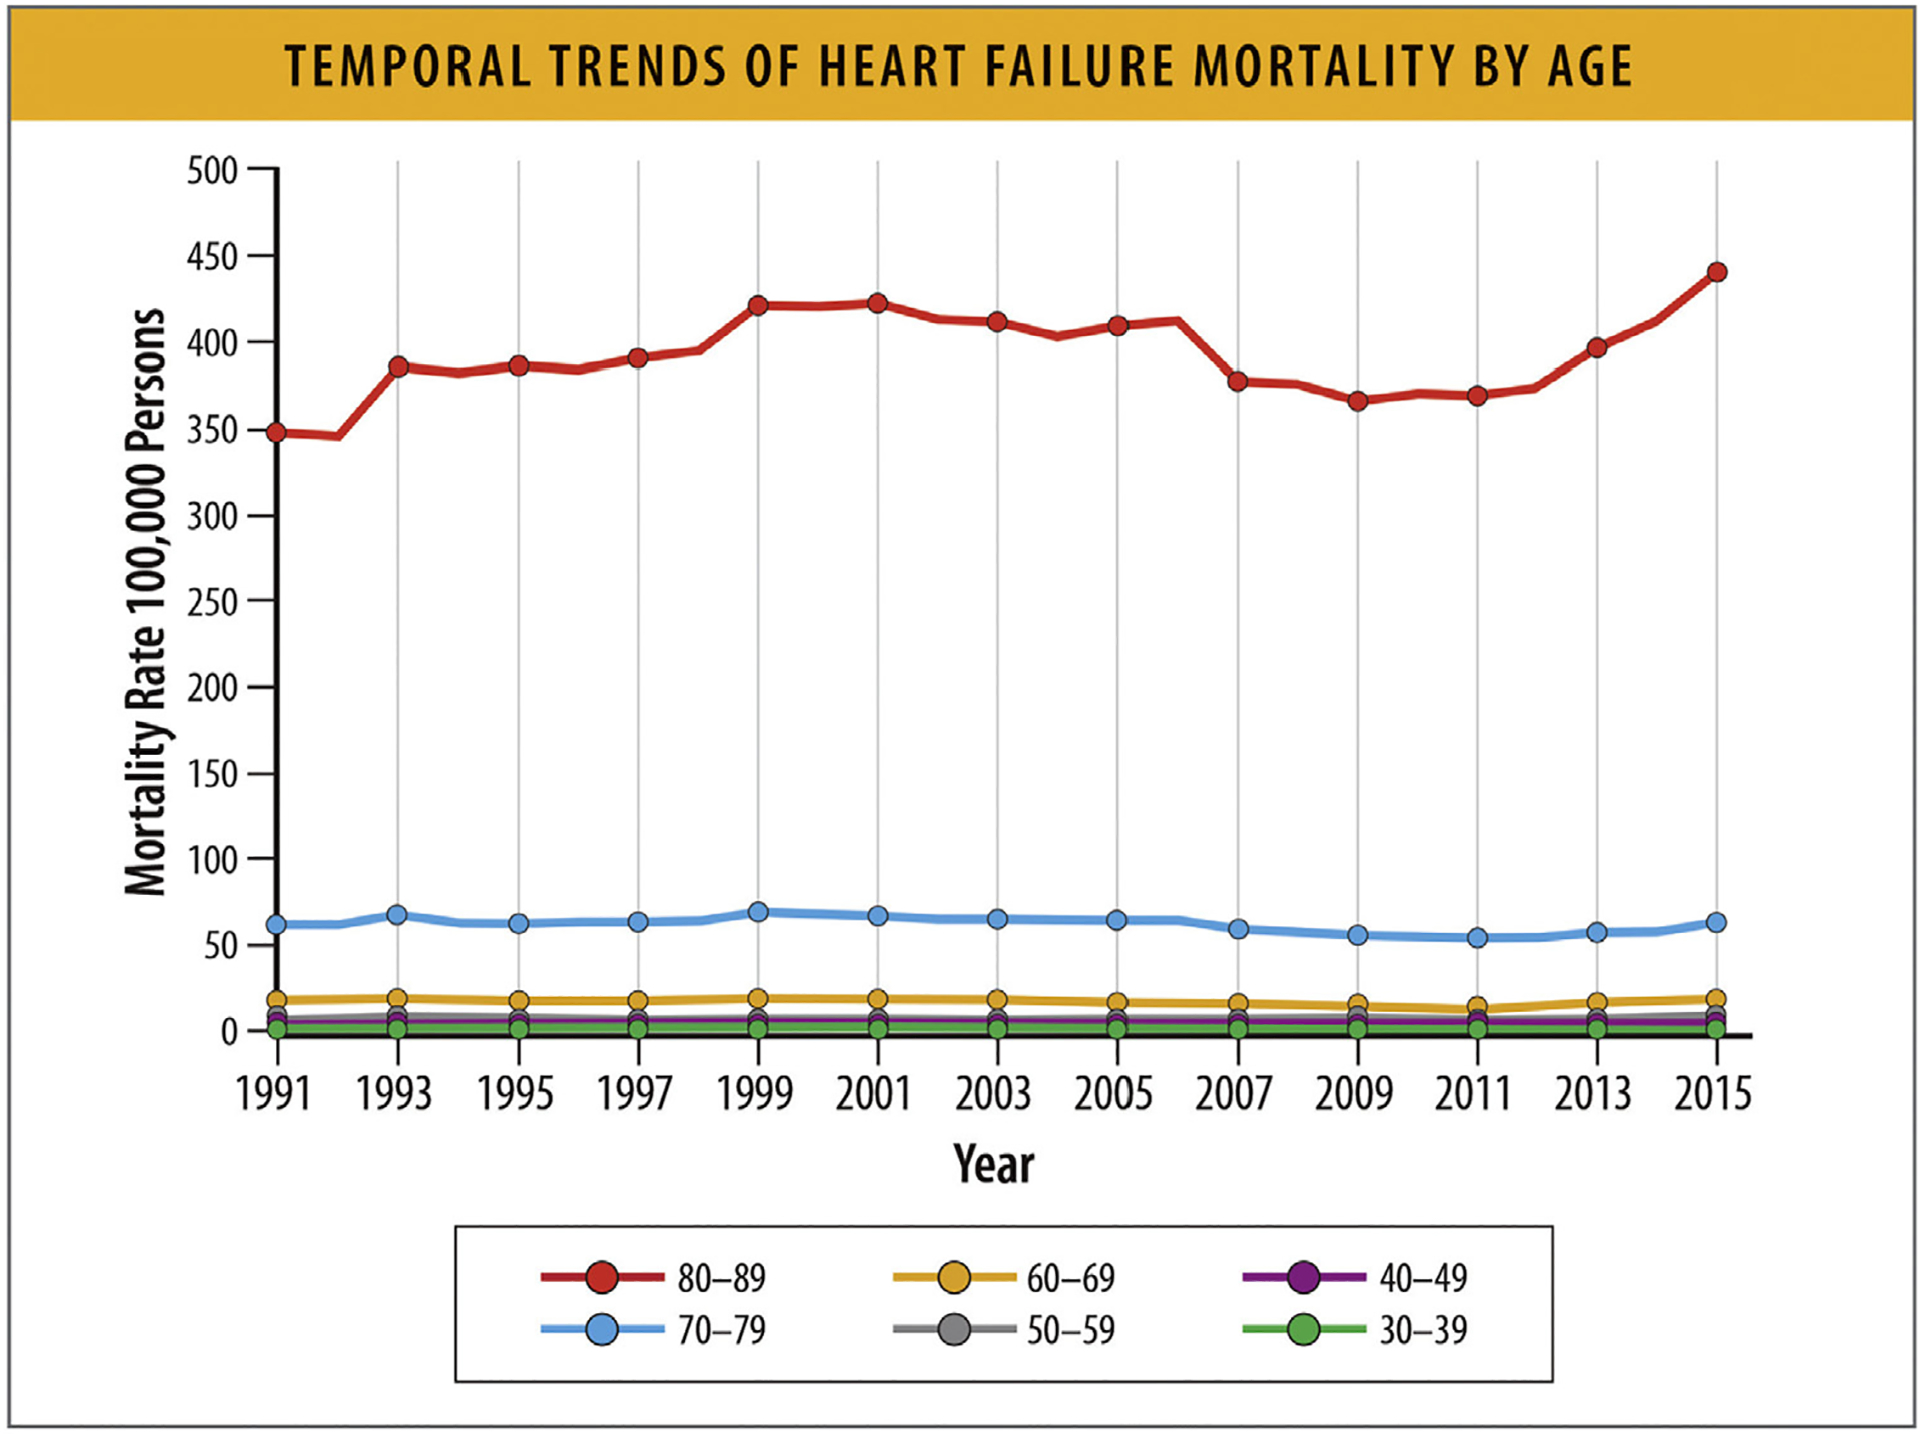
Temporal trends for HF mortality by age. HF = heart failure. Modified from Vasan RS, Zuo Y, Kalesan B. Divergent temporal trends in morbidity and mortality related to heart failure and atrial fibrillation: age, sex, race, and geographic differences in the United States, 1991–2015. J Am Heart Assoc 2019;8:e010756.
According to data from a UK population-based registry, which examined cause-specific mortality rates at 1 year after HF diagnosis between 2002 and 2014, all-cause mortality declined among patients aged less than 80 years (relative risk in 2013 vs 2002 0.79, 95% CI 0.71–0.88) but not in patients aged 80 years and older (relative risk 2013 vs 2002 0.97, 95% CI 0.9–1.06) (Fig. 22). Cause-specific analyses showed that cardiovascular mortality declined across all age groups, but less so in older patients, and that the increase in noncardiovascular mortality was larger in the older age groups. Digestive diseases (eg, cirrhosis) and cancer were more common in younger patients, and infections and mental health/neurological disorders were more common in older patients. These data suggest that in patients with HF, cardiovascular mortality has declined over time (more so in younger patients) but noncardiovascular mortality has increased over time (more so in older patients) and that causes of death vary by age groups.25
Fig. 22.
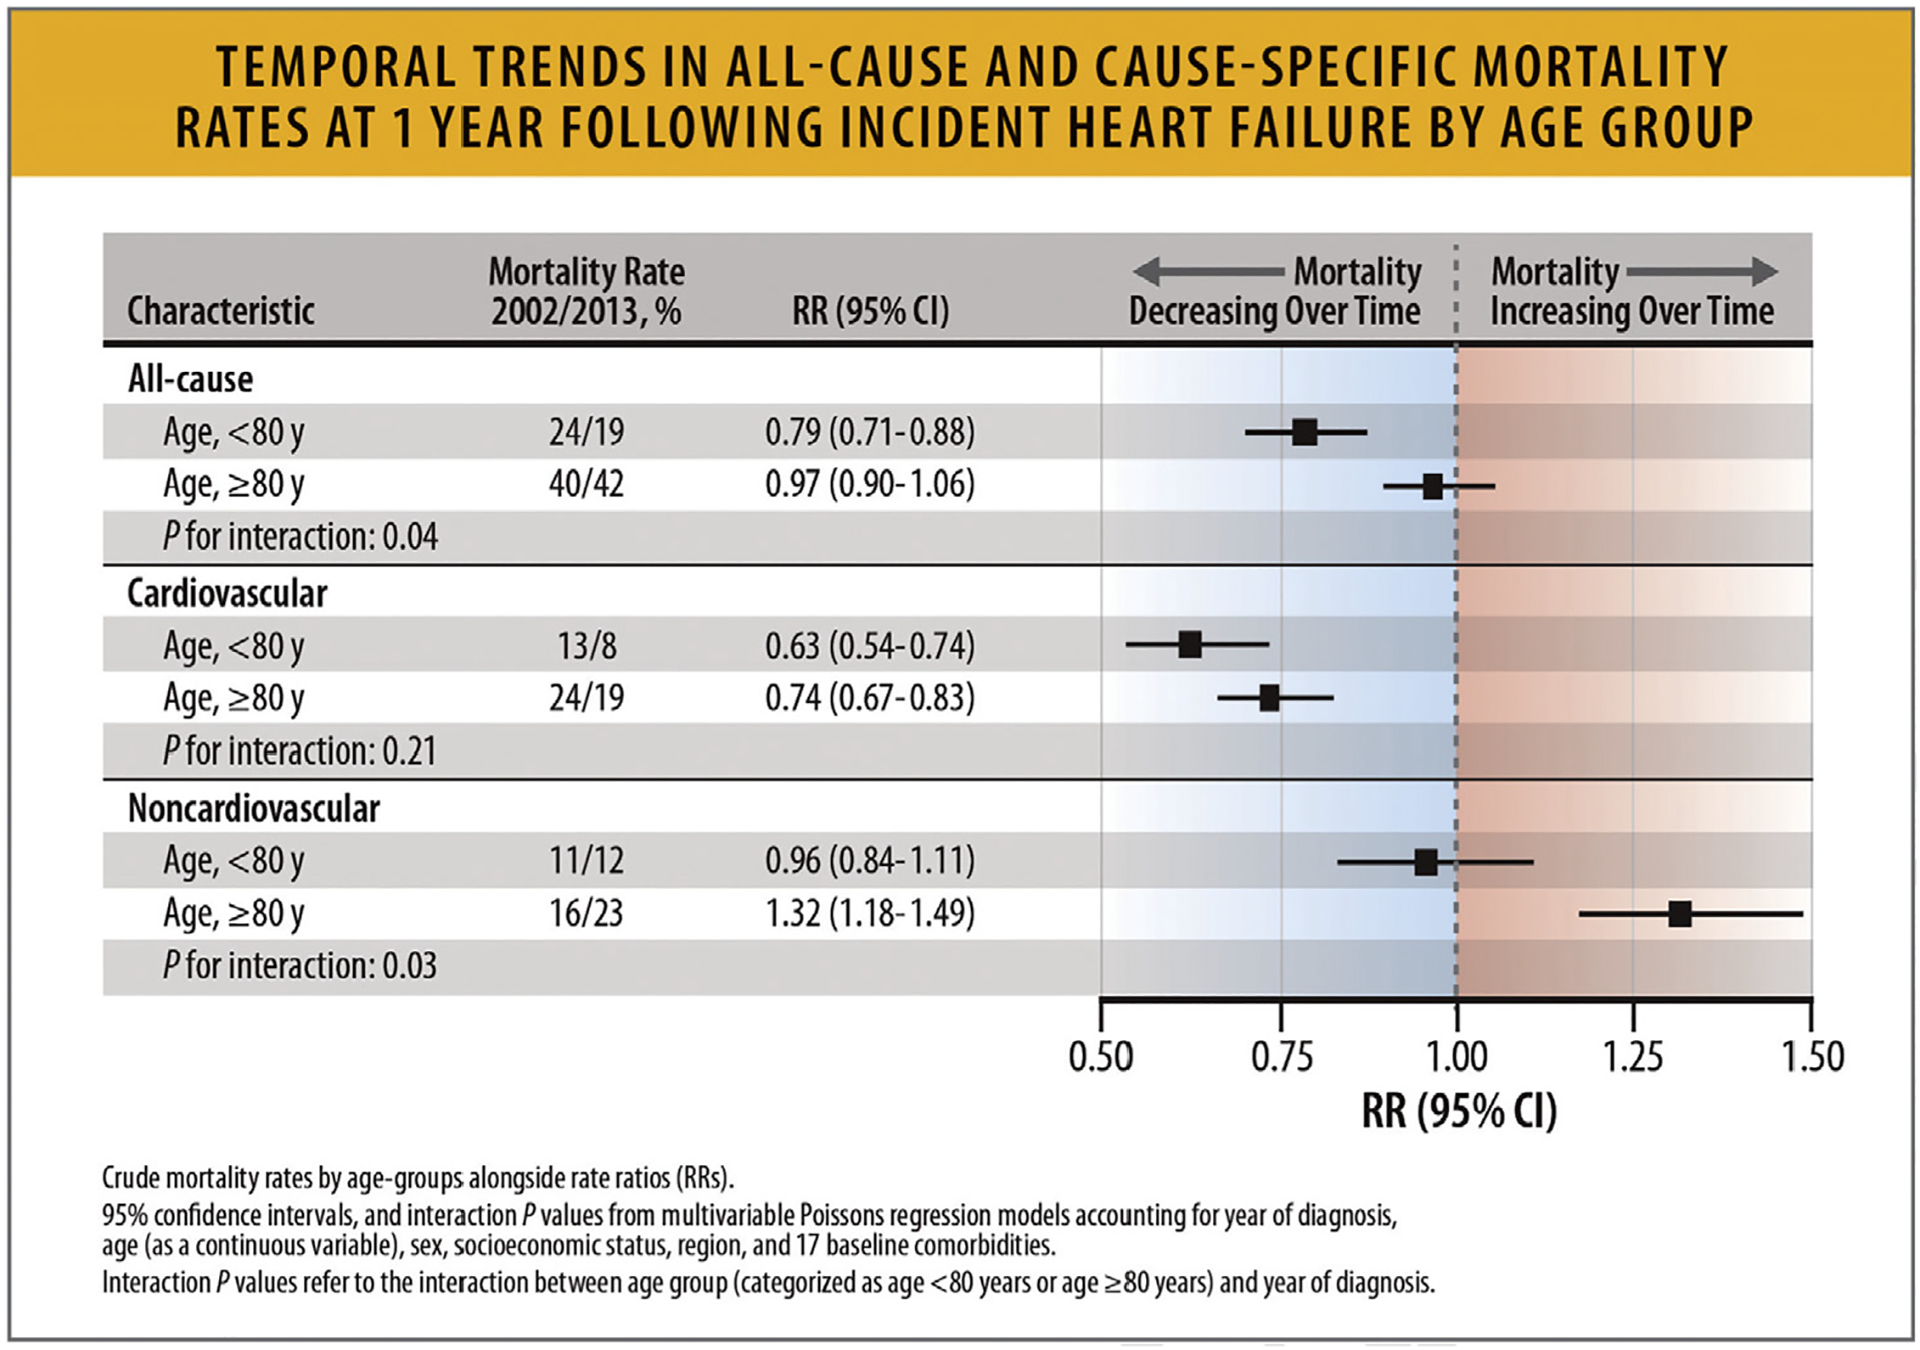
Temporal trends in all-cause and cause-specific mortality rates at 1 year following incident heart failure by age group. CI = confidence interval; HF = heart failure; RR = rate ratio./ Modified from Conrad N, Judge A, Tran J, Mohseni H, Hedgecott D, Crespillo AP, et al. Temporal trends and patterns in heart failure incidence: a population-based study of 4 million individuals. Lancet 2018;391(10120):572–80.
5.11. HF Mortality Rates According to EF Phenotypes
Mortality trends between HFrEF and HFpEF vary based on study design and selection criteria. In a meta-analysis of 31 studies that included 41,972 patients with HFrEF and HFpEF, patients with HFpEF had a lower risk of death: 121 (95% CI 117–126) deaths/1000 PY in those with HFpEF and 141 (95% CI 138–144) deaths/1000 PY in those with HFrEF.87
A study of HF hospitalization trends from the National Inpatient Sample (NIS) demonstrated inpatient mortality decreased from 2008 to 2018 for overall HF (3.3%–2.6%) and HFpEF (2.4%–2.1%), but was stable for HFrEF (2.8% for both years).88
In a study from the GWTG registry of 39,982 patients hospitalized with HF with linked Medicare data and follow-up through 2014 in risk-adjusted survival analysis, patients with HFrEF, HF with mildly reduced EF (HFmrEF, left ventricular EF 41%–49%) and HFpEF had similar 5-year mortality: 75.3%,75.7%, and 75.7%, respectively (hazard ratio 0.99, 95% CI 0.947–1.046) (Figs. 24, and 25).89,90
Fig. 24.
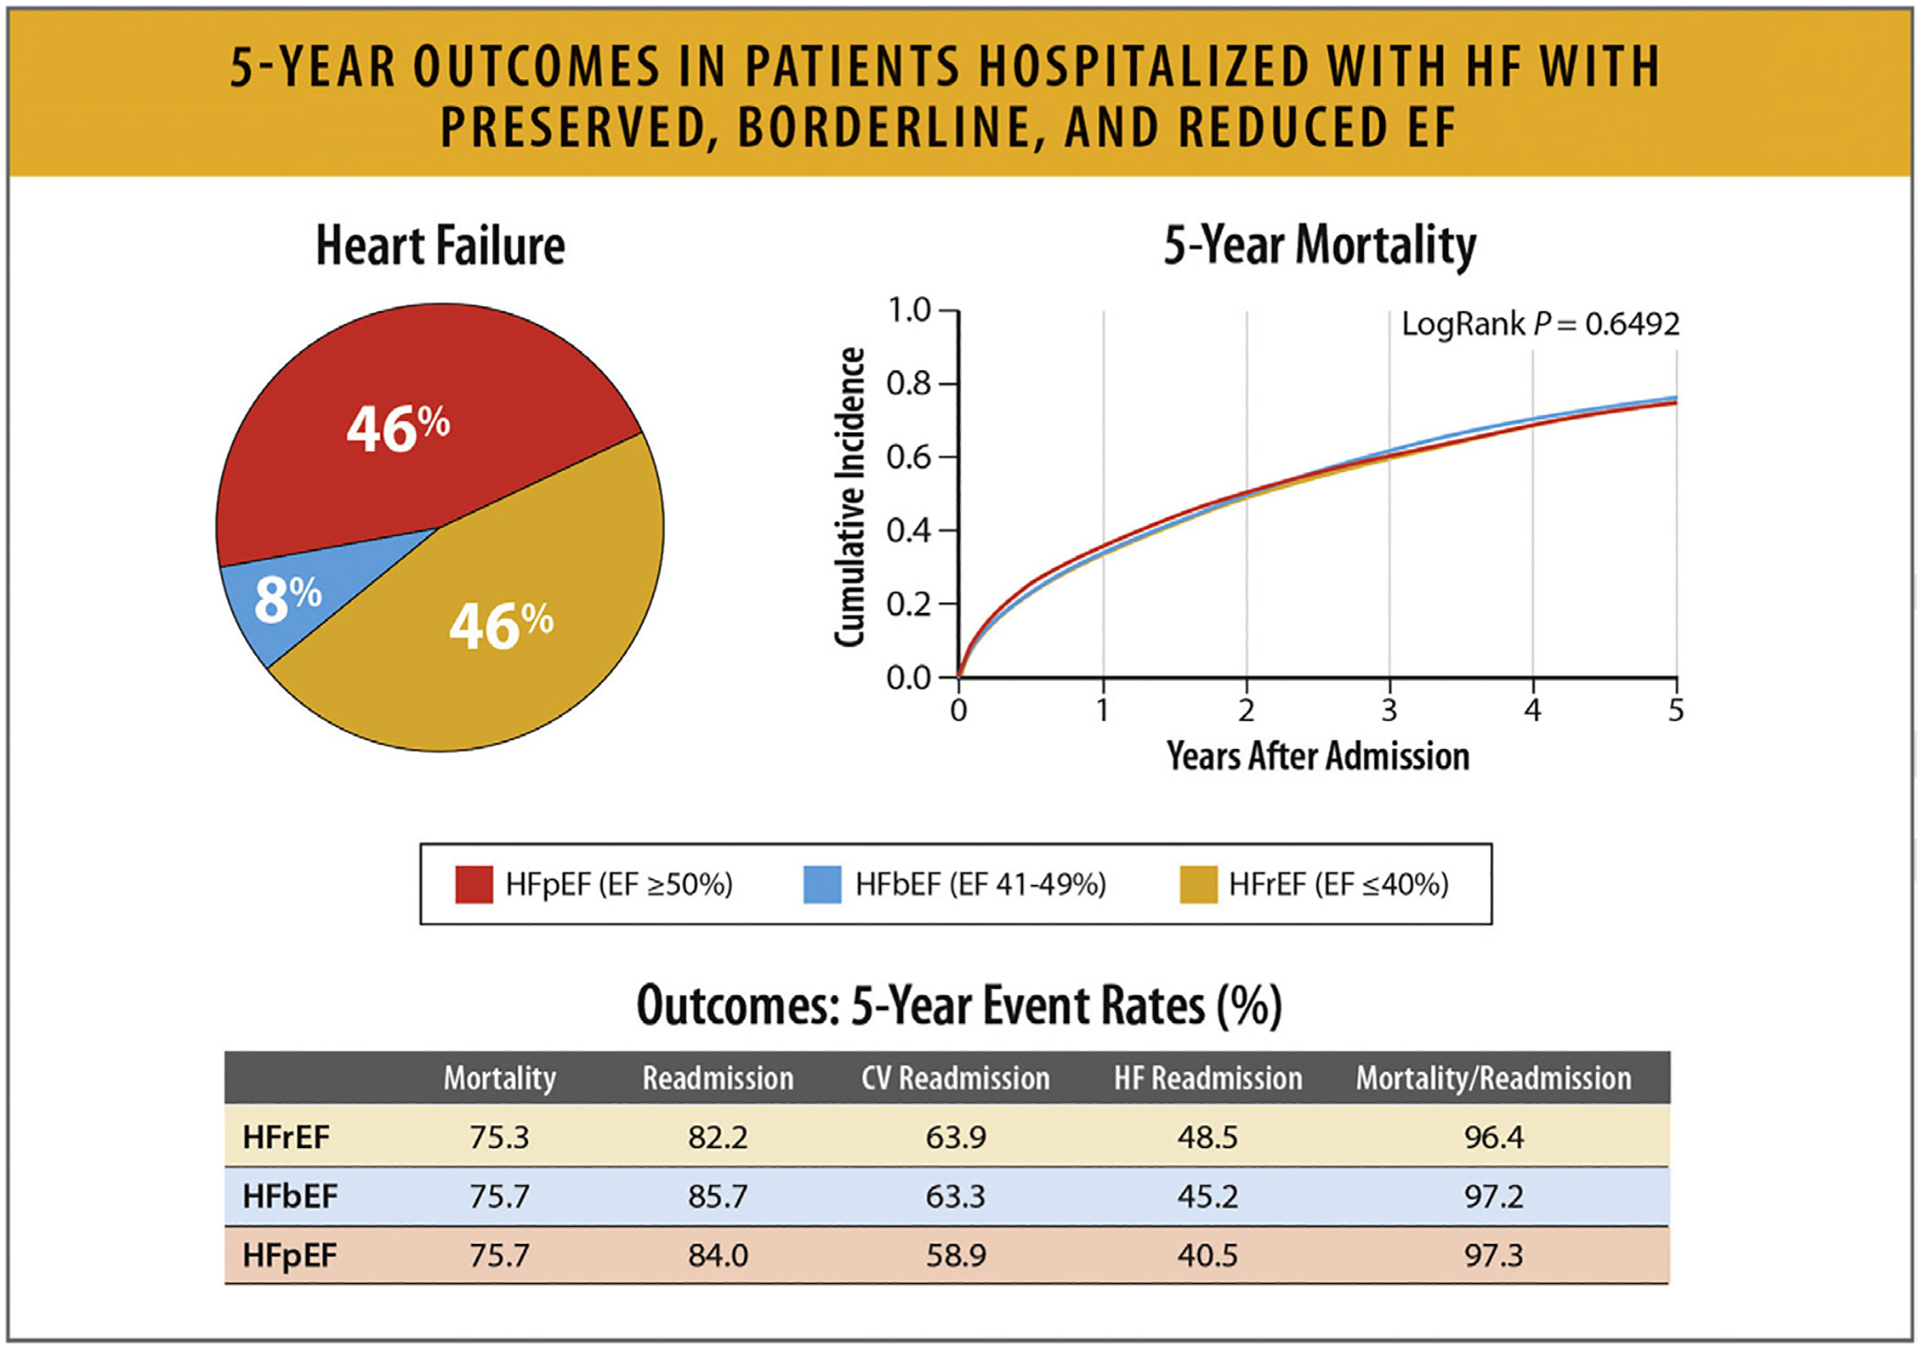
Five-year outcomes in patients hospitalized with HFpEF, HFbEF, and HFrEF. CV = cardiovascular; HfbEF = heart failure with borderline ejection fraction; HFpEF = heart failure with preserved ejection fraction; HFrEF = heart failure with reduced ejection fraction Modified from Shah KS, Xu H, Matsouaka RA, Bhatt DL, Heidenreich PA, Hernandez AF, et al. Heart failure with preserved, borderline, and reduced ejection fraction: 5-year outcomes. J Am Coll Cardiol 2017;70:2476–86.
Fig. 25.
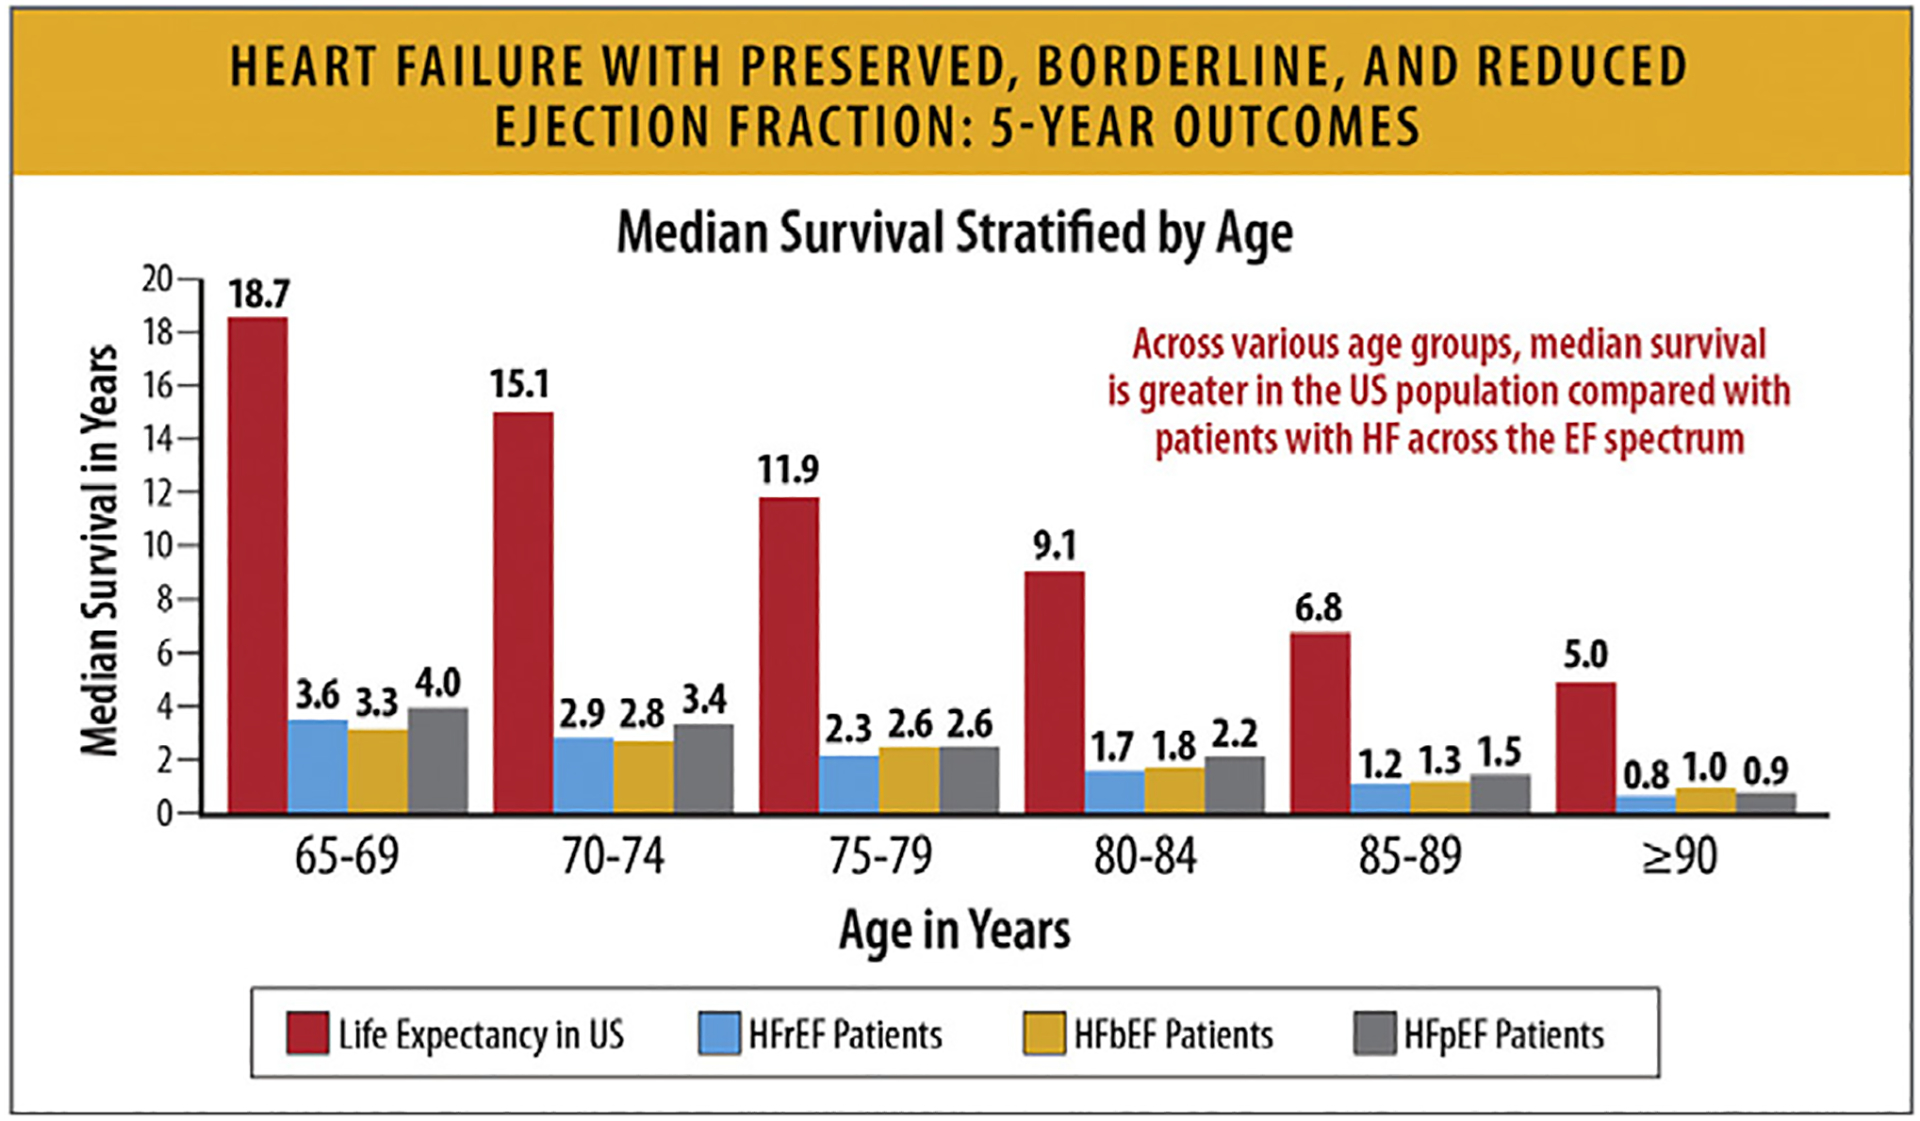
HFpEF, HFbEF, and HFrEF: 5-year outcomes. EF = ejection fraction; HF = heart failure; HfbEF = heart failure with borderline ejection fraction; HFpEF = heart failure with preserved ejection fraction; HFrEF = heart failure with reduced ejection fraction; US = United States. Modified from Shah KS, Xu H, Matsouaka RA, Bhatt DL, Heidenreich PA, Hernandez AF, et al. Heart failure with preserved, borderline, and reduced ejection fraction: 5-year outcomes. J Am Coll Cardiol 2017;70:2476–86.
On the contrary, data from ESC Heart Failure Long-Term Registry suggest higher mortality rates for patients with HFrEF compared to HFpEF. (Figure 23) But overall, data from FHS and CHS of 2524 patients who developed HF show similar mortality rates between those with HFrEF and those with HfpEF.90 Although the overall mortality is similar between HFpEF and HFrEF, a larger proportion of the deaths in patients with HFrEF are cardiovascular.90
Fig. 23.

Kaplan–Meier curves for hospitalization for heart failure in 9134 heart failure patients.37 EF = ejection fraction; GWTG = Get With the Guidelines Registry; HF = heart failure. Modified from Chioncel O, Lainscak M, Seferovic PM, et al. Epidemiology and one-year outcomes in patients with chronic heart failure and preserved, mid-range and reduced ejection fraction: an analysis of the ESC Heart Failure Long-Term Registry. Eur J Heart Fail. 2017 Dec;19(12):1574–1585.
6. Hospitalization Rates
6.1. Summary
Rates of HF hospitalizations declined from 2010 to 2014, followed by an increase from 2014 to 2017.
This increase was consistent across age groups and sexes, with the highest rates being among Black patients.
HF hospitalizations among young adults between the ages of 18–45 years also increased since 2013, and Black patients accounted for 50% of these hospitalizations.
HF hospitalizations among the elderly (age >80 years) have increased since 2014 with high burdens of hospitalizations among patients with comorbid conditions.
6.2. Trends in HF Hospitalization Rates
National data on HF admissions show that whereas the rates of HF hospitalizations declined until 2014, they subsequently increased in all groups. The rates were highest among Black patients, who also accounted for half the hospitalizations in young patients. Hospitalizations for HF patients with comorbid conditions increased steadily with associated higher costs.
According to the Nationwide Readmission Database (NRD), which used data from all adult hospitalizations with a primary diagnosis of HF from January 1, 2010, to December 31, 2017, rates of overall and unique patient hospitalizations declined from 2010 to 2014, followed by an increase from 2014 to 2017. Readmission visits after index HF hospitalizations followed a similar trend (Fig. 26).90
Fig. 26.
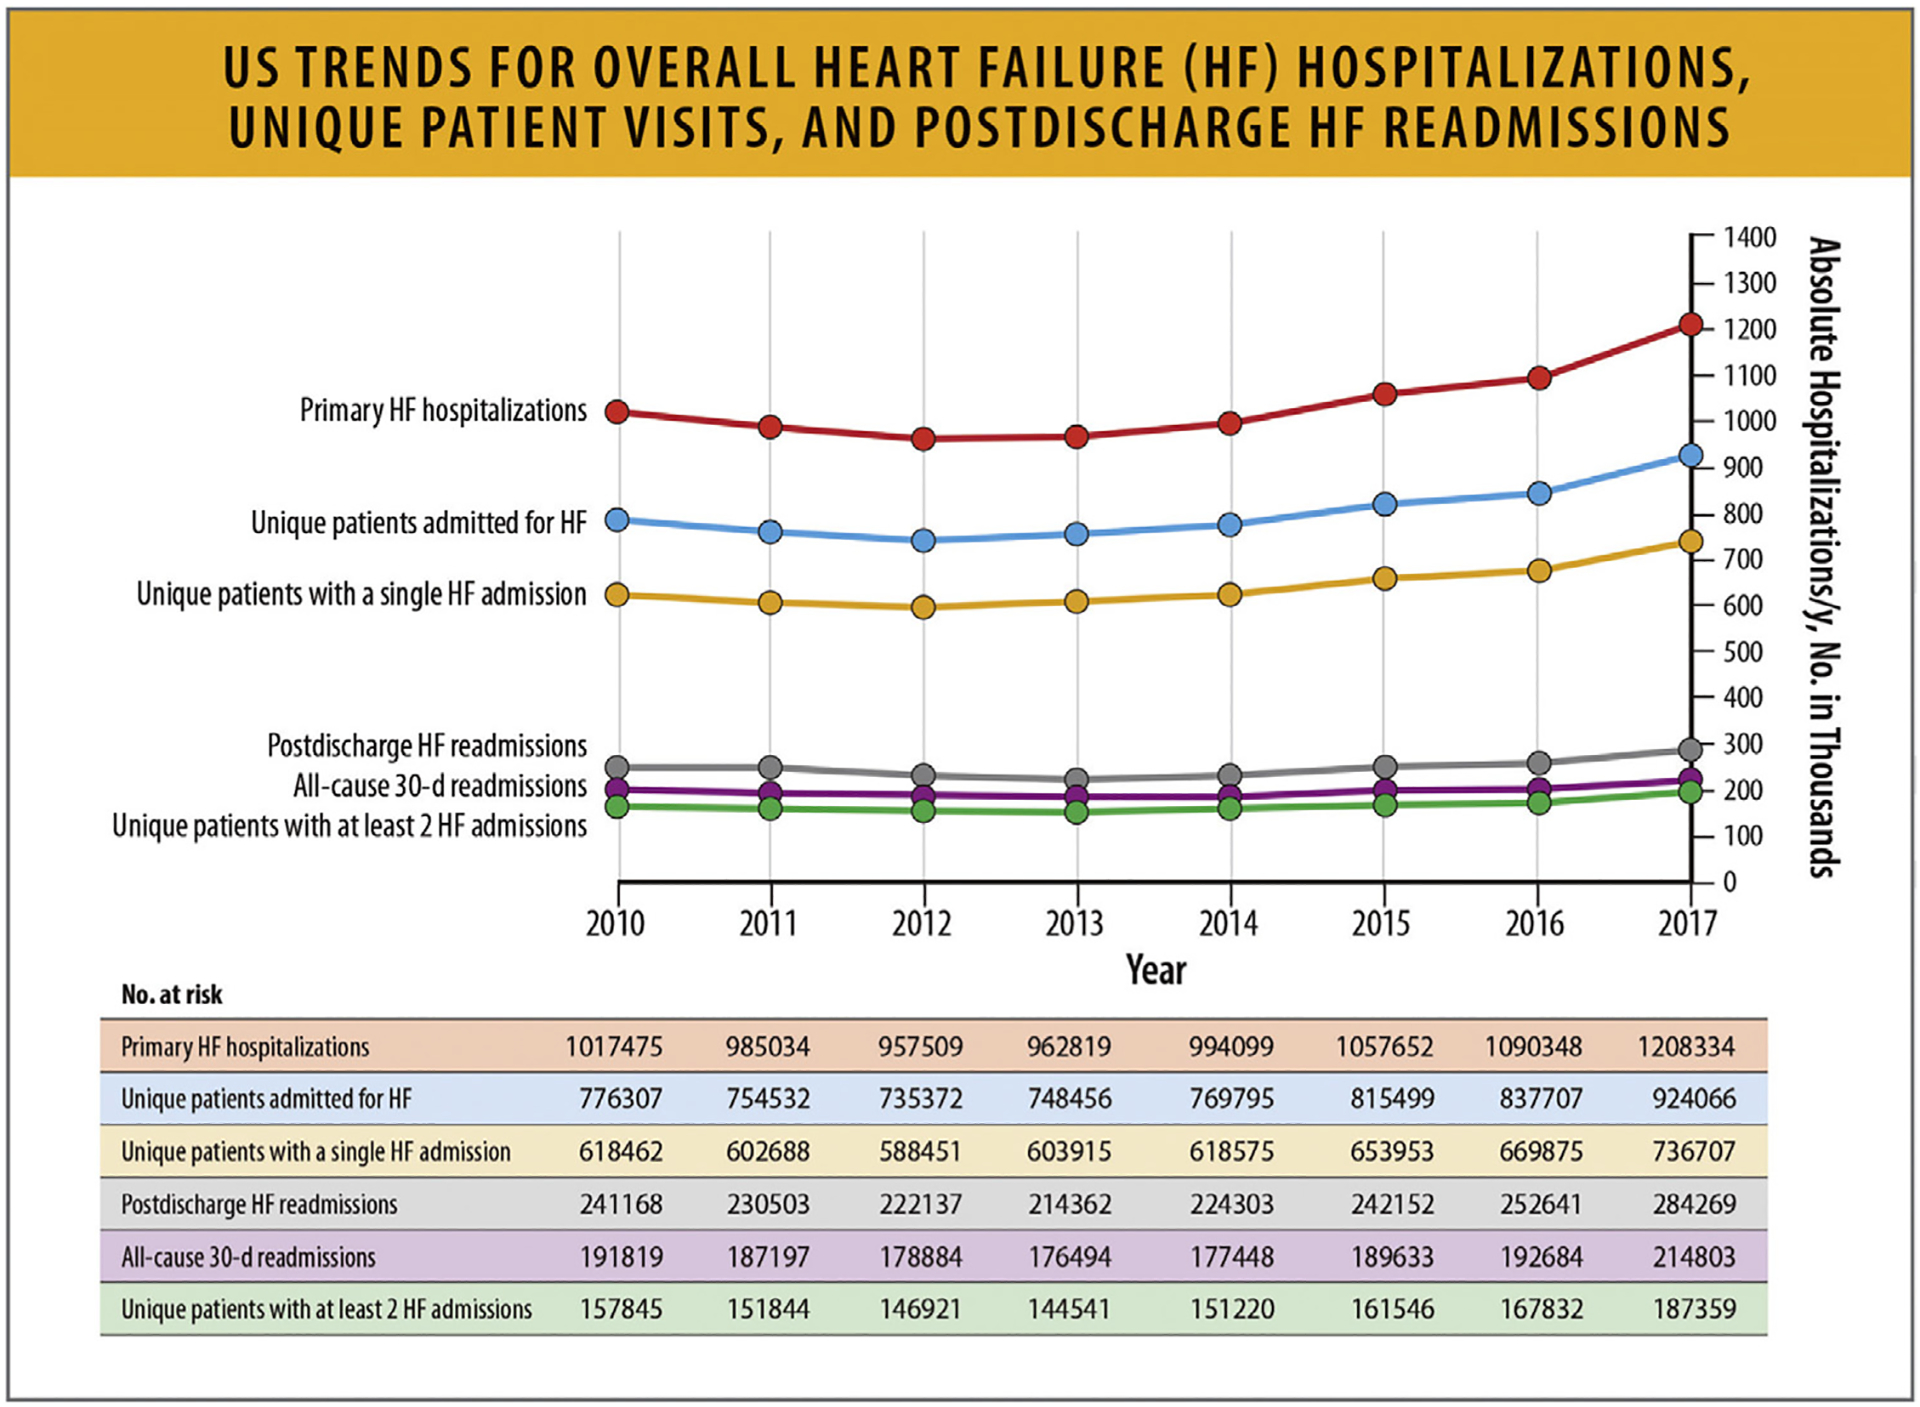
US trends for overall HF hospitalizations, unique patient visits, and postdischarge HF readmissions. HF = heart failure, US = United States. Modified from Agarwal MA, Fonarow GC, Ziaeian B. National trends in heart failure hospitalizations and readmissions from 2010 to 2017. JAMA Cardiol 2021;6:952–6.
Similarly, according to a retrospective analysis of the NIS with weighted data between 2004 and 2018, after an initial decline between 2004 and 2013, there was an increase in HF hospitalizations after 2013 (Fig. 27).91
Fig. 27.
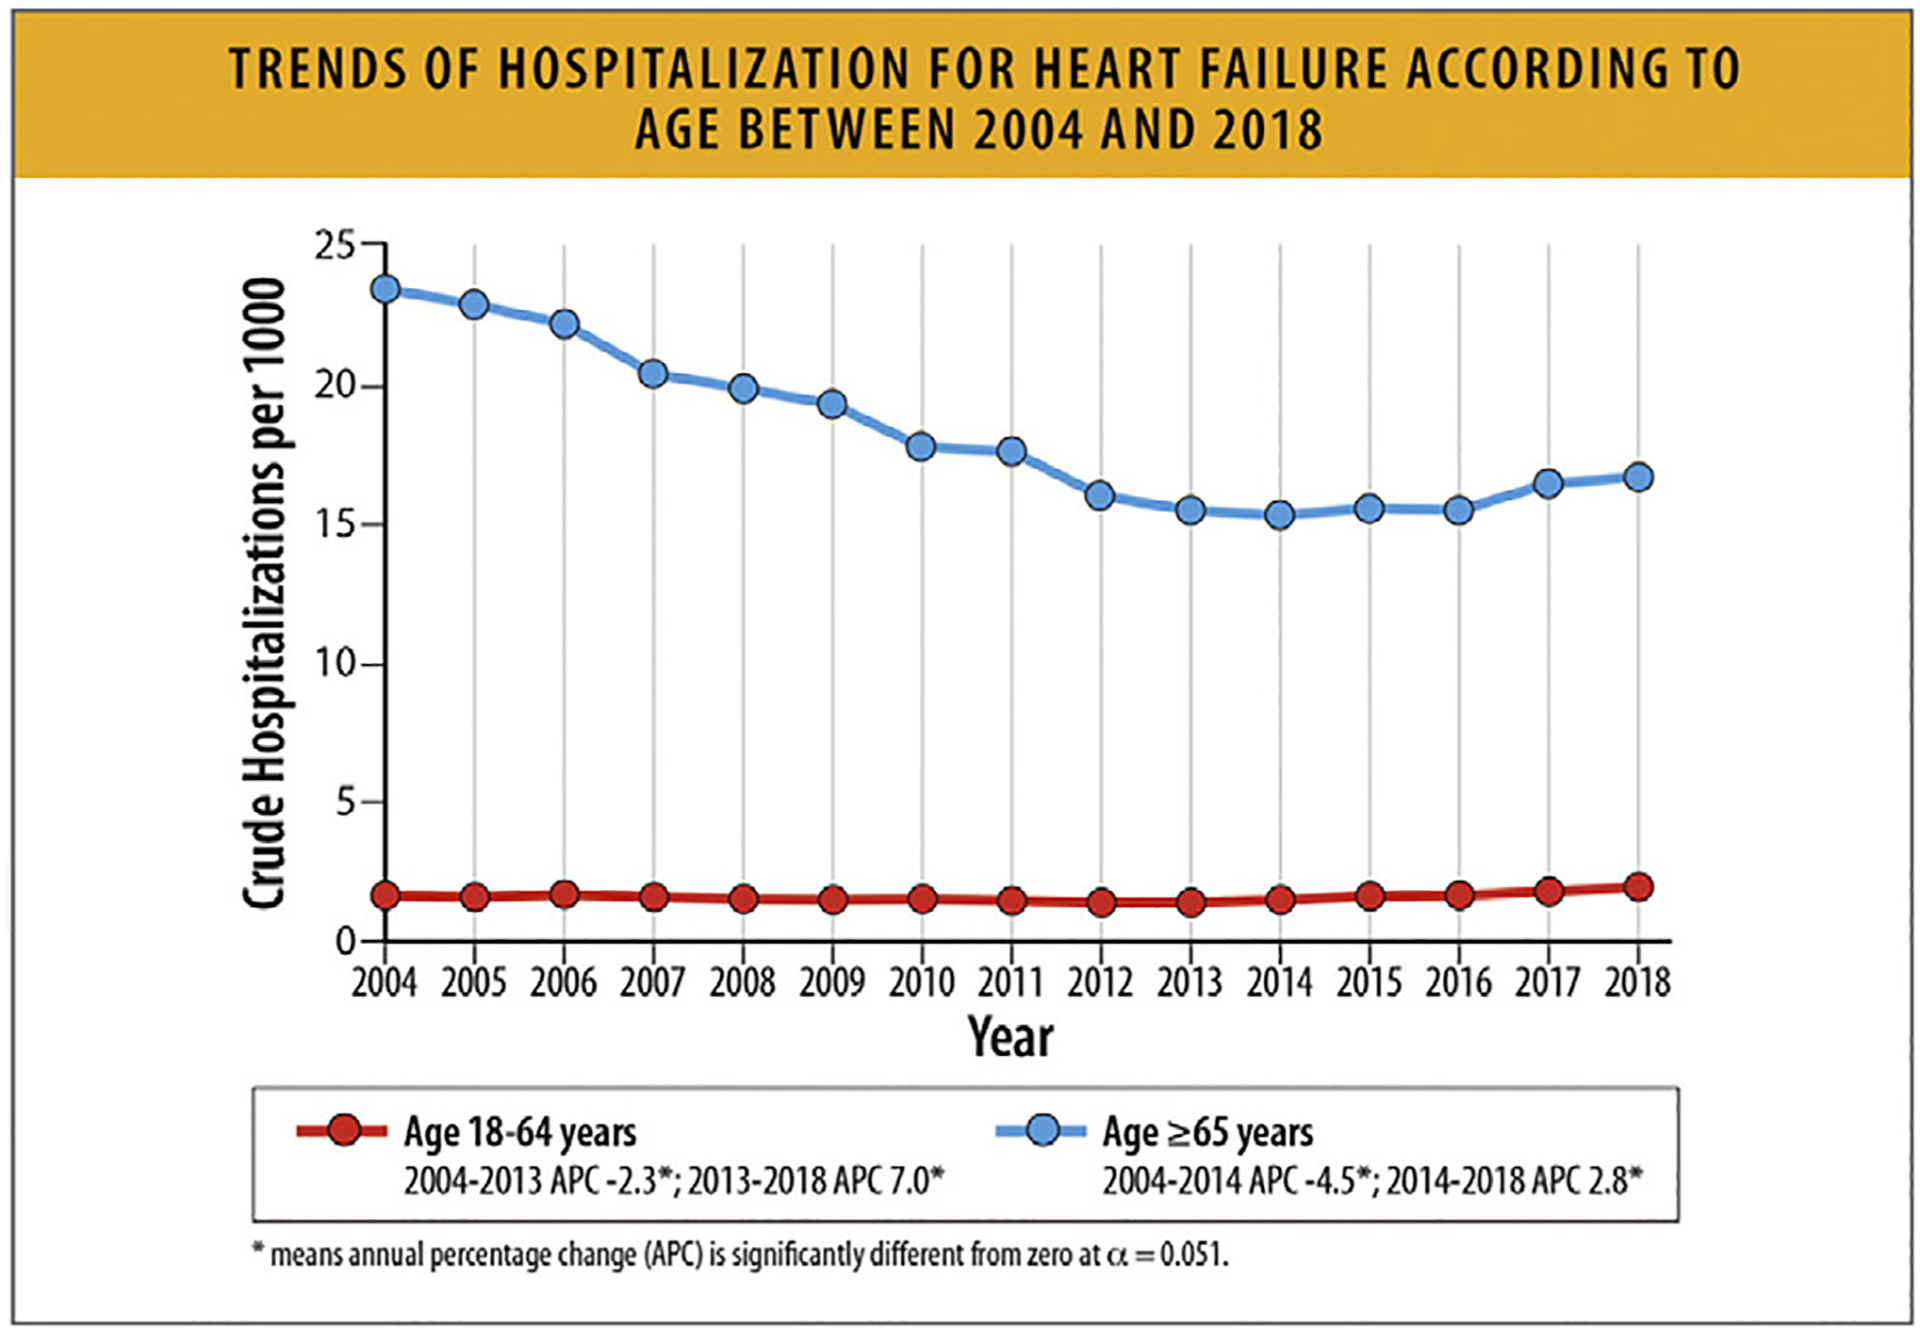
Trends of hospitalization for HF according to age between 2004 and 2018. APC = annual percentage change; HF = heart failure. Modified from Salah HM, Minhas AMK, Khan MS, Khan SU, Ambrosy AP, Blumer V, et al. Trends and Characteristics of Hospitalizations for Heart Failure in the United States from 2004 to 2018. ESC Heart Fail 2022;9:947–52.
According to another analysis of the NIS with a focus on adults aged 18–45 years hospitalized for HF between 2004 and 2018, HF hospitalizations among young adults have increased since 2013 (Fig. 28).92
Fig. 28.
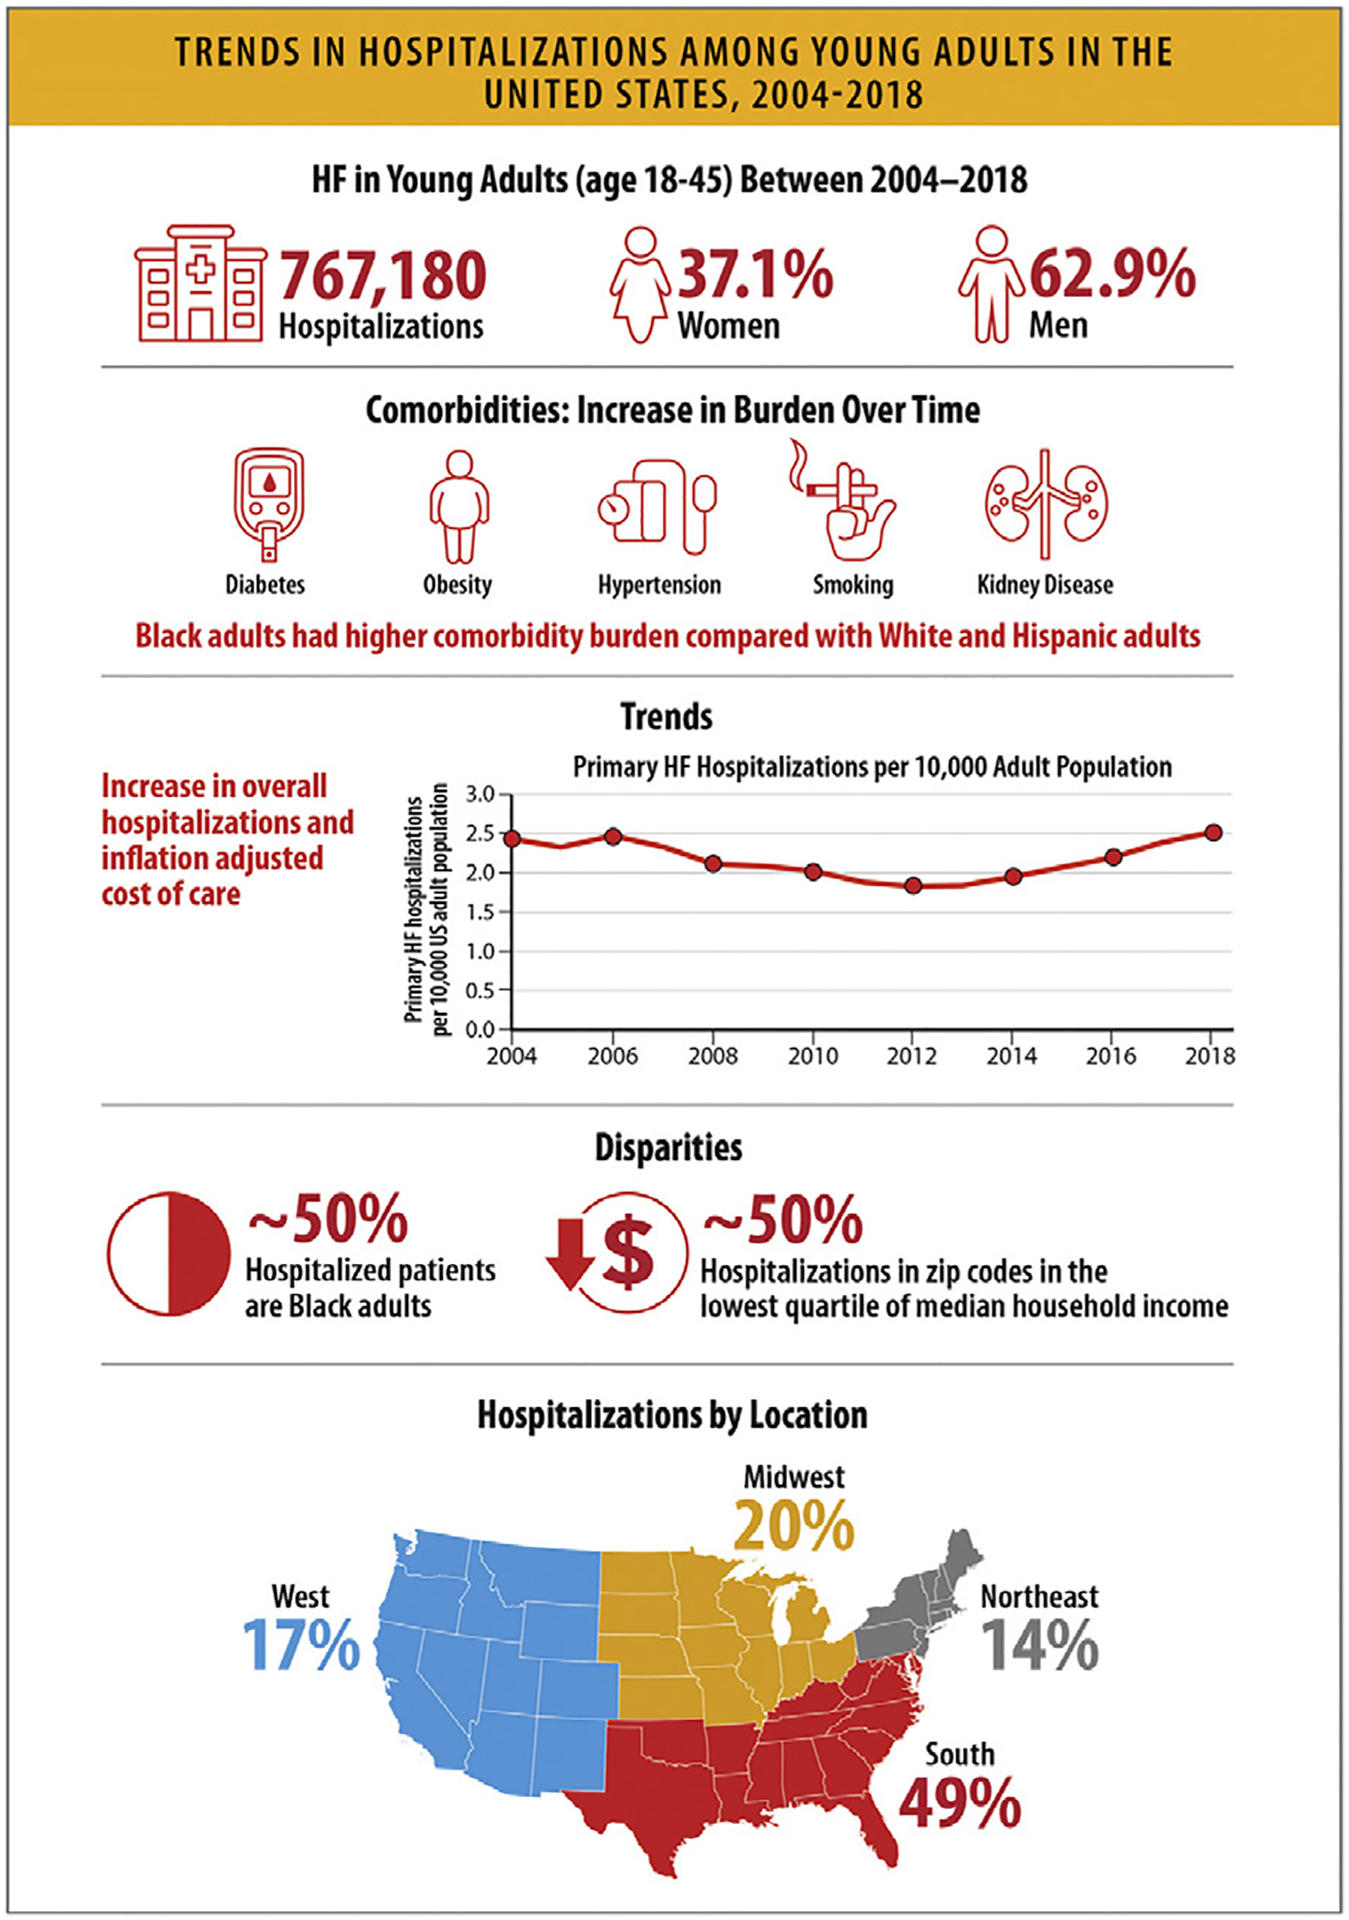
Trends in hospitalizations among young adults in the United States, 2004–2018. APC = annual percentage change; HF = heart failure; US = United States. Modified from Jain V, Minhas AMK, Khan SU, Greene SJ, Pandey A, Van Spall HGC, et al. Trends in HF hospitalizations among young adults in the United States From 2004 to 2018. JACC Heart Fail 2022;10:350–62.
6.3. Trends in National Burden of HF Hospitalizations with HF as a Primary or a Secondary Diagnosis
According to the data from the Healthcare Cost and Utilization Project Nationwide Emergency Department Sample, the Healthcare Cost and Utilization Project NIS, and the NVSS, the estimated mean cost of hospitalizations with a primary diagnosis of HF was $11,552 in 2014, with a total estimated cost of more than $11 billion. Medicare incurred much of this burden.93
Between 2006 and 2014, the age-standardized total unique acute event rate for primary HF decreased, whereas the event rate for comorbid HF, where HF is a secondary cause for hospitalization, increased (Figs. 29a and 29b). Compared with patients without HF, patients who were hospitalized with comorbid HF had significantly higher costs for primary diagnoses of asthma, chronic obstructive pulmonary disease, pneumonia, atrial fibrillation, diabetes mellitus, ischemic heart disease, stroke, or depression.93
Fig. 29.
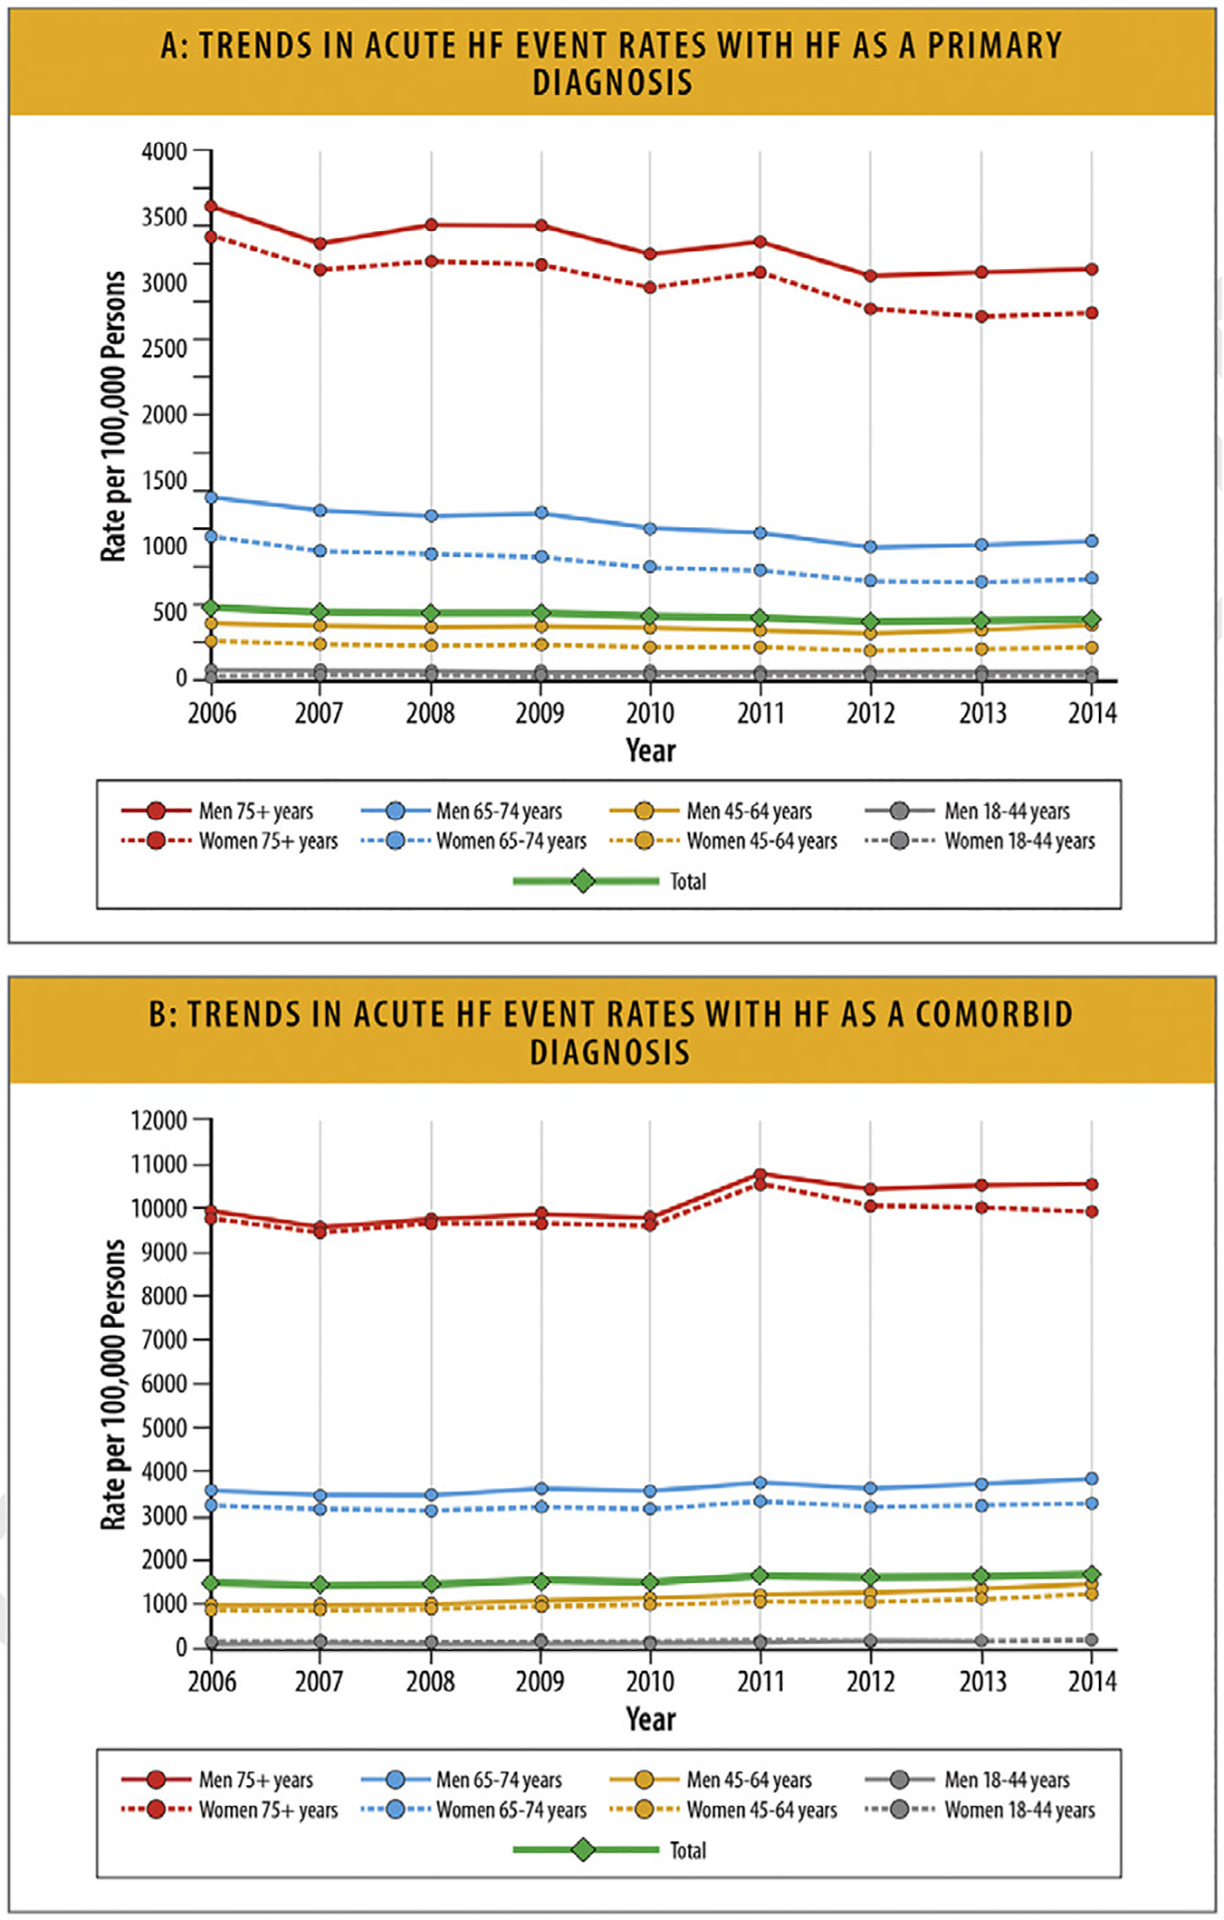
(A) Trends in acute HF event rates with HF as a primary diagnosis. (B) Trends in acute HF event rates with HF as a comorbid diagnosis. HF = heart failure. Modified from Jackson SL, Tong X, King RJ, Loustalot F, Hong Y, Ritchey MD. National burden of heart failure events in the United States, 2006 to 2014. Circ Heart Fail 2018;11:e004873.
6.4. HF Hospitalization Rates According to Race and Ethnicity
HF hospitalization rates vary by race and ethnicity, with several studies demonstrating that Black patients with HF have higher hospitalization rates compared with other races and ethnicities. A study that examined 34,621 patients with HF in the Kaiser Permanente Northern California system from 2012 to 2016 reported that Black patients had the highest crude annual incidence of HF hospitalization compared with other racial and ethnic groups (17.8/100PY; 95% CI 17.0–18.6/100PY). Hispanic patients had a crude incidence of HF hospitalizations of 13.0/100PY (95% CI 12.4–13.6/100PY). In contrast, Asian/Pacific Islander patients and White patients had a similar crude incidence of HF hospitalizations, (10.4/100PY, 95% CI 9.8–11.0/100PY) and (10.9/100PY, 95% CI 10.6–11.1/100PY), respectively (Fig. 30).94
Fig. 30.
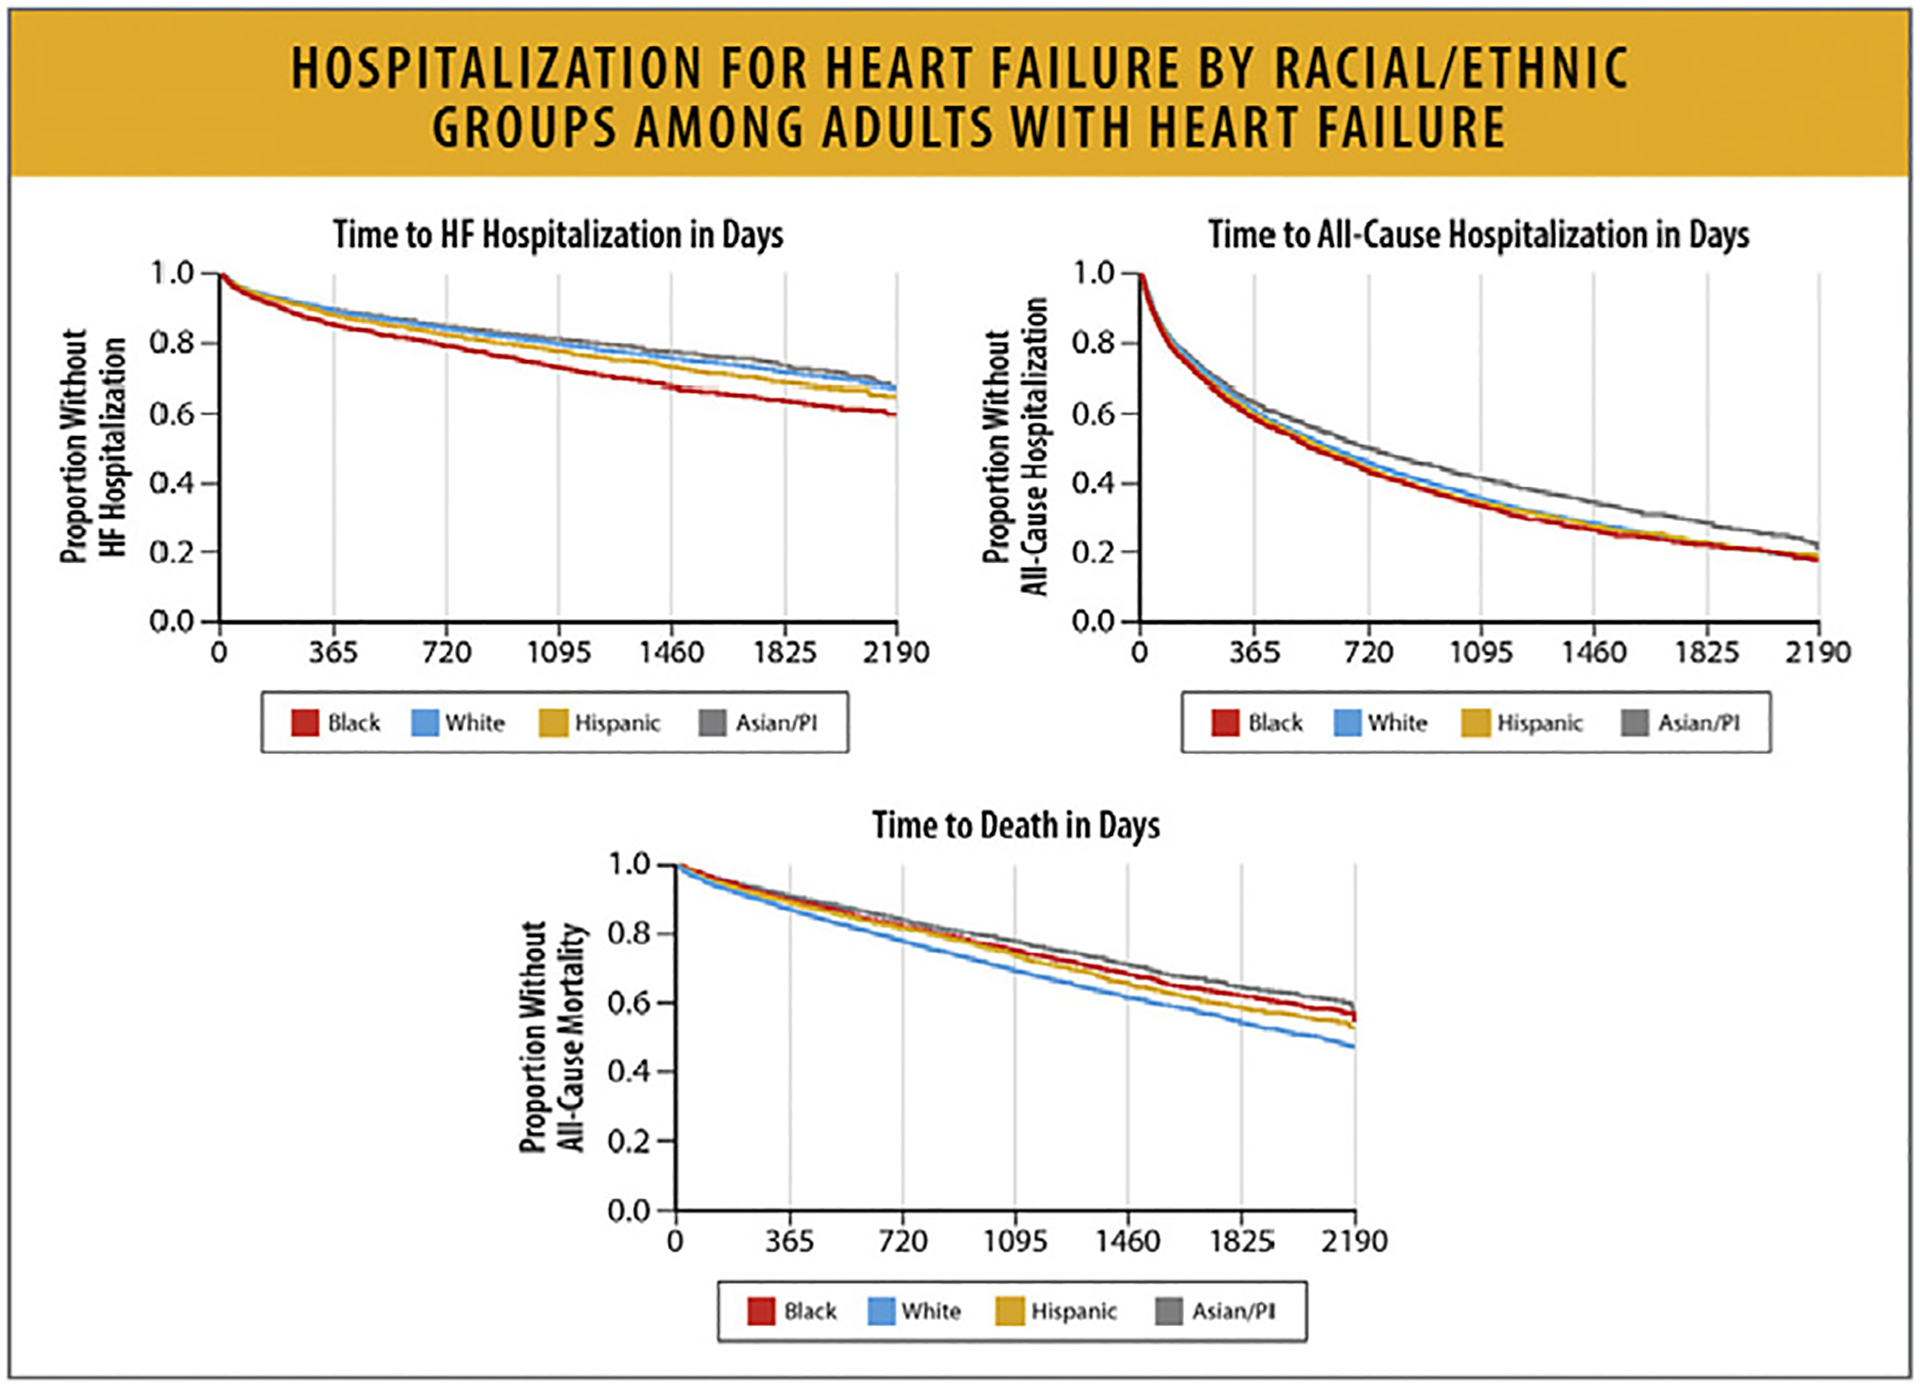
Hospitalization for HF by racial/ethnic groups among adults with HG. HF = heart failure; PI = Pacific Islander. Modified from Savitz ST, Leong T, Sung SH, Lee K, Rana JS, Tabada G, et al. Contemporary reevaluation of race and ethnicity with outcomes in heart failure. J Am Heart Assoc 2021;10:e016601.
Similarly, data from the NIS from 2002 to 2013 showed that Black women and men had the highest rates of hospitalizations for HF compared with other races, and the rate of HF hospitalizations for Black women and men was almost two-and-a-half times higher than for White patients with HF. Asian/Pacific Islanders had the lowest HF hospitalization rates (Figs. 31A and 31B).95,96 In a cohort study of 25,790 patients followed for a median of 10.1 years, Black patients had a higher risk of incident HF hospitalization (hazard ratio 1.23, 95% CI 1.09–1.40), even after adjusting for traditional cardiovascular risk factors.97
Fig. 31.
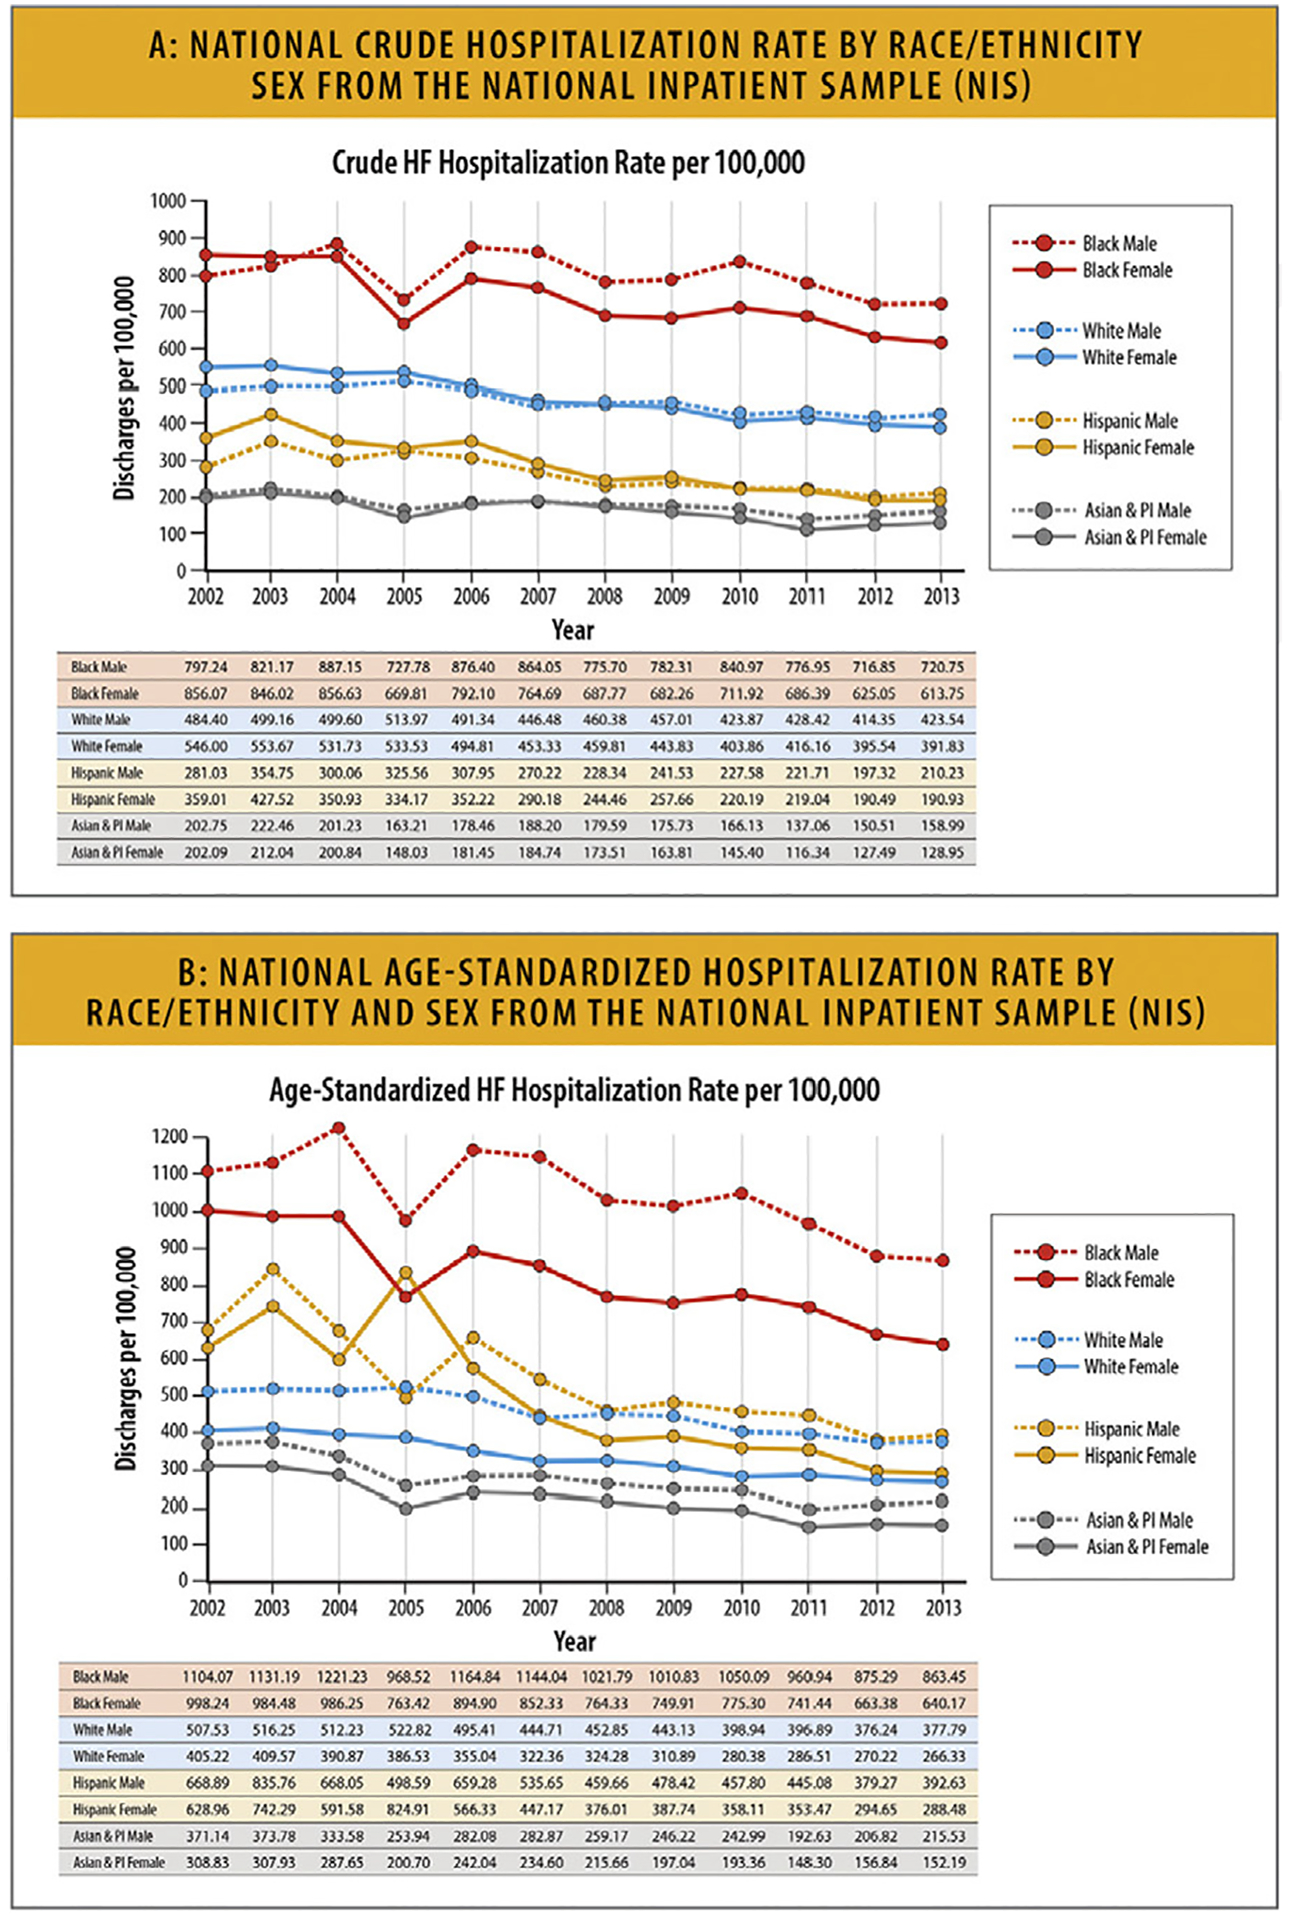
(A) National crude hospitalization rate by race/ethnicity and sex from the NIS.96 (B) National age-standardized hospitalization rate by race/ethnicity and sex from the NIS. HF = heart failure; NIS = National Inpatient Sample; PI = Pacific Islander. Modified from Ziaeian B, Kominski GF, Ong MK, Mays VM, Brook RH, Fonarow GC. National differences in trends for heart failure hospitalizations by sex and race/ethnicity. Circ Cardiovasc Qual Outcomes 2017;10:e003552.
According to a retrospective analysis of the NIS with weighted data between 2004 and 2018, after an initial decline between 2004 and 2013, there was an increase in HF hospitalizations after 2013 and HF hospitalization rates were highest for Black patients (Fig. 32).91
Fig. 32.
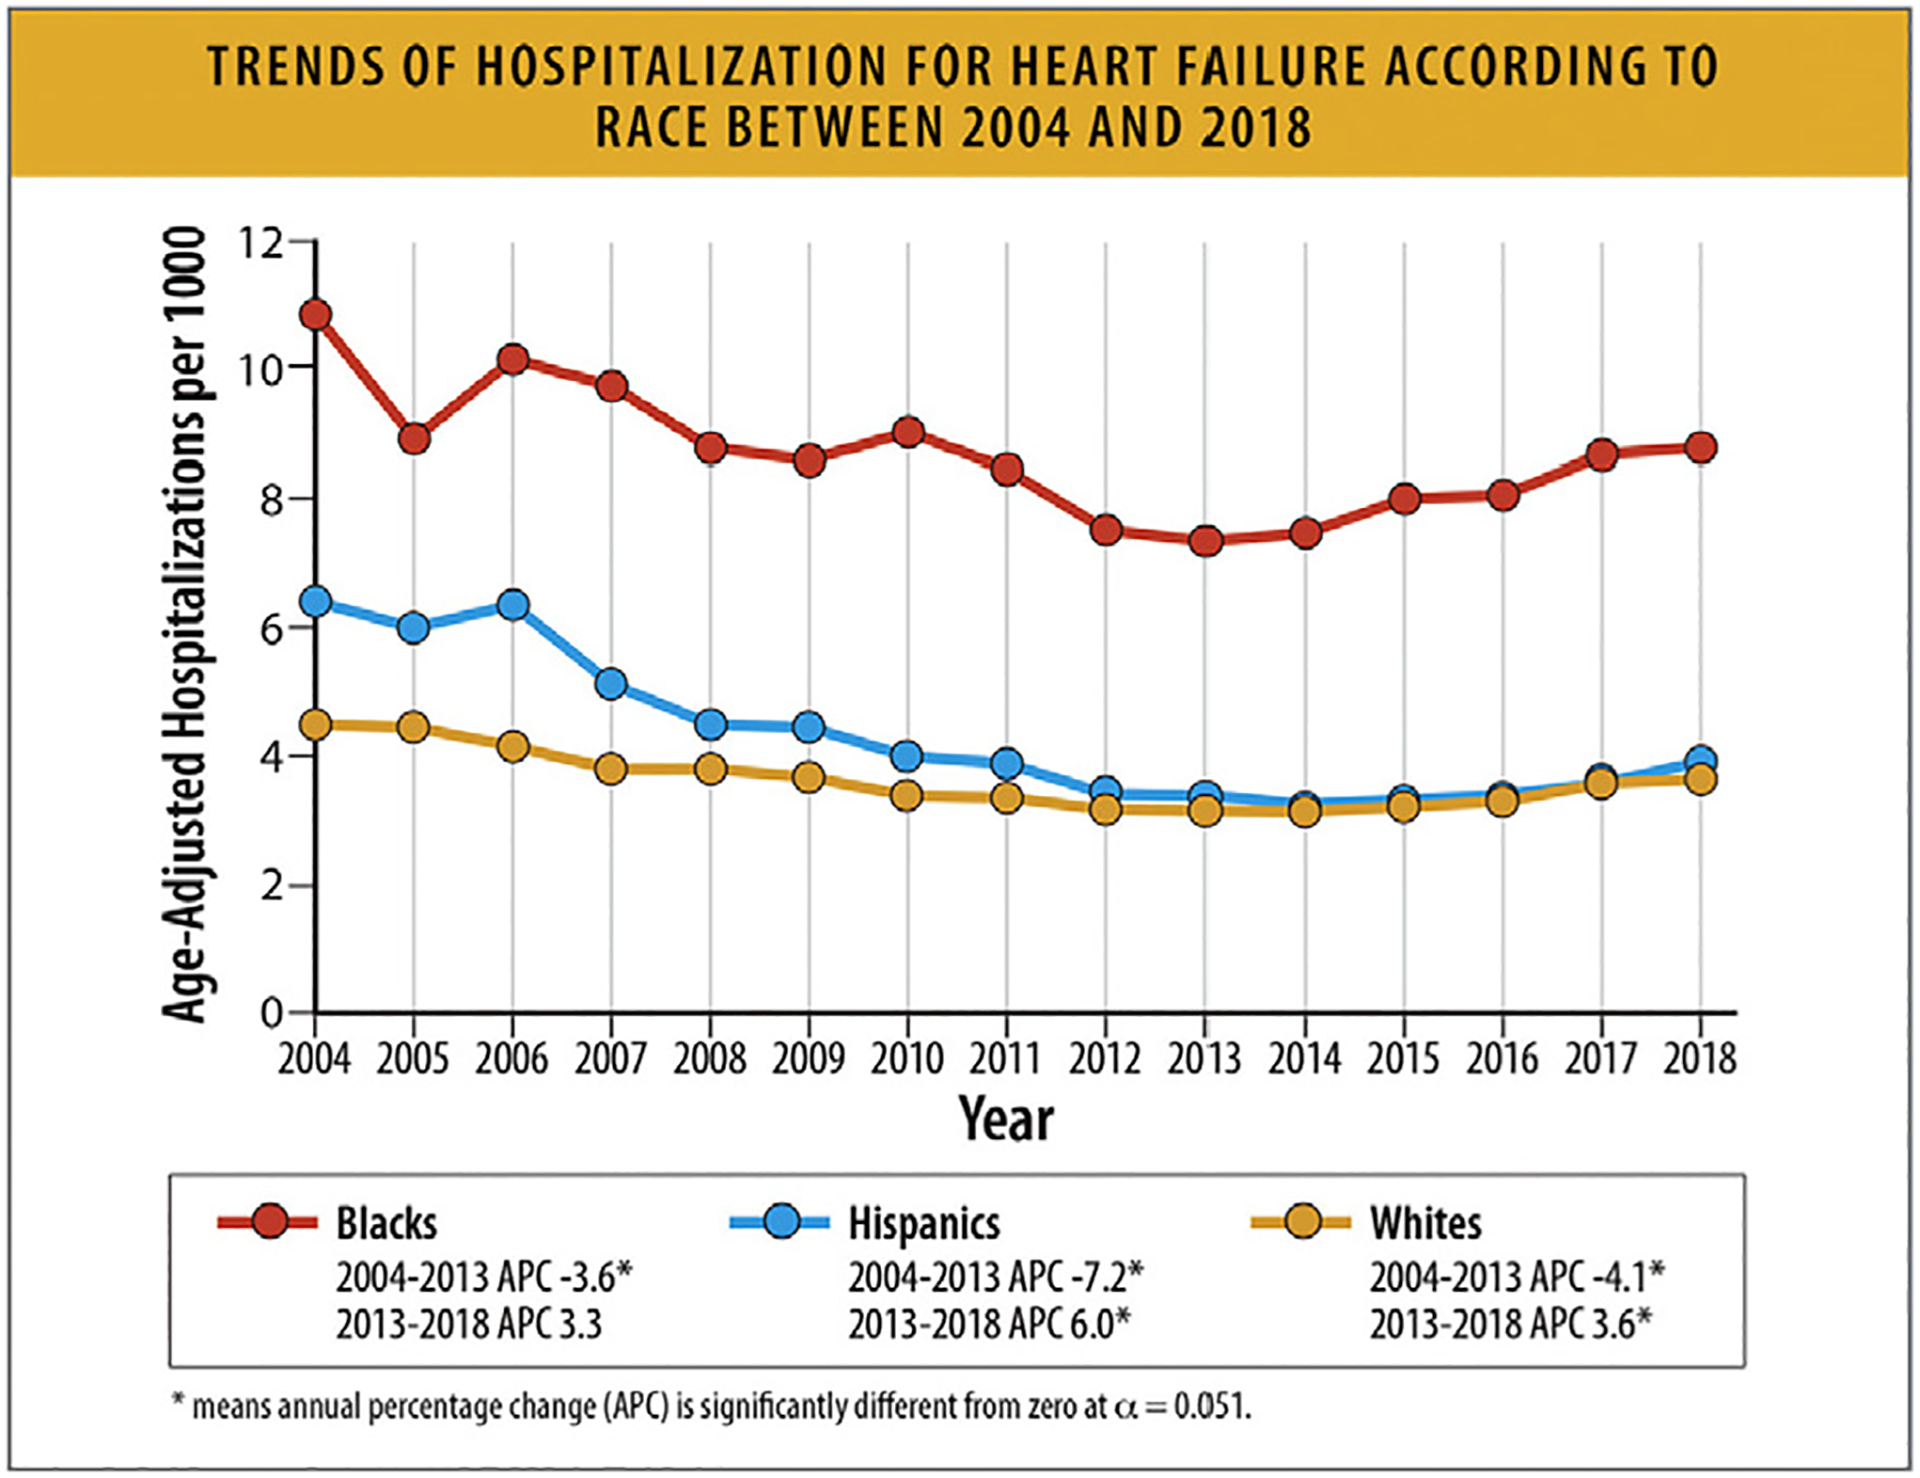
Trends of hospitalization for HF according to race between 2004 and 2018. APC = annual percentage change; HF = heart failure. Modified from Salah HM, Minhas AMK, Khan MS, Khan SU, Ambrosy AP, Blumer V, et al. Trends and characteristics of hospitalizations for heart failure in the United States from 2004 to 2018. ESC Heart Fail 2022;9:947–52.
According to another analysis of the NIS composed of adults aged 18–45 years hospitalized for HF between 2004 and 2018, HF hospitalizations were noted to increase since 2013 and approximately one-half of these patients were Black and resided in zip codes with the lowest quartile of national household income. Temporal trends showed stable adjusted lengths of stay and increased inflation-adjusted costs, with significant racial differences in hospitalization rates.92
Data from the 2005–2014 ARIC Community Surveillance study have also shown that HF hospitalization rates increased over time, with the average annual percentage change ranging from 1.9% (95% CI 0.7%–3.1%) in White women to 4.3% (95% CI 2.7%–5.9%) in Black women. The increase in HF hospitalizations is driven largely by HFpEF- the annual percentage change among Black women was 8.2% (95% CI 5.2%–11.3%) for HFpEF and 2.0% (95% CI −0.7% to 4.7%) for HFrEF. Age-adjusted 28-day and 1-year case fatality rates after first-time hospitalization for HF were higher among White individuals vs Black individuals.3,7
6.5. HF Hospitalization Rates According to Sex
In general, men have higher HF hospitalization rates than women (Fig. 33). Overall, there was a decline in HF hospitalization rates over time between 2000 and 2012 and data from the NCHS showed no difference in declining trends by sex during this time frame, whereas data from the NIS showed a larger decline in age-standardized HF hospitalization rates in men (25.8%) compared with women (36.0%).
Fig. 33.
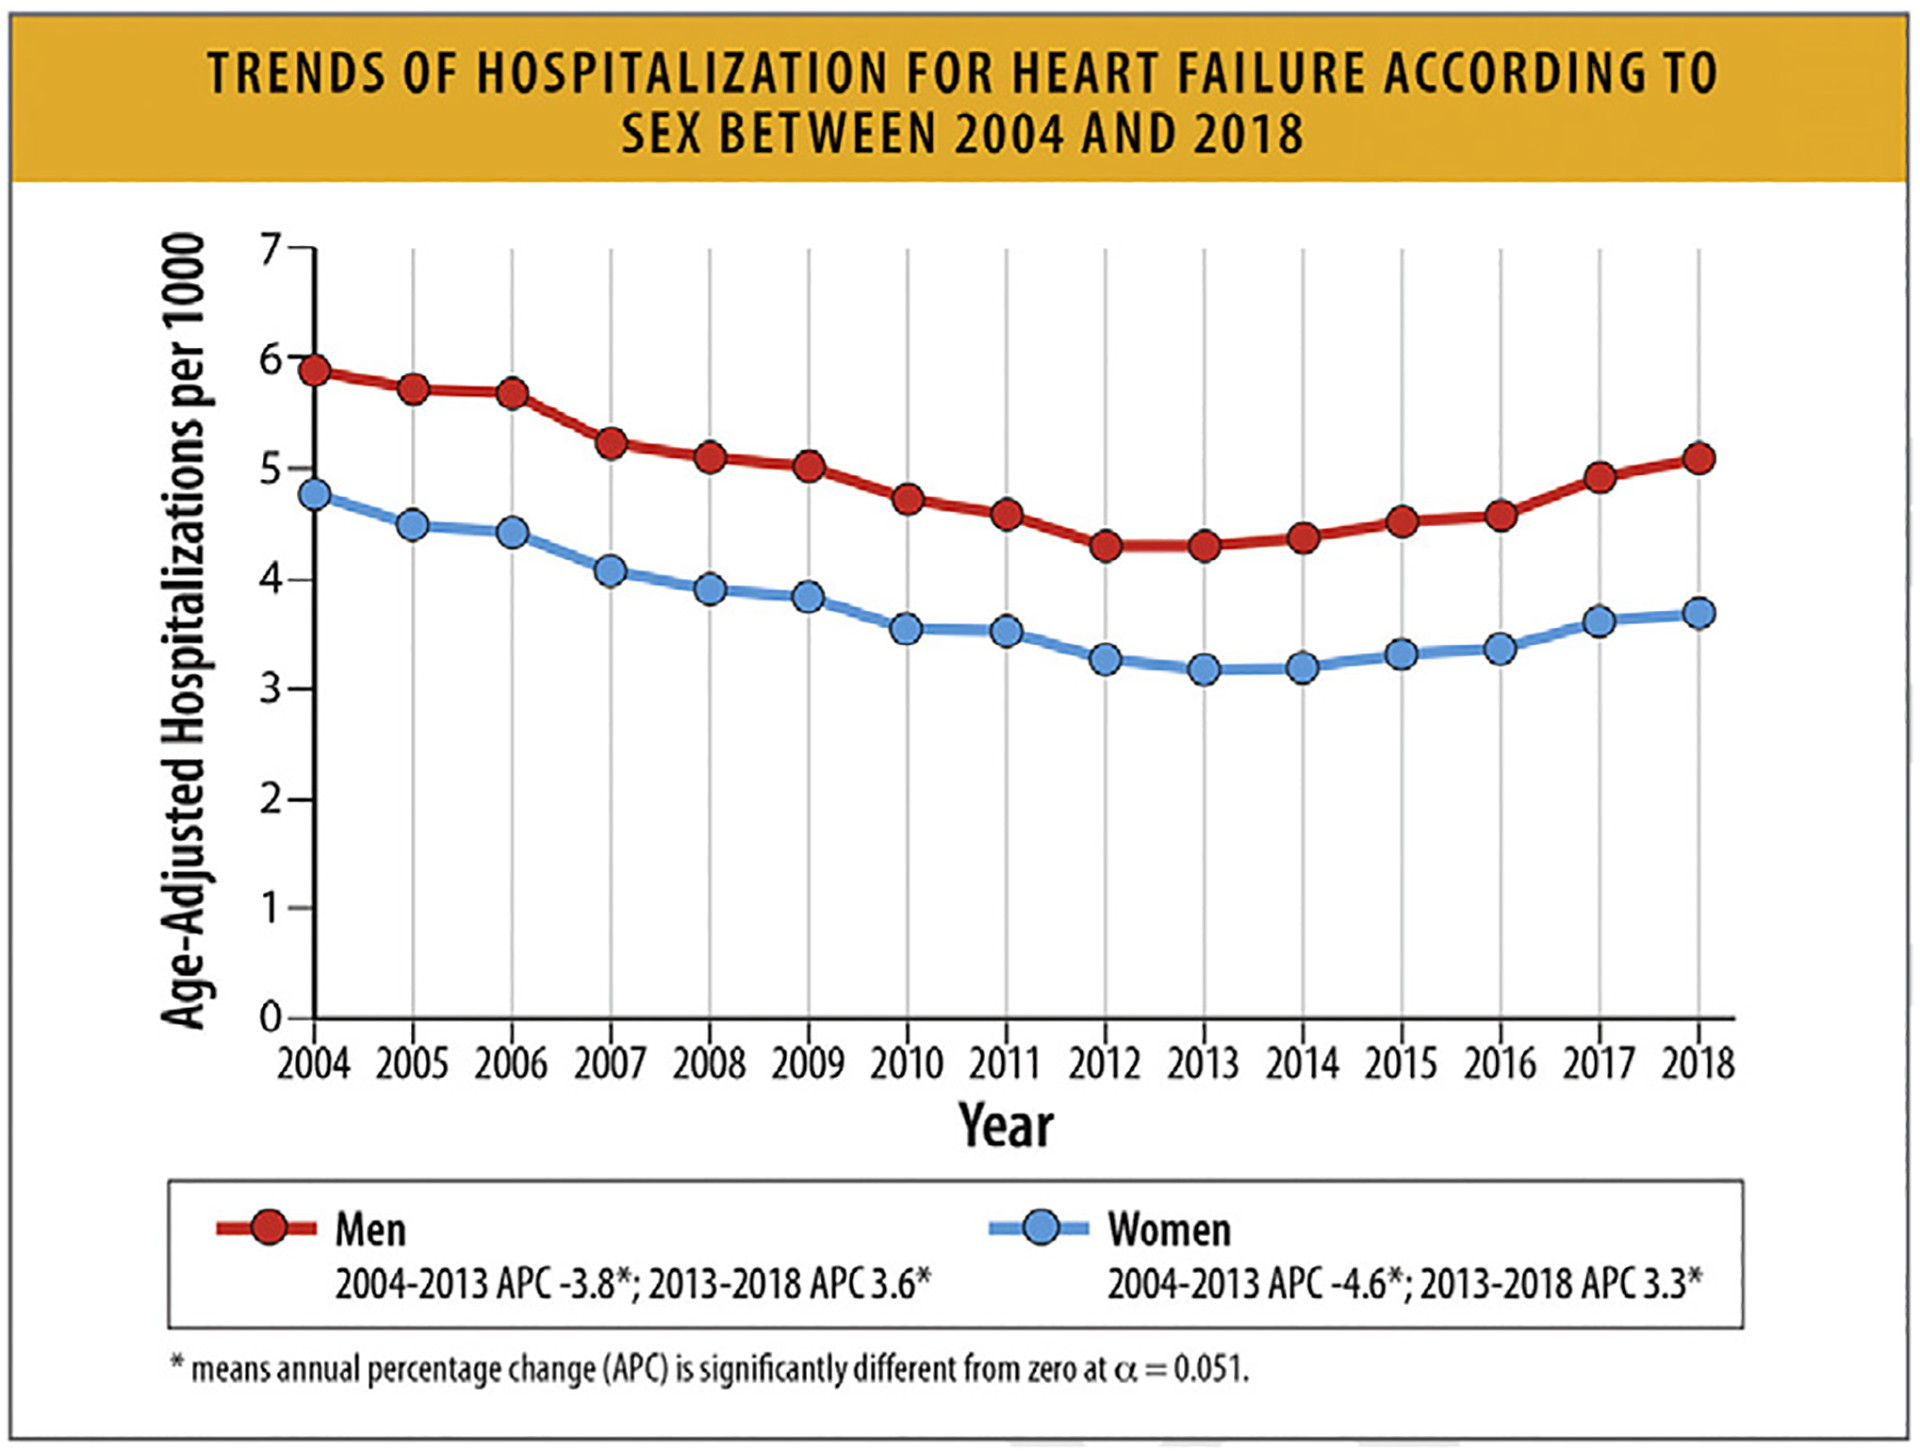
Trends of hospitalization for HF according to sex between 2004 and 2018. APC = annual percentage change, HF = heart failure. Modified from Salah HM, Minhas AMK, Khan MS, Khan SU, Ambrosy AP, Blumer V, et al. Trends and characteristics of hospitalizations for heart failure in the United States from 2004 to 2018. ESC Heart Fail 2022;9:947–52.
Importantly, HF hospitalization rates have been increasing for both women and men since 2013. According to a retrospective analysis of the NIS, after an initial decline between 2004 and 2013, there was an increase in HF hospitalizations after 2013 with similar increases in women and men, though baseline hospitalization rates were different between sexes.91
Sex-specific HF hospitalization rates also differ by race, with higher rates in Black individuals compared with White individuals.
In younger adults (aged 18–45 years), from 2004 to 2018, women comprised 37.1% of HF hospitalizations. In-hospital mortality was similar in women and men, and declined over time. Length of hospital stay was slightly longer in men. Women have a higher rate of HF hospitalization after acute myocardial infarction, compared with men, even after adjustment for comorbidities.91,96
6.6. Hospitalization Rates According to Age
From the 2004–2018 NIS, the mean age at hospitalization for HF was 72.3 ± 14.3 years.98 Between 2008 and 2018, the median age at hospitalization for HFrEF decreased from 74 to 71 years, and the median age at hospitalization for HFpEF decreased from 78 to 77 years (Table 11).91,98
Table 11.
Trends in HF Hospitalizations by Age
| Category | Timespan | Trend | Source |
|---|---|---|---|
| Age at Hospitalization | Median [IQR] | ||
| HFrEF | 2008–2018 | 74.0 [74.0–83.0] to 71.0 [59.0–81.0], p<0.001 | NIS12 |
| HFpEF | 2008–2018 | 78.0 [67.0–86.0] to 77.0 [66.0–85.0], p<0.001 | NIS12 |
| Hospitalization Rates | Annual Percentage Change | ||
| Age ≥ 65 years | 2004–2014 | −4.5%, p<0.05 | NIS2 |
| Age ≥ 65 years | 2014–2018 | 2.8%, p<0.05 | NIS2 |
| Age 18–64 years | 2004–2013 | −2.3%, p<0.05 | NIS2 |
| Age 18–64 years | 2013–2018 | 7.0%, p<0.05 | NIS2 |
| In-Hospital Mortality | Mortality Rate | ||
| Age 18–34 years | 2002–2016 | 2.2% to 1.6%, p=0.13 | NIS13 |
| Age 35–44 years | 2002–2016 | 1.5% to 1.0%, p=0.01 | NIS13 |
| Age 45–54 years | 2002–2016 | 1.7% to 1.3%, p<0.001 | NIS13 |
| Age 55–64 years | 2002–2016 | 2.4% to 1.7%, p<0.001 | NIS13 |
| Age 65–74 years | 2002–2016 | 3.5% to 2.3%, p<0.001 | NIS13 |
| Age ≥ 75 years | 2002–2016 | 5.8% to 3.8%, p<0.001 | NIS13 |
HF = heart failure; HFrEF = heart failure with reduced ejection fraction; HFpEF = heart failure with preserved ejection fraction; IQR = interquartile range; NIS = Nationwide Inpatient Sample.
Clark KAA, Reinhardt SW, Chouairi F, Miller PE, Kay B, Fuery M, et al. Trends in Heart Failure Hospitalizations in the US from 2008 to 2018 .J Card Fail. 2022 Feb;28(2):171–80.
Elbadawi A, Dang A, Elgendy IY, Thakker R, Albaeni A, Omer MA, et al. Age-specific trends and outcomes of hospitalizations with acute heart failure in the United States. IntJ Cardiol. 2021 May 1;330:98–105.
Data from the NIS revealed a progressive increase in age-adjusted HF hospitalizations between 2013 and 2018.98 Hospitalization rates increased by 2.8% among adults aged 65 years and older between 2014 and 2018, and increased by 7.0% among adults aged 18–64 years between 2013 and 2018 (Table 11).91
Based on data from the 2002–2016 NIS, in-hospital mortality declined from 4.4% in 2002 to 2.8% in 2016. The significant decline in in-hospital mortality occurred among all age groups except in adults 18–34 years of age (Table 11).99
From GWTG registry data, inpatient mortality during a HF admission was higher among older adults 65 years of age and older(3.10%) compared with younger adults more than 65 years of age (1.48%).100
According to another analysis of the NIS of adults over 80 years of age, who were hospitalized between January 2004 and December 2018, there was an initial decline until 2014, after which HF hospitalizations increased. Older adults hospitalized for HF also had a substantial increase in cardiometabolic comorbidities (Fig. 34).101
Fig. 34.
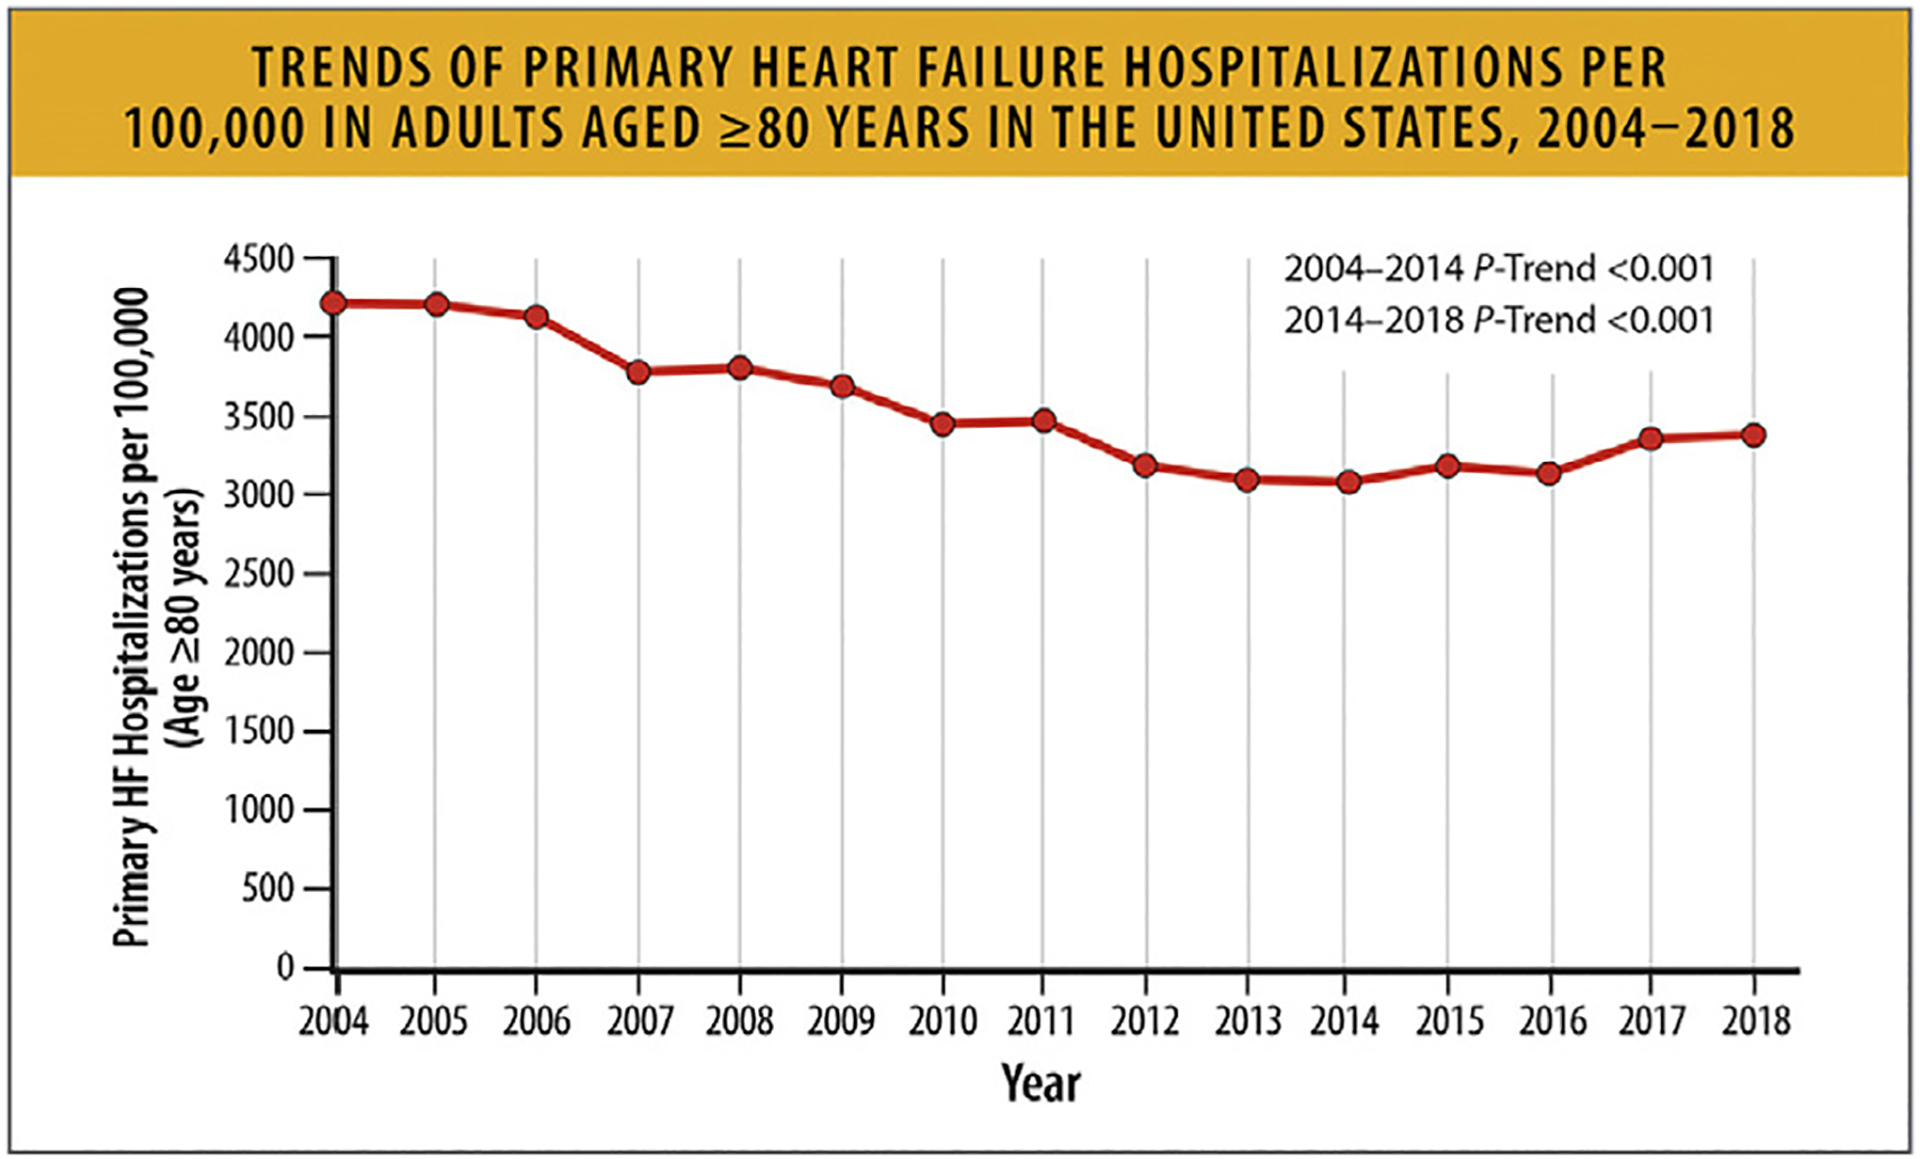
Trends of primary HF hospitalizations per 100,000 in adults aged ≥80 years in the United States, 2004–2018. HF = heart failure; US = United States. Modified from Minhas AMK, Ijaz SH, Jamal S, Dani SS, Khan MS, Greene SJ, et al. Trends in characteristics and outcomes in primary heart failure hospitalizations among older population in the United States, 2004 to 2018. Circ Heart Fail 2022;15: e008943.
6.7. Hospitalization Rates According to EF Phenotypes (HFrEF, HFpEF)
Hospitalizations for both HFrEF and HFpEF have been increasing with HFrEF constituting approximately 45%–58% of the hospitalizations. After an index HF hospitalization, 65% of patients with HFrEF and HFpEF have an all-cause hospitalization within one year, particularly in patients with HFrEF. Patients with advanced HF have similarly high all-cause hospitalization rates across the ranges of EF.
Drawing on the NIS with 11,693,994 admissions for HF as a primary diagnosis from 2008–2018, there were 5,354,696 (45.8%) hospitalizations for HFrEF, 3,605,004 (30.8%) hospitalizations for HFpEF and 2,734,294 unspecified HF hospitalizations as assigned by administrative diagnostic codes. Over the course of the sample period, hospitalizations due to HF increased overall from 1,060,540 in 2008 to 1,270,360 in 2018, with a nadir in 2012 of 956,675. There was a progressive increase in the number of hospitalizations for HFrEF (283,193 in 2008 to 679,815 in 2018) and for HFpEF (189,260 in 2008 to 495,095 in 2018) with a decrease in the number and percentage of hospitalizations that were unspeci-fied. Of the hospitalizations with specific diagnoses specified, 57.7% were for HFrEF in 2018 (Fig. 35).88
Fig. 35.

Annual HF hospitalization volumes. HF = heart failure; HFrEF = heart failure with reduced ejection fraction; HFpEF = heart failure with preserved ejection fraction. Modified from Clark KAA, Reinhardt SW, Chouairi F, Miller PE, Kay B, Fuery M, et al. Trends in heart failure hospitalizations in the United States from 2008 to 2018. J Card Fail 2022;28:171–80.
The GWTG registry included 586,580 patients hospitalized for HF between January 2014 and September 2019, and of those with available EF data (N = 559,520), 45% had HFrEF, 14% HFmrEF and 41% HFpEF.102 These data provide a more direct and complementary measure of the distribution of EF in patients admitted for HF (Fig. 36).
Fig. 36.
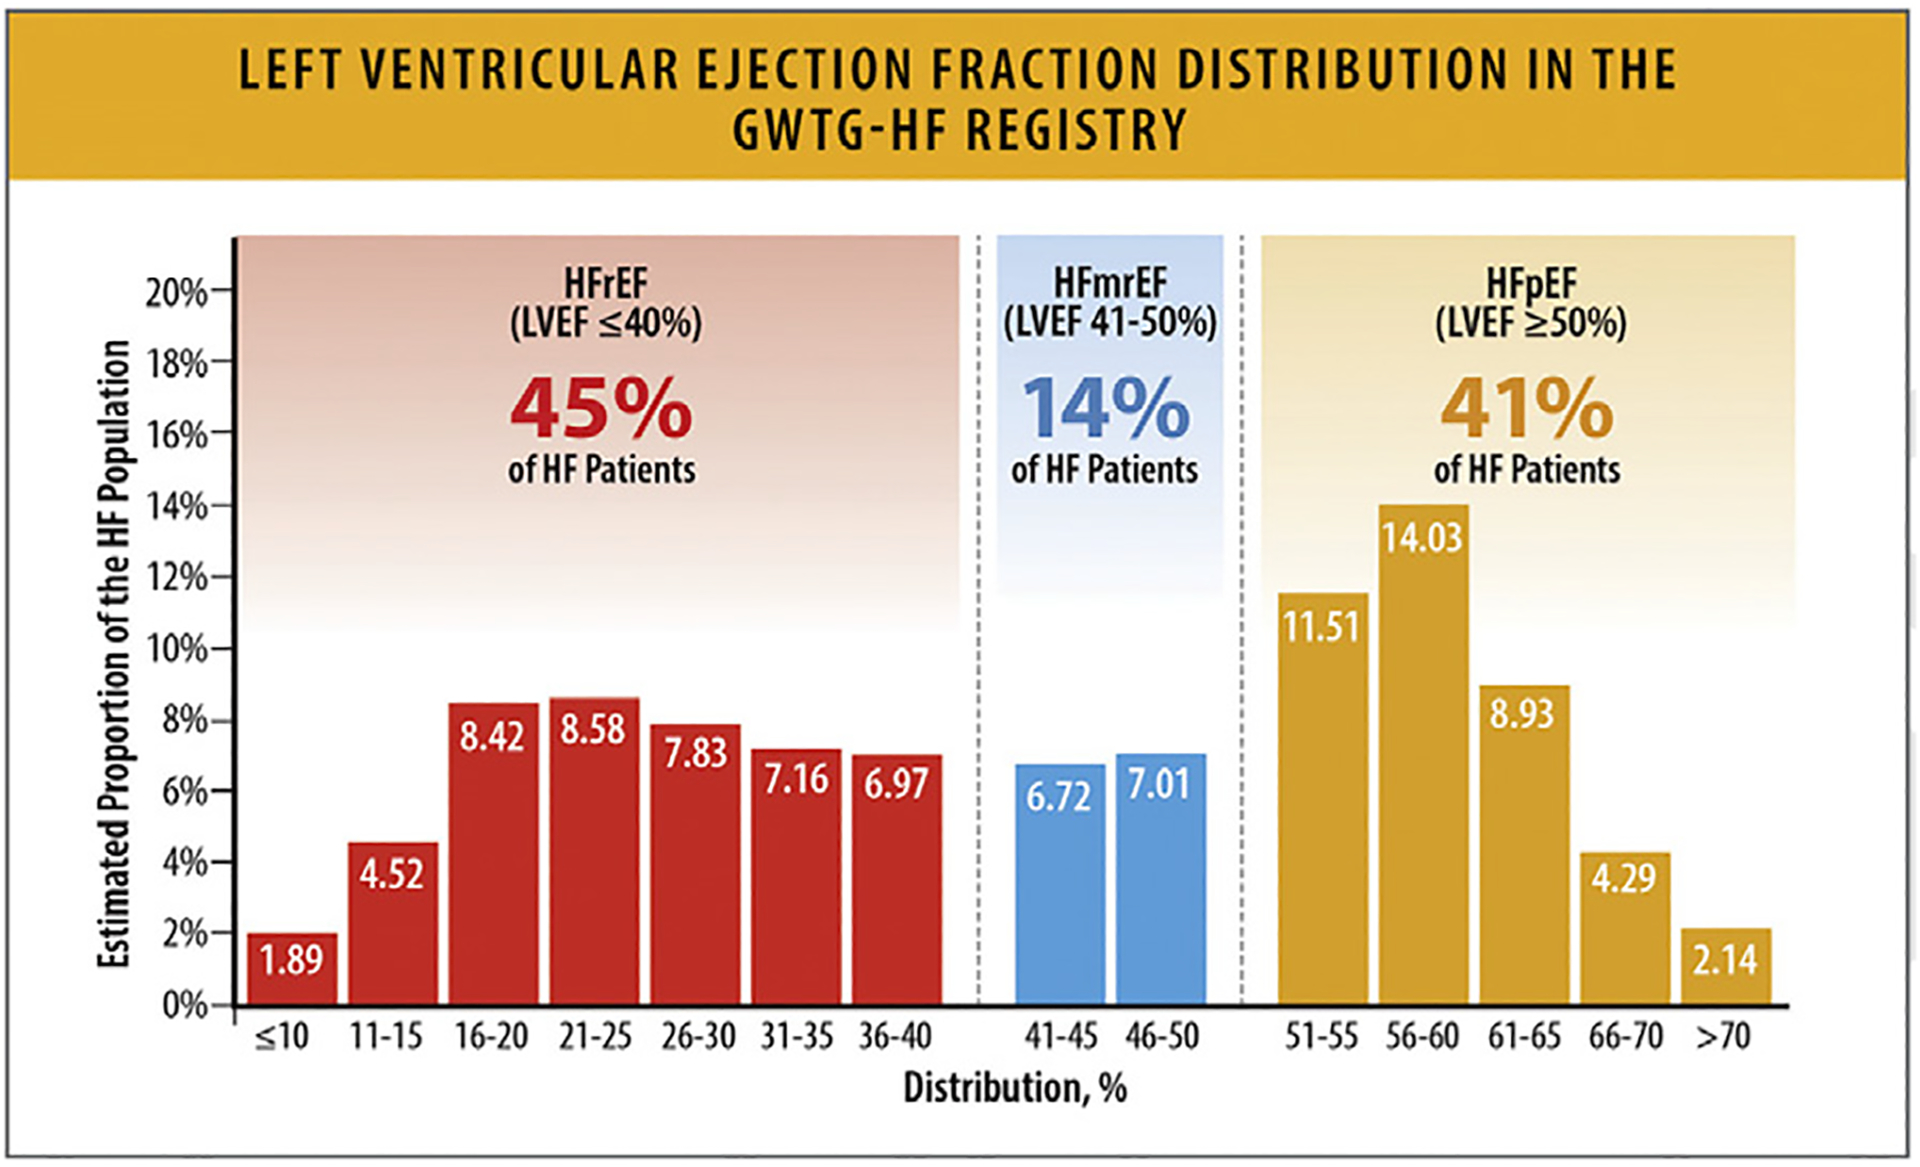
Left ventricular ejection fraction distribution in the GWTG-HF registry. GWTG-HF = Get With the Guidelines; HF = heart failure; HFmrEF = heart failure with mildly reduced ejection fraction; HFpEF = heart failure with preserved ejection fraction; HFrEF = heart failure with reduced ejection fraction; LVEF = left ventricular ejection fraction. Modified from Vaduganathan M, Claggett BL, Greene SJ, Aggarwal R, Bhatt AS, McMurray JJV, et al. Potential implications of expanded US Food and Drug Administration labeling for sacubitril/valsartan in the United States. JAMA Cardiol 2021;6:1415–23.
In propensity-matched cohorts of patients with an index HF hospitalization from the Organized Program to Initiate Lifesaving Treatment in Hospitalized Patients with Heart Failure study, patients with HFrEF (EF of ≤40%) and HFpEF (EF of ≥50%) had similar high numbers of events at 30 days and 1 year.102–104 However, patients with HFrEF seemed to have higher rates of HF readmission rates (Table 12).
Table 12.
Outcomes in Two Cohorts From OPTIMIZE-HF by EF
| Events, No. (%) | HFrEF103 (EF≤40%; n=2378) |
HFpEF104 (EF≥50%; n=1802) |
|---|---|---|
| 30 Days | ||
| All-cause mortality | 139 (5.8%) | 136 (7.5%) |
| All-cause readmisslon | 559 (23.5%) | 436 (24.2%) |
| HF readmission | 244 (10.3%) | 162 (9.0%) |
| All-cause readmission or all-cause mortality | 648 (27.2%) | 512 (28.4%) |
| HF readmission or all-cause mortality | 362 (15.2%) | 276 (15.3%) |
| 12 Months | ||
| All-cause mortality | 741 (31.2%) | 627 (34.8%) |
| All-cause readmission | 1625 (68.3%) | 1166 (64.7%) |
| HF readmission | 896 (37.7%) | 497 (27.6%) |
| All-cause readmission or all-cause mortality | 1807 (76.0%) | 1322 (73.4%) |
| HF readmission or all-cause mortality | 1321 (55.6%) | 922 (51.2%) |
EF = Ejection Fraction; FHF = heart failure; HFpEF = heart failure with preserved ejection fraction; HFrEF = heart failure with reduced ejection fraction
Arundel C, Lam PH, Gill GS, Patel S, Panjrath G, Faselis C, et al. Systolic Blood Pressure and Outcomes in Patients with Heart Failure with Reduced Ejection Fraction. J Am Coll Cardiol. 2019 Jun 25;73(24):3054–63.
Tsimploulis A, Lam PH, Arundel C, Singh SN, Morgan CJ, Faselis C, et al. Systolic Blood Pressure and Outcomes in Patients with Heart Failure with Preserved Ejection Fraction. JAMA Cardiol. 2018 Apr 1;3(4):288–97.
In 936 patients with advanced HF in Olmsted County, 396 (42.3%; EF of <40%) patients had HFrEF, 134 (14.3%; EF of 40%–−=49%) had HFmrEF, and 406 (43.4%; EF of ≥50%) had HFpEF.105 While these patients had high rates of all-cause hospitalization (Fig. 37) and HF hospitalizations, there was no significant difference amongst the rates for these EF groups.
Fig. 37.
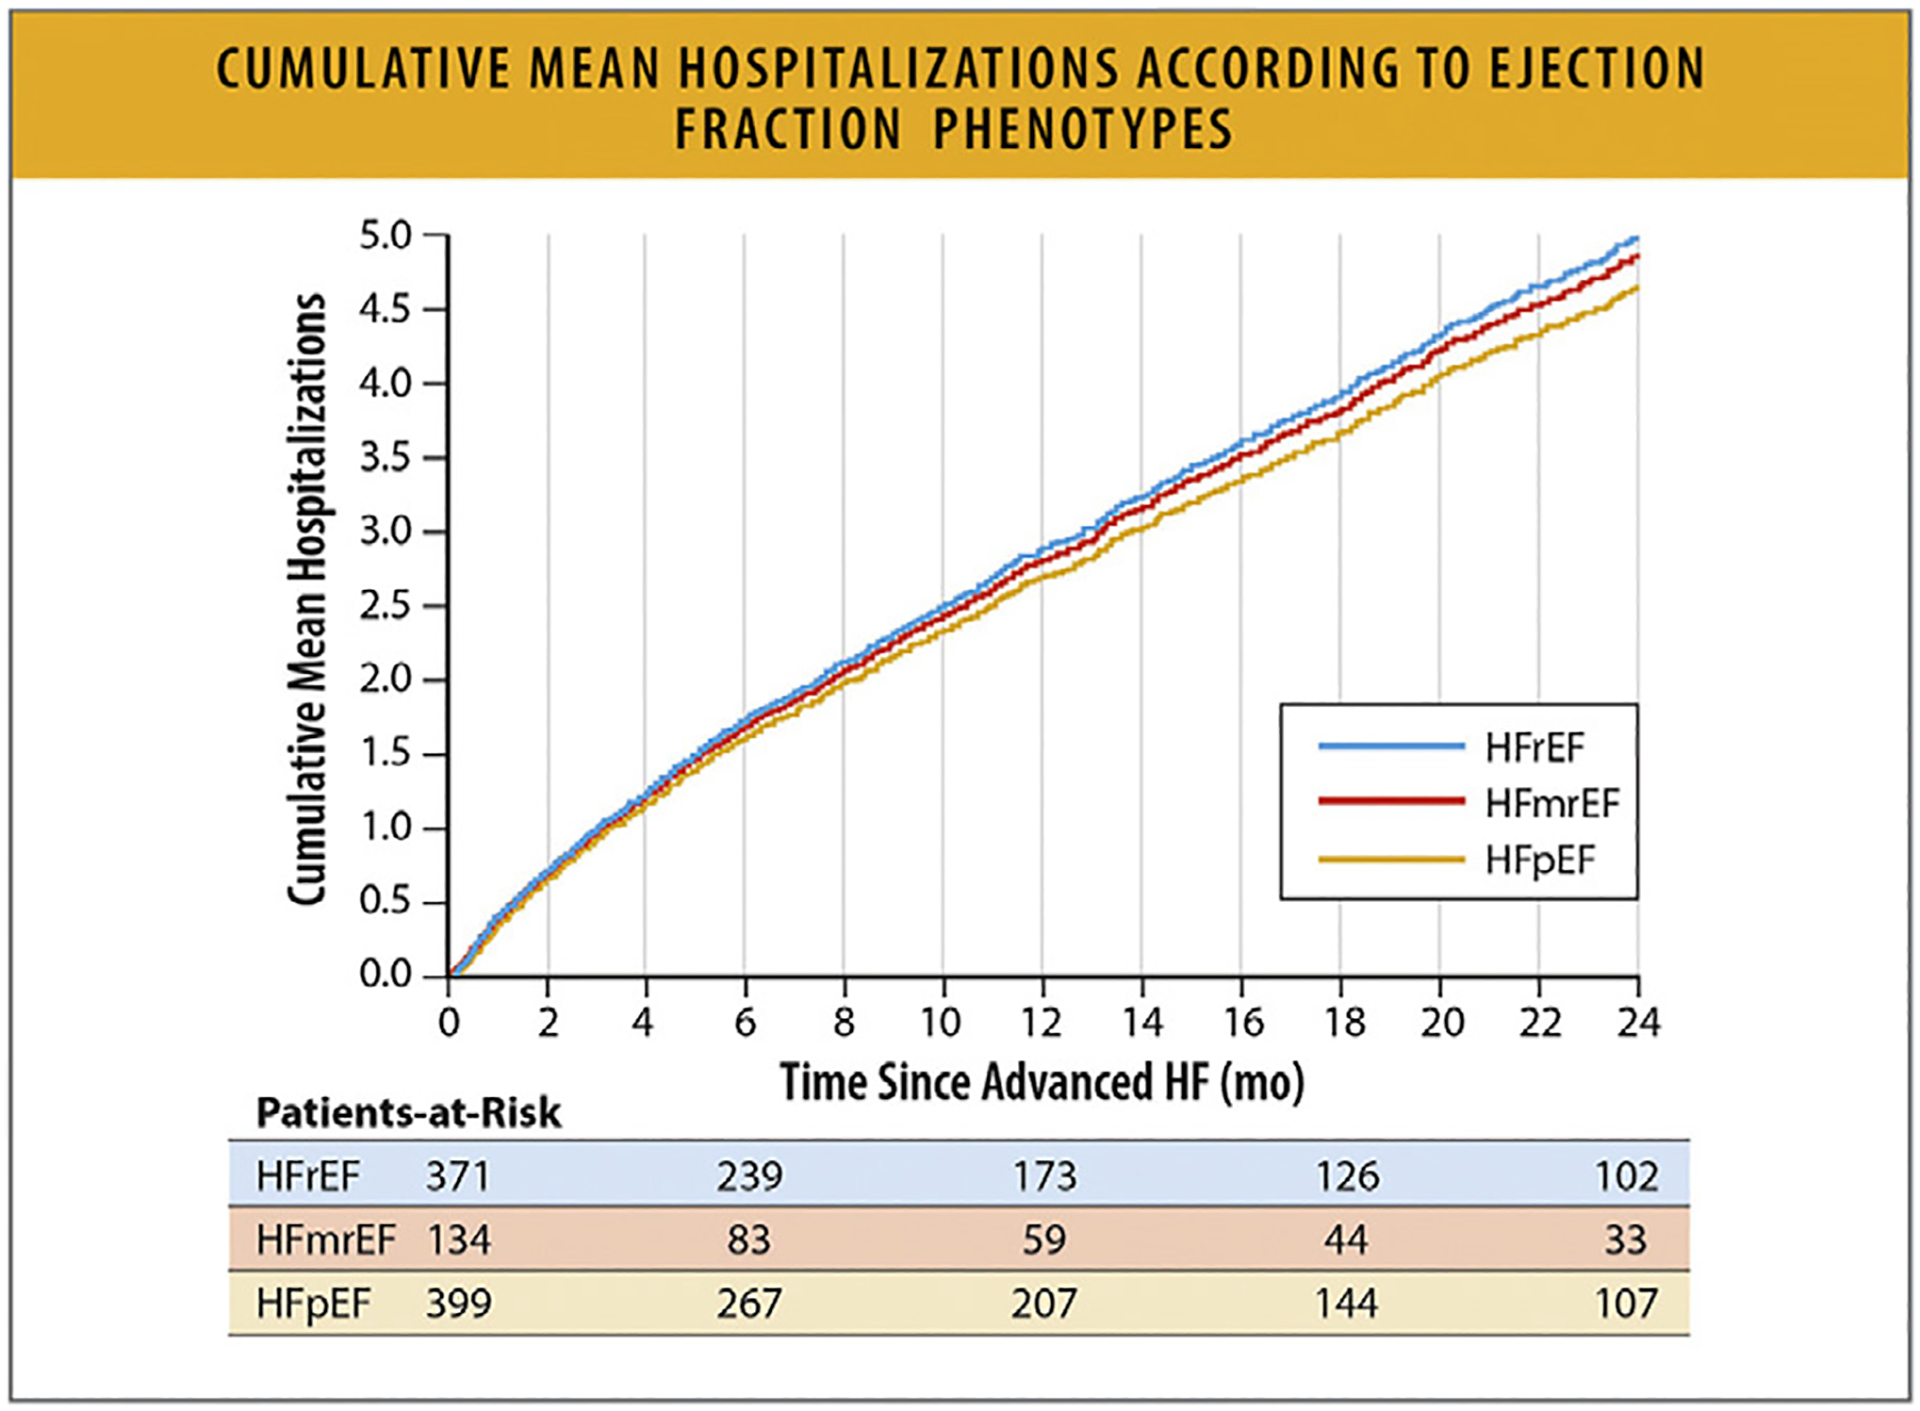
Cumulative mean hospitalizations according to EF phenotypes. EF = ejection fraction; HF = heart failure; HFmrEF = heart failure with mildly reduced ejection fraction; HFpEF = heart failure with preserved ejection fraction; HFrEF = heart failure with reduced ejection fraction. Modified from Dunlay SM, Roger VL, Killian JM, Weston SA, Schulte PJ, Subramaniam AV, et al. Advanced heart failure epidemiology and outcomes: a population-based study. JACC Heart Fail 2021;9:722–32.
7. Geographic and Regional Variations in the United States
7.1. Summary
Within the US there are geographic variations in the prevalence of HF. A low HF prevalence has been reported in the northern Great Plains and Western states, and the highest prevalence of HF has been reported in Midwestern and Eastern states (Fig. 38).106 HF age-standardized prevalence rates range from 760 cases per 100,000 persons in Minnesota to as high as 1319 cases per 100,000 persons in New York.106
There is also significant geographic variation across the US in HF death rates, with the lowest rate of HF deaths reported in some Western, Northwestern, and Northeastern states and the highest death rates reported in some states in the Midwest and the Southeast (Fig. 39).69,107,108 HF age-standardized death rates range from as low as 1.09 deaths per 100,000 persons in Minnesota to as high as 7.98 deaths per 100,000 persons in Mississippi.106 The annual age-adjusted HF mortality rate has been increasing in the United States since 2011, and this trend has been consistent across all 4 US regions.107 The greatest number of HF deaths are observed in the Midwest, followed by the South, West and Northeast.107
HF prevalence and HF mortality rates are not fully aligned geographically, which suggests a role of contributing factors such as underdiagnosis and access to treatment. Further, significant variation in HF mortality is seen within individual states by county (Fig. 40)109 and by the level or urbanization (Fig. 41),69 highlighting the impact of SDoH disparities on HF mortality.
In addition, there are regional differences in the proportion of patients diagnosed with HFrEF and HFpEF, which likely relates to varied population demographics across the US, including age, racial and ethnic background, and comorbidity prevalence. Data on hospital discharges across the 4 US regions stratified by HFrEF and HFpEF are shown in Table 13.110
Across all geographic regions, Black women and men experience higher AAMRs compared with White women and men.107 Since it is projected that, after 2025, there will be reduction of cardiovascular risk in White individuals compared with individuals of minoritized racial and ethnic groups, it is likely that the geographic variation in HF prevalence and mortality described above will further increase.111,112
Fig. 38.
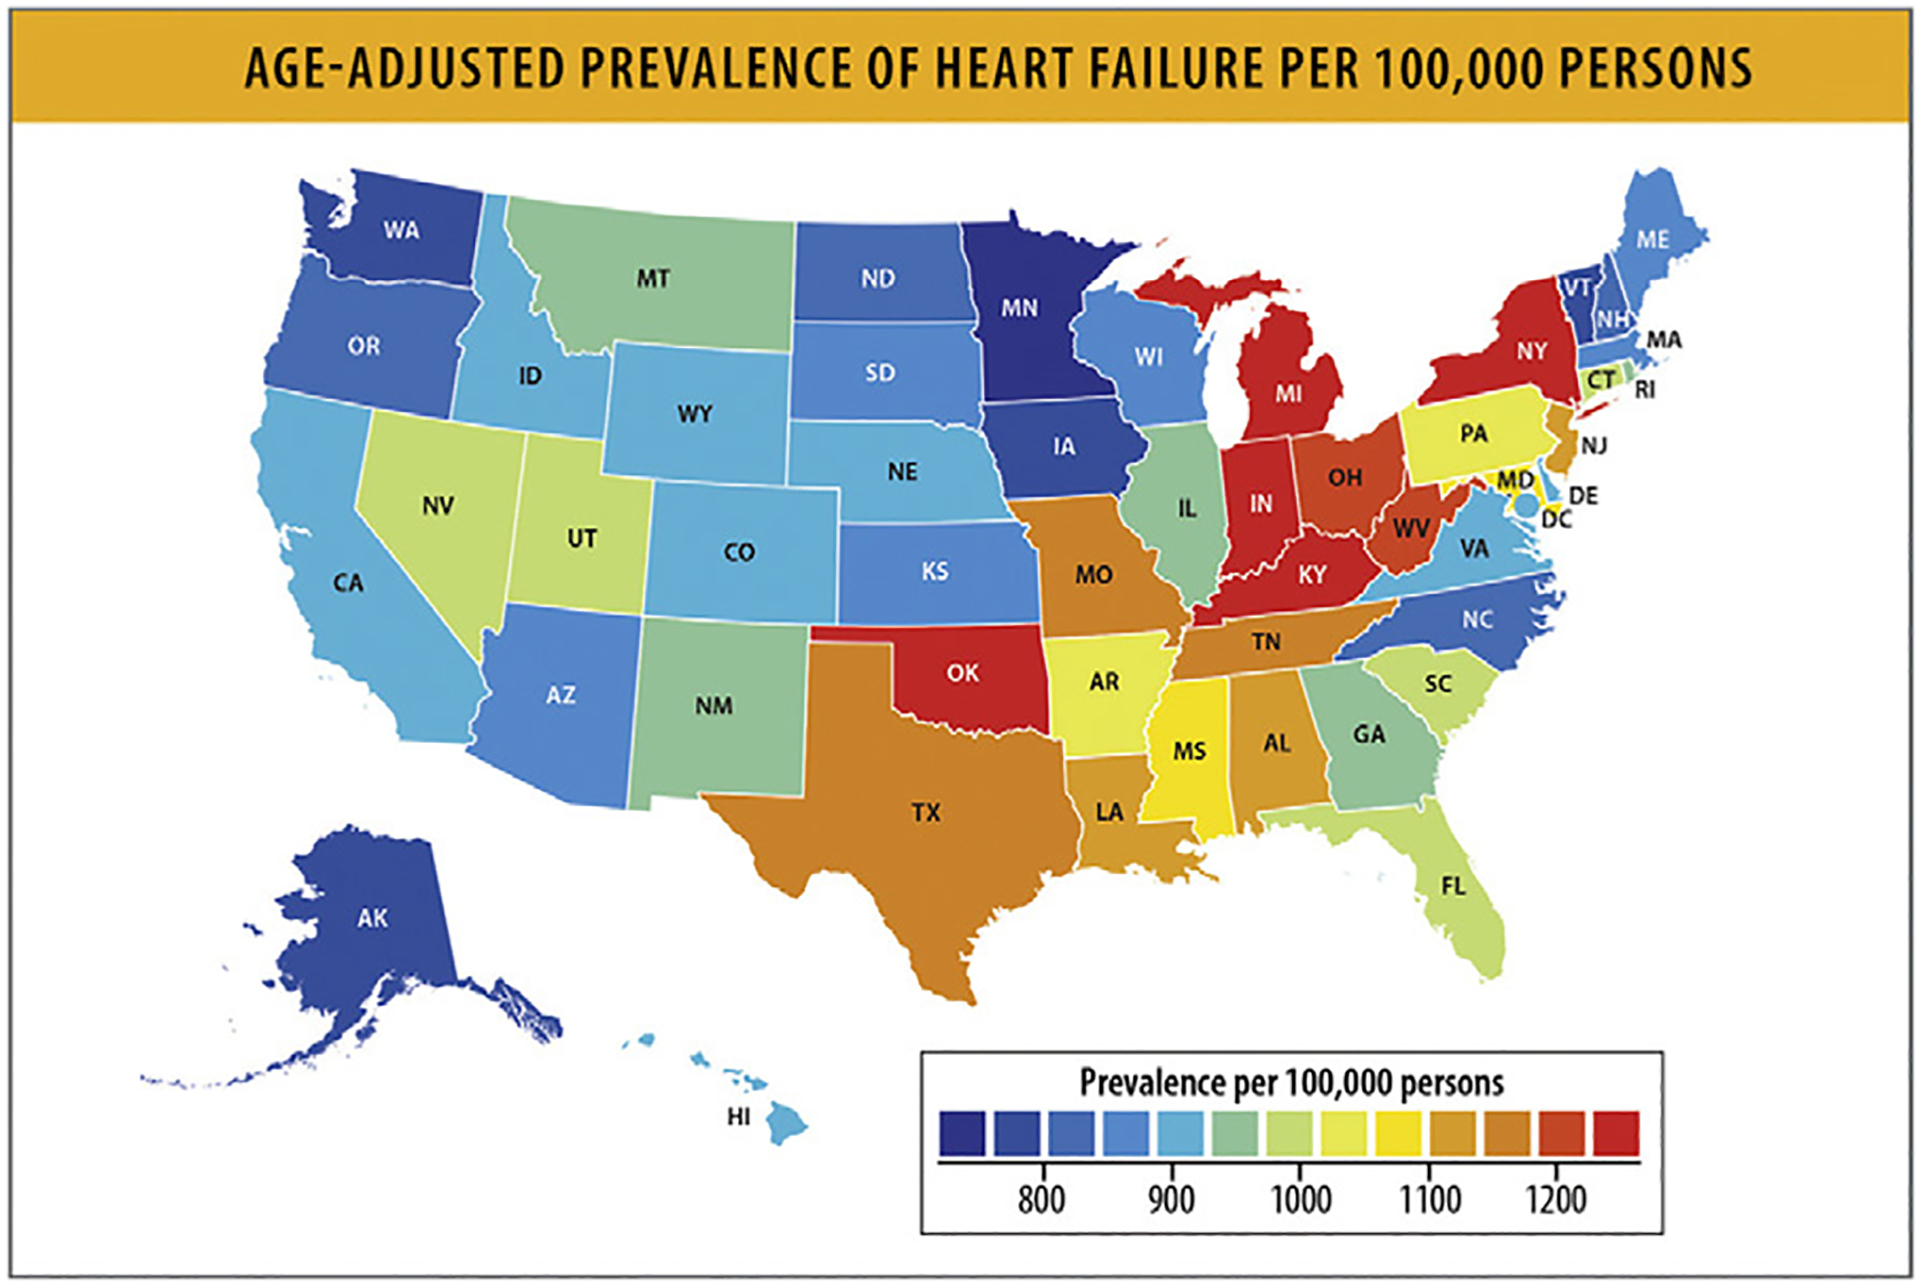
Age-adjusted prevalence of HF per 100,000 persons. HF = heart failure. Modified from Global Burden of Cardiovascular Diseases Collaboration; Roth GA, Johnson CO, Abate KH, Abd-Allah F, Ahmed M, et al. The burden of cardiovascular diseases among US states, 1990–2016. JAMA Cardiol 2018;3:375–389.
Fig. 39.
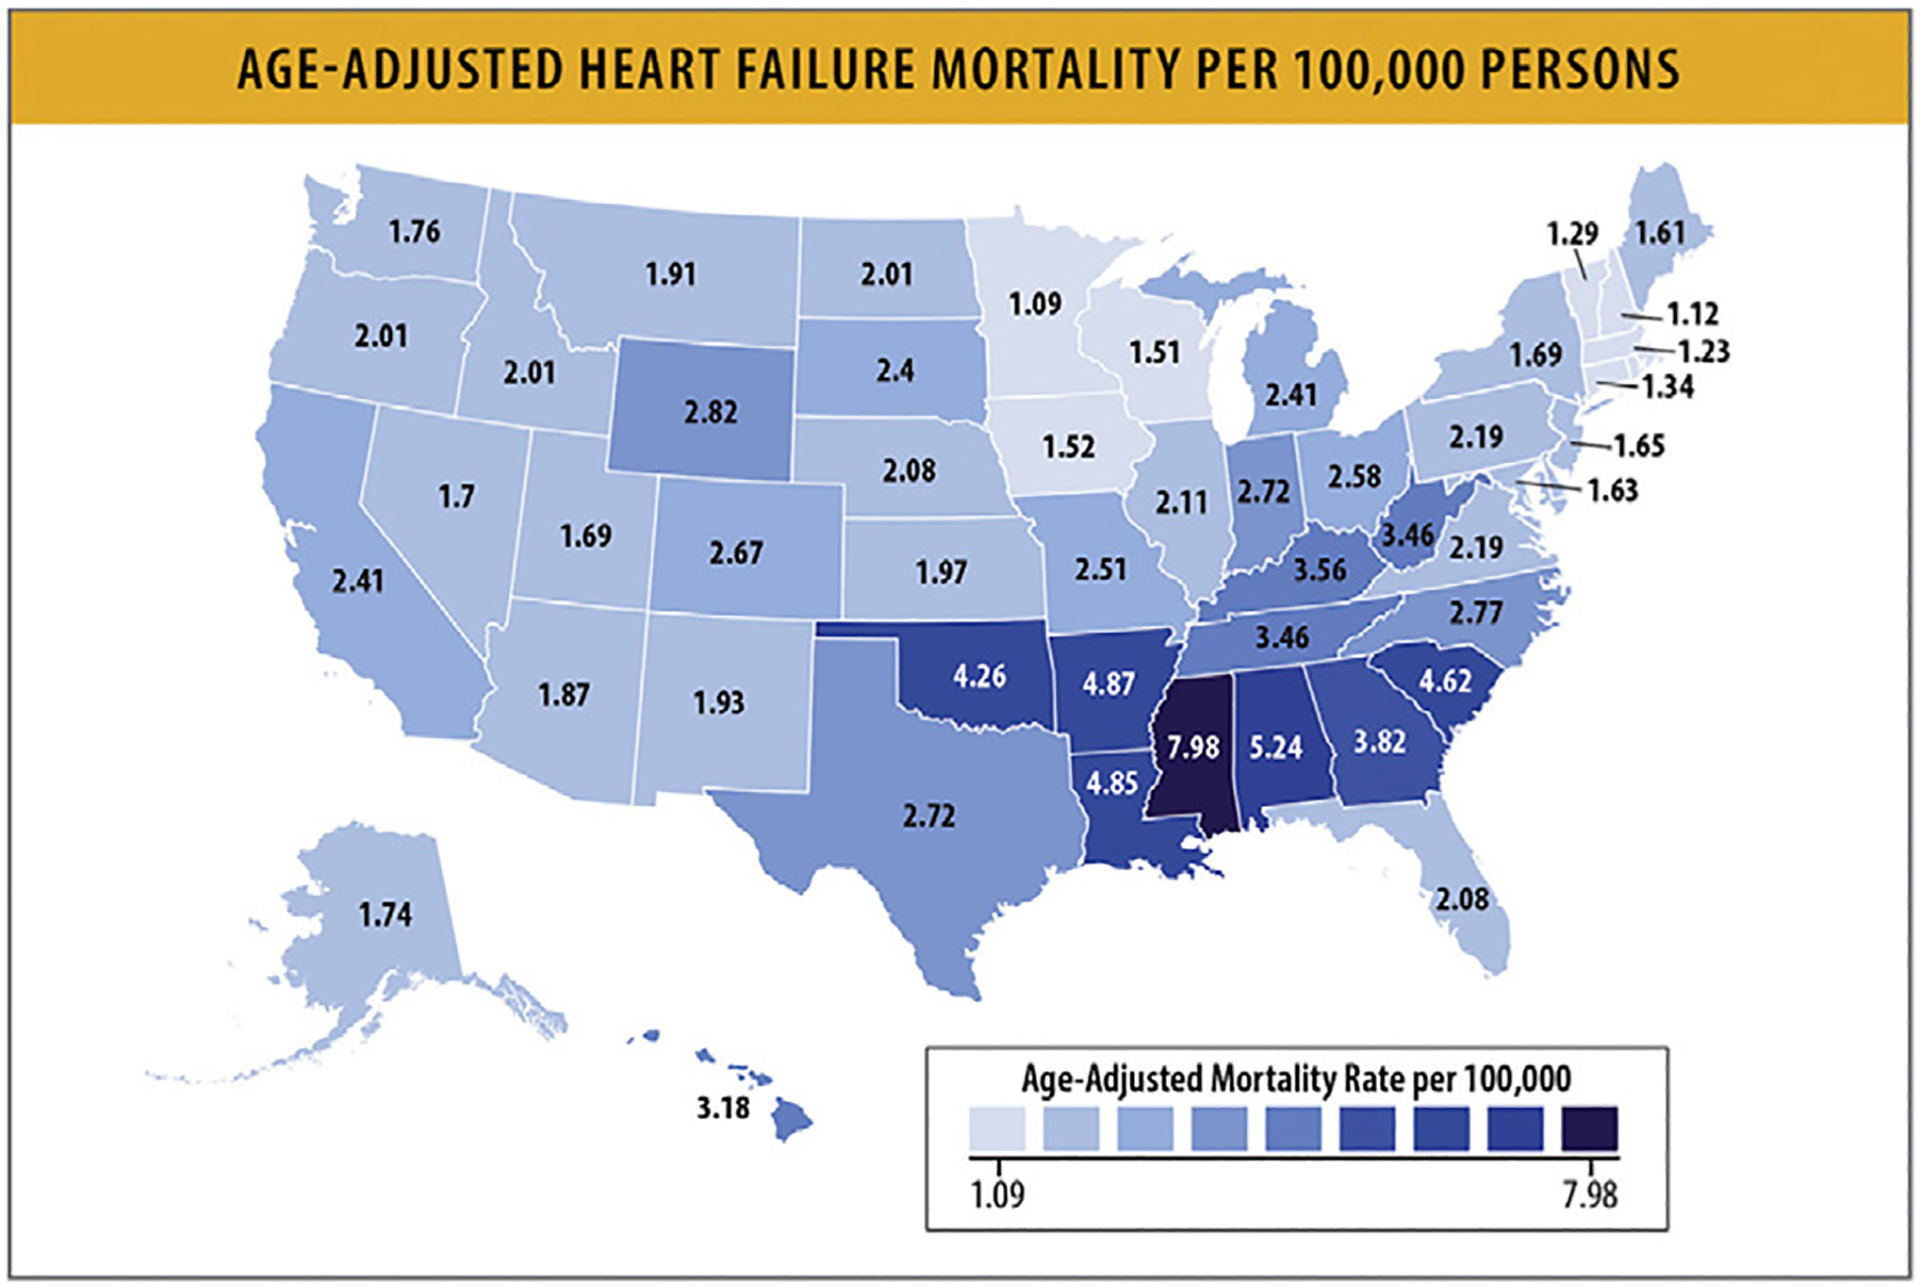
Age-adjusted HF mortality per 100,000 persons. HF = heart failure. Modified from Jain V, Minhas AMK, Morris AA, Greene SJ, Pandey A, Khan SS, et al. Demographic and regional trends of heart failure-related mortality in young adults in the US, 1999–2019. JAMA Cardiol 2022;7:900–4.
Fig. 40.
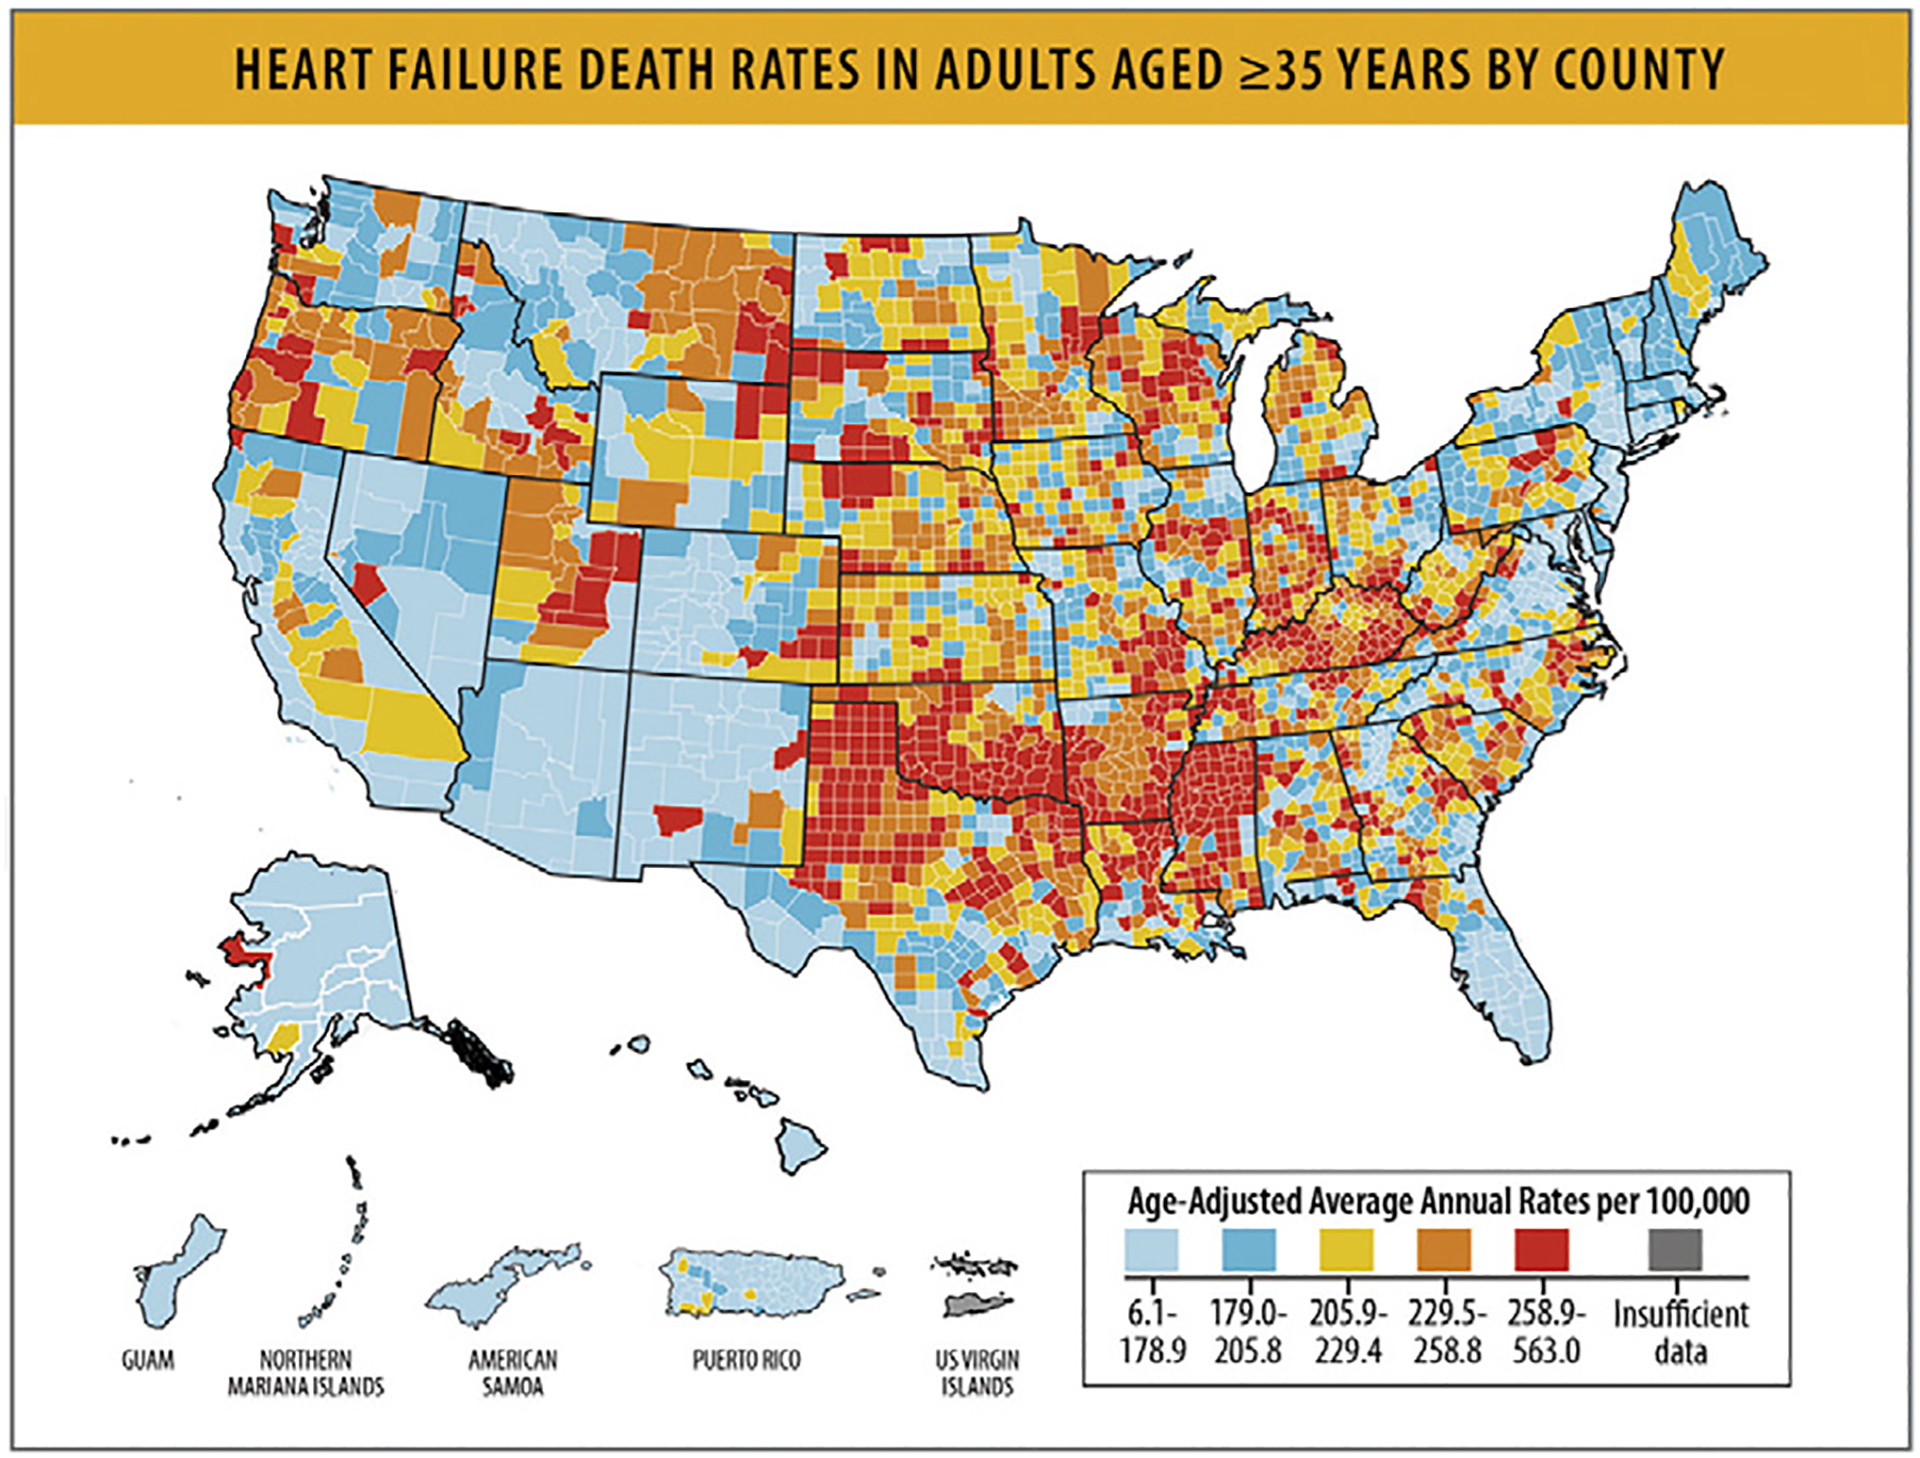
HF death rates in adults aged ≥35 years by county. HF = heart failure. Modified from Centers for Disease Control and Prevention. Heart Failure. 2023 [cited 2023 Jul 9]. Available from: https://www.cdc.gov/heartdisease/heart_failure.htm
Fig. 41.
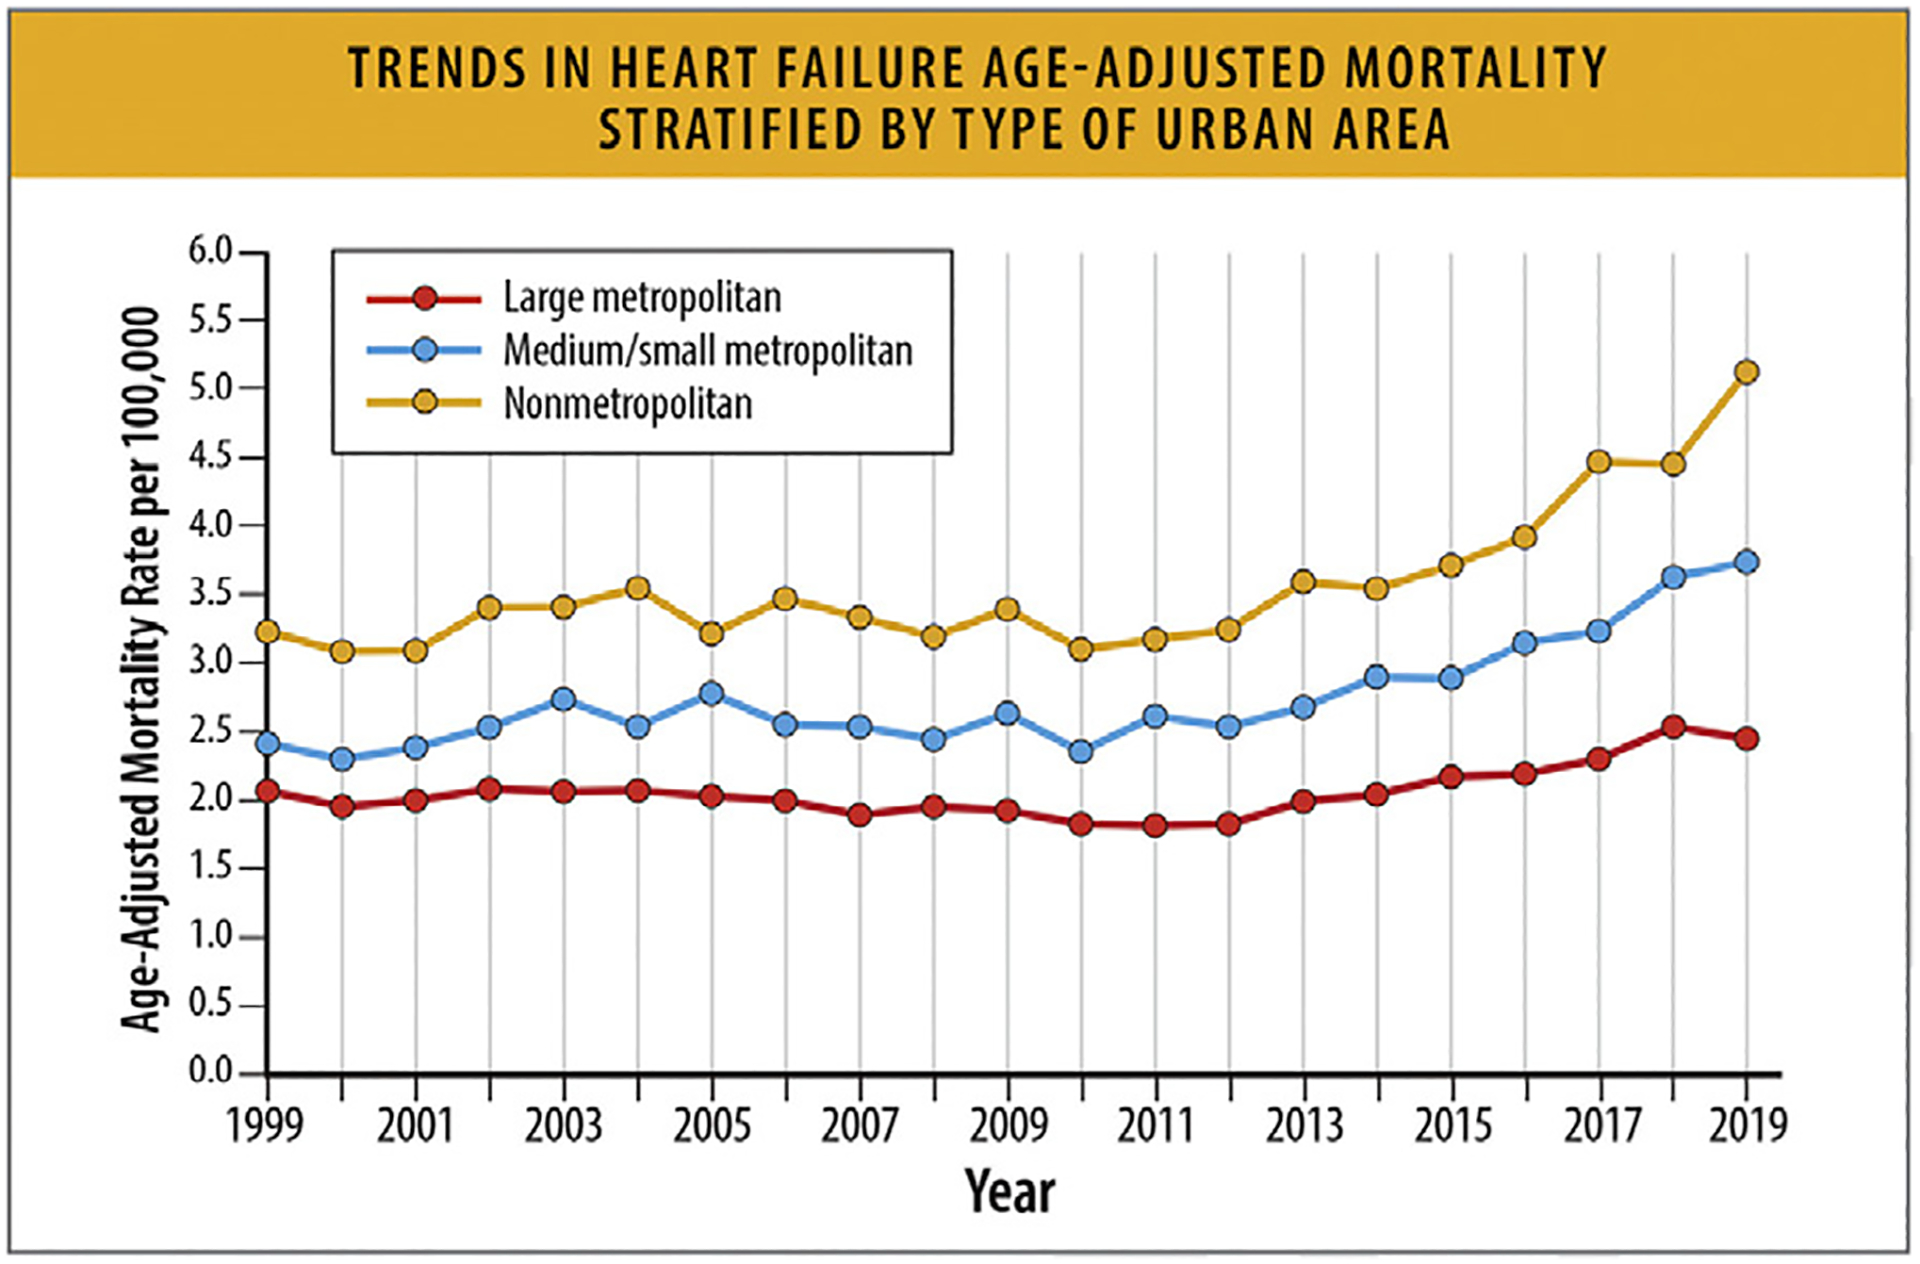
Trends in HF age-adjusted mortality stratified by type of urban area. HF = heart failure. Modified from Jain V, Minhas AMK, Morris AA, Greene SJ, Pandey A, Khan SS, et al. Demographic and regional trends of heart failure-related mortality in young adults in the US, 1999–2019. JAMA Cardiol 2022;7:900–4..
Table 13.
Hospital Discharges for HFrEF and HFpEF Stratified by Region
| Region | All HF (6,403,626) | HFrEF (n= 3,858,341) | HFpEF (n= 2,545,286) | p-value |
|---|---|---|---|---|
| Northeast | 21.3% | 20.2% | 22.9% | <0.001 |
| Midwest | 24.2% | 24.1% | 24.3% | <0.001 |
| South | 39.2% | 40.1% | 37.8% | <0.001 |
| West | 15.3% | 15.6% | 14.9% | <0.001 |
HF = heart failure; HFpEF = heart failure with preserved ejection fraction; HFrEF = heart failure with reduced ejection fraction
Adapted from Afzal A, van Zyl J, Nisar T, Kluger AY, Jamil AK, Felius J, et al. Trends in Hospital Admissions for Systolic and Diastolic Heart Failure in the United States Between 2004 and 2017. Am J Cardiol. 2022 May 15; 171:99–104.
8. Top Line Current Treatment Spectrum
8.1. Current Use of and Effect of Guideline Directed Therapies in Outcomes
Without guideline-directed medical therapy (GDMT), the 2-year mortality rate of patients with HFrEF is estimated at 35%.113 The magnitude of benefit of GDMT as demonstrated in randomized controlled trials is shown in Table 14.114
Table 14.
Magnitude of Benefit of GDMT Demonstrated in Randomized Controlled Trials
| GDMT | RR Reduction in Mortality (%) | 2 Year Mortality (%) | NNT for Mortality Reduction (Standardized to 36 mo) | RR Reduction in HF Hospitalization (%) |
|---|---|---|---|---|
| None | – | 35 | – | – |
| ARNi* | 16 | 25 | 27 | 21 |
| ACE inhibitor or ARB | 17 | 26 | 31 | |
| Beta Blocker | 35 | 16 | 9 | 41 |
| MRA | 30 | 12 | 6 | 35 |
| SGLT2i | 17 | 10 | 22 | 31 |
Updated from the ACC/AHA/HFSA 2022 HF Guidelines17.
ACEi = angiotensin-converting enzyme inhibitor; ARB = angiotensin receptor blocker; ARNi = angiotensin receptor - neprilysin inhibitor; GDMT: guideline directed medical therapy; MRA = mineralocorticoid receptor antagonists; NNT = number needed to treat; RR reduction = relative risk reduction; SGLT2I = Sodium-Glucose Cotransporter 2 Inhibitors
Writing Committee Members; ACC/AHA Joint Committee Members.2022 AHA/ACC/HFSA guideline for the management of heart failure. JCardFail2022;28.e1e167.
Current use of GDMT in patients with HFrEF remains suboptimal, with only a low percentage of patients being treated with all the indicated medical therapies at target or maximally tolerated doses (Table 15).115,116 Similarly, only 10%–12% of eligible patients receive implantable cardioverter-defibrillators or cardiac resynchronization therapy. It has been estimated that if there were optimal implementation of GDMT, an additional 100,000 deaths per year could be prevented in the US.114
Table 15.
Current Use of Guideline Directed Medical Therapy
| GDMT | ||||||||
|---|---|---|---|---|---|---|---|---|
| ACE/ARB/ARNi | ARNi | ACEi/ARB | ACEi | ARB | Beta Blocker | MRA | SGLT2i | |
| Percentage of Patients on Treatment | ||||||||
| EVOLUTION-HF 2023 | 73% | 55% | 62% | 75% | 58% | 77% | ||
| CHAMP-HF 2018 | 72% | 13% | 60% | 67% | 33% | |||
| PINNACLE 2020 | 78% | 9% | 55% | 28% | 75% | |||
| QUALIFY 2016 | 66% | 22% | 87% | 69% | ||||
| ESC-HF 2013 | 92% | 71% | 24% | 93% | 67% | |||
| BIOSTAT-CHF 2017 | 85% | 90% | ||||||
| Savarese et al. 2021 | 73% | 45% | 67% | 76% | 60% | |||
| Percentage of Patients at ≥ 50% of Target Doses | ||||||||
| EVOLUTION-HF 2023 | 27% | 18% | 9% | 24% | 53% | |||
| CHAMP-HF 2017 | 40% | 44% | 40% | 54% | 98% | |||
| BIOSTAT-CHF 2017 | 53% | 40% | ||||||
| QUALIFY 2016 | 63% | 40% | 52% | 99% | ||||
| Savarese et al. 2021 | 53% | 28% | 19% | 30% | 60% | |||
| Percentage of Patients on Target Doses of GDMT | ||||||||
| EVOLUTION-HF 2023 | 28% | 20% | 7% | 7% | 5% | 76% | ||
| CHAMP-HF 2017 | 17% | 14% | 18% | 28% | 77% | |||
| QUALIFY 2016 | 28% | 7% | 15% | 71% | ||||
| ESC-HF 2013 | 29% | 24% | 18% | 31% | ||||
| BIOSTAT-CHF 2017 | 22% | 27% | 20% | 12% | ||||
| Savarese etal. 2021 | 30% | 15% | 10% | 12% | 60% | |||
ACEi = angiotensin-converting enzyme inhibitor; ARB = angiotensin receptor blocker; ARNi = angiotensin receptor - neprilysin inhibitor; BIOSTAT CHF = A Systems Biology Study to Tailored Treatment in Chronic Heart Failure; CHAMP HF = Change the Management of Patients with Heart Failure; ESC - HF = European Society of Cardiology. Heart Failure; EVOLUTION HF = Utilization of Dapagliflozin and Other Guideline Directed Medical Therapies in Heart Failure Patients: A Multinational Observational Study Based on Secondary Data; MRA = mineralocorticoid receptor antagonists; PINNICLE HF = Practice Innovation and Clinical Excellence Registry; QUALIFY = Quality of Adherence to Guideline Recommendations for Life-Saving Treatment in Heart Failure Survey; SGLT2i = Sodium-Glucose Cotransporter 2 Inhibitors
Savarese G, Kishi T, Vardeny 0, Adamsson Eryd S, Bodegard J, Lund LH, et al. Heart Failure Drug Treatment-lnertia,Titration, and Discontinuation: A Multinational Observational Study (EVOLUTION HF). JACC Heart Fail. 2023 Jan;11(1):1–14.
Brownell NK, Ziaeian B, Fonarow GC. The Gap to Fill: Rationale for Rapid Initiation and Optimal Titration of Comprehensive Disease-modifying Medical Therapy for Heart Failure with Reduced Ejection Fraction. Card Fail Rev. 2021 Mar;7:e18.
Despite the high prevalence of HF among Black and Hispanic populations, patients of color are frequently underprescribed GDMT.117,118 Clinical inertia, financial toxicity, under-representation of minoritized patients in clinical trials, nontrustworthy medical systems, bias and structural racism are contributing factors to expanding gaps in health inequity.117,119 Black and Hispanic patients are less likely to receive implantable cardioverter-defibrillators or cardiac resynchronization therapy than White patients.120,121 Diagnostic and therapeutic approaches for structural cardiac disease and valvular heart disease are also not equitable across different races, ethnicities, and sex.122
Similarly, although there have been increases in the use of advanced therapies including durable mechanical circulatory support and cardiac transplantation (Fig. 42), and other recommended therapies such as structural interventions (eg, transcatheter edge to edge mitral valve repair in HF patients with severe mitral regurgitation, transcatheter aortic valve replacement in HF patients with aortic stenosis, or percutaneous mechanical circulatory support in refractory shock), the use of these therapies in indicated patients remains low.
Fig. 42.
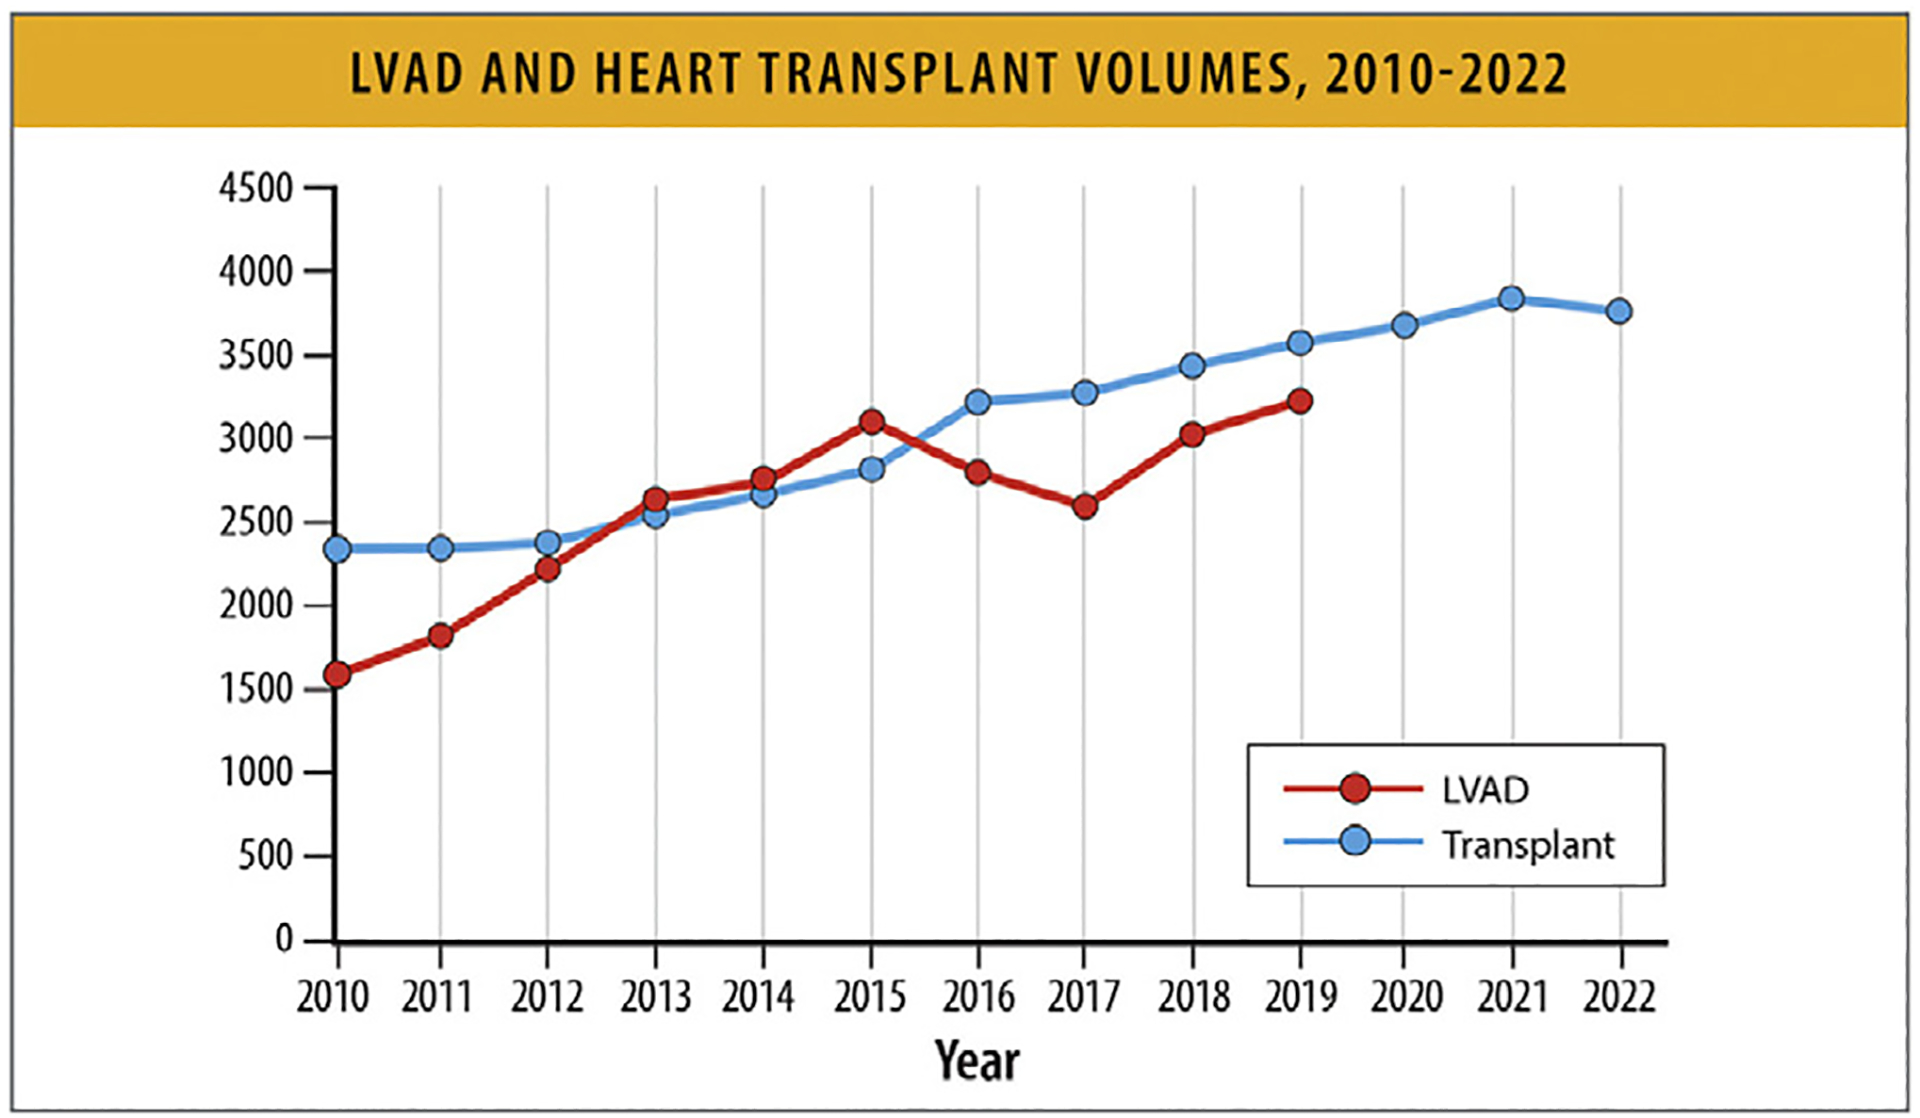
LVAD and heart transplant volumes, 2010–2022. LVAD = left ventricular assist device. Modified from Molina EJ, Shah P, Kiernan MS, Cornwell WK, Copeland H, Takeda K, et al. The Society of Thoracic Surgeons INTERMACS 2020 annual report. Ann Thorac Surg 2021;111:778–92; and Organ Procurement and Transplantation Network. National Data - Heart Transplant. [cited 2023 Jul 9]. Available from: https://optn.transplant.hrsa.gov/data/view-data-reports/national-data/#
There are significant disparities and health inequities in access to and use of these advanced therapies. Women, Black, and Hispanic patients have lower rates of use of advanced therapies despite evidence of indications and benefit. For example, referrals for heart transplantation are not equitable by race and ethnicity. Black individuals are receiving heart transplants at rates that are disproportionately lower than patients of other racial groups, particularly in the context of their higher mortality rate from HF. The overall ratio of receipt of heart transplant compared with HF mortality rate is lower in Black vs White populations and similar in Hispanic vs White populations.123 Among states most populated with Black and Hispanic residents, the ratio of receipt of heart transplant compared with HF mortality is lower for Black vs White populations and Hispanic vs White populations.123
9. Top Line Cost
In 2013, the AHA estimated that more than 8 million Americans will have HF by 2030, with direct HF medical costs of $53 billion, indirect HF costs of $70 billion, and total cardiovascular care direct costs of $160 billion (2010 dollars).15 The greatest source of the growth in expenditures for HF relate to shifting demographics and an aging national population. As of 2016, an estimated 6.2 million Americans have HF based on self-reported survey data, which is known to underestimate the true prevalence (sensitivity 28%–38%). Based on this HF prevalence, it was recently estimated that in 2018, incremental national expenditure for HF totaled $22.3 billion and total annual expenditures for patients with HF was $179.5 billion (2018 dollars) (Fig. 43).124–126 Perpatient, the incremental adjusted annual medical costs for HF are $3594 and total costs are $32,955, with the greatest costs attributable to hospitalizations.
Fig. 43.
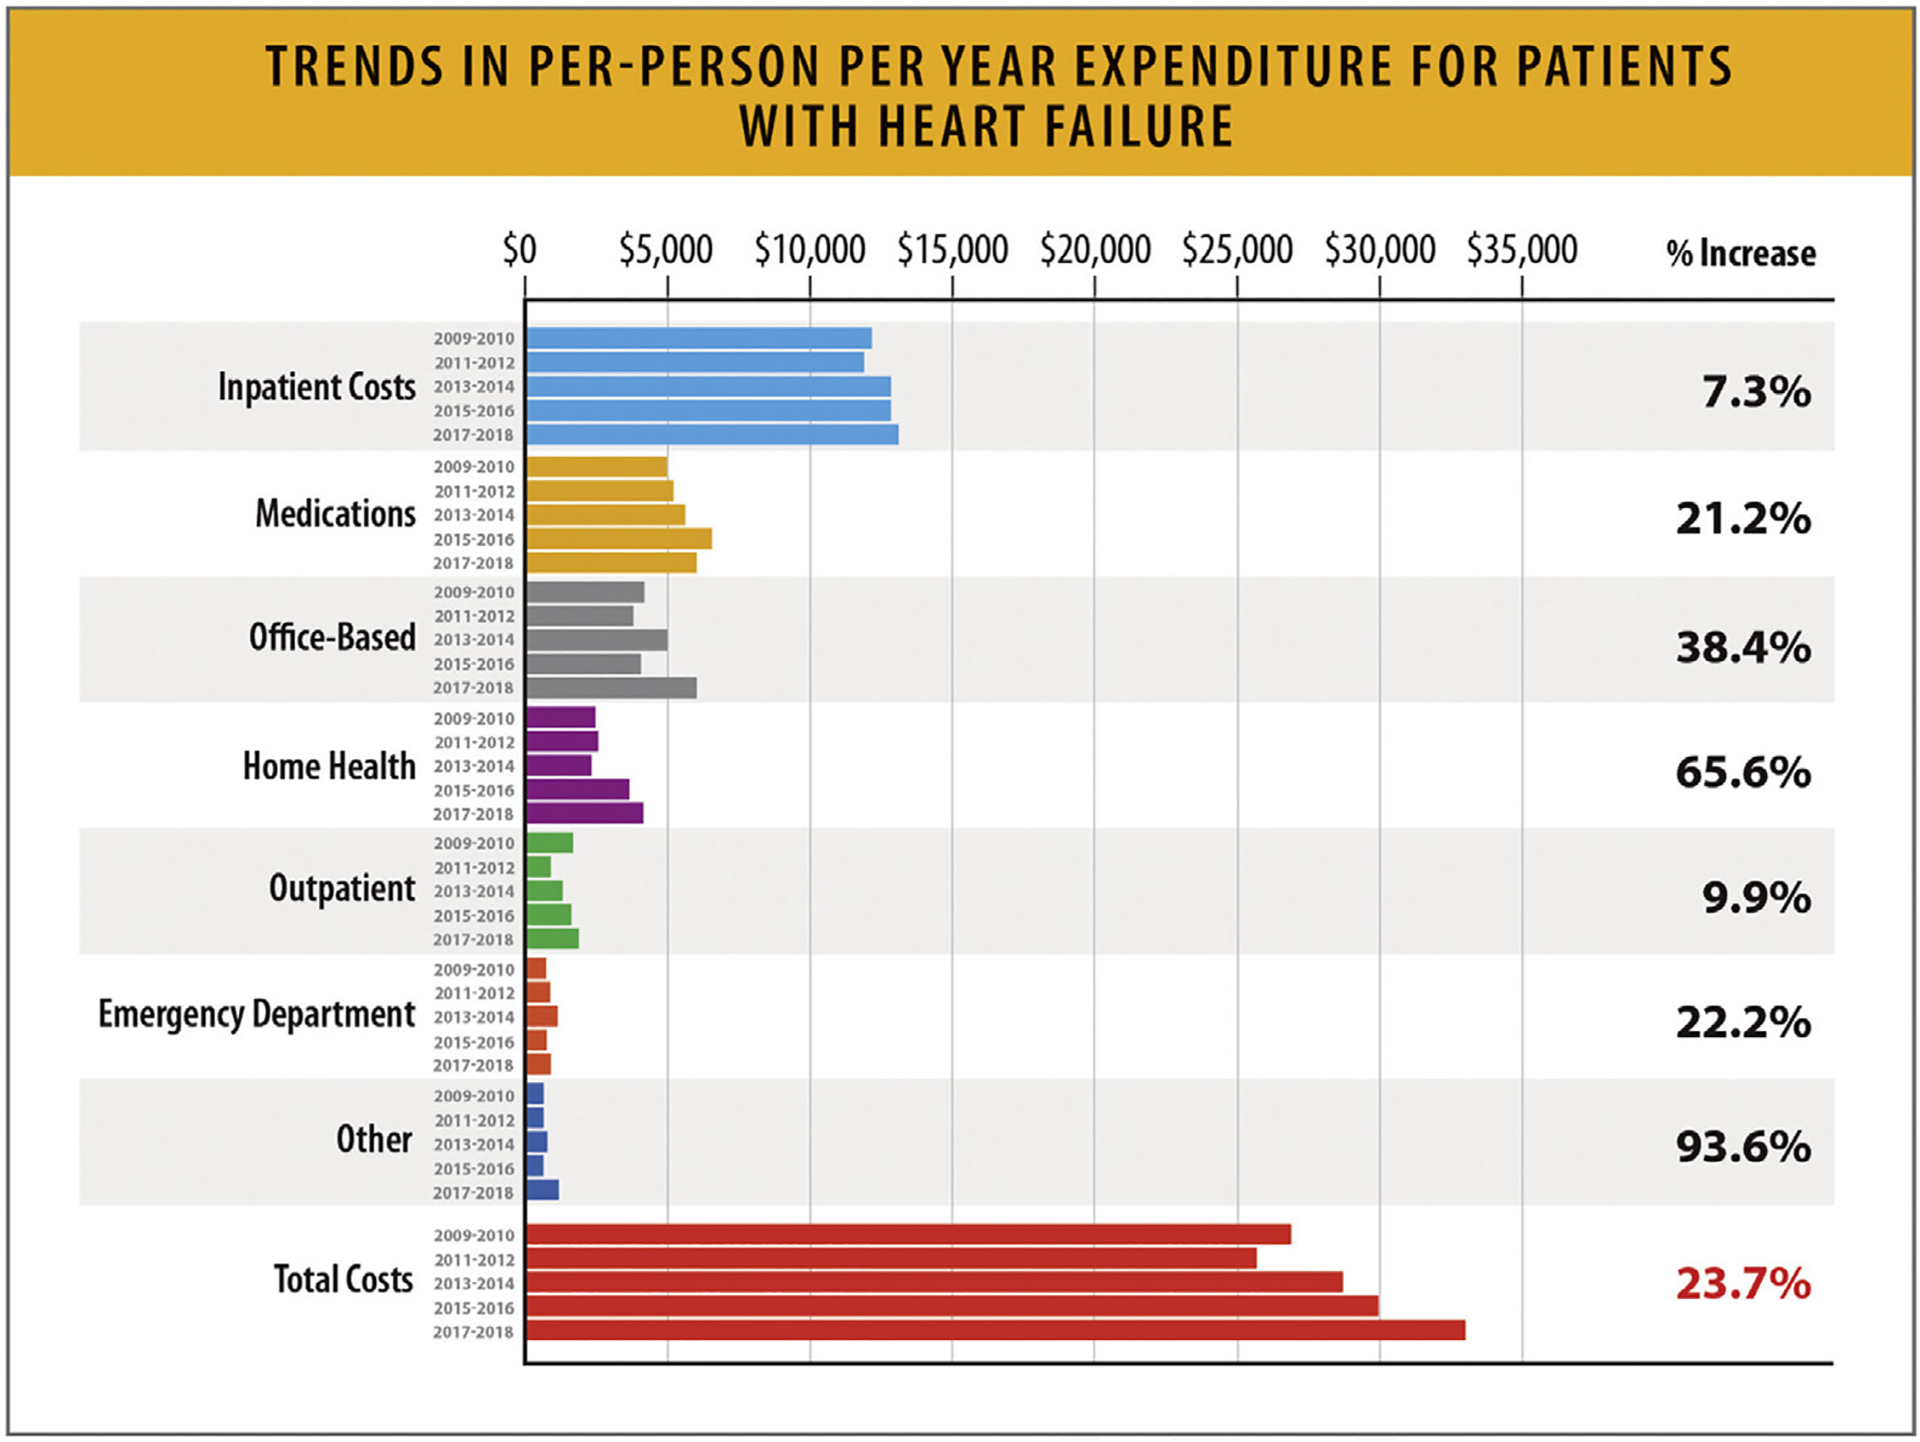
Trends in per-person per year expenditure for patients with HF. HF = heart failure. Modified from Bhatnagar R, Fonarow GC, Heidenreich PA, Ziaeian B. Expenditure on heart failure in the United States: the Medical Expenditure Panel Survey 2009–2018. JACC Heart Fail 2022;10:571–80.
Current research on the epidemiology of HF and the costs associated with HF are limited. Prevalence is estimated from limited samples and self-reported history using NHANES. Self-reported history lacks appropriate categorization into the clinical phenotypes of HF (i.e., HFrEF, HFmrEF, HFpEF, and heart failure with mildly improved ejection fraction).127 Mortality associated with HF is obscured by death certificate coding practices that consider HF a garbage code never attributable to death.128 Therefore, economic costs related to premature HF death cannot be estimated. Various insurance systems in the US make the estimation of outpatient expenditures challenging. The Medical Expenditure Panel Survey is the standard all-payer database for estimating costs, but samples of representative HF patients are small, and detection of shifts in spending year-to-year is difficult (Fig. 43).
10. Summary, Gaps, and Future Directions
This document provides a high-level review and interpretation of the existing data and evidence on the epidemiology and outcomes of HF published to.
Although HF is associated with a significant health burden and is associated with adverse outcomes; large-scale population-based registries and outcome studies specifically targeting detection of populations at-risk for HF, pre-HF, HF, or advanced HF; specific etiologies of HF and cardiomyopathies; EF subgroups; according to race/ethnicity, sex, gender, geography, SDoH, and structural inequity are lacking.
Existing data and population cohorts do not provide continuous information over time; as such, the authors have examined trends across multiple descriptive studies to be able to provide their high-level interpretation of changes over time. The authors recognize that the existing cohorts represent specific patient populations, and trends may be specific to particular geographic and age groups and may not be generalizable to other populations.
The role of biomarkers, molecular markers, imaging, and genetic profiling is rapidly evolving, and will likely be incorporated at a greater scale in HF care for risk detection, diagnosis, determination of specific etiology, prognosis, and outcomes in HF. Therefore, the epidemiology of HF is likely to change as our ability to detect risk and mal-adaptive pathways evolve. Furthermore, as the risk factors for HF, such as diabetes, metabolic syndrome, obesity, and exposure to cardiotoxicity increase, the burden of HF will likely continue to increase.
Despite expansion of GDMT, the mortality rates and rehospitalization rates for HF remain high. Disparities and structural barriers widen the health inequity gap.
It is important to also recognize that existing coding guidelines fail to recognize HF as an underlying cause of death, but rather as a mediator between death and disease, requiring death attributable to other conditions (e.g., CHD, hypertension, cardiomyopathy). HF mortality is often redistributed to these causes and is therefore under-detected. It is critical to recognize that the current data reflect significant under-reporting of deaths are attributable to HF.
These considerations underline the necessity of large-scale registries and research studies specifically addressing HF epidemiology, risk factors, and outcomes, and the importance of capturing HF as a primary underlying cause of death.
Supplementary Material
Summary of Top 10 Key Points.
Approximately 6.7 million Americans over 20 years of age have heart failure (HF), and the prevalence is expected to rise to 8.5 million Americans by 2030.
The lifetime risk of HF has increased to 24%; approximately 1 in 4 persons will develop HF in their lifetime.
Approximately 33% of the United States (US) adult population is at-risk for HF (Stage A HF) and 24–34% of the US population have pre-HF (Stage B HF). The risk of developing HF in individuals with obesity and hypertension has increased.
The incidence and prevalence of HF is higher among Black individuals compared with other racial and ethnic groups. The prevalence of HF has increased among Black and Hispanic individuals over time.
HF mortality rates have been increasing since 2012.
Black, American Indian, and Alaska Native individuals have the highest all-cause age-adjusted HF mortality rates compared with other racial and ethnic groups. From 2010 to 2020, HF mortality rates have increased for Black women and men at a rate higher than any other racial or ethnic groups, particularly for individuals below the age of 65.
A greater relative annual increase in HF-related mortality rates has been noted for younger (35–64 years) compared with older (65–84 years) adults.
Highest HF death rates have been reported in the Midwest, Southeast, and Southern states. Rural areas demonstrate higher HF mortality rates for both younger and older age groups compared with urban areas.
Rates of HF hospitalizations have increased from 2014 to 2017. This increase was consistent between age groups and sexes, with the highest rates being among Black patients.
Disparities in social determinants of health and health inequities are important HF risk factors and result in increased mortality and other adverse outcomes in individuals at risk for HF or with HF.
Abbreviations:
- AAMR
age-adjusted mortality rates
- ACC
American College of Cardiology
- AHA
American Heart Association
- ARIC
Atherosclerosis Risk in Communities
- CDC
Centers for Disease Control and Prevention
- CHA
Chicago Heart Association
- CHD
cor- onary heart disease
- CHS
Cardiovascular Health Study
- CI
confidence interval
- COVID-19
coronavirus disease 2019
- EF
ejec- tion fraction
- FHS
Framingham Heart Study
- GBD
Global Burden of Disease
- GDMT
guideline-directed medical therapy
- GWTG
Get With The Guidelines
- HF
heart failure
- HFA
Heart Failure Association
- HFSA
Heart Failure Society of America
- HFmrEF
heart failure with mildly reduced ejection fraction
- HFpEF
heart failure with preserved ejection fraction
- HFrEF
heart failure with reduced ejection fraction
- ICD
International Classification of Diseases
- IQR
interquartile range
- MESA
Multi-Ethnic Study of Atherosclerosis
- NCHS
National Center for Health Statistics
- NHANES
National Health and Nutrition Examination Survey
- NIS
National Inpatient Sample
- NRD
Nationwide Readmission Database
- NVSS
National Vital Statistics System
- PAR
population attributable risk
- PY
per- son-years
- SDoH
social determinants of health
- UI
uncertainty interval
- US
United States
- WONDER
Wide-ranging Online Data for Epidemiologic Research
References
- 1.Vasan RS, Enserro DM, Beiser AS, Xanthakis V. Lifetime risk of heart failure among participants in the Framingham Study. J Am Coll Cardiol 2022;79:250–63. [DOI] [PMC free article] [PubMed] [Google Scholar]
- 2.Pandey A, Omar W, Ayers C, LaMonte M, Klein L, Allen NB, et al. Sex and race differences in lifetime risk of heart failure with preserved ejection fraction and heart failure with reduced ejection fraction. Circulation 2018;137:1814–23. [DOI] [PMC free article] [PubMed] [Google Scholar]
- 3.Chang PP, Wruck LM, Shahar E, Rossi JS, Loehr LR, Russell SD, et al. Trends in hospitalizations and survival of acute decompensated heart failure in four US communities (2005–2014). ARIC Study Community Surveillance. Circulation 2018;138:12–24. [DOI] [PMC free article] [PubMed] [Google Scholar]
- 4.Glynn PA, Ning H, Bavishi A, Freaney PM, Shah S, Yancy CW, et al. Heart failure risk distribution and trends in the United States population, NHANES 1999–2016. Am J Med 2021;134:e153–64. [DOI] [PMC free article] [PubMed] [Google Scholar]
- 5.Khera R, Kondamudi N, Zhong L, Vaduganathan M, Parker J, Das SR, et al. Temporal trends in heart failure incidence among Medicare beneficiaries across risk factor strata, 2011 to 2016. JAMA Netw Open 2020;3:e2022190. [DOI] [PMC free article] [PubMed] [Google Scholar]
- 6.Gerber Y, Weston SA, Redfield MM, Chamberlain AM, Manemann SM, Jiang R, et al. A contemporary appraisal of the heart failure epidemic in Olmsted County, Minnesota, 2000 to 2010. JAMA Intern Med 2015;175:996–1004. [DOI] [PMC free article] [PubMed] [Google Scholar]
- 7.Tsao CW, Lyass A, Enserro D, Larson MG, Ho JE, Kizer JR, et al. Temporal trends in the incidence and mortality associated with heart failure with preserved and reduced ejection fraction. JACC Heart Fail 2018;6:678–85. [DOI] [PMC free article] [PubMed] [Google Scholar]
- 8.Rosamond WD, Chang PP, Baggett C, Johnson A, Bertoni AG, Shahar E, et al. Classification of heart failure in The Atherosclerosis Risk in Communities (ARIC) study: a comparison of diagnostic criteria. Circ Heart Fail 2012;5:152–9. [DOI] [PMC free article] [PubMed] [Google Scholar]
- 9.Huffman MD, Berry JD, Ning H, Dyer AR, Garside DB, Cai X, et al. Lifetime risk for heart failure among White and Black Americans: cardiovascular lifetime risk pooling project. J Am Coll Cardiol 2013;61:1510–7. [DOI] [PMC free article] [PubMed] [Google Scholar]
- 10.Siontis GC, Bhatt DL, Patel CJ. Secular trends in prevalence of heart failure diagnosis over 20 years (from the US NHANES). Am J Cardiol 2022;172:161–4. [DOI] [PMC free article] [PubMed] [Google Scholar]
- 11.Rethy L, Petito LC, Vu THT, Kershaw K, Mehta R, Shah NS, et al. Trends in the prevalence of self-reported heart failure by race/ethnicity and age from 2001 to 2016. JAMA Cardiol 2020;5:1425–9. [DOI] [PMC free article] [PubMed] [Google Scholar]
- 12.Khera R, Pandey A, Ayers CR, Agusala V, Pruitt SL, Halm EA, et al. Contemporary epidemiology of heart failure in fee-for-service Medicare beneficiaries across healthcare settings. Circ Heart Fail 2017;10: e004402. [DOI] [PMC free article] [PubMed] [Google Scholar]
- 13.Breathett K, Sims M, Gross M, Jackson EA, Jones EJ, Navas-Acien A, et al. Cardiovascular health in American Indians and Alaska Natives: a scientific statement from the American Heart Association. Circulation 2020;141:e948–59. [DOI] [PMC free article] [PubMed] [Google Scholar]
- 14.Van Nuys KE, Xie Z, Tysinger B, Hlatky MA, Goldman DP. Innovation in heart failure treatment: life expectancy, disability, and health disparities. JACC Heart Fail 2018;6:401–9. [DOI] [PMC free article] [PubMed] [Google Scholar]
- 15.Heidenreich PA, Albert NM, Allen LA, Bluemke DA, Butler J, Fonarow GC, et al. Forecasting the impact of heart failure in the United States: a policy statement from the American Heart Association. Circ Heart Fail 2013;6:606–19. [DOI] [PMC free article] [PubMed] [Google Scholar]
- 16.Bozkurt B, Coats AJ, Tsutsui H, Abdelhamid M, Adamopoulos S, Albert N, et al. Universal definition and classification of heart failure: a report of the Heart Failure Society of America, Heart Failure Association of the European Society of Cardiology, Japanese Heart Failure Society and Writing Committee of the Universal Definition of Heart Failure. J Card Fail 2021. Mar 1;S1071-9164(21):00050–6. [DOI] [PubMed] [Google Scholar]
- 17.Writing Committee Members; ACC/AHA Joint Committee Members. . 2022 AHA/ACC/HFSA guideline for the management of heart failure. J Card Fail 2022;28. e1–e167. [DOI] [PubMed] [Google Scholar]
- 18.Gidding SS,Lloyd-Jones D, Lima J, Ambale-Venkatesh B, Shah SJ, Shah R, et al. Prevalence of American Heart Association Heart Failure stages in Black and White young and middle-aged adults: the CARDIA study. Circ Heart Fail 2019;12:e005730. [DOI] [PMC free article] [PubMed] [Google Scholar]
- 19.Xanthakis V, Enserro DM, Larson MG, Wollert KC, Januzzi JL, Levy D, et al. Prevalence, neurohormonal correlates, and prognosis of heart failure stages in the community. JACC Heart Fail 2016;4:808–15. [DOI] [PMC free article] [PubMed] [Google Scholar]
- 20.Ammar KA, Jacobsen SJ, Mahoney DW, Kors JA, Redfield MM, Burnett JC, et al. prevalence and prognostic significance of heart failure stages: application of the American College of Cardiology/American Heart Association Heart Failure Staging Criteria in The Community. Circulation 2007;115:1563–70. [DOI] [PubMed] [Google Scholar]
- 21.Shah AM, Claggett B, Loehr LR, Chang PP, Matsushita K, Kitzman D, et al. Heart failure stages among older adults in the community: the Atherosclerosis Risk in Communities study. Circulation 2017;135:224–40. [DOI] [PMC free article] [PubMed] [Google Scholar]
- 22.Jia X, Al Rifai M, Ndumele CE, Virani SS, de Lemos JA, Lee E, et al. Reclassification of pre-heart failure stages using cardiac biomarkers: the ARIC study. JACC Heart Fail 2023;11:440–50. [DOI] [PMC free article] [PubMed] [Google Scholar]
- 23.Vasan RS, Musani SK, Matsushita K, Beard W, Obafemi OB, Butler KR, et al. Epidemiology of heart failure stages in middle-aged Black people in the community: prevalence and prognosis in the Atherosclerosis Risk in Communities Study. J Am Heart Assoc 2021;10:e016524. [DOI] [PMC free article] [PubMed] [Google Scholar]
- 24.Mohebi R, Wang D, Lau ES, Parekh JK, Allen N, Psaty BM, et al. Effect of 2022 ACC/AHA/HFSA criteria on stages of heart failure in a pooled community cohort. J Am Coll Cardiol 2023;81:2231–42. [DOI] [PMC free article] [PubMed] [Google Scholar]
- 25.Conrad N, Judge A, Tran J, Mohseni H, Hedgecott D, Crespillo AP, et al. Temporal trends and patterns in heart failure incidence: a population-based study of 4 million individuals. Lancet 2018;391:572–80. [DOI] [PMC free article] [PubMed] [Google Scholar]
- 26.Kovell LC, Juraschek SP, Russell SD. Stage A heart failure is not adequately recognized in US Adults: analysis of the National Health and Nutrition Examination Surveys, 2007–2010. PLoS One 2015;10:e0132228. [DOI] [PMC free article] [PubMed] [Google Scholar]
- 27.Breathett K, Leng I, Foraker RE, Abraham WT, Coker L, Whitfield KE, et al. Risk factor burden, heart failure, and survival in women of different ethnic groups: insights from the Women’s Health Initiative. Circ Heart Fail 2018;11:e004642. [DOI] [PMC free article] [PubMed] [Google Scholar]
- 28.Dunlay SM, Weston SA, Jacobsen SJ, Roger VL. Risk factors for heart failure: a population-based case-control study. Am J Med 2009;122:1023–8. [DOI] [PMC free article] [PubMed] [Google Scholar]
- 29.Yeh RW, Sidney S, Chandra M, Sorel M, Selby JV, Go AS. Population trends in the incidence and outcomes of acute myocardial infarction. N Engl J Med 2010;362:2155–65. [DOI] [PubMed] [Google Scholar]
- 30.Gerber Y, Weston SA, Enriquez-Sarano M, Manemann SM, Chamberlain AM, Jiang R, et al. Athero-sclerotic burden and heart failure after myocardial infarction. JAMA Cardiol 2016;1:156–62. [DOI] [PMC free article] [PubMed] [Google Scholar]
- 31.Eaton CB, Pettinger M, Rossouw J, Martin LW, Foraker R, Quddus A, et al. Risk factors for incident hospitalized heart failure with preserved versus reduced ejection fraction in a multiracial cohort of postmenopausal women. Circ Heart Fail 2016;9:e002883. [DOI] [PMC free article] [PubMed] [Google Scholar]
- 32.Cheng S, Claggett B, Correia AW, Shah AM, Gupta DK, Skali H, et al. Temporal trends in the population attributable risk for cardiovascular disease: the Atherosclerosis Risk in Communities Study. Circulation 2014;130:820–8. [DOI] [PMC free article] [PubMed] [Google Scholar]
- 33.GBD 2019 Diseases and Injuries Collaborators. Global burden of 369 diseases and injuries in 204 countries and territories, 1990–2019: a systematic analysis for the Global Burden of Disease Study 2019. Lancet 2020;396:1204–22. [DOI] [PMC free article] [PubMed] [Google Scholar]
- 34.Savarese G, Becher PM, Lund LH, Seferovic P, Rosano GMC, Coats AJS. Global burden of heart failure: a comprehensive and updated review of epidemiology. Cardiovasc Res 2023;118:3272–87. [DOI] [PubMed] [Google Scholar]
- 35.Groenewegen A, Rutten FH, Mosterd A, Hoes AW. Epidemiology of heart failure. Eur J Heart Fail 2020;22:1342–56. [DOI] [PMC free article] [PubMed] [Google Scholar]
- 36.Christiansen MN, Køber L, Weeke P, Vasan RS, Jeppesen JL, Smith JG, et al. Age-specific trends in incidence, mortality, and comorbidities of heart failure in Denmark, 1995 to 2012. Circulation 2017;135:1214–23. [DOI] [PubMed] [Google Scholar]
- 37.Chioncel O, Lainscak M, Seferovic PM, Anker SD, Crespo-Leiro MG, Harjola VP, et al. Epidemiology and one-year outcomes in patients with chronic heart failure and preserved, mid-range and reduced ejection fraction: an analysis of the ESC Heart Failure Long-Term Registry. Eur J Heart Fail 2017;19:1574–85. [DOI] [PubMed] [Google Scholar]
- 38.Joseph P, Dokainish H, McCready T, Budaj A, Roy A, Ertl G, et al. A multinational registry to study the characteristics and outcomes of heart failure patients: the Global Congestive Heart Failure (G-CHF) registry. Am Heart J 2020;227:56–63. [DOI] [PubMed] [Google Scholar]
- 39.MacDonald MR, Tay WT, Teng THK, Anand I, Ling LH, Yap J, et al. Regional variation of mortality in heart failure with reduced and preserved ejection fraction across Asia: outcomes in the ASIAN-HF registry. J Am Heart Assoc 2020;9:e012199. [DOI] [PMC free article] [PubMed] [Google Scholar]
- 40.Shiga T, Suzuki A, Haruta S, Mori F, Ota Y, Yagi M, et al. Clinical characteristics of hospitalized heart failure patients with preserved, mid-range, and reduced ejection fractions in Japan. ESC Heart Fail 2019;6:475–86. [DOI] [PMC free article] [PubMed] [Google Scholar]
- 41.Hao G, Wang X, Chen Z, Zhang L, Zhang Y, Wei B, et al. Prevalence of heart failure and left ventricular dysfunction in China: the China Hypertension Survey, 2012–2015. Eur J Heart Fail 2019;21:1329–37. [DOI] [PubMed] [Google Scholar]
- 42.Ho JE, Enserro D, Brouwers FP, Kizer JR, Shah SJ, Psaty BM, et al. Predicting Heart failure with preserved and reduced ejection fraction: the International Collaboration on Heart Failure Subtypes. Circ Heart Fail 2016;9:e003116. 10.1161/CIRCHEARTFAILURE.115.003116. [DOI] [PMC free article] [PubMed] [Google Scholar]
- 43.Dunlay SM, Gerber Y, Weston SA, Killian JM, Redfield MM, Roger VL. Prognostic value of biomarkers in heart failure: application of novel methods in the community. Circ Heart Fail 2009;2:393–400. [DOI] [PMC free article] [PubMed] [Google Scholar]
- 44.Djoussé L, Driver JA, Gaziano JM. Relation between modifiable lifestyle factors and lifetime risk of heart failure. JAMA 2009;302:394–400. [DOI] [PMC free article] [PubMed] [Google Scholar]
- 45.Folsom AR, Shah AM, Lutsey PL, Roetker NS, Alonso A, Avery CL, et al. American Heart Association’s Life’s Simple 7: avoiding heart failure and preserving cardiac structure and function. Am J Med 2015;128:970–976.e2. [DOI] [PMC free article] [PubMed] [Google Scholar]
- 46.Banerjee A, Pasea L, Chung SC, Direk K, Asselbergs FW, Grobbee DE, et al. A population-based study of 92 clinically recognized risk factors for heart failure: co-occurrence, prognosis and preventive potential. Eur J Heart Fail 2022;24:466–80. [DOI] [PMC free article] [PubMed] [Google Scholar]
- 47.Khatibzadeh S, Farzadfar F, Oliver J, Ezzati M, Moran A. Worldwide Risk Factors for Heart Failure: A Systematic Review and Pooled Analysis. Int J Cardiol 2013;168:1186–94. [DOI] [PMC free article] [PubMed] [Google Scholar]
- 48.Karaye KM, Dokainish H, ElSayed A, Mondo C, Damasceno A, Sliwa K, et al. Clinical profiles and outcomes of heart failure in five African countries: results from INTER-CHF study. Glob Heart 2021;16:50. [DOI] [PMC free article] [PubMed] [Google Scholar]
- 49.Kalogeropoulos A, Georgiopoulou V, Kritchevsky SB, Psaty BM, Smith NL, Newman AB, et al. Epidemiology of incident heart failure in a contemporary elderly cohort: the Health, Aging, And Body Composition Study. Arch Intern Med 2009;169:708–15. [DOI] [PMC free article] [PubMed] [Google Scholar]
- 50.Chamberlain AM, Boyd CM, Manemann SM, Dunlay SM, Gerber Y, Killian JM, et al. Risk factors for heart failure in the community: differences by age and ejection fraction. Am J Med 2020;133. e237–48. [DOI] [PMC free article] [PubMed] [Google Scholar]
- 51.Chow SL, Maisel AS, Anand I, Bozkurt B, de Boer RA, Felker GM, et al. Role of biomarkers for the prevention, assessment, and management of heart failure: a scientific statement from the American Heart Association. Circulation 2017;135:e1054–91. [DOI] [PubMed] [Google Scholar]
- 52.Povysil G, Chazara O, Carss KJ, Deevi SVV, Wang Q, Armisen J, et al. Assessing the role of rare genetic variation in patients with heart failure. JAMA Cardiol 2021;6:379–86. [DOI] [PMC free article] [PubMed] [Google Scholar]
- 53.Michelhaugh SA, Camacho A, Ibrahim NE, Gaggin H, D’Alessandro D, Coglianese E, et al. Proteomic signatures during treatment in different stages of heart failure. Circ Heart Fail 2020;13:e006794. [DOI] [PubMed] [Google Scholar]
- 54.White-Williams C, Rossi LP, Bittner VA, Driscoll A, Durant RW, Granger BB, et al. Addressing social determinants of health in the care of patients with heart failure: a scientific statement from the American Heart Association. Circulation 2020;141: e841–63. [DOI] [PubMed] [Google Scholar]
- 55.Vinter N, Fawzy AM, Gent D, Ding WY, Johnsen SP, Frost L, et al. Social determinants of health and cardiovascular outcomes in patients with heart failure. Eur J Clin Invest 2022;52:e13843. [DOI] [PMC free article] [PubMed] [Google Scholar]
- 56.Shirey TE, Hu Y, Ko YA, Nayak A, Udeshi E, Patel S, et al. Relation of neighborhood disadvantage to heart failure symptoms and hospitalizations. Am J Cardiol 2021;140:83–90. [DOI] [PMC free article] [PubMed] [Google Scholar]
- 57.Mujahid MS, Gao X, Tabb LP, Morris C, Lewis TT. Historical redlining and cardiovascular health: the multi-ethnic study of atherosclerosis. Proc Natl Acad Sci U S A 2021;118:e2110986118. [DOI] [PMC free article] [PubMed] [Google Scholar]
- 58.Wang N, Hales S, Barin E, Tofler G. Characteristics and outcome for heart failure patients with mid-range ejection fraction. J Cardiovasc Med (Hagers-town) 2018;19:297–303. [DOI] [PubMed] [Google Scholar]
- 59.Piña IL, Jimenez S, Lewis EF, Morris AA, Onwuanyi A, Tam E, et al. Race and ethnicity in heart failure: JACC focus seminar 8/9. J Am Coll Cardiol 2021;78:2589–98. [DOI] [PubMed] [Google Scholar]
- 60.Akwo EA, Kabagambe EK, Wang TJ, Harrell FE, Blot WJ, Mumma M, et al. Heart failure incidence and mortality in the Southern Community Cohort Study. Circ Heart Fail 2017;10:e003553. [DOI] [PMC free article] [PubMed] [Google Scholar]
- 61.Powell-Wiley TM, Baumer Y, Baah FO, Baez AS, Farmer N, Mahlobo CT, et al. Social determinants of cardiovascular disease. Circ Res 2022;130:782–99. [DOI] [PMC free article] [PubMed] [Google Scholar]
- 62.Sistrunk C, Tolbert N, Sanchez-Pino MD, Erhunmwunsee L, Wright N, Jones V, et al. Impact of federal, state, and local housing policies on disparities in cardiovascular disease in Black/African American men and women: from policy to pathways to biology. . Front Cardiovasc Med 2022;9:756734. [DOI] [PMC free article] [PubMed] [Google Scholar]
- 63.Lippi G, Sanchis-Gomar F. Global epidemiology and future trends of heart failure. AME Med J 2020. [cited 2023 Jul 9];5. Available from: https://amj.amegroups.org/article/view/5475. [Google Scholar]
- 64.Centers for Disease Control and Prevention National Center for Health Statistics. Centers for Disease Control and Prevention. 2023. [cited 2023 Feb 2]. National Health and Nutrition Examination Survey (NHANES) Public Use Data Files. Available from: https://www.cdc.gov/nchs/nhanes/index.htm
- 65.Bragazzi NL, Zhong W, Shu J, Abu Much A, Lotan D, Grupper A, et al. Burden of heart failure and underlying causes in 195 countries and territories from 1990 to 2017. Eur J Prev Cardiol 2021;28:1682–90. [DOI] [PubMed] [Google Scholar]
- 66.Suthahar N, Lau ES, Blaha MJ, Paniagua SM, Larson MG, Psaty BM, et al. Sex-specific associations of cardiovascular risk factors and biomarkers with incident heart failure. J Am Coll Cardiol 2020;76:1455–65. [DOI] [PMC free article] [PubMed] [Google Scholar]
- 67.Lee DS, Gona P, Albano I, Larson MG, Benjamin EJ, Levy D, et al. A systematic assessment of causes of death after heart failure onset in the community: impact of age at death, time period, and left ventricular systolic dysfunction. Circ Heart Fail 2011;4:36–43. [DOI] [PMC free article] [PubMed] [Google Scholar]
- 68.Tsao CW, Aday AW, Almarzooq ZI, Anderson CAM, Arora P, Avery CL, et al. Heart disease and stroke statistics-2023 update: A report from the American Heart Association. . Circulation 2023;147:e93–e621. [DOI] [PMC free article] [PubMed] [Google Scholar]
- 69.Jain V, Minhas AMK, Morris AA, Greene SJ, Pandey A, Khan SS, et al. Demographic and regional trends of heart failure-related mortality in young adults in the US, 1999–2019. JAMA Cardiol 2022;7:900–4. [DOI] [PMC free article] [PubMed] [Google Scholar]
- 70.Centers for Disease Control and Prevention. Wide-ranging Online Data for Epidemiologic Research (WONDER). [cited 2023 Jul 9]. Available from: https://wonder.cdc.gov/
- 71.Glynn P, Lloyd-Jones DM, Feinstein MJ, Carnethon M, Khan SS. Disparities in cardiovascular mortality related to heart failure in the United States. J Am Coll Cardiol 2019;73:2354–5. [DOI] [PubMed] [Google Scholar]
- 72.Siddiqi TJ, Khan Minhas AM, Greene SJ, Van Spall HGC, Khan SS, Pandey A, et al. Trends in heart failure-related mortality among older adults in the United States from 1999–2019. JACC Heart Fail 2022;10:851–9. [DOI] [PubMed] [Google Scholar]
- 73.Tromp J, Beusekamp JC, Ouwerkerk W, van der Meer P, Cleland JGF, Angermann CE, et al. Regional differences in precipitating factors of hospitalization for acute heart failure: insights from the REPORT-HF registry. Eur J Heart Fail 2022;24:645–52. [DOI] [PMC free article] [PubMed] [Google Scholar]
- 74.Dokainish H, Teo K, Zhu J, Roy A, AlHabib KF, ElSayed A, et al. Global mortality variations in patients with heart failure: results from the International Congestive Heart Failure (INTER-CHF) prospective cohort study. Lancet Glob Health 2017;5:e665–72. [DOI] [PubMed] [Google Scholar]
- 75.Investigators G-CHF, Joseph P, Roy A, Lonn E, Störk S, Floras J, et al. Global variations in heart failure etiology, management, and outcomes. JAMA 2023;329:1650–61. [DOI] [PMC free article] [PubMed] [Google Scholar]
- 76.Chen J, Normand SLT, Wang Y, Krumholz HM. National and regional trends in heart failure hospitalization and mortality rates for Medicare beneficiaries, 1998–2008. JAMA 2011;306:1669–78. [DOI] [PMC free article] [PubMed] [Google Scholar]
- 77.Centers for Disease Control and Prevention and National Center for Health Statistics. National Vital Statistics System: public use data file documentation: mortality multiple cause-of-death micro-data files, 2017. 2022. [cited 2023 Feb 2]. Available from: https://www.cdc.gov/nchs/nvss/mortality_public_use_data.htm
- 78.Bhatt AS, Jering KS, Vaduganathan M, Claggett BL, Cunningham JW, Rosenthal N, et al. Clinical outcomes in patients with heart failure hospitalized with COVID-19. JACC Heart Fail 2021;9:65–73. [DOI] [PMC free article] [PubMed] [Google Scholar]
- 79.Institute for Health Metrics and Evaluation. Global Burden of Disease study. 2020. [cited 2023 Jul 9]. Cardiomyopathy and myocarditis — Level 3 cause. Available from: https://www.healthdata.org/results/gbd_summaries/2019/cardiomyopathy-and-myocarditis-level-3-cause [Google Scholar]
- 80.Centers for Disease Control and Prevention. CDC WONDER. [cited 2023 Jul 9]. Underlying cause of deaths, 1999–2020. Available from: https://wonder.cdc.gov/Deaths-by-Underlying-Cause.html [Google Scholar]
- 81.Pierce JB, Shah NS, Petito LC, Pool L, Lloyd-Jones DM, Feinglass J, et al. Trends in heart failure-related cardiovascular mortality in rural versus urban United States counties, 2011–2018: a cross-sectional study. PLoS One 2021;16:e0246813. [DOI] [PMC free article] [PubMed] [Google Scholar]
- 82.Centers for Disease Control and Prevention National Center for Health Statistics. CDC WONDER. [cited 2023 Jul 9]. Multiple Cause of Death 1999–2020. Available from: https://wonder.cdc.gov/wonder/help/mcd.html [Google Scholar]
- 83.Hsich EM, Grau-Sepulveda MV, Hernandez AF, Peterson ED, Schwamm LH, Bhatt DL, et al. Sex differences in in-hospital mortality in acute decompensated heart failure with reduced and preserved ejection fraction. Am Heart J 2012;163:430–7. 437.e1–3. [DOI] [PubMed] [Google Scholar]
- 84.Hsich EM, Blackstone EH, Thuita LW, McNamara DM, Rogers JG, Yancy CW, et al. Heart transplantation: an in-depth survival analysis. JACC Heart Fail 2020;8:557–68. [DOI] [PMC free article] [PubMed] [Google Scholar]
- 85.Ni H, Xu J. Recent trends in heart failure-related mortality: United States, 2000–2014. NCHS Data Brief 2015:1–8. [PubMed] [Google Scholar]
- 86.Vasan RS, Zuo Y, Kalesan B. Divergent temporal trends in morbidity and mortality related to heart failure and atrial fibrillation: age, sex, race, and geographic differences in the United States, 1991–2015. J Am Heart Assoc 2019;8:e010756. [DOI] [PMC free article] [PubMed] [Google Scholar]
- 87.Meta-analysis Global Group in Chronic Heart Failure (MAGGIC). The survival of patients with heart failure with preserved or reduced left ventricular ejection fraction: an individual patient data meta-analysis. Eur Heart J 2012;33:1750–7. [DOI] [PubMed] [Google Scholar]
- 88.Clark KAA, Reinhardt SW, Chouairi F, Miller PE, Kay B, Fuery M, et al. Trends in heart failure hospitalizations in the US from 2008 to 2018. J Card Fail 2022;28:171–80. [DOI] [PubMed] [Google Scholar]
- 89.Shah KS, Xu H, Matsouaka RA, Bhatt DL, Heidenreich PA, Hernandez AF, et al. Heart failure with preserved, borderline, and reduced ejection fraction: 5-year outcomes. J Am Coll Cardiol 2017;70:2476–86. [DOI] [PubMed] [Google Scholar]
- 90.Agarwal MA, Fonarow GC, Ziaeian B. National trends in heart failure hospitalizations and readmissions from 2010 to 2017. JAMA Cardiol 2021;6:952–6. [DOI] [PMC free article] [PubMed] [Google Scholar]
- 91.Salah HM, Minhas AMK, Khan MS, Khan SU, Ambrosy AP, Blumer V, et al. Trends and characteristics of hospitalizations for heart failure in the United States from 2004 to 2018. ESC Heart Fail 2022;9:947–52. [DOI] [PMC free article] [PubMed] [Google Scholar]
- 92.Jain V, Minhas AMK, Khan SU, Greene SJ, Pandey A, Van Spall HGC, et al. Trends in HF hospitalizations among young adults in the United States From 2004 to 2018. JACC Heart Fail 2022;10:350–62. [DOI] [PubMed] [Google Scholar]
- 93.Jackson SL, Tong X, King RJ, Loustalot F, Hong Y, Ritchey MD. National burden of heart failure events in the United States, 2006 to 2014. Circ Heart Fail 2018;11:e004873. [DOI] [PMC free article] [PubMed] [Google Scholar]
- 94.Savitz ST, Leong T, Sung SH, Lee K, Rana JS, Tabada G, et al. contemporary reevaluation of race and ethnicity with outcomes in heart failure. J Am Heart Assoc 2021;10:e016601. [DOI] [PMC free article] [PubMed] [Google Scholar]
- 95.Nayak A, Hicks AJ, Morris AA. Understanding the complexity of heart failure risk and treatment in Black patients. Circ Heart Fail 2020;13:e007264. [DOI] [PMC free article] [PubMed] [Google Scholar]
- 96.Ziaeian B, Kominski GF, Ong MK, Mays VM, Brook RH, Fonarow GC. National differences in trends for heart failure hospitalizations by sex and race/ethnicity. Circ Cardiovasc Qual Outcomes 2017;10: e003552. [DOI] [PMC free article] [PubMed] [Google Scholar]
- 97.Pinheiro LC, Reshetnyak E, Sterling MR, Levitan EB, Safford MM, Goyal P. Multiple vulnerabilities to health disparities and incident heart failure hospitalization in the REGARDS study. Circ Cardiovasc Qual Outcomes 2020;13:e006438. [DOI] [PMC free article] [PubMed] [Google Scholar]
- 98.Salah HM, Minhas AMK, Khan MS, Khan SU, Ambrosy AP, Blumer V, et al. Trends in hospitalizations for heart failure, acute myocardial infarction, and stroke in the United States from 2004 to 2018. Am Heart J 2022;243:103–9. [DOI] [PubMed] [Google Scholar]
- 99.Elbadawi A, Dang A, Elgendy IY, Thakker R, Albaeni A, Omer MA, et al. Age-specific trends and outcomes of hospitalizations with acute heart failure in the United States. Int J Cardiol 2021;330:98–105. [DOI] [PubMed] [Google Scholar]
- 100.Hamo CE, Fonarow GC, Greene SJ, Vaduganathan M, Yancy CW, Heidenreich P, et al. Temporal trends in risk profiles among patients hospitalized for heart failure. Am Heart J 2021;232:154–63. [DOI] [PMC free article] [PubMed] [Google Scholar]
- 101.Minhas AMK, Ijaz SH, Jamal S, Dani SS, Khan MS, Greene SJ, et al. Trends in characteristics and outcomes in primary heart failure hospitalizations among older population in the United States, 2004 to 2018. Circ Heart Fail 2022;15:e008943. [DOI] [PubMed] [Google Scholar]
- 102.Vaduganathan M, Claggett BL, Greene SJ, Aggarwal R, Bhatt AS, McMurray JJV, et al. Potential implications of expanded US Food and Drug Administration labeling for sacubitril/valsartan in the US. JAMA Cardiol 2021;6:1415–23. [DOI] [PMC free article] [PubMed] [Google Scholar]
- 103.Arundel C, Lam PH, Gill GS, Patel S, Panjrath G, Faselis C, et al. Systolic blood pressure and outcomes in patients with heart failure with reduced ejection fraction. J Am Coll Cardiol 2019;73:3054–63. [DOI] [PMC free article] [PubMed] [Google Scholar]
- 104.Tsimploulis A, Lam PH, Arundel C, Singh SN, Morgan CJ, Faselis C, et al. Systolic blood pressure and outcomes in patients with heart failure with preserved ejection fraction. JAMA Cardiol 2018;3:288–97. [DOI] [PMC free article] [PubMed] [Google Scholar]
- 105.Dunlay SM, Roger VL, Killian JM, Weston SA, Schulte PJ, Subramaniam AV, et al. Advanced heart failure epidemiology and outcomes: a population-based study. JACC Heart Fail 2021;9:722–32. [DOI] [PMC free article] [PubMed] [Google Scholar]
- 106.Global Burden of Cardiovascular Diseases Collaboration, Roth GA, Johnson CO, Abate KH, Abd-Allah F, Ahmed M, et al. The burden of cardiovascular diseases among US states, 1990–2016. JAMA Cardiol 2018;3:375–89. [DOI] [PMC free article] [PubMed] [Google Scholar]
- 107.Glynn PA, Molsberry R, Harrington K, Shah NS, Petito LC, Yancy CW, et al. Geographic variation in trends and disparities in heart failure mortality in the United States, 1999 to 2017. J Am Heart Assoc 2021;10:e020541. [DOI] [PMC free article] [PubMed] [Google Scholar]
- 108.Yu B, Akushevich I, Yashkin AP, Yashin AI, Lyerly HK, Kravchenko J. Epidemiology of geographic disparities in heart failure among US older adults: a Medicare-based analysis. BMC Public Health 2022;22:1280. [DOI] [PMC free article] [PubMed] [Google Scholar]
- 109.Centers for Disease Control and Prevention. Heart failure. 2023. [cited 2023 Jul 9]. Available from: https://www.cdc.gov/heartdisease/heart_failure.htm
- 110.Afzal A, van Zyl J, Nisar T, Kluger AY, Jamil AK, Felius J, et al. Trends in hospital admissions for systolic and diastolic heart failure in the United States between 2004 and 2017. Am J Cardiol 2022;171:99–104. [DOI] [PubMed] [Google Scholar]
- 111.Mohebi R, Chen C, Ibrahim NE, McCarthy CP, Gaggin HK, Singer DE, et al. Cardiovascular disease projections in the United States based on the 2020 census estimates. J Am Coll Cardiol 2022;80:565–78. [DOI] [PMC free article] [PubMed] [Google Scholar]
- 112.Adapted from Global Burden of Cardiovascular Diseases Collaboration, Roth GA, Johnson CO, Abate KH, Abd-Allah F, Ahmed M, et al. The burden of cardiovascular diseases among US states, 1990–2016. JAMA Cardiol 2018;3:375–89. [DOI] [PMC free article] [PubMed] [Google Scholar]
- 113.Yancy CW, Jessup M, Bozkurt B, Butler J, Casey DE, Drazner MH, et al. 2013 ACCF/AHA guideline for the management of heart failure: a report of the American College of Cardiology Foundation/American Heart Association Task Force on Practice Guidelines. J Am Coll Cardiol 2013;62:e147–239. [DOI] [PubMed] [Google Scholar]
- 114.Fonarow GC, Yancy CW, Hernandez AF, Peterson ED, Spertus JA, Heidenreich PA. Potential impact of optimal implementation of evidence-based heart failure therapies on mortality. Am Heart J 2011;161:1024–30. e3. [DOI] [PubMed] [Google Scholar]
- 115.Savarese G, Kishi T, Vardeny O, Adamsson Eryd S, Bodegård J, Lund LH, et al. Heart failure drug treatment-inertia, titration, and discontinuation: a multinational observational study (EVOLUTION HF). JACC Heart Fail 2023;11:1–14. [DOI] [PubMed] [Google Scholar]
- 116.Brownell NK, Ziaeian B, Fonarow GC. The gap to fill: rationale for rapid initiation and optimal titration of comprehensive disease-modifying medical therapy for heart failure with reduced ejection fraction. Card Fail Rev 2021;7:e18. [DOI] [PMC free article] [PubMed] [Google Scholar]
- 117.Ilonze O, Free K, Breathett K. Unequitable heart failure therapy for Black, Hispanic and American-Indian patients. Card Fail Rev 2022;8:e25. [DOI] [PMC free article] [PubMed] [Google Scholar]
- 118.Parwani P, Yancy CW. Sociodemographic disparities in the GDMT usage. JACC Heart Fail 2023;11:173–5. [DOI] [PubMed] [Google Scholar]
- 119.Sukumar S, Wasfy JH, Januzzi JL, Peppercorn J, Chino F, Warraich HJ. Financial toxicity of medical management of heart failure: JACC review topic of the week. J Am Coll Cardiol 2023;81:2043–55. [DOI] [PMC free article] [PubMed] [Google Scholar]
- 120.Mwansa H, Barry I, Knapp SM, Mazimba S, Calhoun E, Sweitzer NK, et al. Association between the Affordable Care Act Medicaid expansion and receipt of cardiac resynchronization therapy by race and ethnicity. J Am Heart Assoc 2022;11:e026766. [DOI] [PMC free article] [PubMed] [Google Scholar]
- 121.Farmer SA, Kirkpatrick JN, Heidenreich PA, Curtis JP, Wang Y, Groeneveld PW. Ethnic and racial disparities in cardiac resynchronization therapy. Heart Rhythm 2009;6:325–31. [DOI] [PubMed] [Google Scholar]
- 122.Ilonze O, Free K, Shinnerl A, Lewsey S, Breathett K. Racial, ethnic, and gender disparities in valvular heart failure management. Heart Fail Clin 2023;19:379–90. [DOI] [PMC free article] [PubMed] [Google Scholar]
- 123.Breathett K, Knapp SM, Carnes M, Calhoun E, Sweitzer NK. Imbalance in heart transplant to heart failure mortality ratio among African American, Hispanic, and White patients. Circulation 2021;143:2412–4. [DOI] [PMC free article] [PubMed] [Google Scholar]
- 124.Molina EJ, Shah P, Kiernan MS, Cornwell WK, Copeland H, Takeda K, et al. The Society of Thoracic Surgeons INTERMACS 2020 annual report. Ann Thorac Surg 2021;111:778–92. [DOI] [PubMed] [Google Scholar]
- 125.Organ Procurement & Transplantation Network. National data - heart transplant. [cited 2023 Jul 9]. Available from: https://optn.transplant.hrsa.gov/data/view-data-reports/national-data/#
- 126.Bhatnagar R, Fonarow GC, Heidenreich PA, Ziaeian B. Expenditure on heart failure in the United States: the Medical Expenditure Panel Survey 2009–2018. JACC Heart Fail 2022;10:571–80. [DOI] [PMC free article] [PubMed] [Google Scholar]
- 127.Camplain R, Kucharska-Newton A, Loehr L, Keyserling TC, Layton JB, Wruck L, et al. Accuracy of self-reported heart failure. The Atherosclerosis Risk in Communities (ARIC) study. J Card Fail 2017;23:802–8. [DOI] [PMC free article] [PubMed] [Google Scholar]
- 128.Ziaeian B, Fonarow GC. Making Heart failure count. Eur J Heart Fail 2021;23:917–8. [DOI] [PMC free article] [PubMed] [Google Scholar]
Associated Data
This section collects any data citations, data availability statements, or supplementary materials included in this article.


