Abstract
The Democratic Republic of the Congo’s (DRC) 10th known Ebola virus disease (EVD) outbreak occurred between August 1, 2018 and June 25, 2020, and was the largest EVD outbreak in the country’s history. During this outbreak, the DRC Ministry of Health initiated traveller health screening at points of control (POC, locations not on the border) and points of entry (POE) to minimize disease translocation via ground and air travel. We sought to develop a model-based approach that could be applied in future outbreaks to inform decisions for optimizing POC and POE placement, and allocation of resources more broadly, to mitigate the risk of disease translocation associated with ground-level population mobility. We applied a parameter-free mobility model, the radiation model, to estimate likelihood of ground travel between selected origin locations (including Beni, DRC) and surrounding population centres, based on population size and drive-time. We then performed a road network route analysis and included estimated population movement results to calculate the proportionate volume of travellers who would move along each road segment; this reflects the proportion of travellers that could be screened at a POC or POE. For Beni, the road segments estimated to have the highest proportion of travellers that could be screened were part of routes into Uganda and Rwanda. Conversely, road segments that were part of routes to other population centres within the DRC were estimated to have relatively lower proportions. We observed a posteriori that, in many instances, our results aligned with locations that were selected for actual POC or POE placement through more time-consuming methods. This study has demonstrated that mobility models and simple spatial techniques can help identify potential locations for health screening at newly placed POC or existing POE during public health emergencies based on expected movement patterns. Importantly, we have provided methods to estimate the proportionate volume of travellers that POC or POE screening measures would assess based on their location. This is critical information in outbreak situations when timely decisions must be made to implement public health interventions that reach the most individuals across a network.
Keywords: Ebola virus disease, radiation model, road network analysis, resource allocation, population mobility, Democratic Republic of the Congo
1. Introduction
On August 1, 2018 the Democratic Republic of the Congo (DRC) declared the country’s 10th Ebola virus disease (EVD) outbreak (WHO, 2018). It became the largest known EVD outbreak in the country’s history and the second-largest ever recorded globally (CDC, 2019). The majority of cases were reported in five health zones, Beni, Butembo, Katwa, Mabalako and Mandima, within the provinces of North Kivu, South Kivu, and Ituri (DRC Ministry of Health, 2019b; WHO, 2020b, 2020c). This area is located along the national border with Uganda and is within relatively close proximity to South Sudan, Rwanda, and Burundi. Three confirmed EVD cases were reported in Bwera, Uganda (near the DRC-Uganda border) on June 12, 2019 (WHO, 2019c). By July 30, 2019, there were four confirmed cases in Goma, DRC, a major urban centre located on the national border with Rwanda (Médecins Sans Frontières, 2019; Schlein, 2019). Establishment in Goma, in addition to potential for further international spread, led the World Health Organization (WHO) to declare the outbreak a Public Health Emergency of International Concern (PHEIC) on July 17, 2019 (WHO, 2019e). By the time the 10th outbreak was declared over on June 25, 2020, there had been a total of 3,470 cumulative cases and 2,287 deaths (case fatality ratio of 66%) (WHO, 2020c). An 11th and 12th EVD outbreak followed. The 11th outbreak occurred in Équateur Province between June 1, 2020, and November 18, 2020 (WHO, 2020a). The 12th outbreak began on February 7, 2021 in the province of North Kivu (the same region where the 10th outbreak occurred) with the last survivor testing negative for EVD and being discharged from the Ebola treatment unit on April 22, 2021 (CDC, 2021). Genetic sequencing indicated these new cases were linked to the 10th outbreak and not caused by a new spillover event (WHO, 2021). At the time of writing, the 12th outbreak had not yet been declared over.
During the DRC’s 10th EVD outbreak, frequent travel between the affected region and surrounding population centres within the DRC and neighbouring countries, as well as the complex and insecure socio-political context where this outbreak was taking place, made the situation particularly concerning. The populations in the affected regions were highly mobile and had high cross-border movement related to commerce activities, health care seeking preferences, and family ties (DRC Ministry of Health, 2019b; IOM, 2019c, 2019a). Additionally, a humanitarian crisis in the region had disrupted response efforts (WHO, 2019b). These, along with other contextual factors, including public mistrust of government and international authorities, made it difficult to effectively manage the outbreak (CDC, 2019; DRC Ministry of Health, 2019b; Vinck et al., 2018).
Among other intervention strategies, the DRC Ministry of Health, with support from international partners, had initiated traveller health screening at points of control (POC: internal check points not located on the border) and points of entry (POE: check points located on the border) to minimize the risk of disease translocation via ground and air travel (DRC Ministry of Health, 2019b; IOM, 2019c; WHO, 2019a). Traveller screenings at these stations made it possible to detect, assess, and report travellers with fever or other signs of illness suggestive of EVD, disseminate prevention and control messages, and promote hand hygiene (DRC Ministry of Health, 2019b). High population mobility required the placement of these stations in strategic areas to screen travellers (DRC Ministry of Health, 2019b; IOM, 2019c). POC and POE locations were typically selected using information on population mobility, guided by expert opinion and knowledge of the area (IOM, 2019c).
Strengthening data analysis to better inform decision making and guide interventions was a specific objective of the DRC Ministry of Health’s strategic response plan (DRC Ministry of Health, 2019b). We sought to address this objective by developing a spatial model-based, data-driven approach to inform decisions for optimizing POC and POE locations based on ground movement patterns. Specifically, we sought to identify road segments that would facilitate public health screeners at POC or POE to screen the highest volume of travellers. We intend for this research to provide a systematic technique for future disease outbreaks for developing timely, decision-making products for resource allocation during the early stages of an outbreak in data-limited scenarios.
2. Methods
2.1. Study design
We conducted this analysis in two parts. First, we focused on the initial stages of the 10th EVD outbreak (2018–2020) and quantitatively selected and prioritized POC or POE locations based on an outbreak epicentre, Beni, DRC. By October 28, 2018, Beni health zone had the highest case count of all health zones, accounting for 48% of total cases at that time (WHO, 2018). We applied a mobility model, the radiation model, to estimate the population movement from Beni to surrounding population centres within a 600 km radius (Fig. 1). We then performed a road network route analysis and included estimated population movement results to identify road segments on which POC or POE would have the potential to screen the highest estimated volume of travellers. Input data representing affected health zones as well as relevant contextual data for this part of the analysis were representative of the situation as of October 2018, to reflect one of the points in time when Beni was the main epicentre for the 10th EVD outbreak in the DRC. This scenario assumes that there are only cases in Beni and is most relevant to decision-making that might have happened in the initial stages of the outbreak.
Fig. 1.
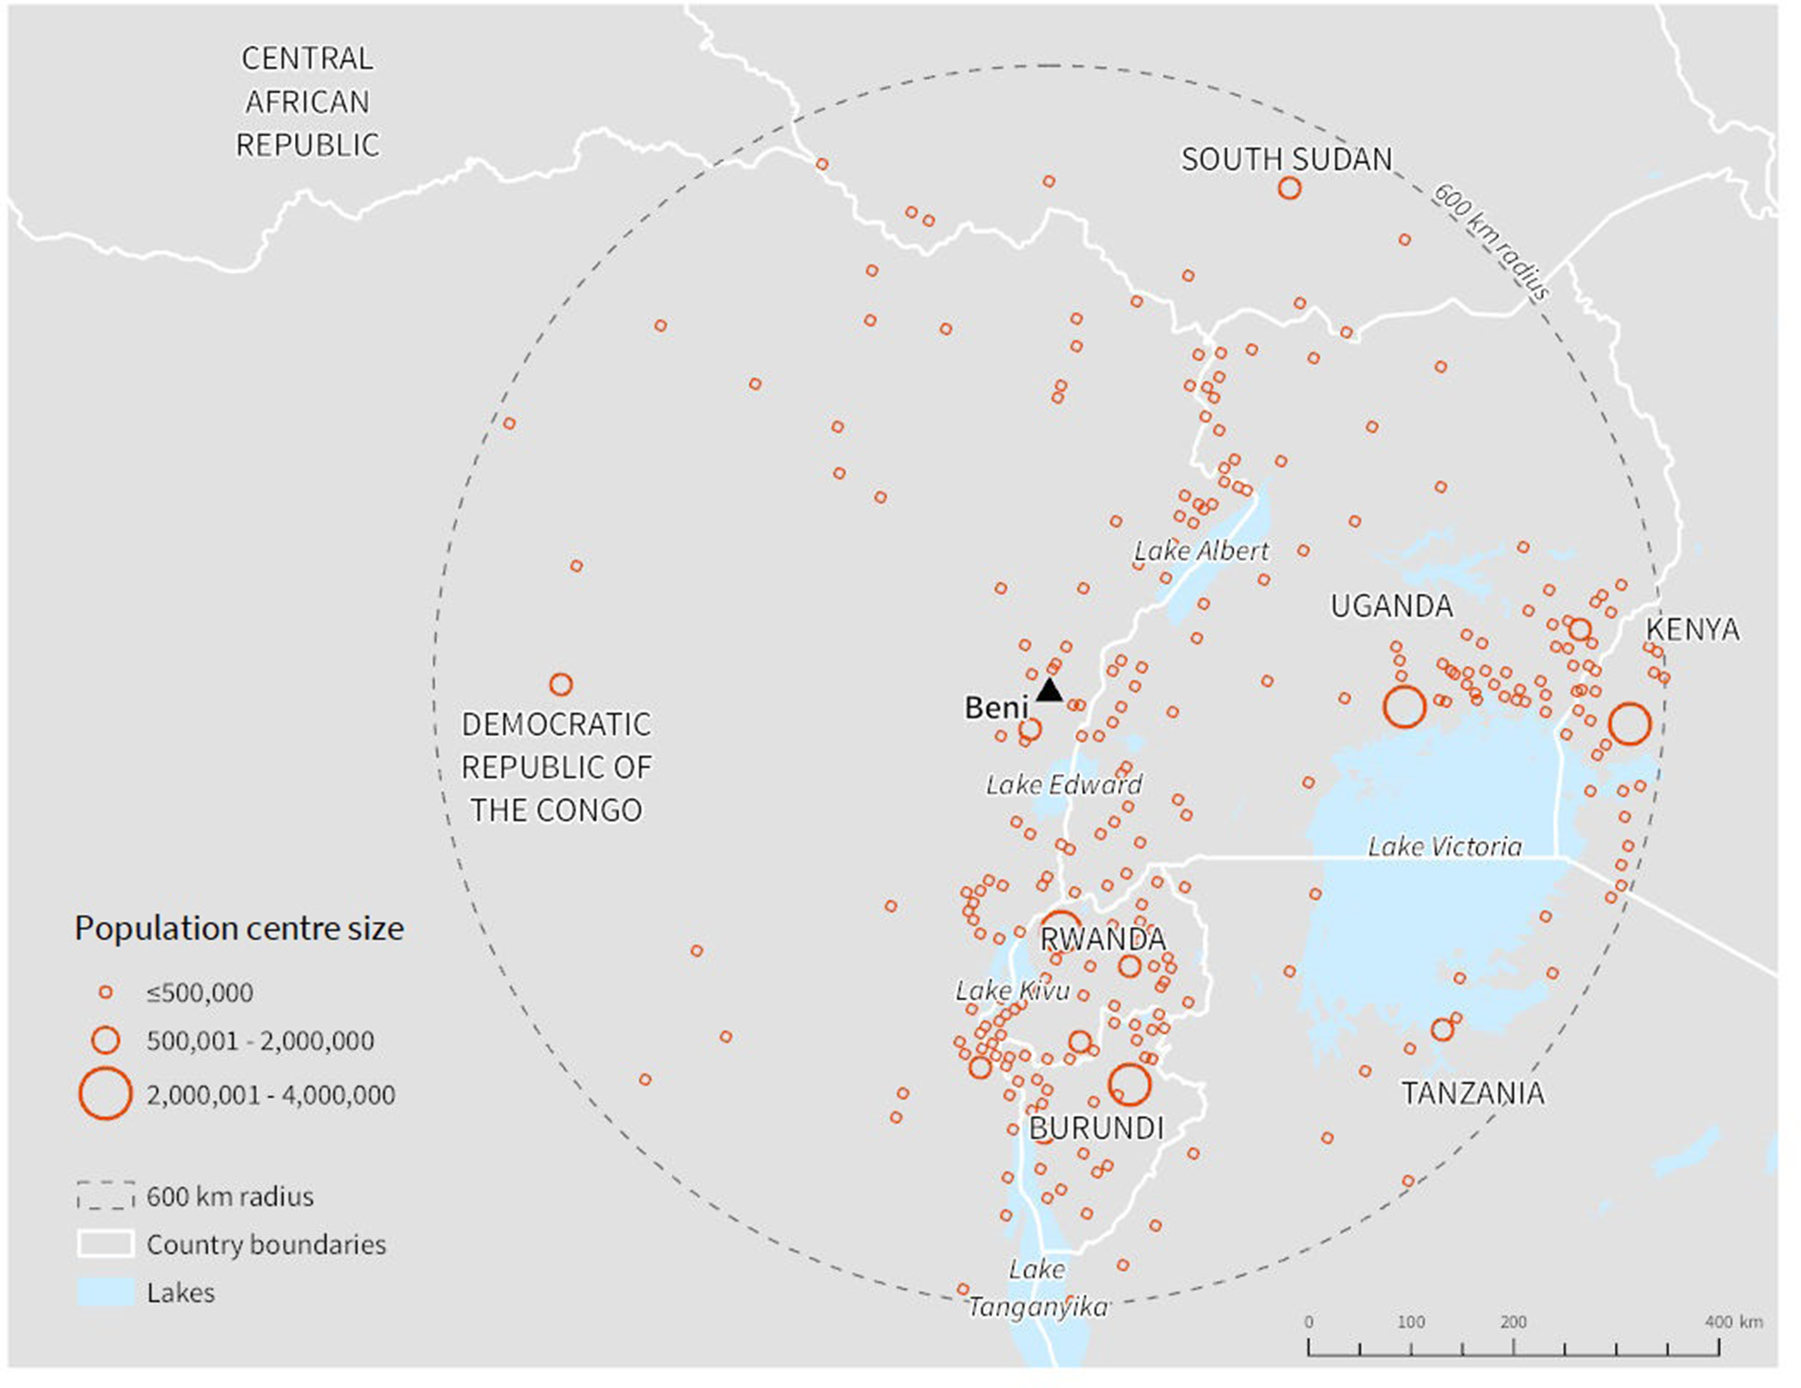
Population centres within 600 km of Beni; population centres were identified using the LandScan raster dataset representing population per km2 (Oak Ridge National Laboratory, 2017).
In response to and in anticipation of the outbreak spreading to other areas, we repeated the analysis for two additional population centres: Goma, DRC, and Mpondwe, Uganda. These population centres were selected based on connectivity to Beni in the initial analysis as well as overall importance to the ongoing outbreak. Goma was in part selected because of the confirmed cases in July 2019. The DRC Ministry of Health (2019b) had previously stated that EVD transmission in Goma would “mark a radically different stage in this epidemic” as the city maintains air connections with other major cities within and outside of the DRC. Mpondwe was estimated to be highly connected to Beni in the first stage of the analysis. Additionally, it was near a high-volume POE on the DRC-Uganda border and on route to Bwera, Uganda where three EVD cases were identified (WHO, 2019c). Additional results for Gisenyi-Ruhengeri in Rwanda, and Kampala and Fort Portal in Uganda are included in the Supplementary Materials. Fig. 1 in our Supplementary Materials provides a conceptual overview of our methods.
2.2. Modelling regional mobility by ground travel
We applied the radiation model to estimate ground-level mobility between the selected origin population centres (Beni, Goma, and Mpondwe) and potential destination population centres. The radiation model is parameter-free and ideal in data-limited situations (Simini et al., 2012; Tuite et al., 2018). The model considers the cumulative ‘absorption’ of travellers by surrounding population centres as they move away from their origin (Beine et al., 2015; Marshall et al., 2018). The probability of travelling from population centre to population centre is described by:
where and are the population sizes of population centres and , respectively, and is the population within a circle radius equal to the geodesic distance between the two populations, centred on population centre and excluding the populations of population centres and (Tuite et al., 2018). The radiation model was originally developed to evaluate daily commuting patterns (Simini et al., 2012) and has been applied in previous studies to model the spread of contagion (Kraemer et al., 2017; Tuite et al., 2018). Thus, we chose this model as it has been used to approximate mobility patterns critical in the circular expansion and continuous spread of disease from an outbreak epicentre.
Given a lack of openly accessible data delineating locations of all relevant population centres in the region and their respective population sizes, we utilized the LandScan raster dataset to identify population centre locations and estimate their population sizes. The LandScan dataset represents ambient population per km2 (Oak Ridge National Laboratory, 2017). Using ArcGIS, we identified clusters of contiguous pixels with population density greater than or equal to 500 people per km2 using the majority rule; a low-density pixel is included if at least five out of the surrounding eight cells meet the density threshold (Moisés et al., 2020). A cluster was split if it crossed a national border. We considered each cluster of contiguous pixels to be a population centre and summed pixel values to calculate the total population for each. Based on previous research by Moisés et al. (2020), we only included population centres that had a total population of at least 25,000, and were also within 600 km of each origin population centre previously described. The resulting population centre points and population counts did not necessarily align with those of official administrative boundaries. For interpretability purposes, population centres were manually assigned names using contextual maps (Esri, 2019a; Google, 2019) to identify the major populated places within each cluster of contiguous pixels.
We represented distance from origin population centres to all potential destination population centres using drive-time. Drive-time offers a more accurate representation of how individuals travel on a road network than Euclidean (straight-line) distance, though it is more resource-intensive to calculate, can require GIS software, and requires a detailed road network dataset (Marshall et al., 2018). Drive-time was calculated using ArcGIS Pro (Esri, 2019b), leveraging road network data from Open Street Map (OSM) (Geofabrik, 2019). Since there were few speed limit values for our study area within the OSM dataset or defined in previous studies, we assigned average speed by road type based on speeds determined for Niger (Blanford et al., 2012). All road types from the OSM dataset were included other than those that were classified as “unknown”.
To identify destinations with high potential to facilitate further spread, we highlighted population centres that, in addition to having high connectivity to the selected origin population centres, were proximal to an international airport (within 5 km). If cases were to spread to a population centre with an international airport there would be a notably increased risk of further spread both domestically and internationally. We considered an airport to be an international airport if it had greater than 1,000 flights to international destinations in 2018, based on itinerary data from the International Air Transport Association (IATA) (IATA, 2018). While we highlighted destinations proximal to international airports, all destinations (including those not proximal to an international airport) were included in subsequent methodological steps.
2.3. Identifying locations for POC or POE
Building on radiation model results that estimated mobility between origin and destination population centres, we selected suitable road segments for POC or POE placement based on spatial criteria and quantified the proportion of travellers that could be screened on each. First, we performed a route analysis using the OSM road network data and the Network Analysis toolbox within ArcGIS Pro to identify the optimal (i.e. quickest) route from each origin to each possible destination population centre (Esri, 2019c). Then, to estimate the proportion of total travellers likely to move along each segment within these routes, we summed the likelihood of travel to all destination population centres that each road segment would serve (see Supplementary Materials Section 1.5 for example).
After calculating the estimated proportion of travellers moving along each road segment, we selected subsets of these road segments based on three decision-making scenarios. First, we selected road segments estimated to carry travellers directly departing each origin population centre representing a disease epicentre (Beni, DRC) or connected location (Goma, DRC and Mpondwe, Uganda). These segments directly intersect each origin. Second, we selected road segments based on the likelihood of screening travellers moving from any location within the outbreak-affected health zones in the DRC (as of October 28, 2018). These segments cross the boundary of the outbreak area. While mobility model results were based on travel from Beni (the only selected origin within the outbreak area), the entire outbreak area was used to spatially select relevant road segments. Third, road segments were selected based on screening travellers moving across an international border into neighbouring countries. These segments cross the boundary of the origin country (DRC or Uganda). The capacity to initiate POC or POE is not pre-determined and can vary over time. Thus, the approximated proportion of travellers that could be screened on each road segment is intended to guide their prioritization.
It is intended that our methods be applied near the start of an outbreak or when the epidemiology shifts to prioritize locations for POC or POE. However, for the purposes of this study we assessed our results a posteriori against the actual placement of POC and POE implemented during this outbreak. Actual POC and POE locations were compared using data as of October 2018 when Beni was the largest outbreak hotspot, and December 2019 when the data was last updated at the time our analysis was performed (IOM, 2019b). We identified which of our selected road segments intersected an actual POC or POE location. Areas of alignment suggest where our model can produce similar findings or recommendations as decision makers using general knowledge of the area and limited mobility data. Alternatively, road segments identified by our model that did not have a POC or POE placed along them may reveal important routes where a POC or POE may have been beneficial. This comparison was relevant to results for Beni only.
3. Results
3.1. Beni, DRC
The radiation model predicted mobility from Beni to be concentrated in its immediately surrounding area, despite the relatively low population sizes of the nearby population centres (Fig. 2). Butembo, located just south of Beni and within the outbreak area, had the highest estimated probability of travel from Beni. As shown in Table 1, travellers leaving Beni were estimated to have 28% likelihood to travel to Butembo. Travellers were also estimated to have high likelihood to travel to Oicha (19%), Mbau (11%) and Matango (10%), all within the DRC. Gisenyi-Ruhengeri, Rwanda (2%) and Mpondwe, Uganda (1%) were the only population centres outside of the DRC that were within the top ten destinations for travellers leaving Beni (Table 1). Gisenyi-Ruhengeri is a notable destination because of its close proximity to an international airport.
Fig. 2.
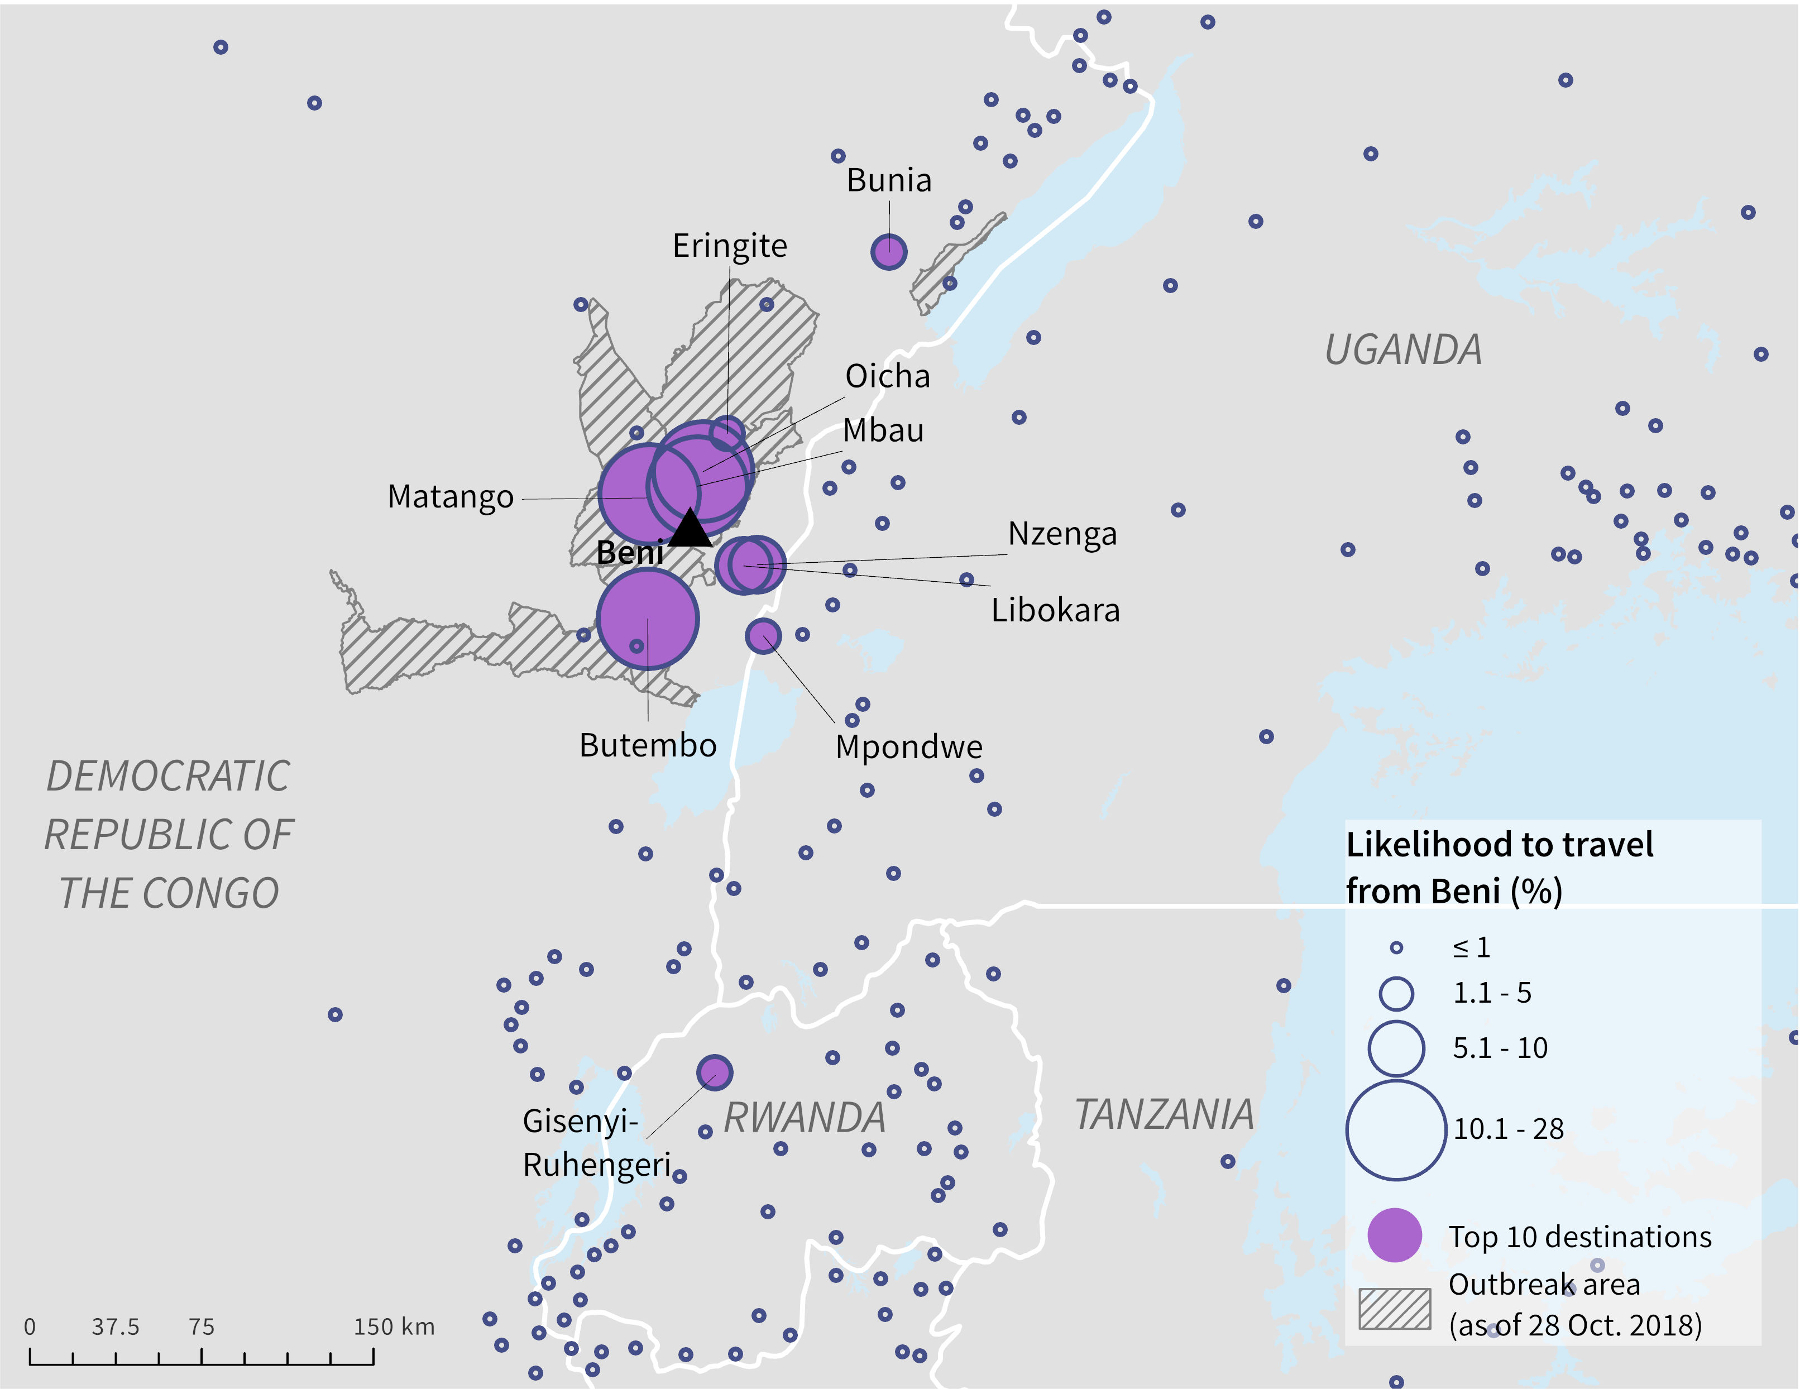
Likelihood of ground travel from Beni, DRC to surrounding population centres as estimated by the radiation model.
Table 1.
Top ten population centres based on likelihood of ground travel from Beni, DRC, as estimated by the radiation model.
| Population centre name | Country | Population | Likelihood of travel from Beni, DRC |
|---|---|---|---|
|
| |||
| Butembo* | DRC | 1,178,303 | 27.5% |
| Oicha* | DRC | 95,431 | 18.5% |
| Mbau* | DRC | 38,830 | 10.6% |
| Matango* | DRC | 75,839 | 10% |
| Libokara | DRC | 82,688 | 8.1% |
| Nzenga | DRC | 64,944 | 5.0% |
| Eringite* | DRC | 48,215 | 3.1% |
| Gisenyi-Ruhengeri¶ | RW | 2,045,027 | 1.7% |
| Mpondwe | UG | 150,604 | 1.2% |
| Bunia | DRC | 315,219 | 1.1% |
Country name acronyms: Democratic Republic of the Congo (DRC), Rwanda (RW), Uganda (UG), Burundi (BI).
indicates a destination that is within 1 km of a health zone with reported Ebola cases as of October 28, 2018.
indicates a population centre within 5 km of an international airport.
Locating a POC on four road segments directly connected to Beni would allow for screening of most departing travellers (Fig. 3A). The highest priority road segment for this scenario takes travellers north and is estimated to carry 35% of all travellers leaving Beni. POC or POE would be required on six road segments to screen travellers on all optimal routes from the full outbreak area (Fig. 3B). The highest priority segment among the six for this scenario leads to the Mpondwe border-crossing point at the DRC-Uganda border and is estimated to carry 22% of travellers leaving Beni. We identified 13 road segments for screening travellers on the identified routes associated with cross-border travel (Fig. 3C). The border-crossing segment with the highest proportion of expected travellers (9%) leads into Uganda and is directly connected to an important segment for screening travellers departing out of Beni and out of the outbreak area.
Fig. 3.
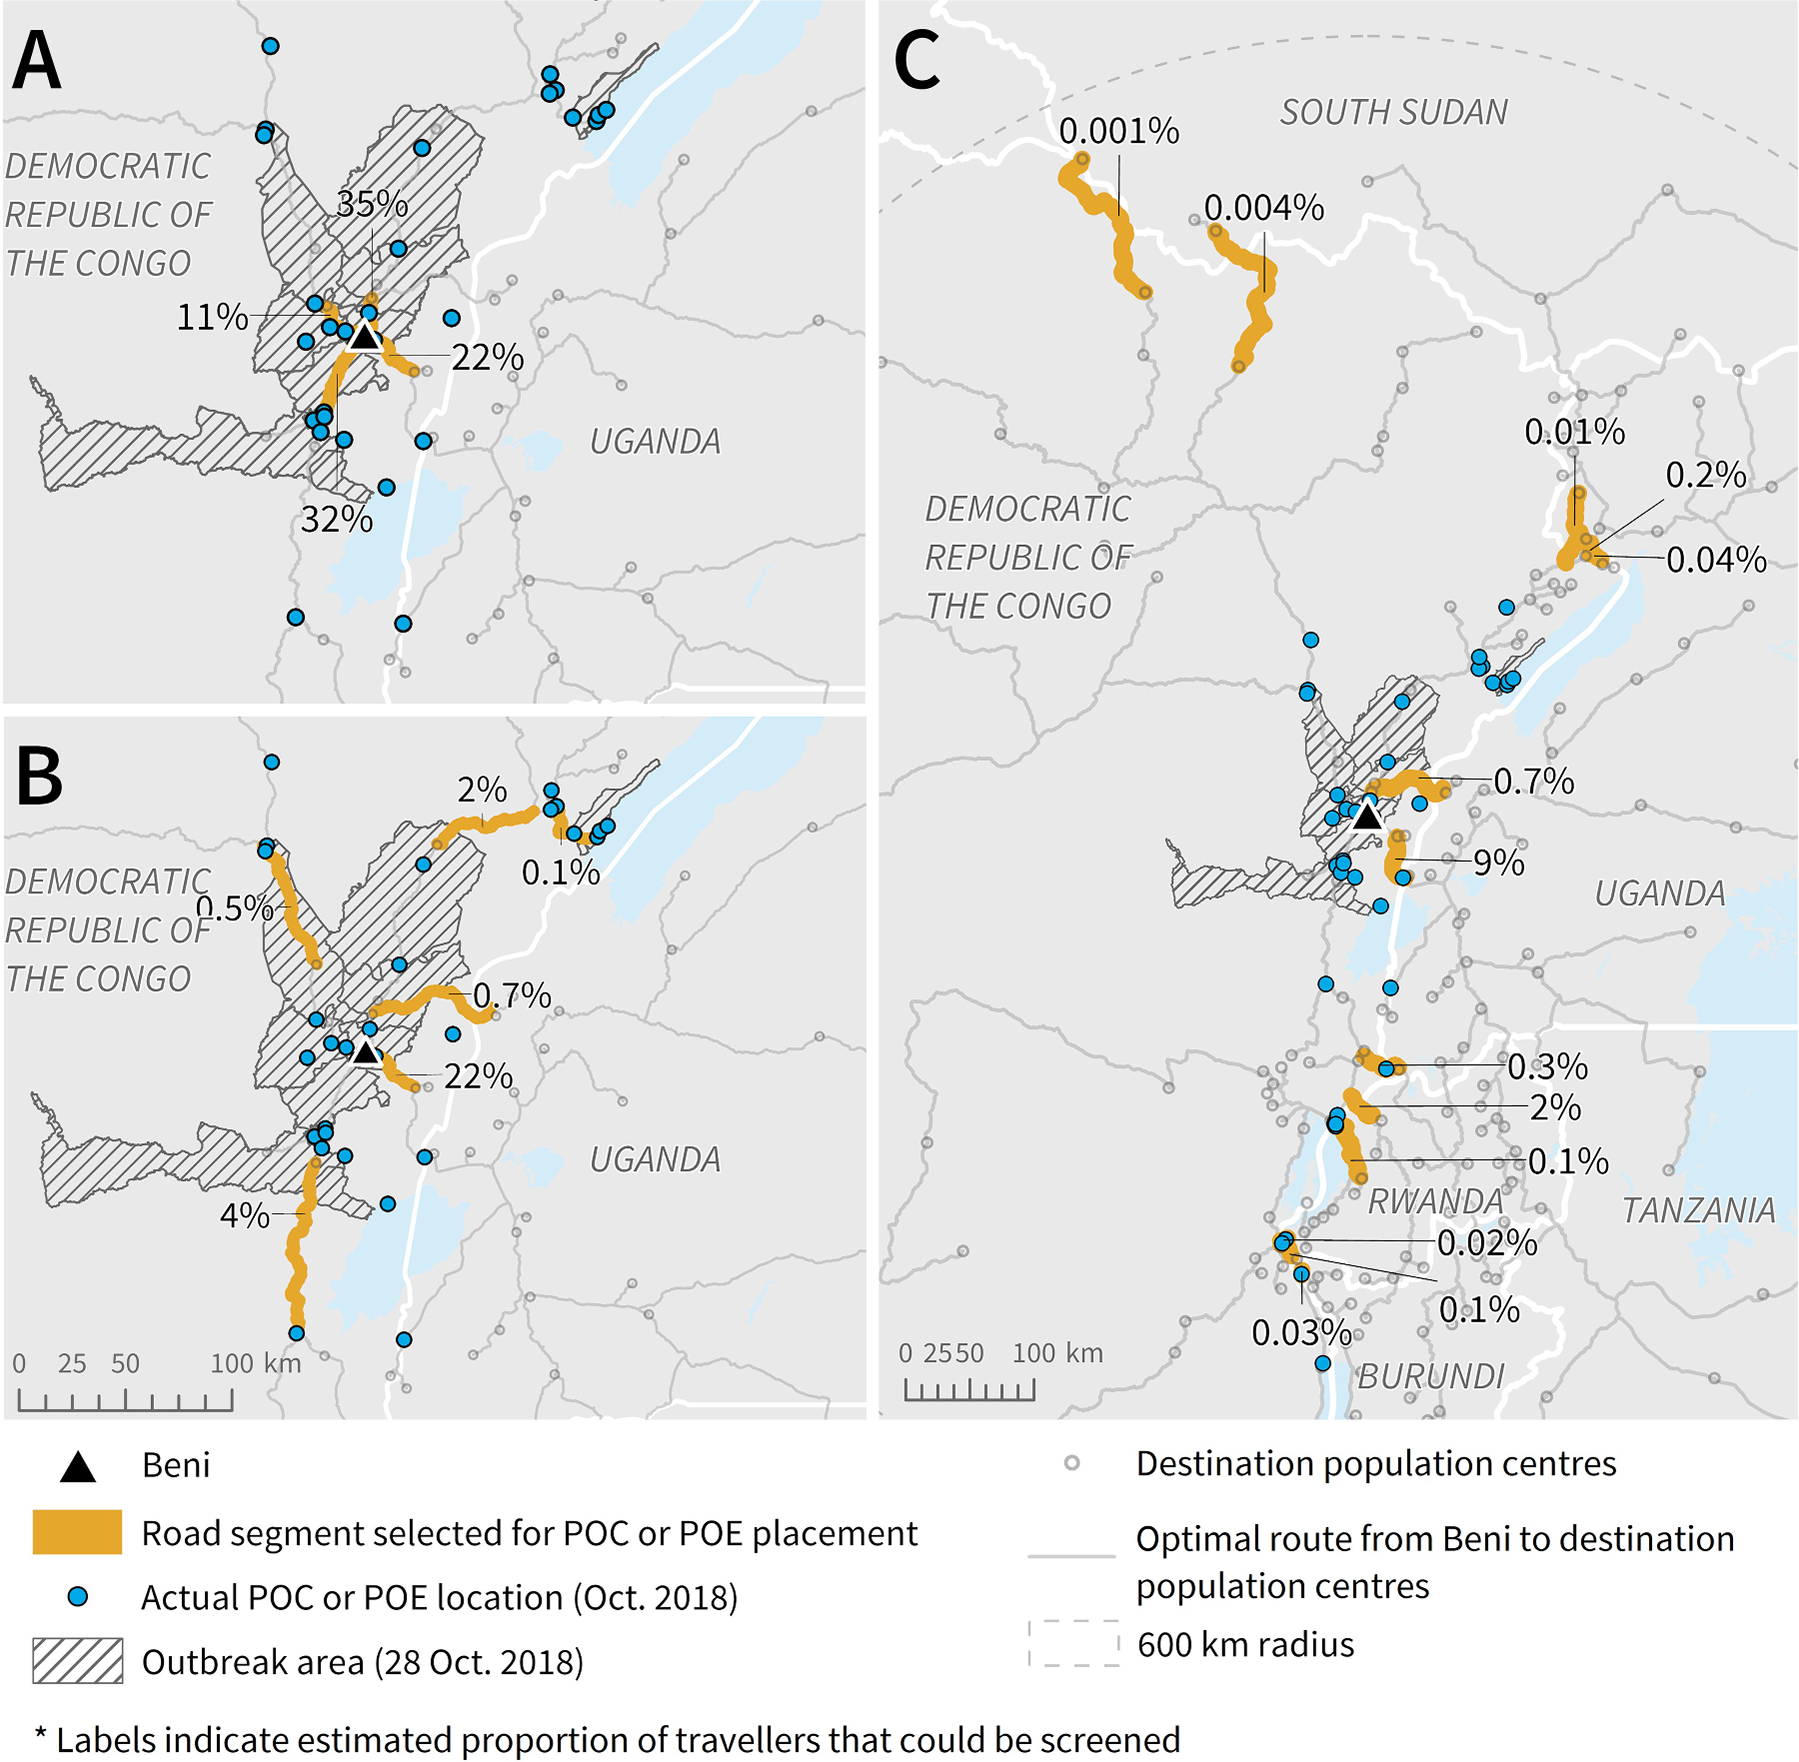
Potential road segments for POC or POE placement based on radiation model and route results, to screen the highest volume of travellers leaving A) Beni, B) the outbreak area (as of October 28, 2018), and C) DRC into neighbouring countries. Note: The length of each segment (highlighted or not) was determined by the road segment length in the data. To be able to screen the estimated percent of travellers, the individuals would need to be screened along the highlighted section before having the option to turn onto another road or proceed onto a different road type.
Overall, road segments estimated to carry the highest proportion of travellers leaving Beni were part of routes leading north and east, into neighbouring countries such as Uganda and Rwanda. Conversely, there were few identified routes taking travellers west to other population centres within the DRC, likely because there is very low population density and a limited road network in the portion of the DRC outside of the affected region and included in the 600 km radius. This spatial pattern was reflected in the selection of road segments identified for POC or POE placement in Fig. 3.
Top-ranking road segments resulting from our analysis aligned with many POC and POE locations in place as of October 2018. All four segments selected to screen travellers leaving Beni directly had a POC placed along them (Fig. 3A), as well as four of the six selected segments to screen travellers from the total outbreak area (Fig. 3B). Of the 13 road segments that we selected to screen travellers moving cross-border, only six had a POE placed along them (Fig. 3C). The cross-border segment with the highest estimated proportion of travellers that also did not have a POE placed along it was located on a northern part of the DRC-Rwanda border. This segment was estimated to carry 2% of travellers from Beni and did have a POE placed along it by December 2019 (IOM, 2019b). Other selected cross-border road segments that did not have a POE placed on them were crossing points into Uganda and South Sudan, though each of these segments were estimated to carry less than 1% of travellers leaving Beni. In some cases where our selected segments did not have a POE placed along them, there was a POC placed on the same route but closer to the outbreak area itself. Results were similar when comparing to POC and POE locations as of December 2019, with some additional POC of POE placed on our selected segments by this time.
3.2. Goma, DRC
Most population centres with high connectivity to Goma, as estimated by the radiation model, were within DRC and Rwanda (Fig. 4, Table 2). Gisenyi-Ruhengeri in Rwanda, located east of the DRC-Rwanda border, had the highest likelihood of travel from Goma (70%) and is also proximal to an international airport. Likelihood to travel to any other population centre was notably smaller; Rutshuru (south) was second most likely at 8%. There was 2% likelihood to travel to Kigali, Rwanda, another population centre that is proximal to an international airport. Kisoro, Uganda was the only population centre ranked within the top ten that was not in DRC or Rwanda, but had only 0.6% likelihood.
Fig. 4.
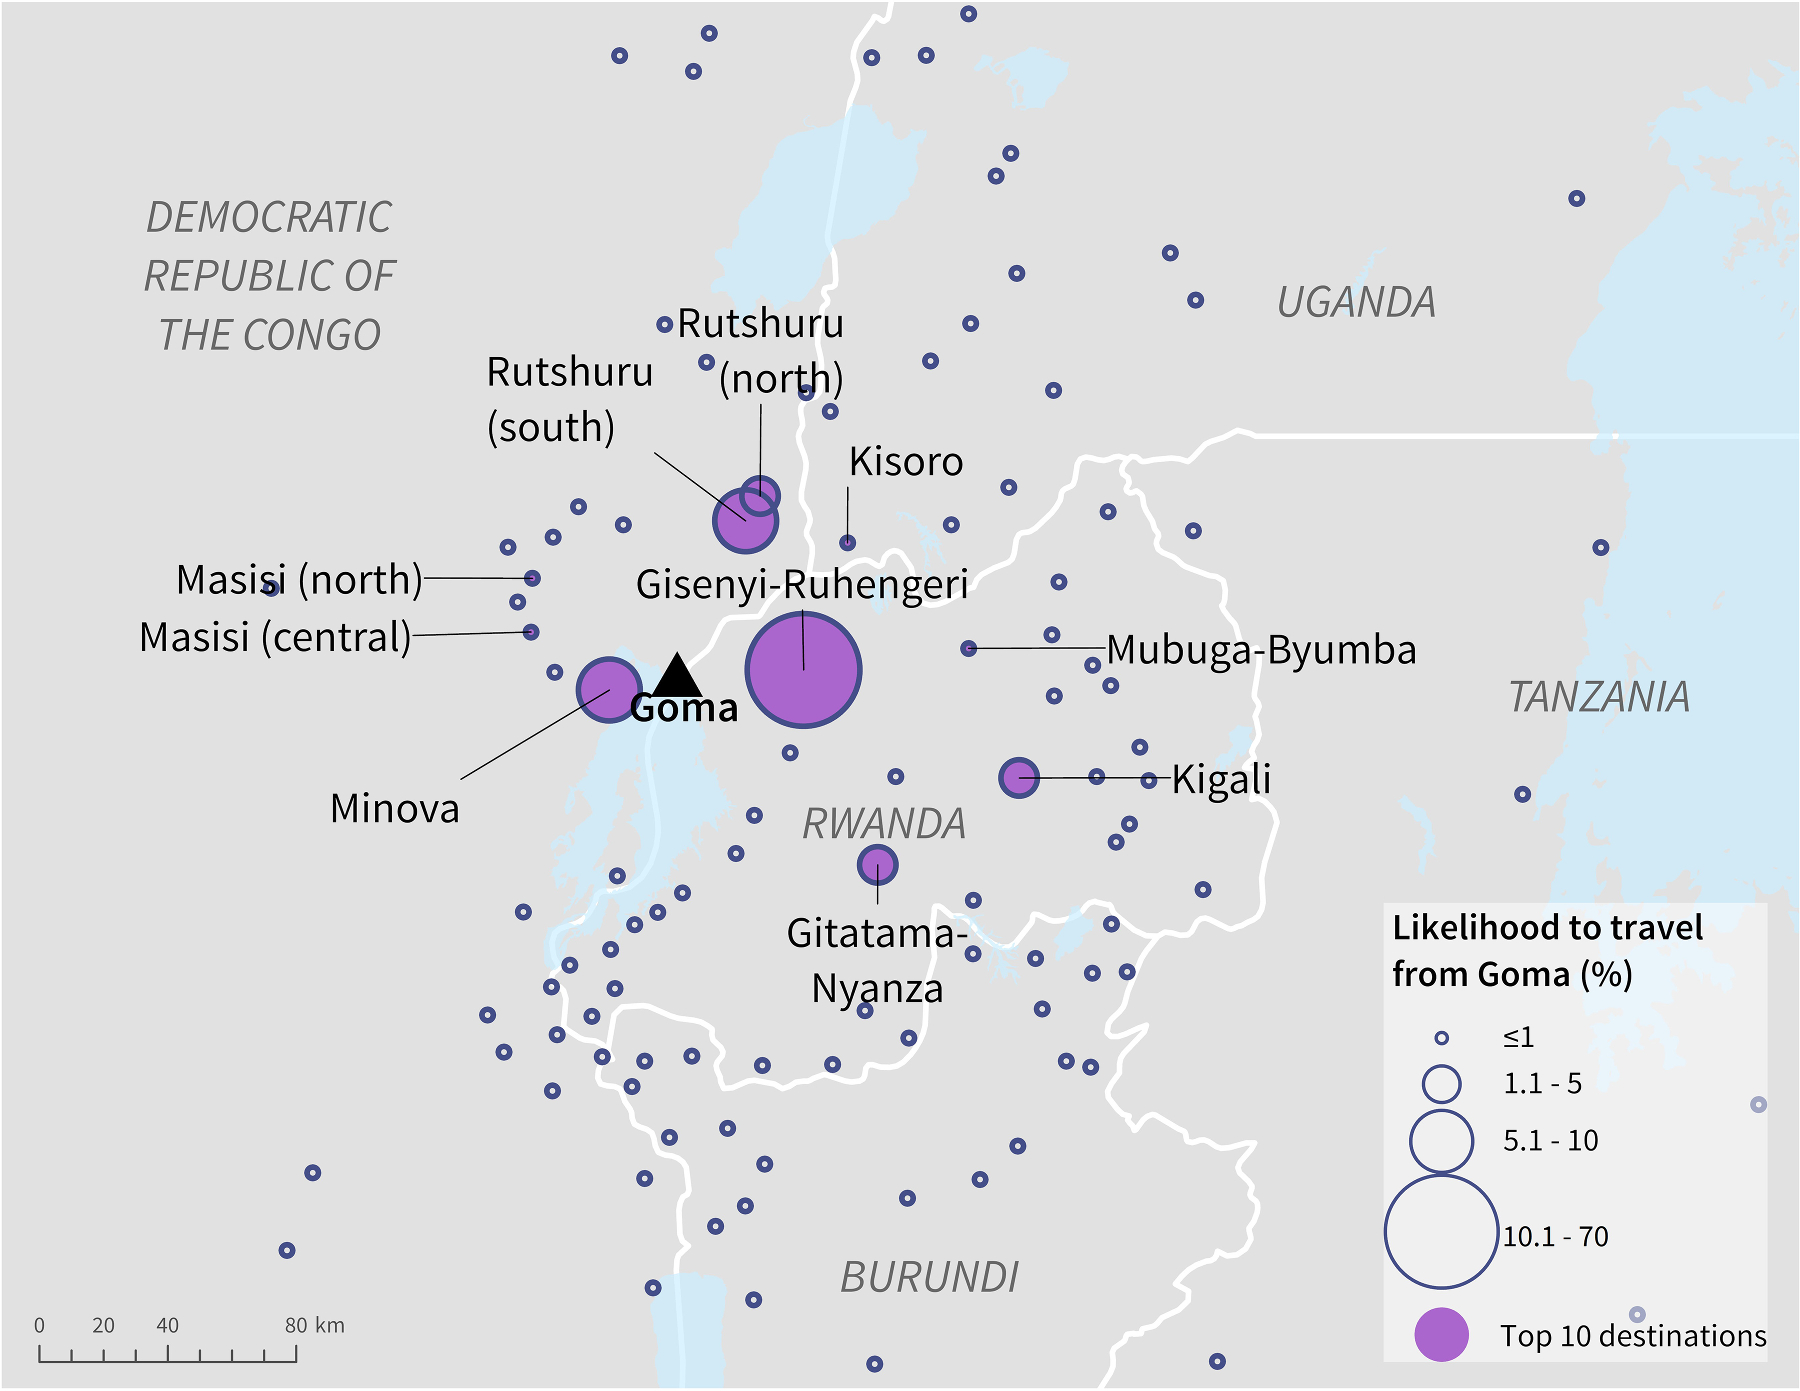
Likelihood of ground travel from Goma, DRC to surrounding population centres as estimated by the radiation model.
Table 2.
Top ten population centres based on likelihood of ground travel from Goma, DRC, as estimated by the radiation model.
| Population centre name | Country | Population | Likelihood of travel from Goma, DRC |
|---|---|---|---|
|
| |||
| Gisenyi-Ruhengeri ¶ | RW | 2,045,027 | 69.5% |
| Rutshuru (south) | DRC | 40,825 | 8.1% |
| Minova | DRC | 27,131 | 6.3% |
| Kigali ¶ | RW | 1,518,435 | 2.1% |
| Rutshuru (north) | DRC | 186,826 | 1.1% |
| Gitatama-Nyanza | RW | 440,204 | 1% |
| Masisi (north) | DRC | 178,762 | 0.8% |
| Mubuga-Byumba | RW | 386,305 | 0.8% |
| Masisi (central) | DRC | 150,545 | 0.7% |
| Kisoro | UG | 180,827 | 0.6% |
indicates a population centre within 5 km of an international airport.
Country name acronyms: Democratic Republic of the Congo (DRC), Rwanda (RW), Uganda (UG), Burundi (BI).
The highest priority road segment for POC placement to screen travellers leaving Goma directly was estimated to carry 77% of travellers (Fig. 5A). This road segment leads east, directly into Rwanda. Two other road segments were selected to screen travellers leaving Goma, with one leading west within the DRC and the other north as part of routes within the DRC and into Uganda. Each was estimated to carry approximately 11% of travellers. Eight road segments were selected for POE placement to screen travellers crossing the DRC border. The segment with the highest estimated proportion of travellers leads into Rwanda (Fig. 5B) and was the same segment selected as highest priority to screen travellers leaving Goma itself (Fig. 5A). All other border-crossing segments were estimated to carry notably fewer travellers leaving Goma; all were estimated to carry less than 1%.
Fig. 5.
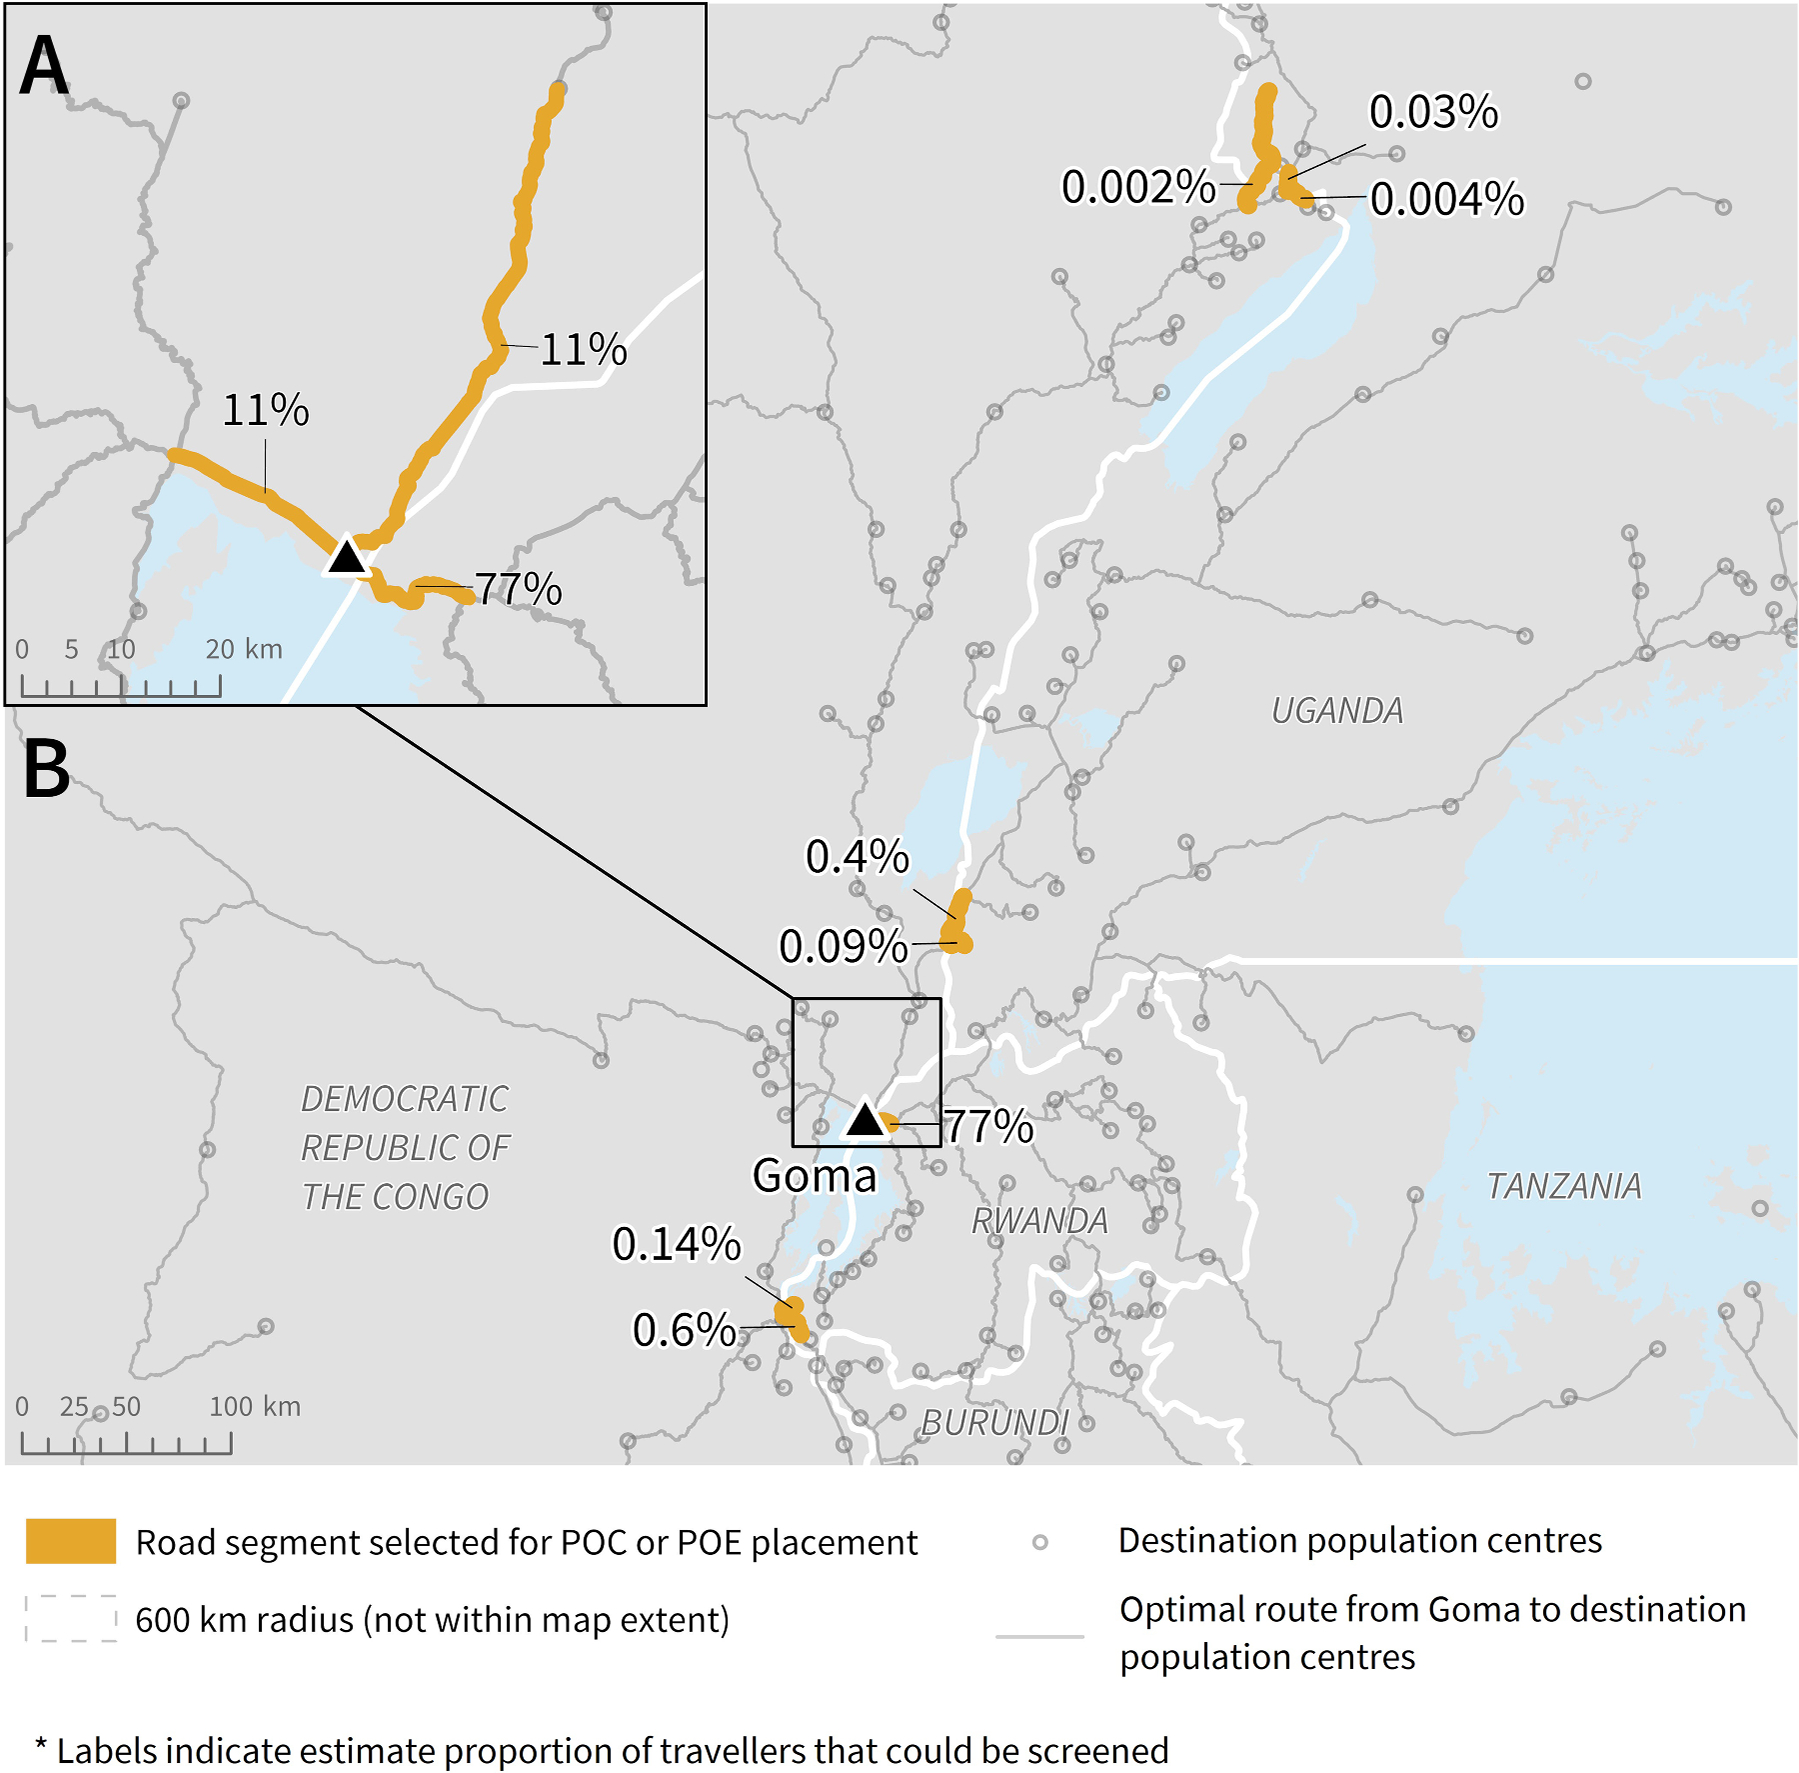
Potential road segments for POC or POE placement based on radiation model and route results, to screen the highest volume of travellers leaving A) Goma and B) DRC into neighbouring countries. Note: The length of each segment (highlighted or not) was determined by the road segment length in the data. To be able to screen the estimated percent of travellers, the individuals would need to be screened along the highlighted section before having the option to turn onto another road or proceed onto a different road type.
3.3. Mpondwe, Uganda
Population centres estimated by the radiation model to have high likelihood of travel from Mpondwe were concentrated around the DRC-Uganda border (Fig. 6). Kisinga, Uganda had the highest likelihood of travel (42%), followed by Butembo, DRC (17%) (Table 3). Two population centres in Rwanda, Gisenyi-Ruhengeri and Kigali, were ranked within the top ten based on likelihood but had relatively lower likelihood compared to others in the DRC and Uganda. Both Gisenyi-Ruhengeri and Kigali are proximal to international airports.
Fig. 6.
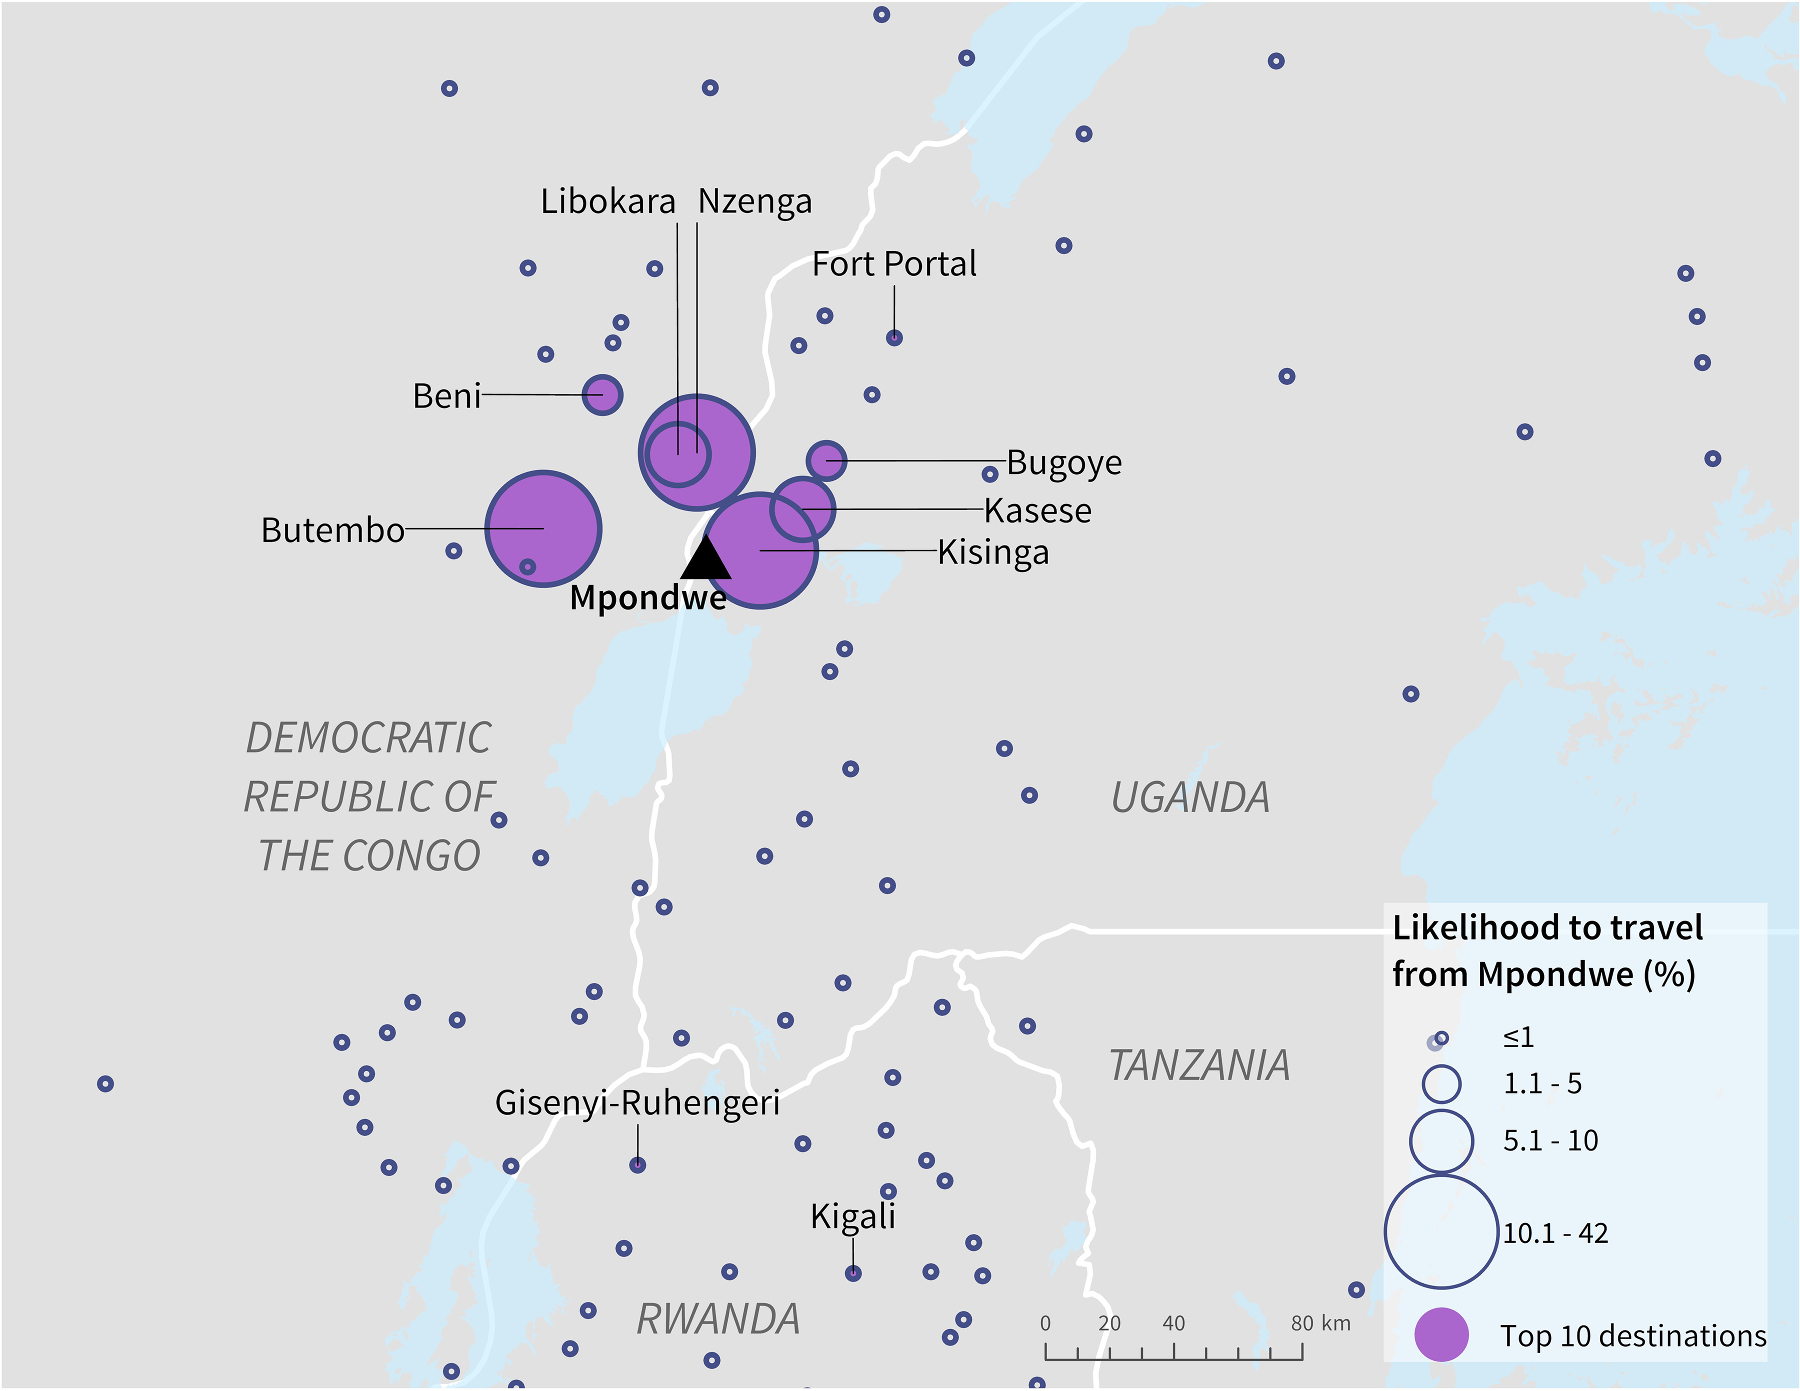
Likelihood of ground travel from Mpondwe, Uganda, to surrounding population centres as estimated by the radiation model.
Table 3.
Top ten population centres based on likelihood of ground travel from Mpondwe, Uganda, as estimated by the radiation model.
| Population centre name | Country | Population | Likelihood of travel from Mpondwe, Uganda |
|---|---|---|---|
|
| |||
| Kisinga | UG | 107,567 | 41.7% |
| Butembo | DRC | 1,178,303 | 16.7% |
| Nzenga | DRC | 64,944 | 11.7% |
| Kasese | UG | 148,799 | 10% |
| Libokara | DRC | 82,688 | 9.5% |
| Bugoye | UG | 45,021 | 2% |
| Beni | DRC | 327,758 | 1.2% |
| Gisenyi-Ruhengeri ¶ | RW | 2,633,601 | 0.7% |
| Fort Portal | UG | 175,897 | 0.3% |
| Kigali ¶ | RW | 1,518,435 | 0.2% |
indicates a population centre within 5 km of an international airport.
Country name acronyms: Democratic Republic of the Congo (DRC), Rwanda (RW), Uganda (UG), Burundi (BI).
Our model selected two road segments for POC placement to screen travellers directly leaving Mpondwe (Fig. 7A). One segment leads east and was estimated to carry 60% of travellers, with the other leading west into the DRC and estimated to carry 40% of travellers. Eight road segments were identified that carry travellers cross-border from Uganda (Fig. 7B). Many of the selected cross-border road segments were on Uganda’s southern borders with the DRC, Rwanda, and Tanzania. The road segment estimated to carry the highest volume of travellers cross-border leads into DRC; this segment was the same segment selected for screening travellers leaving Mpondwe directly.
Fig. 7.
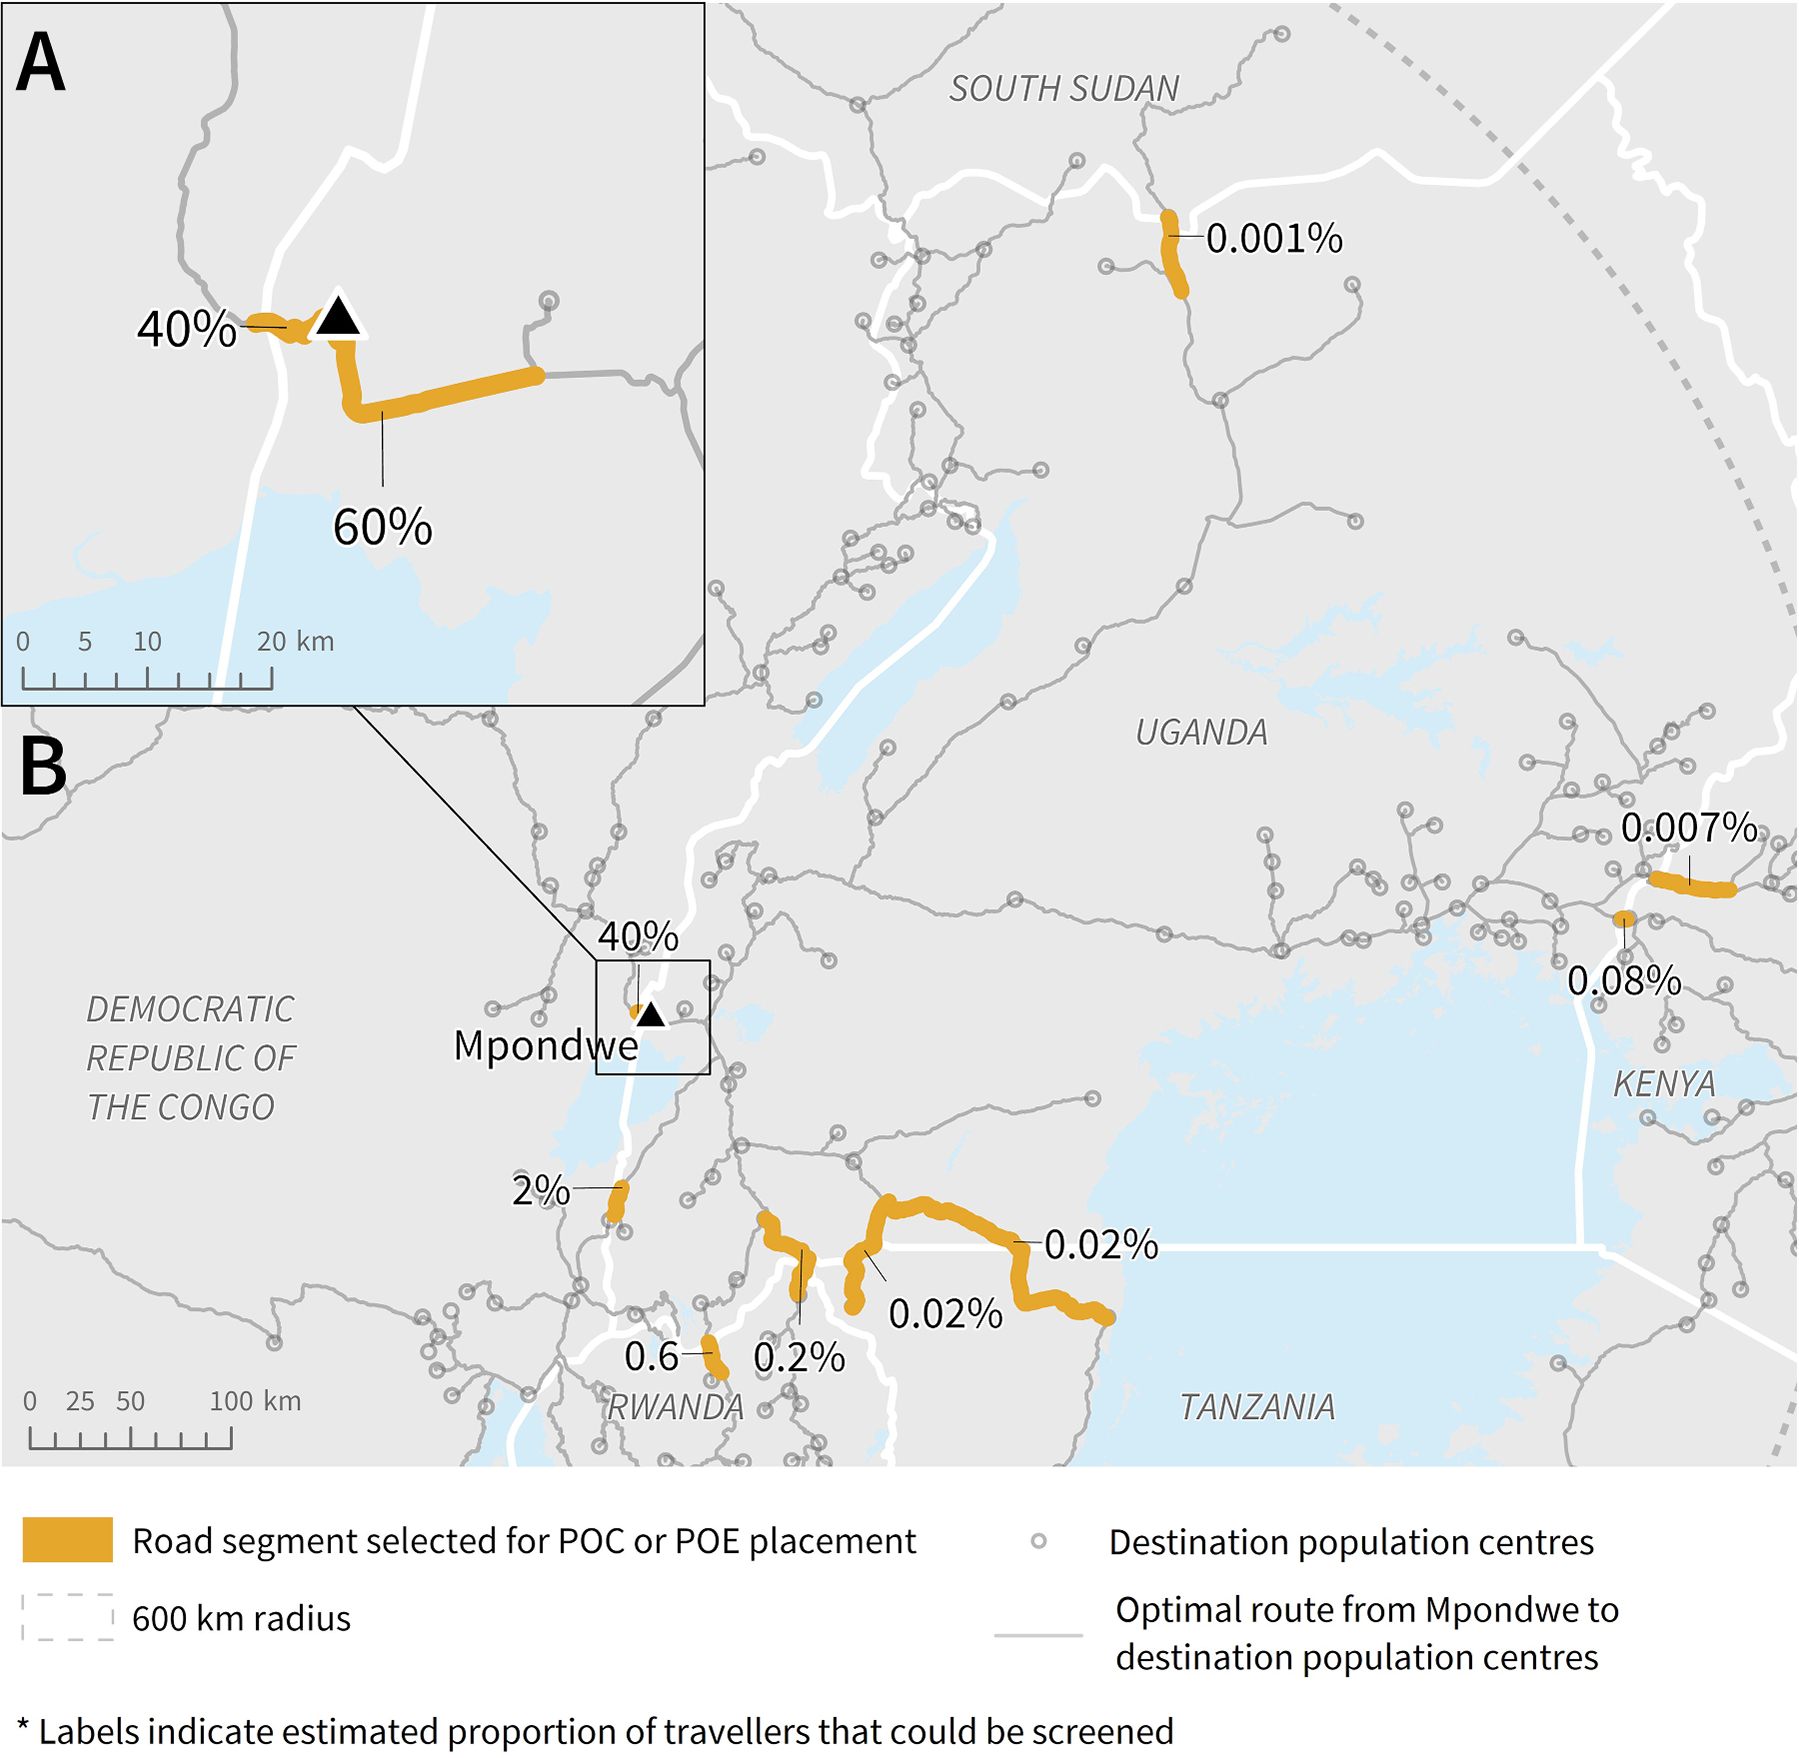
Potential road segments for POC or POE placement based on radiation model and route results, to screen the highest volume of travellers leaving A) Mpondwe and B) Uganda into neighbouring countries. Note: The length of each segment (highlighted or not) was determined by the road segment length in the data. To be able to screen the estimated percent of travellers, the individuals would need to be screened along the highlighted section before having the option to turn onto another road or proceed onto a different road type.
4. Discussion
Our study demonstrates the potential for general connectivity methods to help identify strategic locations along road networks that serve the most travellers from a selected geographic area. Specifically, radiation models could provide estimates of mobility with road network data to quantitatively select road segments suitable for POC or POE placement in the early stages of infectious disease outbreaks. While our study focused on an application to the 10th Ebola outbreak in the DRC, our methods could be applied for outbreaks of other infectious diseases where screening of travellers could be implemented. Observed mobility data is not required for this method, which is critical in public health situations where data does not yet exist or cannot be quickly collected. Indeed, locating POC or POE along high-ranking road segments derived from model results could facilitate screening the highest volumes of travellers. Importantly, quantifying the proportion of travellers that could be screened by placing a POC or POE along each road segment allows for prioritization based on estimated impact. These results could be used by public health leadership to optimally select locations for interventions such as public health screening of travellers to mitigate the geographic spread of communicable disease. This method could be especially valuable in large, multinational regions where cross-border information sharing may be limited and decision-making is spread among jurisdictions.
The radiation model may be more suitable to represent shorter-distance or more frequent travel routes (daily or weekly), while other model options such as the impedance model or gravity model may better capture longer-distance spread processes over longer time periods (Marshall et al., 2018; Sallah et al., 2017; Tuite et al., 2018). Evaluating shorter-term movement patterns over space and time is more appropriate to approximate scenarios in the early stages of an outbreak where communicable disease is transmitted from an epicentre to neighbouring regions, largely driven by human mobility (Balcan et al., 2009; Cliff & Haggett, 2004; Tuite et al., 2018). In a previous study, Marshall et al. (2018) applied a variation of the radiation model to understand human mobility in Mali, Burkina Faso, Zambia and Tanzania, and found that the model captured most mobility trends well when compared to observed movement patterns. Tuite et al. (2018) applied the radiation model to estimate the mobility of Venezuelan nationals migrating due to economic and political crisis in their country, and found that the radiation model performed well in comparison with publicly available data. The authors of both studies noted that radiation model results were more suitable for identifying nearby locations where travellers or migrants were initially drawn. Without access to detailed data on local mobility patterns in the DRC and neighbouring countries, it is not possible to determine how well our modeled results represent the true mobility of this population.
Considering some specific results of our model exemplifies how this approach could guide real-world POC or POE placement. For example, population centres such as Gisenyi-Ruhengeri and Kigali in Rwanda were estimated to be highly connected to our origin population centres and imported cases to these population centres would have caused significant concern due to their high potential for facilitating international spread. Decision makers may have prioritized placing POC or POE along these routes. Additionally, reported cases in neighbouring regions have provided some validation of our results. Road segment selection based on travel from Beni, DRC, aligned with the travel route of the three EVD-infected individuals discovered in Uganda on June 12, 2019, and another on August 29, 2019. These individuals had crossed the DRC-Uganda border along the same route that our model identified as highest priority to screen individuals travelling cross-border (DRC Ministry of Health, 2019a; Médecins Sans Frontières, 2019; WHO, 2019d). While further validation is warranted, alignment with this observed event supports our results.
The methods applied in this analysis maintain numerous strengths related to both ease of execution and practical application to public health interventions. Our technique is far less resource intensive than other strategies that require data collection on observed movement patterns. There are minimal required data inputs to execute our methods; only population and distance are required. Necessary data processing can be limited by using Euclidean diseance as the distance input for the radiation model rather than drive-time. Many datasets incorporated in this analysis were open access and all datasets had global coverage, so these methods could be applied to any outbreak scenario where similar interventions are relevant. Additionally, these methods provide an efficient way to identify potential locations for interventions related to ground-level mobility, which could be automated. Importantly, results could improve how decision makers quantitatively analyze the expected impact of POC or POE placement at various locations to prioritize highest-impact locations. In a situation where POC or POE have already been implemented, results can identify important routes that have not yet been considered by qualitative decision-making processes.
While this analysis has the potential to improve spatially targeted intervention strategies, the method comes with several limitations. First, because the radiation model only incorporates distance (or drive-time) and population as inputs, a variety of additional social and cultural push and pull factors that influence likelihood to travel to various destinations are not considered. In this region in particular, internal displacements and cross-border migrations due to the major conflicts should also be considered. Indeed, the potential to travel off-road (i.e., through forests or over water) was not incorporated when defining routes between population centres. For example, over 20,000 Congolese refugees had reportedly crossed Lake Albert to reach Uganda in a single week in 2018 (UN News, 2018). However, distance measures can be sufficient for region-wide measures of connectivity to select more attractive population centres assuming opportunities for access to goods or services (Simini et al., 2012). Second, the route analysis incorporated only the single optimal route from each origin population centre to each potential destination, though it is likely that travellers do not always take the optimal route in dynamic circumstances. Our estimates of population movement along the road segments are therefore likely overestimates of the true value. Third, conducting a route analysis relies on having accurate and complete road network data. While OSM provided data on a detailed network of roads in our study area, the accuracy and completeness of this dataset is unknown. However, incomplete data is not uncommon in rural or underdeveloped settings.
This work provided an important proof of concept for the utility of our methods. For use cases where there is a dearth of observed data on ground-level mobility, such as the EVD outbreak in the DRC described in this study, our methods could be particularly useful. Conversely, this dearth of observed data limits opportunities for model validation. Future research could build upon our findings by applying the described methods to a study area where sufficient data on observed ground-level mobility (such as anonymized call detail records from cell phones) is available, to offer a comparison to and validation of model results.
5. Conclusions
Ultimately, our modeling approach could be a cost-effective tool for decision makers to identify suitable POC and POE locations efficiently and systematically, in a way that can complement expert-opinion and field-based data collection strategies such as those applied during the 2019–2020 EVD outbreak in the DRC. Results could be used to verify or enhance local knowledge on the ground or identify travel routes not previously identified using qualitative methods. Communicable disease outbreaks often change dramatically in incidence and pattern of spatial spread; our methods could be readily re-applied to accommodate rapidly changing circumstances.
In conclusion, this study has introduced the potential for parameter-free models and simple spatial selection decision-support tools to select and quantitatively prioritize screening locations during the early stages of infectious disease outbreaks. Importantly, we have provided methods for estimating the proportionate impact on the ability to screen travellers that POC or POE would have based on their location. These are critical insights in outbreak situations where timely decisions must be made to implement preparedness and response interventions most effectively.
Supplementary Material
Abbreviations:
- DRC
Democratic Republic of the Congo
- EVD
Ebola virus disease
Footnotes
Declaration of Competing Interest
KK is the founder of BlueDot, a global infectious disease intelligence company for private and public enterprises. CH, AW, ATB, and AT received employment or consulting income from BlueDot during this research.
Disclaimer: The findings and conclusions in this report are those of the authors and do not necessarily represent the official position of the United States Centers for Disease Control and Prevention. Use of trade names and commercial sources is for identification only and does not imply endorsement by the United States Centers for Disease Control and Prevention.
Supplementary materials
Supplementary material associated with this article can be found, in the online version, at doi:10.1016/j.sste.2022.100558.
Data availability
The authors do not have permission to share data.
References
- Balcan D, Colizza V, Goncalves B, Hu H, Ramasco JJ, Vespignani A, 2009. Multiscale mobility networks and the spatial spreading of infectious diseases. Proc. Natl. Acad. Sci. 106 (51), 21484–21489. 10.1073/pnas.0906910106. [DOI] [PMC free article] [PubMed] [Google Scholar]
- Beine M, Bertoli S, Jesús FM, 2015. A practitioner’s guide to gravity models of international migration. World Econ. 39 (4) 10.1111/twec.12265. [DOI] [Google Scholar]
- Blanford JI, Kumar S, Luo W, Maceachren AM, 2012. It ‘s a long, long walk: accessibility to hospitals, maternity and integrated health centers in Niger. Int. J. Health Geogr. 11 (24), 1–15. [DOI] [PMC free article] [PubMed] [Google Scholar]
- CDC. (2019). Ebola outbreak in eastern Democratic Republic of the Congo tops 1,000 cases. https://www.cdc.gov/media/releases/2019/s0322-ebola-congo.html. [Google Scholar]
- CDC, 2021. Ebola in Democratic Republic of the Congo. Travelers’ Health. https://wwwnc.cdc.gov/travel/notices/warning/ebola-democratic-republic-of-the-congo. [Google Scholar]
- Cliff A, Haggett P, 2004. Time, travel and infection. Br. Med. Bull. 69 (1), 87–99. 10.1093/bmb/ldh011. [DOI] [PubMed] [Google Scholar]
- DRC Ministry of Health. (2019a). Ministry of Health communication on first case of Ebola Virus Disease detected in Uganda. https://us13.campaign-archive.com/?u=89e5755d2cca4840b1af93176&id=54420e2e17. [Google Scholar]
- DRC Ministry of Health. (2019b). Strategic response plan for the Ebola virus disease outbreak in the provinces of North Kivu and Ituri. [Google Scholar]
- Esri. (2019a). “Topographic” [basemap]. http://www.arcgis.com/home/item.html?id=30e5fe3149c34df1ba922e6f5bbf808f. [Google Scholar]
- Esri. (2019b). OD cost matrix analysis. http://desktop.arcgis.com/en/arcmap/latest/extensions/network-analyst/od-cost-matrix.htm. [Google Scholar]
- Esri. (2019c). Route analysis. http://desktop.arcgis.com/en/arcmap/latest/extensions/network-analyst/route.htm. [Google Scholar]
- Geofabrik. (2019). OpenStreetMap data extracts. http://download.geofabrik.de/africa.html. [Google Scholar]
- Google. (2019). Google maps. https://www.google.com/maps. [Google Scholar]
- IATA. (2018). Passenger intelligence services (PaxIS). http://www.iata.org/services/statistics/intelligence/paxis/Pages/index.aspx. [Google Scholar]
- IOM. (2019a). Democratic Republic of the Congo (DRC): flow monitoring dashboard (Issues 17–24 July 2019). [Google Scholar]
- IOM. (2019b). DRC EVD - points d’entrees. In ArcGIS Online. http://who.maps.arcgis.com/apps/webappviewer/index.html?id=2360e85be4f74eb9ab55d3e9eb8125e6. [Google Scholar]
- IOM. (2019c). Ebola virus disease (EVD) response in DRC: situation report (Issues 1–14 April 2019). [Google Scholar]
- Kraemer MUG, Faria NR, Reiner RC, Golding N, Nikolay B, Stasse S, Johansson MA, Salje H, Faye O, Wint GRW, Niedrig M, Shearer FM, Hill SC, Thompson RN, Bisanzio D, Taveira N, Nax HH, Pradelski BSR, Nsoesie EO, Cauchemez S, 2017. Spread of yellow fever virus outbreak in Angola and the Democratic Republic of the Congo 2015–16: a modelling study. Lancet Infect. Dis. 17 (3), 330–338. 10.1016/S1473-3099(16)30513-8. [DOI] [PMC free article] [PubMed] [Google Scholar]
- Marshall JM, Wu SL, Hector MSC, Kiware SS, Ndhlovu M, Ouédraogo AL, Touré MB, Sturrock HJ, Ghani AC, Ferguson NM, 2018. Mathematical models of human mobility of relevance to malaria transmission in Africa. Sci. Rep. 8 (1), 1–12. 10.1038/s41598-018-26023-1. [DOI] [PMC free article] [PubMed] [Google Scholar]
- Médecins Sans Frontières. (2019). Crisis update - November 2019. https://www.msf.org/drc-ebola-outbreak-crisis-update. [Google Scholar]
- Oak Ridge National Laboratory. (2017). LandScanTM. https://landscan.ornl.gov/. [Google Scholar]
- Moisés OA, Royuela V, Xavier V, 2020. Identifying Functional Urban Areas in Ecuador Using a Varying Travel Time Approach: FUAs in Ecuador: a varying travel time approach. Geogr. Anal. 52 (1), 107–124. 10.1111/gean.12190. [DOI] [Google Scholar]
- Sallah K, Giorgi R, Bengtsson L, Lu X, Wetter E, Adrien P, Rebaudet S, Piarroux R, Gaudart J, 2017. Mathematical models for predicting human mobility in the context of infectious disease spread: introducing the impedance model. Int. J. Health Geogr. 16 (42), 1–11. 10.1186/s12942-017-0115-7. [DOI] [PMC free article] [PubMed] [Google Scholar]
- Schlein L (2019, August 2). Congo: 4th case of ebola confirmed. VOA News. https://www.voanews.com/africa/congo-4th-case-ebola-confirmed. [Google Scholar]
- Simini F, González MC, Maritan A, Barábasi AL, 2012. A universal model foŕ mobility and migration patterns. Nature 484, 96–100. [DOI] [PubMed] [Google Scholar]
- Tuite AR, Thomas-Bachli A, Acosta H, Bhatia D, Huber C, Petrasek K, Watts A, Yong JHE, Bogoch II, Khan K, 2018. Infectious disease implications of large-scale migration of Venezuelan nationals. J. Travel Med. 25 (1), 1–8. 10.1093/jtm/tay077. [DOI] [PMC free article] [PubMed] [Google Scholar]
- UN News. (2018, February 13). Fleeing DR Congo violence, thousands take perilous lake journey to Uganda. https://news.un.org/en/story/2018/02/1002592. [Google Scholar]
- Vinck P, Pham PN, Bindu KK, Bedford J, Nilles EJ, 2018. Institutional trust and misinformation in the response to the 2018–19 Ebola outbreak in North Kivu, DR Congo: a population-based survey. Lancet Infect. Dis. 19 (5), 529–536. 10.1016/S1473-3099(19)30063-5. [DOI] [PubMed] [Google Scholar]
- WHO. (2018). Ebola virus disease, Democratic Republic of the Congo, external situation report 13. [Google Scholar]
- WHO. (2019a). Ebola virus disease, Democratic Republic of the Congo, external situation report 43. [Google Scholar]
- WHO. (2019b). Ebola virus disease – Democratic Republic of the Congo. https://www.who.int/csr/don/09-may-2019-ebola-drc/en/. [Google Scholar]
- WHO. (2019c). Ebola virus disease – Republic of Uganda. https://www.who.int/csr/don/13-june-2019-ebola-uganda/en/. [Google Scholar]
- WHO. (2019d). Ebola virus disease in Uganda, Situation report 1. June, 1–5. [Google Scholar]
- WHO. (2019e). Statement on the meeting of the international health regulations (2005) emergency committee for ebola virus disease in the Democratic Republic of the Congo on 17 July 2019 [Meeting proceedings]. https://www.who.int/ihr/procedures/statement-emergency-committee-ebola-drc-july-2019.pdf. [Google Scholar]
- WHO. (2020a). Ebola in the Democratic Republic of the Congo 2020, Équateur Province. https://www.who.int/emergencies/diseases/ebola/ebola-health-update-équateur-province-democratic-republic-of-the-congo-2020. [Google Scholar]
- WHO. (2020b). Ebola virus disease, Democratic Republic of the Congo, external situation report 86. https://www.who.int/emergencies/diseases/ebola/drc-2019/situation-reports. [Google Scholar]
- WHO. (2020c). Ebola virus disease, Democratic Republic of the Congo, external situation report 98. Situation report, 1–9. https://apps.who.int/iris/bitstream/handle/10665/311641/SITREP_EVD_DRC_20190331-eng.pdf?ua=1. [Google Scholar]
- WHO. (2021). Ebola, North Kivu, Democratic Republic of the congo, 2021. https://www.who.int/emergencies/situations/ebola-2021-north-kivu. [Google Scholar]
Associated Data
This section collects any data citations, data availability statements, or supplementary materials included in this article.
Supplementary Materials
Data Availability Statement
The authors do not have permission to share data.


