Abstract
Tumor expression of prostate-specific membrane antigen (PSMA) is lost in 15–20% of men with castration-resistant prostate cancer (CRPC), yet the underlying mechanisms remain poorly defined. In androgen receptor (AR)-positive CRPC, we observed lower PSMA expression in liver lesions versus other sites, suggesting a role of the microenvironment in modulating PSMA. PSMA suppression was associated with promoter histone 3 lysine 27 methylation and higher levels of neutral amino acid transporters, correlating with 18F-fluciclovine uptake on positron emission tomography imaging. While PSMA is regulated by AR, we identified a subset of AR-negative CRPC with high PSMA. HOXB13 and AR co-occupancy at the PSMA enhancer and knockout models point to HOXB13 as an upstream regulator of PSMA in AR-positive and AR-negative prostate cancer. These data demonstrate how PSMA expression is differentially regulated across metastatic lesions and in the context of the AR, which may inform selection for PSMA-targeted therapies and development of complementary biomarkers.
PSMA is a transmembrane protein that is expressed at the cell surface of the majority of prostate cancers1,2. PSMA may be visualized non-invasively by positron emission tomography (PET) imaging and also targeted therapeutically1,3. The PSMA-targeted radionuclide 177Lu-PSMA-617 was approved by the US Food and Drug Administration (FDA) in 2022 for men with CRPC with confirmed PSMA-positive disease identified by 68Ga-PSMA-11 PET–computed tomography (CT)4. Despite this major advancement in the field, not all patients with PSMA-positive prostate cancer respond to PSMA-directed therapy, which may be in part due to heterogeneity of target expression5. Furthermore, up to 15–20% of patients lose PSMA expression in later stages of prostate cancer progression and are not eligible for PSMA-directed therapies4,6. Identifying the patients most likely to achieve durable benefit from PSMA-targeted drugs will depend on a better understanding of how the target PSMA is regulated.
It is well recognized that expression of the PSMA gene FOLH1 is indirectly regulated by the AR and that PSMA is highly expressed in the majority of AR-driven CRPC tumors7; however, a subset of CRPC tumors lose AR expression and/or canonical AR signaling, and this has been associated with lineage plasticity and the development of treatment-emergent neuroendocrine prostate cancer (NEPC); these tumors may also lose PSMA8,9. Previously, an enhancer region was identified as a major regulatory element for PSMA (FOLH1) that considerably activates the PSMA core promoter region10,11. In addition, four AR-binding peaks involving introns of the PSMA (FOLH1) gene have been recorded7,12; however, it is still unclear how AR and PSMA expression are lost in a subset of CRPC, and the underlying clinical and molecular characteristics of PSMA-low tumors are not yet defined.
Results
PSMA suppression in liver metastases: seed and soil
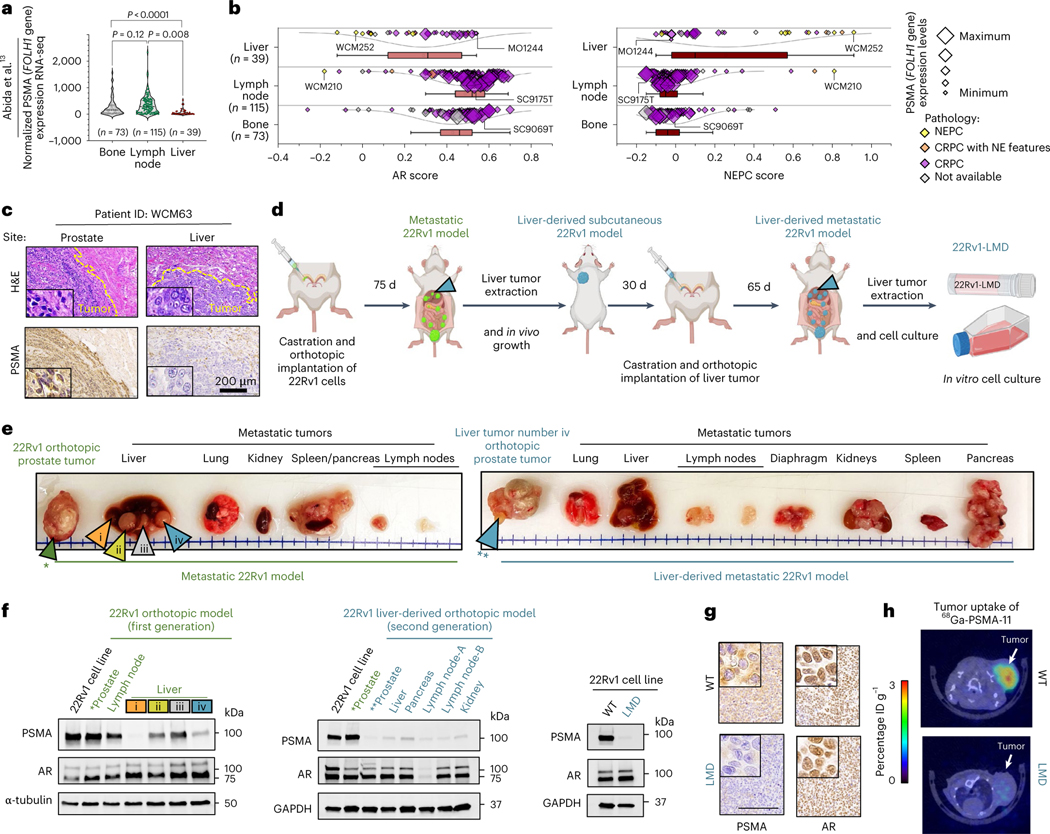
We hypothesized that the level of PSMA expression may vary across sites of metastases, even in patients with PSMA-positive CRPC, and this heterogeneity contributes to the poor prognosis of patients with liver metastases treated with 177Lu-PSMA-617 (ref. 4). Analysis of transcriptome data from the International Stand up to Cancer (SU2C)/Prostate Cancer Foundation (PCF) Dream Team CRPC dataset13 identified overall lower PSMA (FOLH1 gene) expression in liver metastases compared to other sites of metastatic disease (Fig. 1a). We confirmed that metastatic CRPC tumors with low AR signaling, either NEPC or adenocarcinoma histology, also have lower expression of PSMA (Fig. 1b and Extended Data Fig. 1a). In liver metastases, low PSMA expression was seen in both AR-positive and AR-negative liver metastases and this was independent of canonical AR signaling or NEPC gene programs, suggesting a potential alternative regulation of PSMA expression in liver metastases. We did not observe a similar association for KLK3 (PSA) expression in liver metastases (Extended Data Fig. 1b,c). We also evaluated PSMA expression in temporally matched prostate and liver CRPC tumor tissues obtained at autopsy from a patient with widely metastatic PSMA-positive CRPC identified by PSMA PET, and confirmed lower PSMA protein expression in the liver (Fig. 1c and Extended Data Fig. 2a).
Fig. 1 |. Suppression of PSMA in prostate cancer liver metastases.
a, Expression of PSMA gene (FOLH1) and sites of metastasis in the International SU2C/PCF Dream Team CRPC dataset13. b, AR score (left) and NEPC score (right) among liver (n = 39 tumors), lymph node (n = 115 tumors) and bone (n = 73 tumors) metastatic CRPC in the SU2C/PCF dataset13. The size of data points is proportional to the level of PSMA gene expression in each sample. The lines and squares inside each box are the median and mean, respectively. The upper box border represents the 75th quartile, lower box border represents the 25th quartile and whiskers represent the outlier by using the 1.5 interquartile range rule. c, IHC showing PSMA protein expression of tumor tissues obtained at autopsy in a patient with CRPC with concurrent primary prostate and liver metastasis (case report). H&E, hematoxylin and eosin. d, Schematic of the development of the liver-derived metastatic 22Rv1 model. e, Representative images of spontaneous metastatic tumors following orthotopic injection of 22Rv1 cell lines to the left anterior prostate lobe of a castrated mouse (left) and spontaneous metastatic tumors in a second-generation liver-derived 22Rv1 orthotopic tumor model. Green arrow points to primary prostate tumor. Orange, yellow, gray and blue colored arrows indicate four metastatic tumors (i–iv) in liver. *refers to the 1st generation orthotopic model and **refers to the 2nd generation liver-derived orthotopic model. f, Western blot analyses of PSMA, AR and HOXB13 protein levels in the first-generation 22Rv1 orthotopic model (left), second-generation liver-derived orthotopic model (center) and 22Rv1 cell line models (right). g, Tissue sections from primary tumor and liver metastases of subcutaneous 22Rv1 model stained with PSMA (left) and AR (right) antibodies. Scale bar, 200 μm. h, 68Ga-PSMA-11 PET–CT images of 22Rv1-WT and 22Rv1-LMD tumors in an athymic nude male mouse bearing subcutaneous tumor xenografted on the left shoulder (1 h after injection). ID, injected dose. In a, data were analyzed by one-way analysis of variance (ANOVA) followed by Tukey’s multiple comparison tests. In e–g, the representative blots and IHCs are shown for n = 2 independently collected samples. In h, representative images are shown for n = 3 mice models.
To understand whether the observed lower expression of PSMA in liver metastases is driven by tumor-intrinsic features (the ‘seed’) or the tumor microenvironment (the ‘soil’), we developed two in vivo orthotopic xenograft models using the AR-positive, PSMA-positive cell line 22Rv1 by directly implanting cells either to the prostate (n = 4) or liver (n = 4) of castrated mice. When orthotopically implanted into the left anterior prostate lobe, AR-positive, PSMA-positive prostate tumors develops. At 75 d, the mice spontaneously develop metastases to various sites, including the development of distinct PSMA-high, PSMA-low and PSMA-negative liver metastases that are all AR-positive with similar AR signaling scores (Fig. 1d–f and Extended Data Fig. 2b–h). These data are consistent with the inter-patient heterogeneity observed in patients and further support downregulation of PSMA in CRPC liver metastases. At the bulk transcriptome level, there was higher global similarity among primary prostate tumors and metastatic tumors from lymph nodes, while metastatic tumors from liver had the highest degree of global heterogeneity (Extended Data Fig. 2i,j).
We next developed a second-generation orthotopic model by re-implanting the PSMA-low 22Rv1 liver metastasis back into the prostate of the mouse. Spontaneous metastatic tumors again developed following orthotopic injection. This time, all metastatic lesions were PSMA-negative, including metastatic lymph node and liver lesions and they remained AR-positive (Fig. 1d–f). We cultured the PSMA-low 22Rv1-derived second-generation liver metastasis and immortalized this in vitro as a new cell line (22Rv1 liver metastasis-derived (LMD)), which remained AR-positive and PSMA-negative by western blot and immunohistochemistry (IHC) (Fig. 1f,g). When re-implanted subcutaneously, this PSMA-low 22Rv1-derived liver metastasis cell line xenograft (22Rv1-LMD) was confirmed to be PSMA-low by 68Ga-PSMA-11 PET–CT imaging, whereas control 22Rv1 xenografts are PSMA-positive by 68Ga-PSMA-11 PET–CT (Fig. 1h). This observation further confirms that pathological suppression of PSMA in metastatic AR-positive liver metastases is stable and leads to radiological suppression of 68Ga-PSMA-11 uptake. These data suggest that PSMA-low CRPC metastases can give rise to stably PSMA-low metastases in vivo and that at some point during prostate cancer progression, it is possible that tumor-intrinsic features (the seed) can overcome the microenvironment (the soil) as a dominant regulator of PSMA expression.
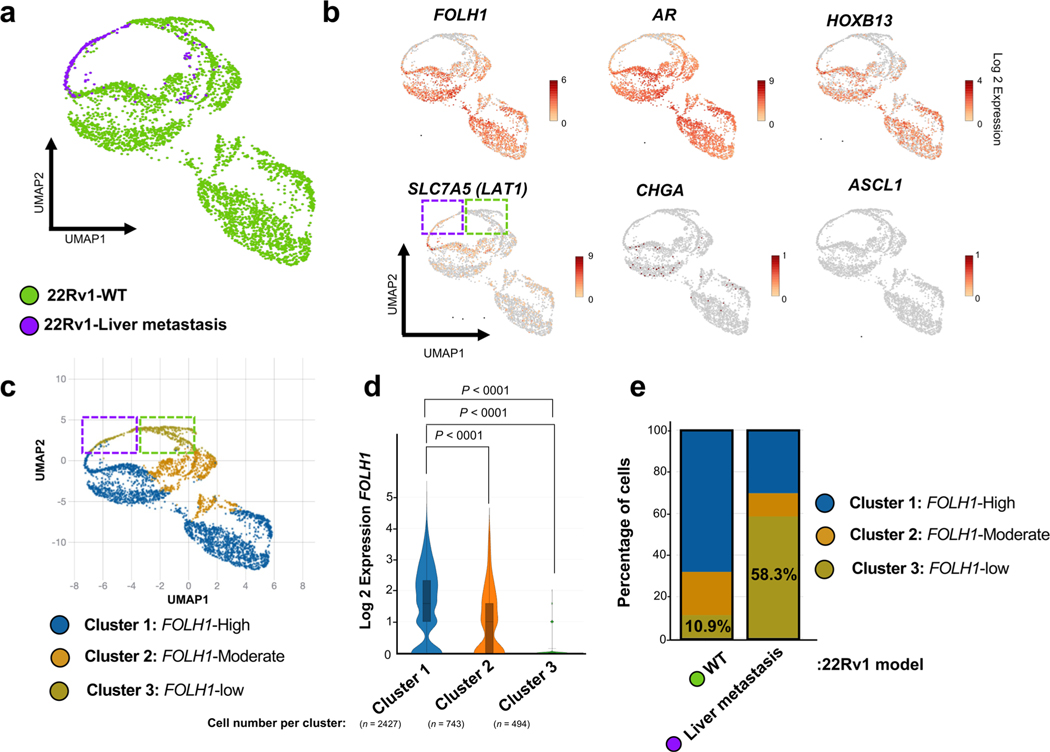
We reasoned that the observed PSMA-low phenotype in liver metastases could either be due to clonal selection of PSMA-low tumor cells preferentially to the liver or due to tumor-intrinsic changes influenced by the microenvironment. Single-cell transcriptome analysis revealed that only a minority of 22Rv1-wild-type (WT) cells (10.9%) are PSMA-suppressed, whereas 22Rv1 cells from PSMA-low liver metastasis were predominantly PSMA-low (58%) and transcriptionally distinct from WT cells (cluster 3; Extended Data Fig. 3); however, it is still plausible that PSMA-low cells in liver metastasis are a subpopulation of 22Rv1-WT. To further address this, we orthotopically implanted 1 million PSMA-positive 22Rv1 prostate cancer cells directly into the left-median lobe of the liver of castrated mice. At 35 d, the mice formed a multilobed tumor in the liver (Fig. 2a). Protein extraction and western blot analysis revealed significant PSMA suppression in liver 22Rv1 tumors compared to control prostate 22Rv1 tumors (Fig. 2b). From an intra-tumoral heterogeneity perspective, we examined the degree of PSMA heterogeneity within liver metastases and liver orthotopic tumors. In the first-generation 22Rv1 orthotopic model that metastasized to the liver (Fig. 2c,d), two adjacent AR-positive liver metastases developed (Fig. 2c); one was PSMA-negative (PL-E) and the other was PSMA-positive (PL-F) but with patchy PSMA positivity. In our new liver orthotopic model, similar to the metastatic model, two adjacent AR-positive liver tumors with adenocarcinoma histopathology developed (Fig. 2c); one was PSMA-low (OL-A) and the other was PSMA-positive (OL-B) but with patchy PSMA positivity (green arrows; Fig. 2a–c). Unexpectedly, we observed PSMA-negative and AR-negative tumors (OL-C) with neuroendocrine (NE)-like histopathology (yellow arrows; Fig. 2a–c). This observed intra-tumoral heterogeneity of PSMA expression within liver metastases with or without AR or NEPC features, in addition to inter-tumoral heterogeneity observed across sites of metastases, was further supported by digital spatial profiling (DSP) transcriptome data from the University of Washington (UW) Rapid Autopsy Program14 (Fig. 2f,g). Development of a PSMA-suppressed liver tumor with a mixed histopathology in the orthotopic liver model further supports PSMA suppression in liver occurring, at least in part, due to liver microenvironment rather than clonal selection of PSMA-low tumor cells (blue arrows; Fig. 2a–c). Future studies using lineage tracing may help to further characterize this.
Fig. 2 |. Intra-tumoral heterogeneity of PSMA in liver lesions.
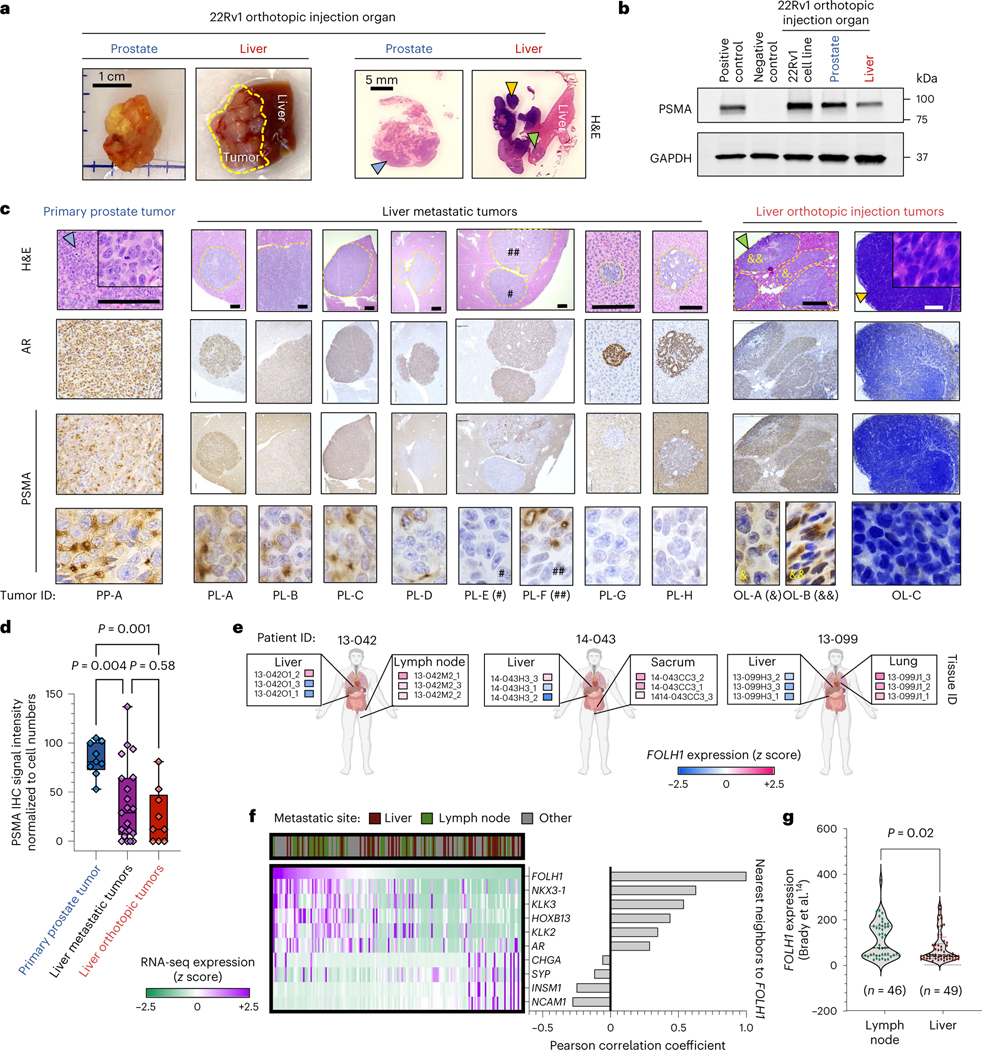
a, Representative image of the formed tumors following orthotopic injection of PSMA-positive 22Rv1 cell line to prostate and liver of mice (left) and H&E staining of tumor tissues (right). b, Western blot analyses of PSMA in 22Rv1 tumors following orthotopic injection to prostate in comparison with liver. c, PSMA and AR IHC and H&E staining in primary and liver metastases of prostate orthotopic 22Rv1 model in comparison to liver orthotopic 22Rv1 model. Scale bars, 200 μm d, PSMA IHC signal intensity in metastases of orthotopic 22Rv1 models, including primary prostate tumor (n = 9), liver metastatic tumors (n = 21) and liver orthotopic tumors (n = 9). The line inside each box is the median, upper box border represents the 75th quartile, lower box border represents the 25th quartile and whiskers represent the range. e, Expression levels of FOLH1 by DSP of three patients with CRPC from the UW Rapid Autopsy Program15. f, Heat map of DSP expression levels of PSMA gene (FOLH1), AR markers and NE markers in patients with CRPC from the UW dataset (n = 169 tumors). g, DSP expression levels of FOLH1 among samples from liver metastases versus lymph node metastases. The data were analyzed by either Student’s t-test (g) or one-way ANOVA followed by Tukey’s multiple comparison test (d). Representative blots are shown for n = 2 independently collected samples (b) or n = 3 mice (a,c).
PSMA is expressed in a subset of AR-negative prostate cancer
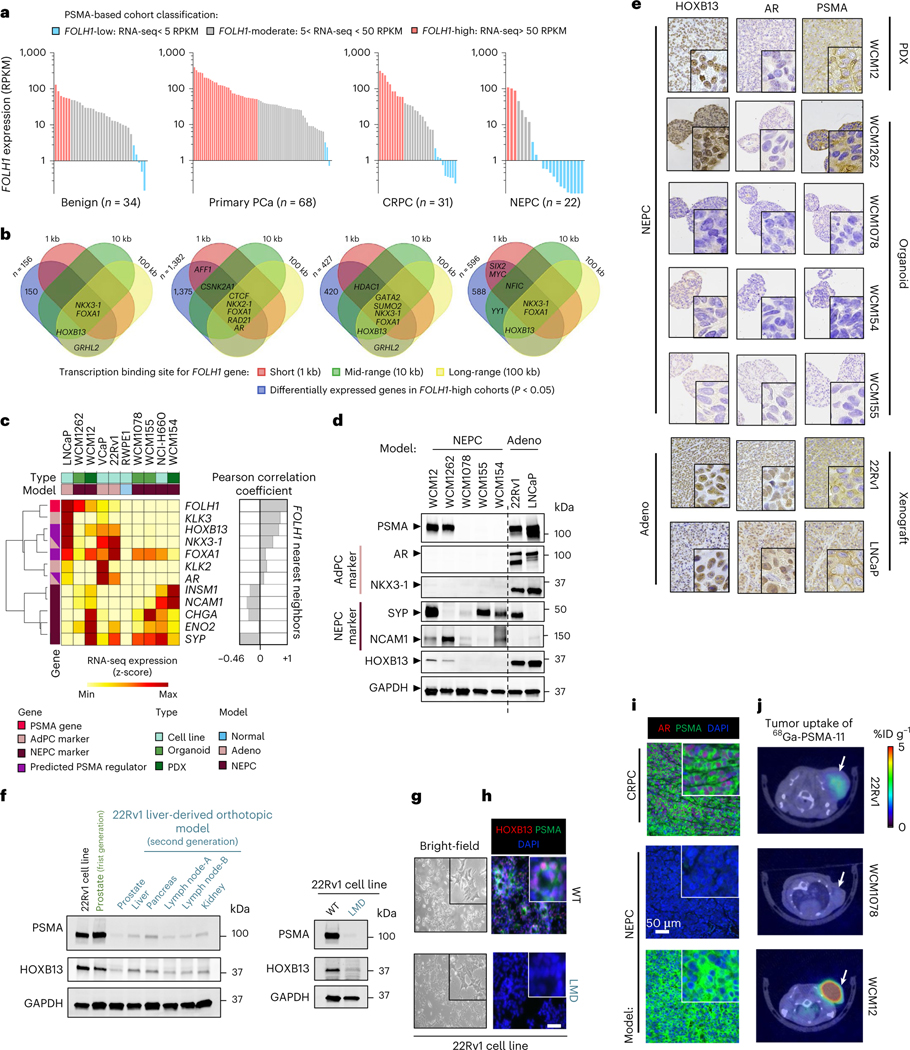
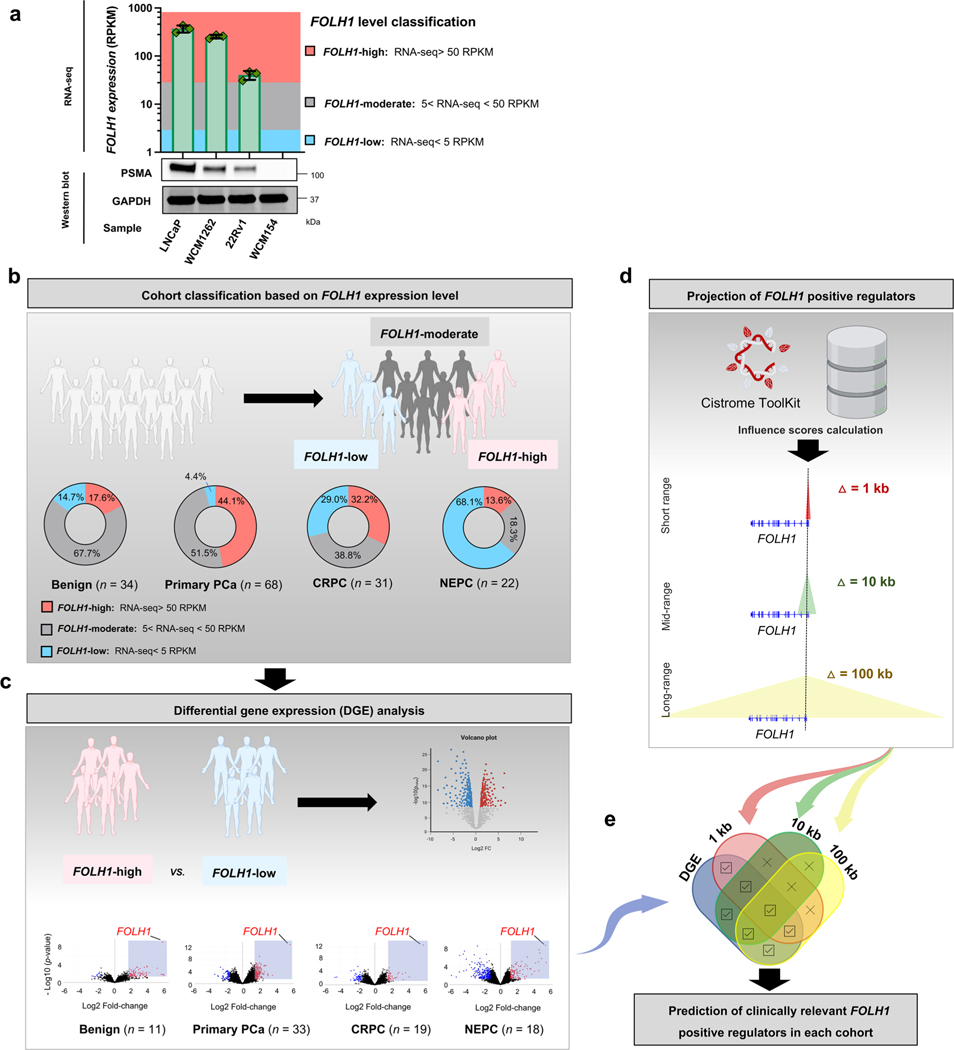
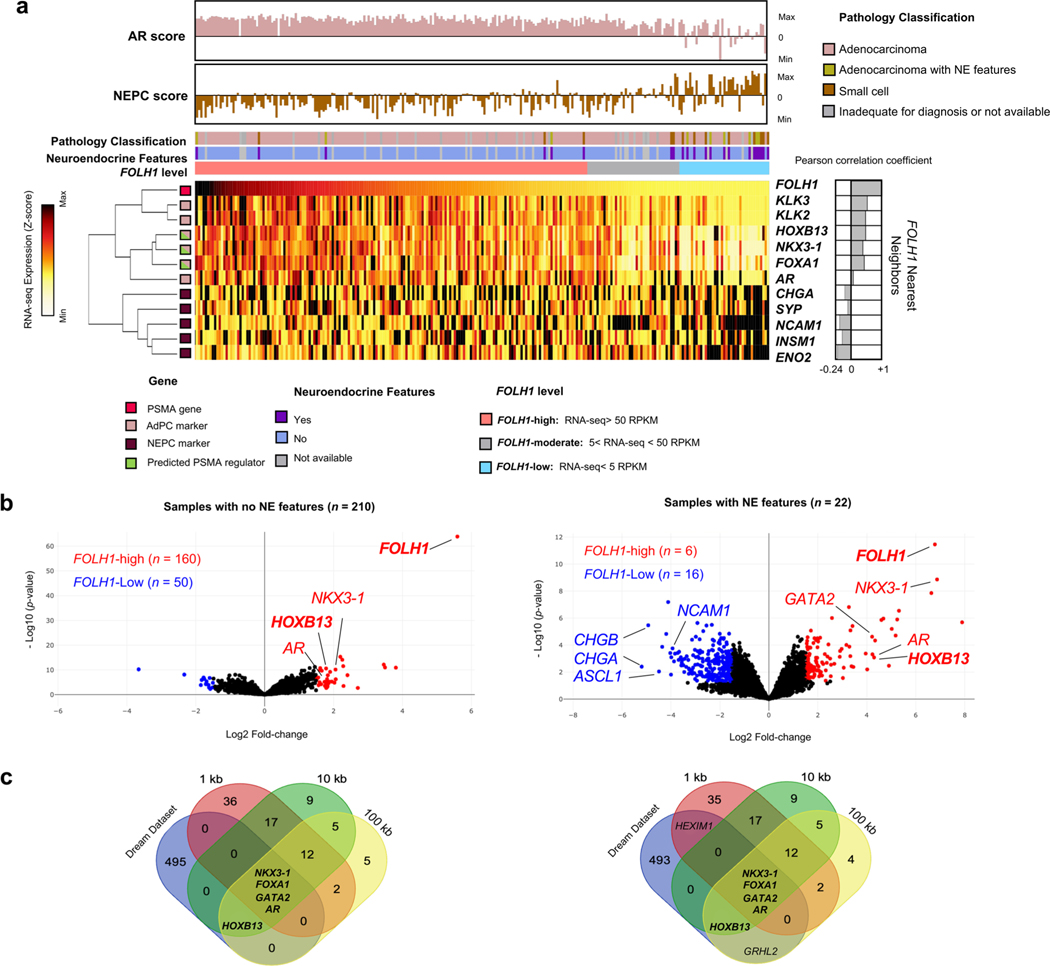
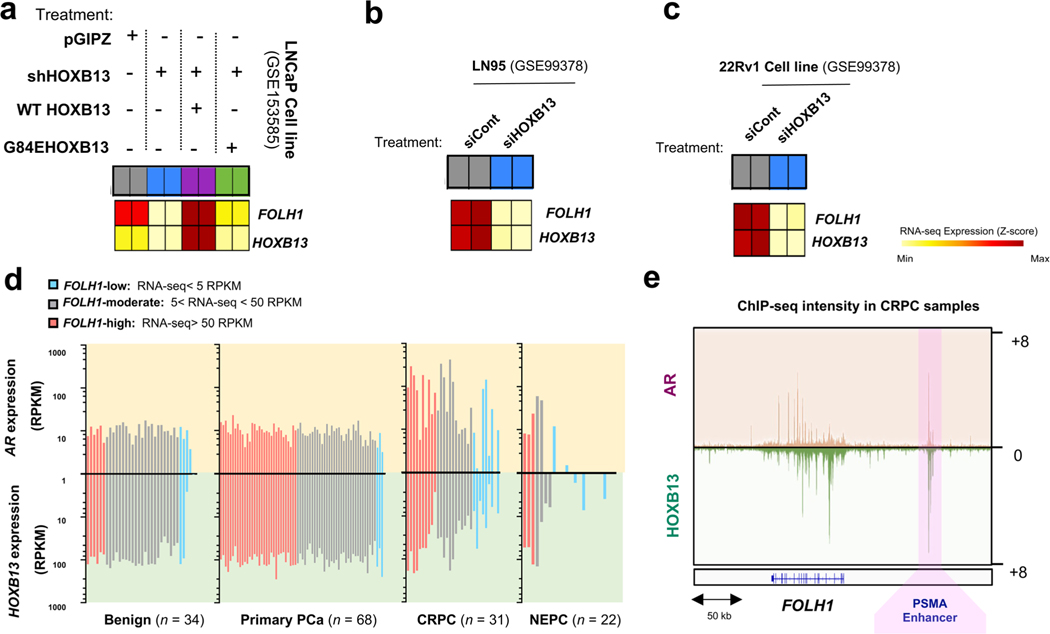
To identify potential regulators of PSMA during prostate cancer progression, we evaluated differentially expressed genes in PSMA-high samples with the projected positive regulatory elements of PSMA using the Cistrome Toolkit (Extended Data Fig. 4a). A schematic of our approach is shown in Extended Data Fig. 4b–e, which allowed for the estimation of clinically relevant FOLH1-positive regulators. When evaluating the expression of FOLH1 during the progression of prostate cancer toward NEPC (Fig. 3a), we found that the proportion of FOLH1-high tumors was at its maximum among primary prostate cancer samples and lowest among NEPC samples; however, unexpectedly we identified nearly a third of NEPC samples with either FOLH1-moderate or FOLH1-high expression (Fig. 3a and Extended Data Fig. 4b) and this was seen in both AR-positive and AR-negative disease. As a next step, differential gene expression (DGE) analysis was used to identify differentially expressed genes in FOLH1-high versus FOLH1-low samples (Extended Data Fig. 4c). As different transcription factors (TFs) may regulate FOLH1 over different ranges, short (1 kb), mid-range (10 kb) and long-range (100 kb) influence scores were calculated for each TF (Extended Data Fig. 4d). Finally, a Venn diagram of overlapping differentially expressed genes in FOLH1-high cohorts with the estimated FOLH1 regulator guided us to predict clinically relevant FOLH1-positive regulators (Extended Data Fig. 4b and Fig. 3b). Of these, HOXB13, NKX3–1 and FOXA1 were projected positive regulators of FOLH1 that seemed to be differentially expressed in the majority of FOLH1-high samples. Replication of the same analysis using RNA-seq data from the International SU2C/PCF dataset13 identified HOXB13, NKX3–1, AR and FOXA1 as core regulatory elements of the FOLH1 gene irrespective of NEPC features (Extended Data Fig. 5).
Fig. 3 |. Investigation of the PSMA cistrome across prostate cancer progression identifies a PSMA-positive subset of AR-negative NEPC tumors.
a, Expression levels of FOLH1 in prostate tumors during progression from benign to NEPC. RPKM, reads per kilobase of transcript per million reads mapped; PCa, prostate cancer. b, Venn diagrams illustrate the overlap of differentially expressed genes in FOLH1-high cohorts, with FOLH1 potential TFs estimated by Cistrome DB49. The four defined n values on the figure correspond to both a and b. c, Heat map of expression levels of PSMA gene (FOLH1), AR markers, NE markers and potential PSMA regulators in PCa models. AdPC, prostate adenocarcinoma. d, Western blot analyses of PSMA, adenocarcinoma (Adeno) markers, NEPC markers and HOXB13 protein levels. e, Tissue sections of different models stained with PSMA, AR and HOXB13 antibodies. f, Western blot analyses of PSMA and HOXB13 in the second-generation liver-derived orthotopic model (left) and 22Rv1 cell lines (right). g, Representative bright field photos of 22Rv1-WT (top) and 22Rv1-LMD (bottom) cell lines. h, Representative immunocytochemistry imaging of 22Rv1-WT (top) and 22Rv1-LMD (bottom) cell lines stained with 4,6-diamidino-2-phenylindole (DAPI) (blue), anti-PSMA (green) and anti-HOXB13 (red). i, Representative immunofluorescence imaging of NEPC and CRPC models stained with DAPI (blue), anti-PSMA (green) and anti-AR (red). j, 68Ga-PSMA-11 PET–CT images of athymic nude male mouse bearing subcutaneous tumor xenografted on the left shoulder (1 h after injection). Representative transverse planar image is shown. Representative images are shown for n = 2 independently collected samples (c–i) or n = 3 mice (j).
The observed subset of NEPC tumors that were FOLH1-high or FOLH1-moderate, regardless of AR expression, led us to investigate the possibility that expression of PSMA in AR-negative NEPC might result from one or more of these identified alternative TF regulators. A survey of FOLH1 messenger RNA expression across several prostate cell lines, organoids and patient-derived xenograft (PDX) models showed that FOLH1 expression is positively correlated with AR-activity markers such as KLK3 and NKX3–1 and negatively correlated with NEPC markers such as SYP and NCAM1 (Fig. 3c). While several of our NEPC patient-derived models (Weill Cornell Medicine (WCM)1078, WCM154 and WCM155) were expectedly negative for AR, NKX3–1, HOXB13 and PSMA, we identified two patient-derived NEPC models (WCM12 and WCM1262) that lacked AR and NKX3–1 expression but were positive for both PSMA and HOXB13 (Fig. 3d,e). Therefore, we focused our attention on HOXB13 as a potential upstream regulator of PSMA. Of note, the PSMA-suppressed 22Rv1 liver-derived orthotopic tumors and the 22Rv1-LMD cell line were also HOXB13-low, despite both being strongly AR positive (Fig. 3f–h). Overall, these data support an unlinking between the AR and PSMA expression and nominate HOXB13 as a potential regulator of PSMA in both AR-positive and AR-negative prostate cancer.
Immunofluorescence (IF) co-staining of anti-PSMA (green) and anti-AR (red) confirmed that while 22Rv1 CRPC cells are both AR- and PSMA-positive and the NEPC model WCM1078 cells are AR- and PSMA-negative, the NEPC PDX model WCM12 is indeed AR negative and PSMA positive (Fig. 3i). We evaluated radiological PSMA positivity of the WCM12 NEPC PDX model by 68Ga-PSMA-11 PSMA PET imaging (Fig. 3j), which confirmed high 68Ga-PSMA-11 uptake with comparable standardized uptake values (SUVs) as AR-positive CRPC tumors (22Rv1), whereas the NEPC model WCM1078 was confirmed to be PSMA negative by 68Ga-PSMA-11 PSMA PET (Fig. 3j). Overall, these data suggest that not all NEPC tumors are PSMA-negative by PET imaging, even when AR is absent. This may have important clinical implications when considering patient selection for PSMA-targeted therapies.
HOXB13 regulation of PSMA
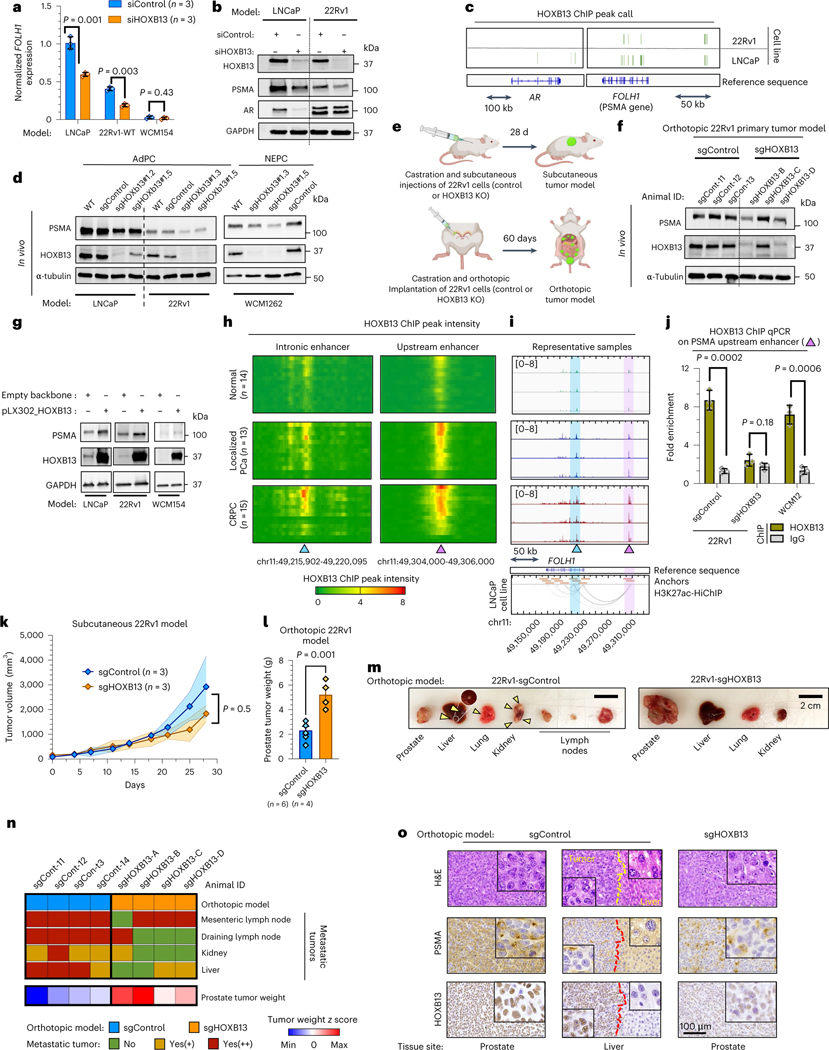
To further investigate the role of HOXB13 in the regulation of PSMA expression, we transfected AR-positive LNCaP and 22Rv1 prostate cancer cells with siControl or siHOXB13 (Fig. 4a,b). HOXB13 knockdown (KD) correlated with a significant reduction of FOLH1 (PSMA) mRNA and protein levels in both cell lines. Interrogation of previously published RNA-seq data15,16 also demonstrated a significant reduction in FOLH1 expression in 22Rv1, LN95 and LNCaP cell lines following HOXB13 KD using short hairpin RNA (shRNA) HOXB13 or siHOXB13 (Extended Data Fig. 6a–c). As expected, HOXB13 KD had no impact on PSMA expression in the PSMA-negative, HOXB13-negative WCM154 NEPC cell line (Fig. 4a). AR levels were reduced in LNCaP as a result of HOXB13 KD, but this was not observed in 22Rv1 (Fig. 4b). The green bar in Fig. 4c is a snapshot of peaks called by HOXB13 ChIP at the vicinity of AR (left) and FOLH1 (right) genes in 22Rv1 and LNCaP cell lines17. HOXB13 physically interacts with FOLH1 gene body and its upstream enhancer in 22Rv1 and LNCaP, whereas HOXB13 interacts with the AR gene body and its vicinity only in LNCaP. This observation is in line with the differences in protein levels of PSMA and AR in these two models. CRISPR/Cas9 knockout (KO) of HOXB13 in 22Rv1 and LNCaP cell lines as well as in the NEPC model WCM1262 led to a significant reduction in PSMA expression (Fig. 4d). Prostate tumor models generated by orthotopic injection of HOXB13 KD to the left anterior prostate lobe of castrated mice also had lower levels of PSMA protein compared to control (Fig. 4e,f).
Fig. 4 |. HOXB13 binds to intronic and upstream enhancers of PSMA gene and regulates its expression.
a, Expression of FOLH1 following KD of HOXB13. b, Western blot of HOXB13, PSMA and AR after treatment with siHOXB13 or siControl. c, Peak calls HOXB13 ChIP depicted with green bars at the vicinity of AR (left) and FOLH1 (right) (Gene Expression Omnibus (GEO) GSE96652 (ref. 17)). d, PSMA in control (sgControl) and two independent HOXB13-KO (sgHOXB13) models. e, Schematic of subcutaneous (top) and orthotopic (bottom) tumor models of 22Rv1-WT and HOXB13-KO cell lines. f, Western blot of PSMA and HOXB13 protein in orthotopic primary tumor models. g, Western blot of PSMA and HOXB13 protein before and after overexpression of HOXB13. h, Heat map of HOXB13 ChIP peak intensity at intronic (left) and upstream (right) enhancers of FOLH1 among healthy (n = 15 samples), localized PCa (n = 13 tumors) and CRPC (n = 15 tumors) samples from GSE130408 (ref. 33). i, HOXB13 ChIP intensity intronic (blue arrow) and upstream (purple arow) enhancers of FOLH1 gene shown at three representative healthy (green), localized PCa (blue) and CRPC (brown) samples (top). H3K27Ac-HiChIP loops in LNCaP cell line from Giambartolomei et al.22 (bottom). Loops from merged data of five replicates. j, ChIP–qPCR for HOXB13 chromatin binding at upstream enhancer of FOLH1. k, Comparison of subcutaneous tumor growth of sgControl and sgHOXB13 (Wilcoxon matched-pairs test). l, Weight of primary tumor following orthotopic injection of 22Rv1 (sgControl (n = 6 tumors) and sgHOXB13 (n = 4 tumors)) after 60 d. m, Representative images of spontaneous metastasis tumors following orthotopic injection of sgControl (left) and sgHOXB13 (right) 22Rv1 cell lines to prostate (yellow arrows indicate metastatic tumors). n, Heat map of metastatic tumor incidence and prostate tumor weight in orthotopic models. o, IHC of tissue sections of orthotopic 22Rv1 models. Representative blots are shown for n = 2 (b,d,g,f) independently collected samples or n = 4 mice (n,o). Column charts show mean ± s.e.m. (t-test) for n = 3 independently collected samples (a,j,l).
Overexpression of HOXB13 in both LNCaP and 22Rv1 cells led to an increase in PSMA (Fig. 4g). Analysis of published RNA-seq data16 revealed that overexpression of WT-HOXB13 in LNCaP-shHOXB13 cells rescues FOLH1 expression, whereas overexpression of G84E mutant-HOXB13 cannot rescue suppression of FOLH1 (Extended Data Fig. 6a). Unexpectedly, our PSMA-negative NEPC model WCM154 remained PSMA-negative after HOXB13 overexpression, which implies that HOXB13 by itself cannot rescue PSMA expression in this context. We speculated that epigenetic alterations in this NEPC model may be a barrier for PSMA rescue after HOXB13 overexpression. Therefore, we also investigated histone marks at the FOLH1 enhancer and promoter as shown later.
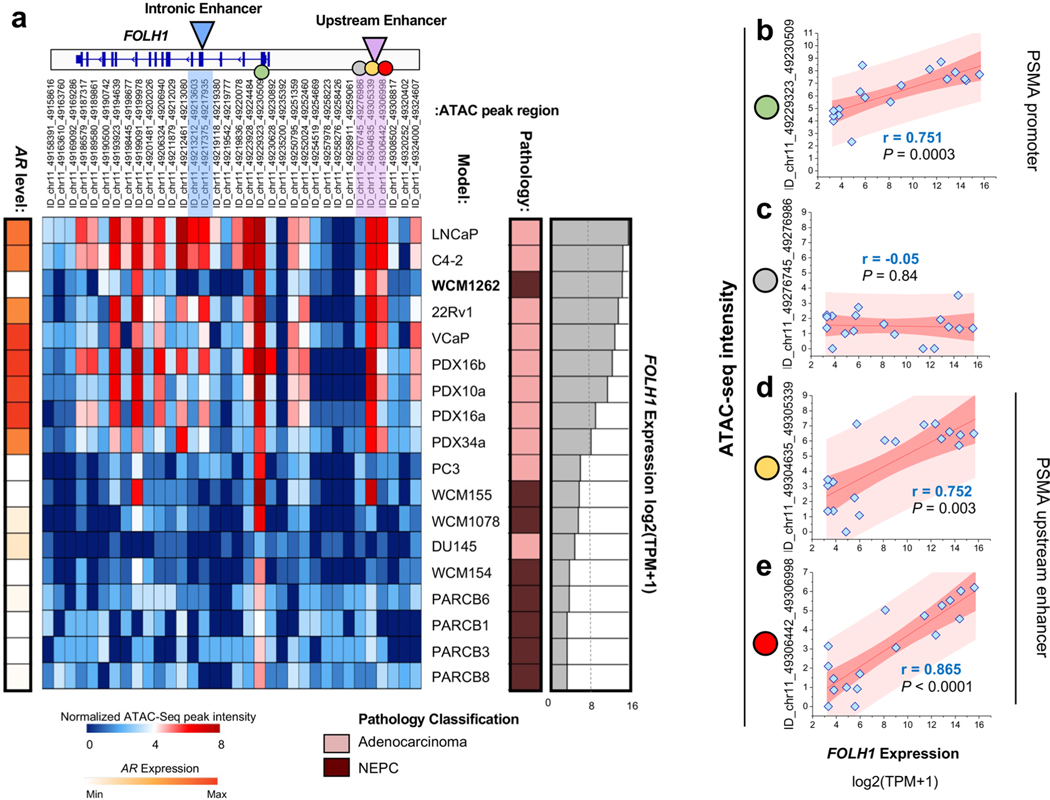
Previous studies have shown that the healthy prostate has significantly lower levels of FOLH1 compared to localized and metastatic prostate cancer9,18–20 and that metastatic CRPC has generally higher expression of FOLH1 in comparison with localized hormone-naive prostate cancer9,18,20. Similarly, a direct correlation between PSMA protein levels and higher Gleason scores has been reported21. To examine whether PSMA expression also correlates with HOXB13 regulatory potential, we analyzed HOXB13 interaction with the FOLH1 gene body as a previously identified intronic enhancer and a potential upstream enhancer looping to the promoter of FOLH1 (refs. 10,11). Figure 4h illustrates heat map plots of HOXB13 chromatin immunoprecipitation (ChIP) peak intensity at intronic and upstream enhancers of FOLH1 gene among healthy (n = 14), localized prostate cancer (n = 13) and CRPC samples (n = 15). The heat map shows that more than 50% of localized and CRPC samples have a high intensity of HOXB13 peak at the FOLH1 enhancer, whereas all healthy samples represented low or no intensity of such peaks. Snapshots of HOXB13 ChIP intensity at intronic and upstream enhancers of FOLH1 gene of three representative samples demonstrates elevation of the intensity of HOXB13 interactions with FOLH1 gene enhancer during progression from healthy to CRPC (Fig. 4i, top). The utility of chromosome conformation capture (3C) coupled with immunoprecipitation (HiChIP) to identify enhancer–promoter interaction has been investigated previously22. H3K27ac-HiChIP loops on Fig. 4i (bottom) illustrate a strong interaction between the FOLH1 promoter and the upstream enhancer. To confirm the physical interaction of HOXB13 with the FOLH1 upstream enhancer in our models, we performed ChIP–qPCR analysis using primers specific to the FOLH1 upstream enhancer. HOXB13 chromatin binding at the upstream enhancer of FOLH1 gene was seen in 22Rv1 xenografts and in the WCM12 PDX model as a PSMA-positive, AR-negative NEPC model (Fig. 4j). The majority of FOLH1-low samples in our cohorts are AR/HOXB13-low (Extended Data Fig. 6c). HOXB13 and AR co-occupancy at the PSMA enhancer region in CRPC is illustrated in Extended Data Fig. 6e. Extended Data Fig. 7 displays how expression of FOLH1 and chromatin accessibility of its promoter and its upstream enhancer are highly correlated (data from GSE199190 (ref. 23)).
Functionally, subcutaneous tumor growth rate of 22Rv1-sgControl was slightly higher than 22Rv1-sgHOXB13 models (Fig. 4k); however, the weight of primary tumors of 22Rv1-sgHOXB13 following orthotopic injection of 22Rv1 cells was significantly higher than 22Rv1-sgControl (Fig. 4l,m). Another key difference between these two models was higher incidence of development of spontaneous metastases in the orthotopic model of 22Rv1-sgControl in comparison to 22Rv1-sgHOXB13 (Fig. 4m,n). Therefore, the 22Rv1-sgControl model had a higher metastatic potential, whereas the 22Rv1-sgHOXB13 model had lower metastatic rate but a larger primary tumor, potentially mimicking earlier stages of the disease. As expected, 22Rv1-sgControl tissue from prostate was both PSMA- and HOXB13-positive and 22Rv1-sgHOXB13 tissue from prostate was HOXB13-negative and PSMA-low (Fig. 4o). Unexpectedly, a metastatic tumor in the liver of the 22Rv1-sgControl model was PSMA-low and HOXB13-positive, suggesting that it was a possible HOXB13-independent PSMA-suppressed tumor.
Epigenetic regulation of PSMA
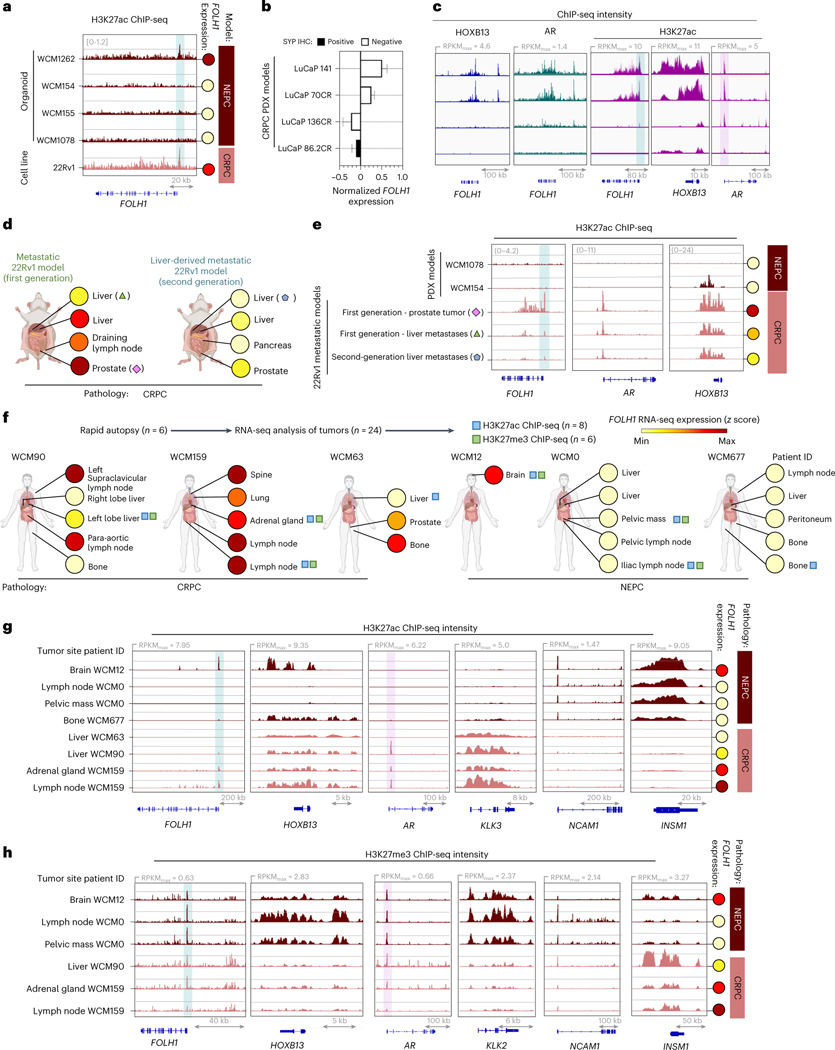
To investigate possible epigenetic regulation of PSMA in the context of HOXB13-independent PSMA-suppressed tumors, we performed ChIP-seq to evaluate the activation mark histone H3 lysine 27 acetylation (H3K27ac) and the repressive mark methylation of lysine 27 on histone 3 (H3K27me) on our previously characterized organoids. Similar to AR-positive, PSMA-positive 22Rv1 cells, the AR-negative, PSMA-positive NEPC model WCM1262 demonstrated H3K27ac at the PSMA (FOLH1) gene promotor corresponding with high PSMA expression, whereas other PSMA-negative NEPC models demonstrated low H3K27ac (Fig. 5a). We observed the same pattern of H3K27ac among our 22Rv1 models and LuCaP PDX models with different levels of FOLH1 expression (Fig. 5b–e), as well as in metastatic lesions from patients with AR-positive CRPC (WCM90, WCM159 and WCM63) and AR-negative NEPC (WCM677, WCM0 and WCM12) (Fig. 5f). The acetylation and methylation profiles of AR and AR-regulated genes and the neuroendocrine markers NCAM1 and INSM1 corresponded with the histopathology of these samples (CRPC-adenocarcinoma and NEPC, respectively). H3K27ac and H3K27me3 ChIP-seq intensity at the PSMA (FOLH1) gene promoter revealed lower H3K27ac and higher H3K27me3 in CRPC liver metastases versus other sites of disease and corresponded with lower PSMA expression (Fig. 5f,g); however, H3K27ac and H3K27me3 peaks were not essentially correlated with FOLH1 expression. These data support epigenetic factors as also contributing to suppression of PSMA in AR-positive liver metastases.
Fig. 5 |. PSMA suppression is associated with H3K27ac and H3K27me at FOLH1 gene locus.
a, Snapshots of H3K27ac ChIP-seq intensity at FOLH1 loci in association with FOLH1 expression levels in NEPC organoid models and 22Rv1 cell line. b, FOLH1 expression levels in LuCaP CRPC PDX models c, Snapshots for HOXB13 (blue), AR (green) and H3K27ac (purple) ChIP-seq in LuCaP CRPC PDX models with a heterogeneous FOLH1 expression level from GEO accession GSE130408 (ref. 33) (mean ± s.d.). d, Overview of FOLH1 expression levels in 22Rv1 models and the selected samples for H3K27ac ChIP sequencing. e, Snapshots of H3K27ac ChIP-seq intensity at FOLH1, AR and HOXB13 loci in association with FOLH1 expression levels in metastatic 22Rv1 models. f, Overview of rapid autopsies and H3K27ac and H3K27me ChIP sequencing of selected tumors from the WCM study cohort and schematic illustration of anatomic sites of samples and the expression levels of PSMA in each sample. h, Snapshots of H3K27ac ChIP-seq intensity and f, H3K27ac ChIP-seq intensity at FOLH1, HOXB13 and luminal and NE markers loci in association with FOLH1 expression levels. Genomic coordinates are indicated below.
Overexpression of amino acid transporters in PSMA-suppressed tumors
Clinical studies have shown that PSMA PET-negative metastatic CRPC lesions may be fluorodeoxyglucose (FDG)-PET-avid and PSMA/FDG discordant disease is associated with poor prognosis24. 18F-fluciclovine is another PET radiotracer approved in prostate cancer for the detection of hormone-sensitive recurrent disease, with limited data in the CRPC setting25. 18F-fluciclovine is a tagged analog of the amino acid, l-leucine and uptake in tumors is associated with activity of the amino acid transporters l-type amino acid transporter1 (LAT1) and alanine–serine–cysteine-transporter 2 (ASCT2)25,26.
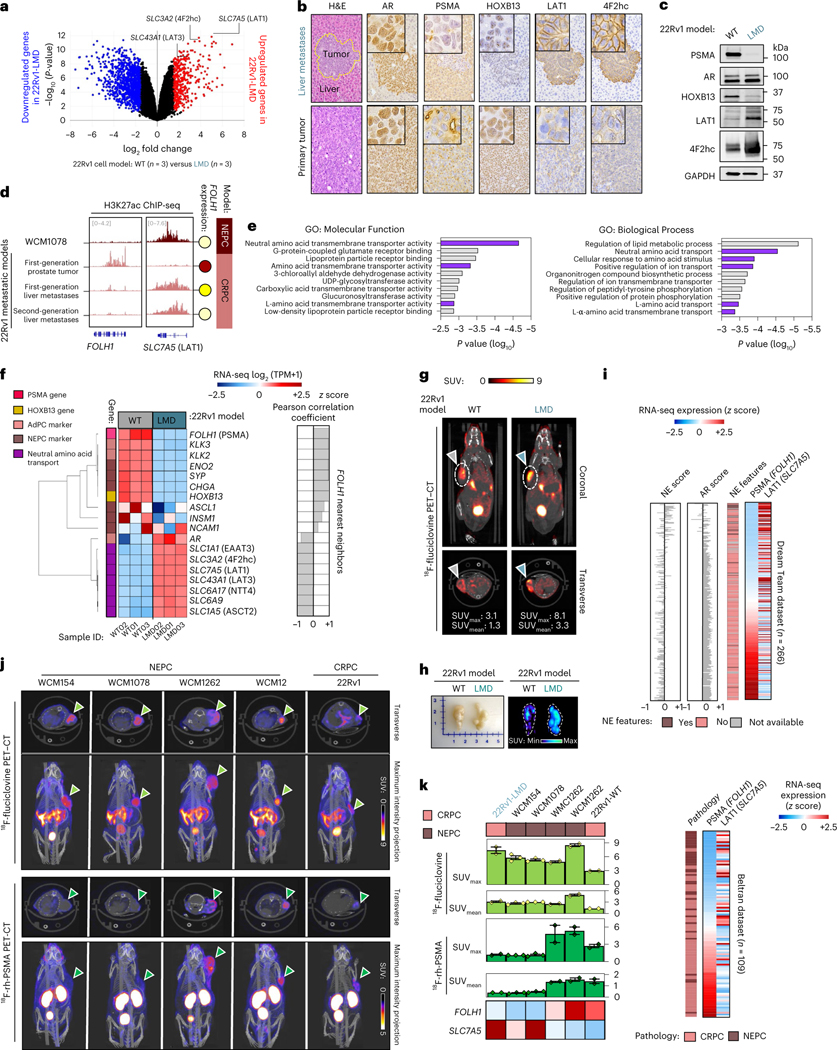
To investigate whether PSMA-low CRPC lesions may be amenable to 18F-fluciclovine imaging, we first evaluated amino acid transporter mRNA expression in liver and non-liver-derived CRPC tumors (22Rv1-WT (n = 3) versus 22Rv1-LMD (n = 3); Fig. 6a). The SLC7A5 gene (encoding LAT1) and SLC3A2 gene (encoding 4F2hc as part of LAT1 complex) were identified among the most differentially expressed genes in PSMA-suppressed 22Rv1-LMD and confirmed by western blot and IHC (Fig. 6a–c). The NEPC model WCM1078 and only liver metastatic tumor of 22Rv1 models demonstrated H3K27ac at SLC7A5 (LAT1) gene locus corresponding with low PSMA expression (Fig. 6d). Gene Ontology (GO) enrichment analysis revealed that the elevation of neutral amino acids transporters in 22Rv1-LMD is not limited to LAT1 and 4F2hc (Fig. 6e). The heat map of expression levels of PSMA gene (FOLH1), AR markers, neuroendocrine (NE) markers and identified amino acid uptake genes from GO analysis are represented in Fig. 6f.
Fig. 6 |.
18F-fluciclovine PET delineates PSMA-suppressed CRPC and NEPC tumors. a, Volcano plot of DGE analysis in 22Rv1-WT versus 22Rv1-LMD. b, Tissue sections of primary and metastatic 22Rv1 model stained with PSMA, AR, HOXB13, LAT1 and 4F2hc antibodies. c, Western blot analyses of PSMA, AR, HOXB13, LAT1 and 4F2hc protein levels in 22Rv1 models. d, H3K27ac ChIP-seq intensity at FOLH1 and LAT1 loci in association with FOLH1 expression levels. e, GO enrichment analysis results for Molecular Functions (left) and Biological Process (right). Bar plot for the log10 of the P value of each term. Pathways related to amino acid uptake are highlighted in purple color. f, Heat map of the expression levels of PSMA gene (FOLH1), luminal, NE markers and identified amino acid uptake genes from GO analysis. TPM, transcripts per million. g, 18F-fluciclovine PET–CT images of an athymic nude male mouse bearing subcutaneous 22Rv1-WT (left) and 22Rv1-LMD (right) tumor xenografted on the right shoulder (1 h after injection). h, Representative images of subcutaneous 22Rv1 tumors (left) and maximum intensity projection of their 18F-fluciclovine PET–CT images. i, Evaluation of the expression of PSMA (FOLH1) and LAT1 (SLC7A5) genes and their association with NEPC features in the International SU2C/PCF Dream Team13 (top) and Beltran8 (bottom) datasets. j, PET–CT images of 18F-fluciclovine (top) and 18F-rh-PSMA (bottom) in athymic nude male mice bearing subcutaneous WCM154, WCM1078, WCM1262, WCM12 and 22Rv1 tumors xenografted on the right shoulder (1 h after injection). k, SUVmax and SUVmean of imaged models in association with PSMA (FOLH1) and LAT1 (SLC7A5) gene expression in 22Rv1-LMD (n = 2 mice), WCM154 (n = 3 mice), WCM1078 (n = 3 mice), WCM1262 (n = 2 mice), WCM12 (n = 2 mice) and 22Rv1-WT (n = 2 mice) xenograft models (mean ± s.e.m.). In a–c, representative images are shown for n = 3 independently collected samples.
18F-fluciclovine PET–CT was performed in athymic nude male mouse models bearing subcutaneous 22Rv1-WT and 22Rv1-LMD (Fig. 6g,h), which confirmed higher 18F-fluciclovine uptake in the PSMA-suppressed, AR-positive 22Rv1-LMD model compared to 22Rv1-WT. This observation supports the previously reported correlation between LAT1 elevation and higher 18F-fluciclovine uptake25,26. There was also a significant elevation of both LAT1 in PSMA-low NEPC and CRPC tumors (Fig. 6i and Extended Data Fig. 8a). The majority of FOLH1-low prostate tumors were SLC7A5-high, whereas SLC7A5-low tumors were mostly FOLH1-high. The NEPC PDX model WCM1078 has very high levels of LAT1 and ASCT2, whereas it is PSMA-negative (Extended Data Fig. 8a–d). Similarly, expression levels of LAT1 and ASCT2 were higher in PSMA-suppressed CRPC and NEPC tumors obtained at autopsy (Extended Data Fig. 8e).
Based on the higher expression of LAT1 and other relevant amino acid transporter genes observed in PSMA-suppressed CRPC and NEPC tumors, we predicted that 18F-fluciclovine PET imaging may delineate PSMA-suppressed tumors26,27. PET–CT images of the AR-negative patient-derived NEPC models WCM12, WCM1262, WCM154 and WCM1078 revealed 18F-fluciclovine uptake in all four NEPC tumors, whereas 18F-rh-PSMA uptake was limited to the PSMA-positive NEPC models WCM12 and WCM1262 (Fig. 6j,k). 18F-fluciclovine SUVs of the liver-derived, PSMA-low 22Rv1-LMD model were similar to NEPC, whereas PSMA-positive 22Rv1-WT tumors had lower uptake of 18F-fluciclovine (Fig. 6k). These data support 18F-fluciclovine PET as a possible alternative imaging modality for PSMA-low CRPC and NEPC.
Discussion
PSMA is an important cell surface imaging biomarker and therapeutic target in prostate cancer1. Based on its high sensitivity and specificity, PSMA PET imaging was first approved for initial staging and for the detection of recurrent hormone-sensitive disease and was recently approved in the metastatic CRPC setting to select patients for the PSMA-targeted therapy 177Lu-PSMA-617 (Pluvicto)4. 177Lu-PSMA-617 is the first theranostic to be developed and approved for patients with CRPC4. While >90% of hormone-naive prostate cancers express PSMA, PSMA expression is more variable and dynamic in the advanced, treatment-resistant setting. PSMA expression increases acutely with AR pathway inhibition, is downregulated with tumor response and generally increases with metastatic castration-resistant progression corresponding with a re-activation of AR signaling. Up to 15–20% of patients with CRPC develop PSMA-negative lesions, making them ineligible for 177Lu-PSMA-617 and these are often FDG avid4,6. There is still much to understand regarding the regulation of PSMA and how PET scans reflect underlying tumor biology, which will be essential for interpreting the heterogeneity that we have observed on PSMA PET–CT imaging and for identifying which patients are most likely to achieve durable benefit from PSMA-targeted therapies.
Most of the field has focused on regulation of PSMA by the AR. AR-positive prostate cancer cell lines are generally PSMA positive and AR-negative prostate cancer cell lines are PSMA negative. While not a direct AR-target gene, PSMA is indirectly regulated by the AR through AR-binding of the PSMA (FOLH1) gene enhancer10,11. While it is often assumed that loss of PSMA on imaging corresponds with loss of AR expression in the tumor, and case reports have also shown that biopsy of PSMA-negative lesions may reveal small-cell NEPC, this has not been systematically evaluated8,9,24,28. NEPC is an aggressive variant of prostate cancer that can emerge in up to 15–20% of patients with CRPC as a mechanism of resistance to AR-targeted therapies and they are often AR negative29.
In this study, we evaluated the landscape of PSMA expression in patients across the disease continuum and in model systems to better understand patterns of PSMA expression in CRPC and the biological factors that contribute to PSMA regulation. We found that PSMA expression is lower in liver metastases and that this was independent of tumor AR expression or NEPC features. Liver metastases are associated with poor prognosis in prostate cancer, including in men treated with 177Lu-PSMA-61730 . It is plausible that the decreased response to 177Lu-PSMA-617 in patients with liver metastases is due to lower and more heterogeneous PSMA expression.
Consistent with what has been seen in case reports, we did also find overall lower expression of PSMA in AR-negative CRPC and NEPC. But interestingly, not all NEPC tumors were PSMA negative, even when they lacked AR expression. NEPC tumors arise clonally from prostate adenocarcinoma during prostate cancer progression, therefore retaining early prostate cancer molecular aberrations but also acquiring new alterations, including distinct epigenetic and transcriptome changes that lead to loss of classical luminal prostate program (including AR) and acquisition of an alternative neuroendocrine lineage program8. We could speculate that alternative regulators of PSMA that are seen in AR-driven disease may persist in this subset of PSMA-positive NEPC.
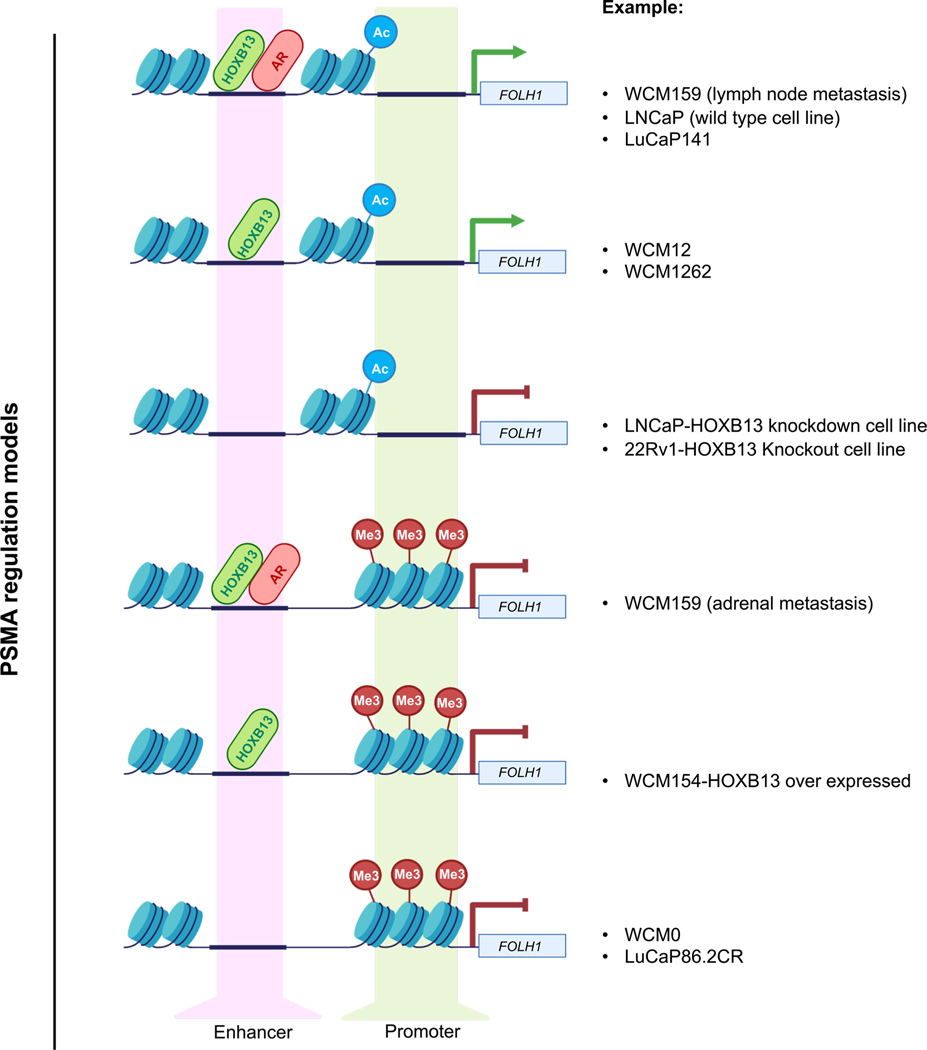
The combined observation that some AR-negative tumors express PSMA and that some AR-positive tumors lack PSMA, led us to explore alternative regulators of PSMA. Integration of cistrome and transcriptome data along prostate cancer progression unexpectedly pointed to HOXB13 as a core regulator of PSMA, irrespective of AR or NEPC features. HOXB13 is a homeodomain transcription factor and important AR cofactor that has mainly been implicated in cooperating with the AR to drive downstream AR-regulated programs31–33. Our data suggest that in most prostate cancers, AR and HOXB13 cooperate to regulate PSMA via enhancer binding in the setting of AR-positive disease; but in the smaller subset of CRPC and NEPC that loses AR expression, HOXB13 may continue to regulate PSMA on its own (Extended Data Fig. 9). In addition, epigenetic changes, including loss of H3K27ac and gain of H3K27me3 also contribute to PSMA suppression (Extended Data Fig. 9), particularly relevant when AR is still present but PSMA is low, as in the case of liver metastases.
This complex regulation and heterogeneity of PSMA expression in CRPC suggests that the biology underlying PSMA-positive and PSMA-negative disease should not be oversimplified into two subsets of the disease (for example PSMA-positive, AR-positive CRPC and PSMA-negative, AR-negative NEPC, respectively). Indeed, liver metastases may express AR and retain adenocarcinoma features, despite being PSMA-low and these patients might benefit from alternative or combination approaches geared toward targeting AR-driven disease. Furthermore, patients with PSMA-positive NEPC might benefit from PSMA-targeted therapies, even if AR is low or absent. These are questions that may now be addressed further in clinical studies. Tracking the evolution of these changes over time will also be of high value, potentially through serial PET imaging and liquid biopsy approaches. Our data suggest that while the liver microenvironment may contribute to suppression of PSMA, PSMA-low liver metastases may also give rise to other PSMA-low metastases in vivo and tracking this course in patients will be important to confirm these findings. Furthermore, while some NEPC tumors express PSMA, it is not clear whether this represents a distinct subclass or one time point in the evolution of NEPC.
While PSMA is an important imaging modality for prostate cancer, complementary imaging approaches to detect and characterize PSMA-negative lesions would also be useful. We found that PSMA-suppressed tumors (both CRPC and NEPC) upregulate amino acid transporters and this may be exploited through 18F-fluciclovine PET imaging. 18F-fluciclovine is a tagged analog of the amino acid l-leucine and uptake in tumors is associated with activity of the amino acid transporters LAT1 and ASCT2. 18F-fluciclovine was approved by the US FDA for the detection of hormone-sensitive recurrent prostate cancer, with limited data reported in the CRPC setting. Further studies are warranted to determine the clinical impact of combined PSMA and 18F-fluciclovine PET imaging, as one could envision a multi-pronged PET approach to improve the detection of molecular subtypes of advanced prostate cancer and guide more personalized treatment strategies.
Methods
All animal studies, including development and imaging of xenograft models, were approved by the Dana-Farber Cancer Institute (DFCI) Institutional Animal Care and Use Committee (IACUC) (protocol no. 18–020). Tumor size was used as the scientific end point to terminate the study when tumors reached 2 cm in any dimension. Maximal tumor size permitted by the DFCI IACUC was not exceeded in this study.
Cohort description and pathology classification
Tumor specimens were evaluated through protocols approved by the DFCI and WCM Institutional Review Boards (nos. 19–883 and 1305013903). The study was conducted in accordance with the Declaration of Helsinki and Good Clinical Practice guidelines. Clinical and information and pathology were collected by medical record review and are summarized in Fig. 5d. Tumors were classified based on histomorphology as CRPC or NEPC based on a published pathological classification system34. This classification relies on tumor morphology and is not based solely on IHC staining for prostate luminal and/or neuroendocrine markers. The same morphological classification was used in previous studies by our group, including the patient datasets featured in this study8,13.
Cell culture
LNCaP (cat. no. CRL-1740) and 22Rv1 (cat. no. CRL-2505) cell lines were purchased from the American Type Culture Collection. LNCaP and 22Rv1 cells were grown in RPMI 1640 phenol-red-free in the presence of 10% fetal bovine serum (FBS) (Gibco).
Organoid culture
NEPC organoids, including WCM1078, WCM154, WCM155 and WCM1262 used for this study are described previously35. The NEPC organoids were combined with growth-factor-reduced Matrigel (Corning) in a 1:2 volume ratio. Six droplets of 50 μl cell suspension/Matrigel mixture was pipetted onto each well of a six-well cell suspension culture plate (Greiner). The six-well plate was placed into a cell culture incubator at 37 °C and 5% CO2 for 30 min to solidify the droplets before 2.5 ml prostate-specific culture medium was added to each well. The organoids were grown in prostate-specific culture medium consisting of Advanced DMEM/F12 (Invitrogen) with GlutaMAX (1×, Invitrogen), HEPES buffer (1 M, Invitrogen), 100 U ml−1 penicillin, 100 μg ml−1 streptomycin (Gibco), B27 supplement (Gibco), N-acetylcysteine 1.25 mM (Sigma-Aldrich), mouse recombinant protein EGF 50 ng ml−1 (Peprotech), human recombinant FGF-10 20 ng ml−1 (Peprotech), recombinant human FGF-basic 1 ng ml−1 (Peprotech), A-83–01 500 nM (Tocris), SB202190 10 μM (Sigma-Aldrich), nicotinaminde 10 mM (Sigma-Aldrich), PGE2 1 μM (Tocris), NRG 100 μl ml−1 (GenScript), Y-27632–2HC1 10 μM (Selleck), Noggin conditioned medium (10%) and R-spondin conditioned medium (5%). The culture was replenished with fresh medium every 3–4 d during organoid growth. Dense cultures with organoids ranging in size from 200 to 500 μm were passaged every 10–12 d.
Plasmids
pLX302_HOXB13 was a gift from W. Hahn (Addgene plasmid 70089; http://n2t.net/addgene:70089; RRID Addgene_70089). Also, pLX302 was a gift from D. Root (Addgene plasmid 25896; http://n2t.net/addgene:25896; RRID Addgene_25896)36.
Generation of CRISPR-Cas9-engineered HOXB13 knockout cell lines
Protocols were obtained from the Zhang website https://zlab.bio/guide-design-resources. The sequences of sgRNAs obtained from X.S. Liu and M. Brown H3 library were: sgGFP: GGGCGAGGAGCTGTTCACC; sgHOXB13–1: CATCAGCGTAGGCGCCGCT; sgHOXB13–2: GGTACTCTTCCCCGGCCGT. In brief, sgRNA designed to target GFP (control) or HOXB13 were inserted into the lentiCRISPRv2-puromycin/blasticidin backbone, a gift from F. Zhang (Addgene plasmid 52961; http://n2t.net/addgene:52961; RRID Addgene_52961). This plasmid was co-transfected with pMD2.G and psPAX2 using Lipofectamine 3000 (Invitrogen) into 293FT cells (Thermo Fisher) to generate viral particles. Lentiviral supernatants and 10 μg ml−1 Polybrene were added and incubated with LNCaP cell line, 22Rv1 cell line and dissociated WCM1262 organoids. Infected cell lines were selected with puromycin. Infected organoids were seeded in Matrigel and maintained in the respective culture medium for 48 h. Then transduced cells or organoids were selected with puromycin (1 μg ml−1). HOXB13 knockout was confirmed by western blot analysis of whole-cell lysates compared to control cell lines.
Chromatin immunoprecipitation
ChIP was performed using a previously described protocol37. Frozen tissue (20–30 mg for histone mark ChIP and 50–80 mg for HOXB13 ChIP) was pulverized using the CryoPREP dry impactor system (Covaris). Following that, the pulverized tissue was fixed using 1% formaldehyde (Thermo Fisher) in phosphate-buffered saline (PBS) for 10 min at room temperature while shaking (600 r.p.m.) and quenched with 125 mM glycine. Chromatin was lysed in ice-cold lysis buffer (50 mM Tris, 10 mM EDTA and 1% SDS with protease inhibitor for histone mark ChIP; 0.1% SDS, 0.5% sodium deoxycholate and 1% NP-40 with protease inhibitor for HOXB13 ChIP) and was sheared to 300–800 bp using the Covaris E220 sonicator (105 watt peak incident power, 5% duty cycle, 200 cycles per burst for 10 min for histone mark ChIP; 140 watt peak incident power, 5% duty cycle, 200 cycles per burst for 20 min for HOXB13 ChIP). Five volumes of dilution buffer (1% Triton X-100, 2 mM EDTA, 150 mM NaCl and 20 mM Tris-HCl, pH 8.1) were added to chromatin for histone mark ChIP.
The sample was then incubated with antibodies coupled with protein A and protein G beads (Life Technologies) at 4 °C overnight. The used antibodies were 10 μg per ChIP anti-HOXB13 from GenTex (GTX129245), healthy mouse IgG from Santa Cruz Biotechnology (sc-2025), 2 μg per ChIP H3K27ac from Diagenode (C15410196) and H3K27me3 from Cell Signaling Technology (9733S). The chromatin was washed with RIPA wash buffer (100 mM Tris, pH 7.5, 0.5 M LiCl, 1% NP-40 and 1% sodium deoxycholate) for 10 min five times and rinsed with TE buffer (pH 8.0) once. Then de-crosslinking performed by adding elution buffer (1% SDS, 0.1 M NaHCO3 with Proteinase K and RNase A) at 65 °C for 12 h at 65 °C while shaking (350 r.p.m.) for 5 s min−1. DNA was purified using a MinElute Purification kit. The yield and quantity (260:280 optical density ratios) of DNA and RNA were measured using a NanoDrop 2000 spectrophotometer (Thermo Fisher Scientific).
ChIP sequencing
Sequencing libraries were generated from purified immunoprecipitation sample DNA using the ThruPLEX-FD Prep kit (Rubicon Genomics). Libraries were sequenced using 150-base paired-end reads on an Illumina platform (Novogene).
HOXB13 ChIP–qPCR
The positive and negative control primers for HOXB13 ChIP–qPCR optimization were adopted from Huang et al.38. Forward primer FOLH1 enhancer F (5′-CCTTTCTCCATGTGCCAATAA-3′) and reverse primer FOLH1 enhancer R (5′-GTCCCTTGAGTGCCATCTGT-3′) were designed for identification of presumable interaction of HOXB13 protein with FOLH1 gene upstream enhancer (chr11:49304942–49305087).
Prostate orthotopic xenograft models
The first-generation metastatic xenograft model was developed following orthotopic injection of 2 × 10⁵ 22Rv1 cells to the anterior prostate of castrated NSG mice (The Jackson Laboratory). Spontaneous metastases developed 75 d following orthotopic injection of cells (Fig. 1e). Before development of the second-generation LMD model, the extracted liver tumor from the first-generation model was grown as a subcutaneous tumor xenograft in castrated mice to generate donor tumors. We next developed the second-generation orthotopic model by dissociating 22Rv1 liver metastasis tumors and injecting 2 × 10⁵ cells into the anterior prostate of the mouse. Figure 1d is a schematic of the development of liver-derived metastatic 22Rv1 models. This study was approved by the DFCI IACUC (protocol no. 18–020).
Liver orthotopic xenograft models
The liver orthotopic xenograft model was developed following a previously published protocol with minor modifications39. Briefly, we performed a 1-cm midline abdominal incision of the skin to identify the linea alba in the midline of the peritoneum to make a 1.0–1.5-cm incision along the linea alba. A 31-gauge needle of 0.3-ml insulin syringe with the Matrigel/22Rv1 cells solution was inserted (approximately 2–3 mm) under the liver capsule. Then, 20 μl of the Matrigel:cell solution (1,000,000 cells) in the subcapsular region of the left-medial and/or left-lateral lobe(s). This study was approved by the DFCI IACUC (protocol no. 18–020).
Subcutaneous xenograft models for PET imaging
To develop the 22Rv1 subcutaneous xenograft models, patient-derived organoid xenografts derived from metastatic biopsies35 or 5 million 22Rv1 cells mixed with 1:1 medium:Matrigel basement membrane matrix (BD Biosciences) were injected subcutaneously on the right shoulder of 6–8-week-old male NSG mice (The Jackson Laboratory). When tumor size reached at least 100 mm3, mice were imaged by PET studies or used for other molecular analysis.
Generation of cell line from metastatic liver tumor
Fresh tissue from a metastatic liver tumor of a second-generation orthotopic 22Rv1 model was placed in RPMI 1640 in the presence of 10% FBS, 100 U ml−1 penicillin and 100 μg ml−1 streptomycin (Gibco) and mechanically dissociated. The dissected tissue was then enzymatically digested with 5 mg ml−1 of collagenase II (Life Technologies) in the presence of 10 μ M Y-27632–2HC1 (Selleck) and incubated at 37 °C for 90 min until the majority of cell clusters were in suspension. After digestion, cell suspension was washed in RPMI 1640 containing 10% FBS and centrifuged at 1,400 r.p.m. for 5 min. The pellet was resuspended with prostate-specific culture medium composed of RPMI 1640 in the presence of 10% FBS (Gibco). Short-tandem repeat profiling of 22Rv1-LMD and parental 22Rv1-WT cell was carried out by using cell authentication services of the American Type Culture Collection in September 2021.
68Ga-PSMA-11 PET–CT imaging
Mice bearing WCM12, WCM1078 and 22Rv1 subcutaneous tumors were intravenously injected 68Ga-PSMA-11 (8.66–8.92 MBq in 150 μl sterile acetate buffer). Mice were anesthetized with 1–2% isoflurane and images were acquired from an Inveon microPET–CT instrument (Siemens) at Memorial Sloan Kettering Cancer Center.
18F-rh-PSMA radiosynthesis
Briefly, 18F-rh-PSMA was produced by DFCI’s Molecular Cancer Imaging Facility via isotopic exchange reaction between 19F-rh-PSMA (0.2 mg, provided by Blue Earth Diagnostics) and azeotropically dried 18F-fluoride (1,081 mCi ± 95.5 mCi, n = 4, 30 mg Kryptofix 222 and 6 mg potassium carbonate) by heating at 30 °C for 5 min in 1 ml dimethylsulfoxide and 8.5 μl glacial acetic acid. The reaction was then quenched with 5 ml 100 mM sodium acetate (pH 5.0) and passed through an Oasis HLB Plus Short cartridge (Waters, 186000132). The cartridge was rinsed with 20 ml sodium acetate buffer, followed by elution of 18F-rh-PSMA using 2.5 ml 50% ethanol in sterile water. The purified product was diluted with 2.5 ml 100 mM sodium acetate buffer and 10.0 ml 0.9% normal saline for injection, then passed through a sterile filter (vented Millex GV, 0.22 μm) into a butyl septum-sealed sterile glass vial providing 18F-rh-PSMA in 39.7% ± 11.7% (n = 4) DCY, pH 5.5. The formulated product was diluted with additional 0.9% normal saline for injection to achieve a radioactivity concentration suitable for injection. Radiochemical purity was measured using thin-layer chromatography. Thin-layer chromatography Silica Gel 60 RP-18 F254S strips (Supelco, 1.16685.0001) were eluted over 6.0 cm using a mobile phase consisting of 65% acetonitrile in water containing 0.1% TFA. Radiochemical purity was 99.23% ± 0.19% (n = 4). A Kryptofix 2.2.2 iodoplatinate spot test and PTS endotoxin assay both revealed the product to be within specification (≤50 μg ml−1 and ≤17.5 EU ml−1, respectively).
18F-fluciclovine radiosynthesis
As previously described40, 18F-fluciclovine was produced on a FAST-lab synthesizer using single use cassette kits provided by Blue Earth Diagnostics. The 18F-fluciclovine (18F-FACBC) was produced with a radioactivity yield of 49.1 ± 3.8% (n = 4) with an end of synthesis activity concentration of 1,481 ± 190 MBq ml−1. At the end of synthesis, the radiochemical purity was 99.18 ± 0.13% (n = 4) and the molar activity was 1,044.45 ± 638.14 GBq μmol−1 (n = 3). The final 18F-fluciclovine product was formulated in citrate buffer and was terminally filtered through a 0.2-μm filter. The tracer was then shipped to DFCI’s Molecular Cancer Imaging facility, where citrate was removed by passing the tracer through a prefilled AG 1-X8 column (Bio-Rad, cat. no. 7316211). The first 1-ml fraction was discarded and the subsequent 1.1-ml fraction was passed through a sterile filter (Fisher, cat. no. 09–720-3) and collected in a butyl septum-sealed sterile glass vial. Radiochemical purity of the citrate-free product was measured using thin-layer chromatography. Thin-layer chromatography silica gel 60 aluminum strips were eluted over 8.0 cm using a mobile phase consisting of acetonitrile:methanol:water:acetic acid at 20:5:5:1 v/v. Radiochemical purity was 99.03% (n = 5).
18F-rh-PSMA and 18F-fluciclovine PET–CT imaging
Mice bearing WCM12, WCM1262, WMC154, WCM1078, 22Rv1-WT and 22Rv1-LMD subcutaneous tumors were imaged with 18F-rh-PSMA and 18F-fluciclovine radioligand formulated in acetate buffered saline. 18F-fluciclovine and 18F-rh-PSMA PET imaging was carried out on a dedicated small animal PET–CT scanner (Siemens Multimodality Inveon, Siemens Medical Solutions USA) at the Lurie Family Imaging Center (DFCI). The mice were housed five to a cage with ad libitum access to food and water in 20 °C ambient temperature, 40–50% humidity and a 12-h light–12-h dark cycle. All animal experiments were approved by the DFCI IACUC. Before the radiotracer injection, mice were anesthetized using ~3% sevoflurane/medical air inhalation and throughout the scan duration. Warming was used to maintain healthy core body temperature of the mice during periods of unconsciousness. The mice received a bolus intravenous injection (via the lateral tail vein) of 18F-fluciclovine or 18F-rh-PSMA PET (~7.4 MBq/~200 μCi) and kept under anesthesia for an uptake time of 60 min before a static emission scan was acquired in list mode format over 10 min. Following PET acquisition, a low-dose CT scan was acquired (80 kVp, 0.5 mA) for anatomical reference and to provide guidance for the delineation of selected tissues volume of interest (VOI). The acquired PET data were then sorted into 0.5-mm sinogram bins and one time frame for image reconstruction using FORE/3D-OSEM-MAP (16 subsets, two iterations). The reconstructed PET–CT images were analyzed with the Siemens Inveon Research Workplace software (IRW v.4.2, Siemens Medical Solutions USA). The radioactivity retention within the selected tissue was obtained from mean voxel intensity values within the VOI and then converted to MBq ml−1 using the calibration factor determined for the Inveon PET system. These values were then divided by the administered activity in MBq and animal body weight to obtain an image VOI-derived SUV. We used the mean and maximum SUV values (SUVmean and SUVmax) within a VOI as a quantitative imaging metrics. The represented PET images are axial and coronal sections. Vivoquant 2021 software (Invicro) was used for maximum intensity projection illustrations.
Immunohistochemistry
NEPC organoids (WCM154, WCM155, WCM1078 and WCM1262) and prostate adenocarcinoma (LNCaP and 22Rv1) xenograft models were formalin-fixed, paraffin-embedded and developed in a fashion similar to that previously described41. Formalin-fixed, paraffin-embedded slides were immersed in xylene and ethanol solutions for deparaffinization and rehydration. Antigens were retrieved in boiled 10 mM sodium citrate buffer (Sigma-Aldrich). Slides were blocked using horse serum and incubated with primary antibodies at 4 °C overnight. Slides were washed and developed using the ABC kit (Vector Laboratories), followed by hematoxylin counterstaining. Each stain was performed twice independently on the same batch of freshly sectioned slides and at least three images were taken from each in low and high magnification. Dilutions for primary antibodies were anti-PSMA (1:100 dilution, Sigma-Aldrich, HPA010593), anti-HOXB13 (1:100 dilution, Santa Cruz Biotechnology, sc-28333), anti-AR (1:250 dilution, Millipore-Sigma, no. 06–680), ASCT2/SLC1A5 (1:200 dilution, Millipore-Sigma, HPA035239), anti-SLC7A5/LAT1 antibody (1:200 dilution, Abcam, 208776) and anti-4F2hc/CD98 (1:200 dilution, Cell Signaling Technology, D5U4G).
Immunofluorescence staining of paraffin-embedded samples and immunocytochemistry
For immunofluorescence staining, NEPC organoids (WCM1078 and WCM12) and prostate adenocarcinoma (22Rv1) xenograft models were processed, sectioned, deparaffinized, antigen retrieved and blocked as described for IHC staining. The sections were incubated with AR (1:250 dilution, Millipore-Sigma, no. 06–680) in blocking solution overnight at 4 °C. On the second day, the washed slides incubated with biotinylated goat anti-rabbit IgG (Vector Labs, cat. no. PK6101) at 1:200 dilution for 60 min. Then the detection was performed with streptavidin-HRP (part of Tyramide SuperBoost kit, Invitrogen), followed by incubation with Tyramide Alexa Fluor 488 (Invitrogen, cat. no. B40953) prepared according to manufacturer instruction with predetermined dilutions. Then, slides were washed after incubation of samples in Stop Reagent (part of Tyramide SuperBoost kit, Invitrogen). Then a second antigen retrieval was performed using citrate buffer (Sigma, C9999). After washing the slides, sections were incubated with PSMA (1:100 dilution, Millipore-Sigma, HPA010593) in blocking solution overnight at 4 °C, On the third day, the same protocol was used for the detection of the second antibody. Nuclei were counterstained with NucBlue (Thermo Fisher Scientific, R37606) and slides were mounted using Vectashield (Vector Labs H-1700–10).
Immunocytochemistry techniques were described previously9,42. The primary antibodies, including rabbit anti-PSMA (1:100 dilution, Cell Signaling Technology, D4S1F) and mouse anit-HOXB13 (1:100 dilution, Santa Cruz Biotechnology, sc-28333) were diluted in 3% BSA–0.1% Tween-20 in 1× PBS and used at a concentration of 1:200. Secondary antibodies, including anti-rabbit Alexa Fluor 488 (Thermo Fisher Scientific, A-11008) and anti-mouse Alexa Fluor 594 (Thermo Fisher Scientific, A-11005) were used at a concentration of 1:750. Slides were imaged using a Nikon Ti2 microscope (Nikon). Acquired images were analyzed using the NIS Elements software (Nikon).
Immunoblotting
Organoids were lysed in RIPA buffer supplemented with protease inhibitor cocktail and phosphatase inhibitors (Thermo Scientific). The total protein concentration of the soluble extract was determined using the BCA protein assay kit (Thermo Scientific). Each protein sample (50 μg) was resolved by SDS–PAGE, transferred onto a PVDF membrane (Millipore) and incubated overnight at 4 °C with primary antibodies. Primary antibodies used were AR (1:2,500 dilution, Millipore-Sigma, no. 06–680), α-tubulin (1:1,000 dilution, Cell Signaling Technology, 2144), PSMA (1:1,000 dilution, Cell Signaling Technology, D4S1F), GAPDH (1:1,000 dilution, Cell Signaling Technology, 14C10), actin (1:2,000 dilution, EMD Millipore clone C4, MAB1501), HOXB13 (1:1,000 dilution, Santa Cruz Biotechnology, sc-28333), synaptophysin (1:5,000 dilution, Abcam (YE269), ab32127), LAT1/SLC7A5 (1:500 dilution, Thermo Fisher Scientific, PA5–50485), ASCT2/SLC1A5 (1:1,000 dilution, Millipore-Sigma, HPA035239), NCAM1 (1:1,000 dilution, ProteinTech, 14255–1-AP) and NKX3–1 (1:1,000 dilution, Cell Signaling Technology, D2Y1A). Following three washes with TBS-T, the blot was incubated with HRP-conjugated secondary antibodies, including anti-rabbit-HRP (1:2,500 dilution, Bio-Rad, 1706515) and anti-mouse-HRP (1:2,500 dilution, Bio-Rad, 1706516). Immune complexes were visualized by enhanced chemiluminescence detection (ECL plus kit, Pierce). Immunoblot band intensities were quantified by ChemiDoc (Bio-Rad) and normalized using either GAPDH or alpha-tubulin signals.
Data-mining analysis
We mined our published datasets8,13,43 to assess transcript abundance for PSMA gene (FOLH1), its potential regulators, NE markers and AR/luminal markers (34 benign, 68 localized AdPC, 31 CRPC, 22 NEPC). Reads were mapped to the human genome reference sequence (hg19/GRC37) using STAR v.2.3.0e. For each sample, HTSeq and Cufflinks were utilized to produce read counts and FPKM or TPM values, respectively.
For analysis in Fig. 3b,c, we needed to define a threshold to classify patients based on FOLH1 expression levels. Extended Data Fig. 4a illustrates PSMA protein levels in prostate cancer models annotated with their FOLH1 expression levels obtained by RNA-seq. As 22Rv1 xenograft tumors with RNA expression of 31.3 RPKM are pathologically considered as PSMA-positive xenografts and they are radiologically detectable by moderate PSMA PET signals, we defined samples with FOLH1 expression levels more than 50 RPKM as FOLH1-high tumors and samples with FOLH1 expression levels <5 RPKM as FOLH1-low tumors.
Extended Data Fig. 3b–e is a schematic of our approach for the estimation of clinically relevant FOLH1-positive regulators during progression from being to NEPC. Figure 4b-e shows the expression of FOLH1 during progression of prostate cancer toward NEPC. The incidence of FOLH1-high was at its maximum among primary prostate cancer samples (Fig. 3a and Extended Data Fig. 4b). On the other hand, FOLH1-low was at its maximum among NEPC samples.
Differential gene expression analysis
DGE analysis, generation of volcano plots and Gene Set Enrichment Analysis44 performed using BioJupies platform45. For volcano plots, gene fold changes were transformed using log2 and displayed on the x axis; P values were corrected using the Benjamini–Hochberg method, transformed using –log10 and displayed on the y axis.
Principal-component analysis
Principal-component analysis (PCA) was performed using the PCA function from in the sklearn Python module using BioJupies platform45. Before performing PCA, the raw gene counts were normalized using the logCPM method, filtered by selecting the 2,500 genes with most variable expression and finally transformed using the z score method.
Single-cell RNA-seq
Single-cell transcriptomes were generated using the 10x Chromium single-cell platform (10x Genomics). Data were analyzed by ROSALIND (https://rosalind.bio/), with a HyperScale architecture developed by ROSALIND. CellRanger was used to align reads to the Homo sapiens genome build GRCh38, count unique molecular identifiers, call cell barcodes and perform default clustering. Individual sample reads were normalized via relative log expression using the DESeq2 R library46. Read distribution percentages and violin plots were generated using RSeQC47. DEseq2 was also used to calculate fold changes and P values and to perform optional covariate correction.
Statistics and reproducibility
Statistical analysis was performed using GraphPad Prism and Origin Pro 2020 (OriginLab). The results are expressed as mean ± s.e.m. The box–whisker plots show the median (horizontal line), the interquartile range (margins of box) and the absolute range (vertical line). Differences between two groups were compared by unpaired Student’s t-test, one-way ANOVA followed by a Benjamini–Hochberg, Šídák’s or Tukey adjustment. IHC signals quantified using National Institutes of Health (NIH) ImageJ software as previously described48. Pearson correlation was used for nearest neighbor analysis and pairwise-correlation of the studied genes. Kaplan–Meier plots and heat maps were generated by the Broad Institute’s Morpheus software. Relevant statistical tests are indicated in the figure legends or in the corresponding main text. For PET imaging experiments, investigators were blinded to allocation during experiments and outcome assessment. No statistical methods were used to predetermine sample size.
Extended Data
Extended Data Fig. 1 |. PSMA (FOLH1) gene expression is mostly correlated with AR and NEPC markers except in liver metastatic tumors with no NE features.
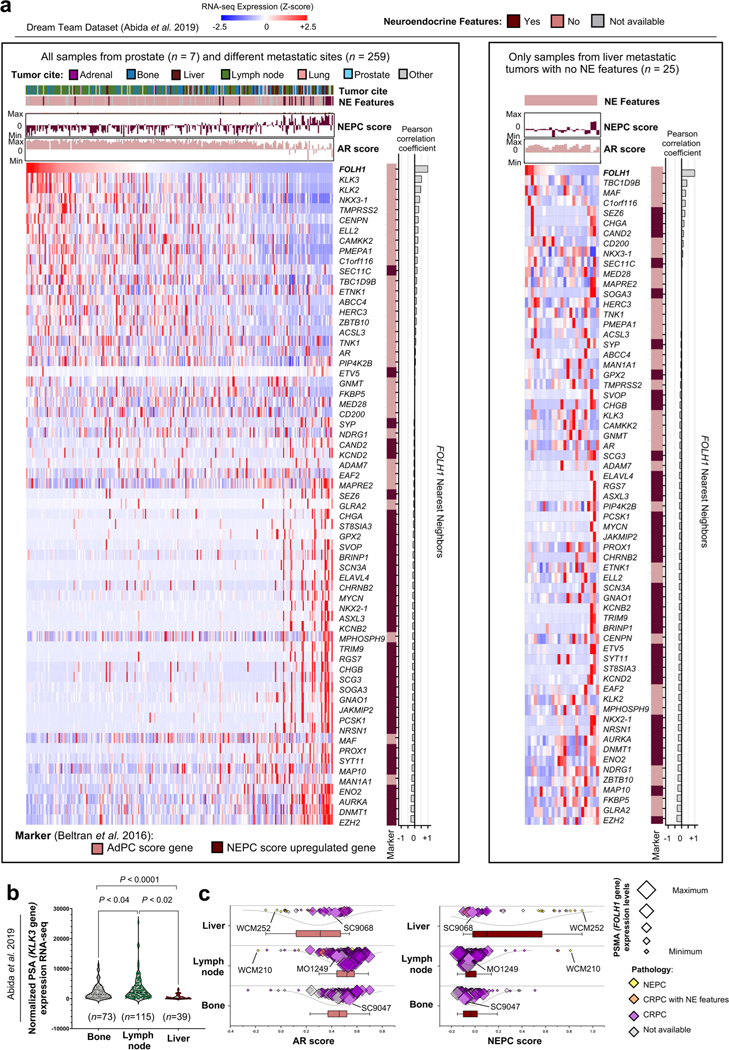
a, Heatmaps of the expression levels of PSMA gene (FOLH1), AR-markers and NE markers in metastatic CRPC samples from the International SU2C/PCF Dream Team dataset13. b, Expression of PSA gene (KLK3) and sites of metastases in the International SU2C/PCF Dream Team CRPC dataset13. c, AR score (left) and NEPC score (right) liver (n = 39), lymph node (n = 115) and bone (n = 73) metastatic CRPC samples in the International SU2C/PCF Dream Team dataset. The size of data points is proportional with the level of KLK3 gene expression in each sample. The lines and squares inside each box are the median and mean, respectively. The upper box border represents the 75th quartile, lower box border represents the 25th quartile and whiskers represent outliers by using the 1.5 interquartile range rule. In b, the data were analyzed by one-way ANOVA followed by Tukey’s multiple comparison tests.
Extended Data Fig. 2 |. PSMA heterogeneity in CRPC can be independent from AR score.
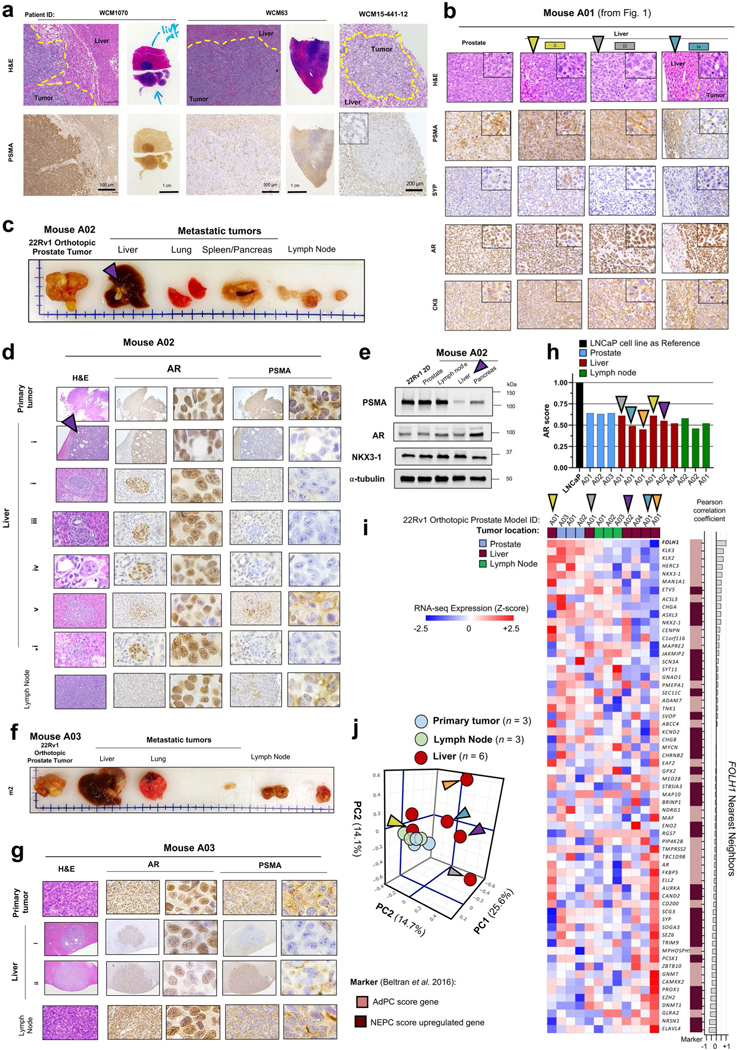
a, PSMA protein expression by IHC displaying heterogeneity in metastatic tumors from liver obtained at autopsy in two patients with CRPC. b, Evaluation of AR and NEPC markers in metastatic liver tumors of Mouse A01 (from Fig. 1g). c, Images of spontaneous metastatic tumors following orthotopic injection of 22Rv1 cell line in Mouse Model A02. Purple arrow points to a metastatic tumor in liver. d, Evaluation of AR and PSMA protein expression by IHC in Mouse A02. e, Western blot analyses of PSMA, AR and NKX3–1 protein levels in Mouse A02. The experiment in e was repeated 2 times with N = 2 independently collected samples with similar results. f, Representative images of spontaneous metastatic tumors in Mouse Model A03. g, Evaluation of AR and PSMA by IHC in Mouse A03. h, AR-score in primary and metastatic tissues of orthotopic 22Rv1 mouse models. LNCaP used as a reference. i, Heatmaps of the expression levels of PSMA gene (FOLH1), AR-markers and NE markers in primary and metastatic tissues of orthotopic 22Rv1 mouse models. j, Principal Component Analysis (PCA) identified global similarity patterns in N = 3 primary prostate tumors, N = 3 metastatic tumors from lymph nodes, and N = 6 PSMA-high metastatic tumors in liver. In b, d and g, IHC experiments were performed once using proper positive and negative controls.
Extended Data Fig. 3 |. Single-cell transcriptome analysis of the 22Rv1-WT cell line and 22Rv1 liver metastasis.
a, Uniform Manifold Approximation and Projection (UMAP) reduced dimension plots shows 22Rv1-WT consists of different clusters. The majority of 22Rv1 liver metastasis cells grouped as a single cluster, albeit this scRNA analysis was limited due to the number of viable cells of the sequenced liver metastasis (n = 197 cells) compared with 22Rv1-WT cell line (n = 3467 cells). b, Single-cell RNA expression of FOLH1, AR, HOXB13, LAT1 and NE markers over the UMAP representation of the map. The expression of LAT1 in Cluster 3 shows PSMA-low subpopulation of 22Rv1-WT cells are not LAT1 positive. This observation implies there is a heterogeneity within the PSMA-low cell populations. c, Unsupervised clusters were annotated as three clusters with distinct FOLH1 levels. d, Expression of FOLH1 in identified clusters. e, Stacked barplot displaying percentage of each cluster in 22Rv1-WT and 22Rv1 liver metastasis. Notably, only 10.9% of 22Rv1-WT belong to PSMA-low Cluster 3. However, more than 58% of 22Rv1 liver metastasis are within Cluster 3. In d, the data were analyzed by one-way ANOVA followed by Šídák’s multiple comparison tests. In a-c, data presented is based on data from a single experiment.
Extended Data Fig. 4 |. Estimation of clinically relevant FOLH1-positive regulators during progression from benign prostate to NEPC.
a, PSMA protein levels in prostate cancer models annotated by their FOLH1 mRNA expression levels obtained by RNA-seq. Since 22Rv1 xenograft tumors with RNA expression of 31.3 RPKM are pathologically considered as PSMA-positive xenografts and they are radiologically detectable with moderate PSMA PET uptake, we defined samples with FOLH1 expression levels more than 50 RPKM as FOLH1-high tumors and samples with FOLH1 expression levels less than 5 RPKM as FOLH1-low tumors. The column chart show mean ± s.e.m for N = 3 independently collected samples. b, Expression of FOLH1 during progression of prostate cancer toward NEPC. The incidence of FOLH1-high was at its maximum among primary prostate cancer samples. On the other hand, FOLH1-low was at its maximum among NEPC samples. c, A differential expression (DGE) performed on each cohort to determine which genes are expressed at FOLH1-high tumors. d, Short (1 kb), mid-range (10 kb) and long-range (100 kb) influence scores were calculated using Cistrome DB21. e, Schematic of generation of Venn diagram of overlapping differentially expressed genes in FOLH1-high cohorts with the estimated FOLH1 regulator to predict clinically relevant FOLH1-positive regulators.
Extended Data Fig. 5 |. Estimation of FOLH1-positive regulators among CRPC tumors with and without neuroendocrine (NE) features.
a, Heat map of the expression levels of PSMA gene (FOLH1), AR-markers, NE markers and projected PSMA regulators in metastatic CRPC samples from the International SU2C/PCF Dream Team dataset 13 (N = 224 tumors) a, Expression levels of FOLH1 in prostate tissue during progression from benign to NEPC. b, Volcano plot of DGE analysis in FOLH1-high vs. FOLH1-low among CRPC tumors with and without NE features. c, Venn diagrams illustrate the overlap of differentially expressed genes in FOLH1-high cohorts, with FOLH1 potential transcription factors estimated by Cistrome DB21.
Extended Data Fig. 6 |. HOXB13 is a positive regulator of PSMA (FOLH1).
a, Overexpression of WT-HOXB13 in LNCaP-shHOXB13 cells rescues FOLH1 expression while overexpression of G84E mutant-HOXB13 cannot rescue suppression of FOLH1. Data from GEO accession GSE15358516. b, Significant reduction in FOLH1 expression in LN95 (left) and 22Rv1 (right). Data from GEO accession GSE9937815. The boxes represent experimental replicates and samples with same treatment are labeled with same color. c, Bar charts of the expression levels of AR (top) and HOXB13 (bottom) in prostate tumors during progression from benign to NEPC. The bar colors represent FOLH1 levels in each sample. d, AR (top) and HOXB13 (bottom) ChIP-seq intensity in representative CRPC samples from GEO accession GSE13040850.
Extended Data Fig. 7 |. Gene expression of PSMA (FOLH1) in preclinical models and corresponding chromatin accessibility of its promoter and upstream enhancer are highly correlated.
a, Heat map of ATAC-seq intensity among prostate cancer models at the FOLH1 gene annotated with FOLH1 expression in each sample. Pearson correlation between the intensity of ATAC-seq peak and the expression of FOLH1 at promoter (b), close to upstream enhancer (c) and on upstream enhancer (d-e). Data from GEO accession GSE19919025. In b-e, the scatter plots show the intensity of ATAC-seq peak (y axis) and the expression of FOLH1 (x axis) for N = 18 preclinical prostate cancer models.
Extended Data Fig. 8 |. Elevation of LAT1 and ASCT2 gene expression in NEPC and low PSMA CRPC.
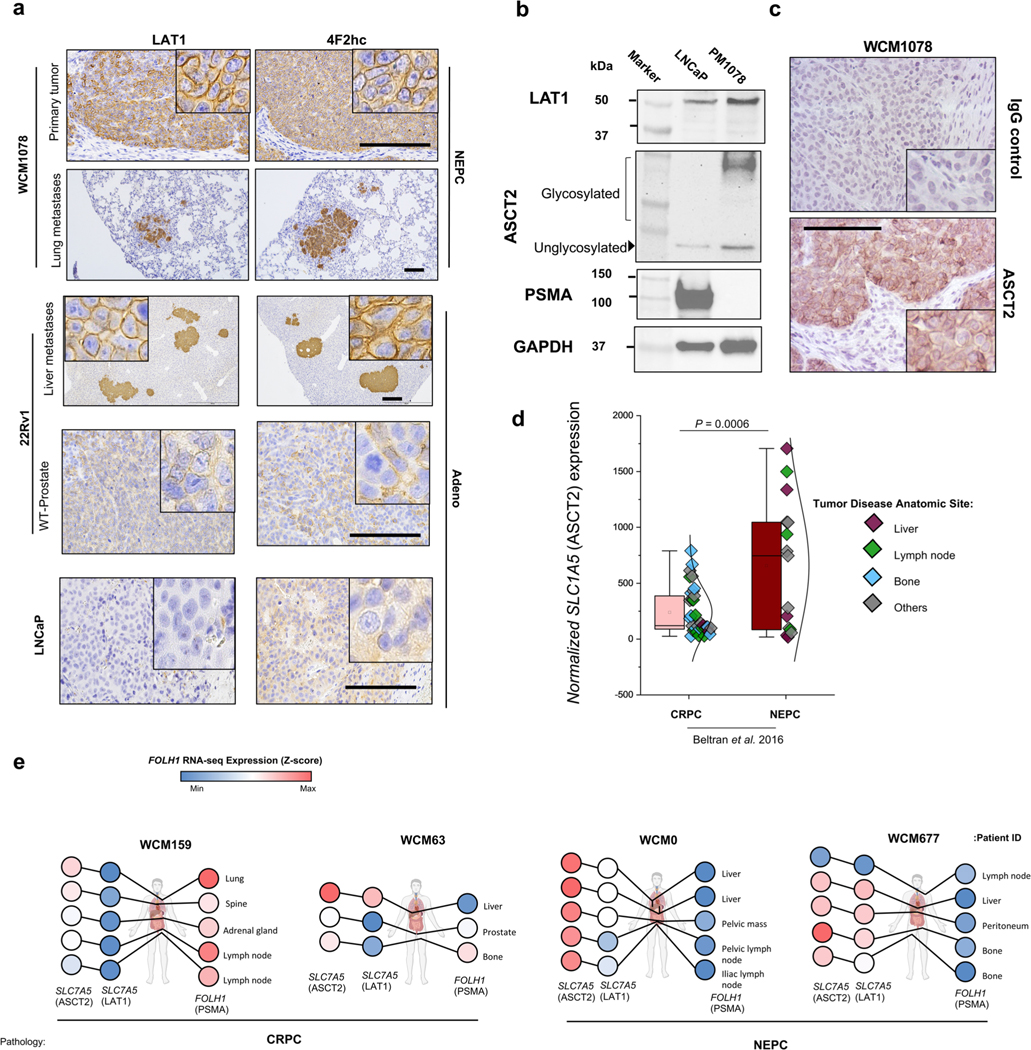
a, Tissue sections of CRPC and NEPC models stained with LAT1 and 4F2hc antibodies. Scale bar: 200 μm b, Western blot analyses of PSMA, LAT1 and ASCT2 protein levels of models. c, Tissue sections of NEPC model WCM1078 stained with ASCT2 antibody. Scale bar: 100 μm d, Evaluation of the expression of ASCT2 (SLC1A5) gene in Beltran8 dataset for N = 34 CRPC tumors and N = 15 NEPC tumors. The lines and squares inside each box are the median and mean, respectively. The upper box border represents the 75th quartile, lower box border represents the 25th quartile and whiskers represent the outlier by using the 1.5 interquartile range rule. e, Schematic illustration of anatomic sites of samples and expression levels of PSMA, LAT1 and ASCT2 in each sample. The representative images are shown for N = 3 (a-c) independently collected samples.
Extended Data Fig. 9 |. Proposed model of PSMA regulation in prostate cancer.
PSMA (FOLH1) expression is activated in prostate cancer via binding of both AR and its cofactor HOXB13 to the PSMA enhancer. Even in the absence of AR expression, a subset of AR-negative tumors will still express PSMA due to HOXB13 binding of the PSMA enhancer. CRPC tumors may suppress or lose PSMA expression either due to loss of AR/HOXB13 binding of the PSMA promotor and/ or methylation of the PSMA promotor.
Acknowledgements
This work supported by the Prostate Cancer Foundation (to H.B.), US Department of Defense (W81XWH-17-1-0653 to H.B., W81XWH-22-1-0010 to M.K.B. and W81XWH-22-1-0197 to V.B.V.) and NIH National Cancer Institute (R37CA241486 and P50-CA211024 to H.B.). Y.Y. is supported by the Japan Society for the Promotion of Science. Partial support for the work was provided by NIH Center grant P30 CA08748 (Small Animal Imaging Core Facility and the Radiochemistry and Molecular Imaging Probe core). Support from NIH R35 CA232130 (to J.S.L.), DOD-IDEA Award grant W81XWH-19-1-0536 (to N.P.) and National Cancer Center (to V.B.V.) is acknowledged. We acknowledge support of Blue Earth Diagnostics for providing 18F-fluciclovine and 18F-rh-PSMA tracers. The funders had no role in study design, data collection and analysis, decision to publish or preparation of the manuscript.
H.B. participated in a virtual advisory board meeting with Blue Earth Diagnostics in 2021. A.C. is employed by Blue Earth Diagnostics. Blue Earth Diagnostics provided tracer for this study but had no role in study design, data collection and analysis, decision to publish or preparation of the manuscript. H.B. has also served as consultant/advisory board member for Janssen, Astellas, AstraZeneca, Merck, Pfizer, Foundation Medicine, Amgen, Bayer, Oncorus, LOXO, Daicchi Sankyo and Curie Therapeutics and has received research funding (to institution) from Janssen, AbbVie/Stemcentrx, Eli Lilly, Astellas, Millennium, Bristol Myers Squibb, Circle Pharma and Daicchi Sankyo. O.E. is supported by Janssen, J&J, AstraZeneca, Volastra and Eli Lilly research grants. He is scientific advisor and equity holder in Freenome, Owkin, Volastra Therapeutics, Pionyr Immunotherapeutics, Harmonic and One Three Biotech and a paid scientific advisor to Champions Oncology.
Footnotes
Reporting summary
Further information on research design is available in the Nature Portfolio Reporting Summary linked to this article.
Additional information
Extended data is available for this paper at https://doi.org/10.1038/s43018-023-00539-6.
Supplementary information The online version contains supplementary material available at https://doi.org/10.1038/s43018-023-00539-6.
Code availability
No customized code was used in the present study.
Competing interests
All other authors have no competing interests.
Data availability
All RNA-seq generated for the study, including LNCaP-WT (n = 3) and LNCaP-LMD (n = 3) cell lines and 22Rv1 metastatic xenograft model tumors (primary (n = 3), lymph nodes (n = 3) and liver (n = 3)) are accessible via GEO (accession no. GSE211452). H3K27ac ChIP-seq data of in vitro models are accessible via GEO accession no. GSE221613. Peak calls of HOXB13 ChIP were obtained from GEO accession no. GSE96652. HOXB13 ChIP peak intensity among healthy (n = 15), localized prostate cancer (n = 13) and CRPC samples (n = 15) were from GEO accession no. GSE130408. RNA-seq data from LNCaP and 22Rv1 cell lines with overexpression and knockdown of HOXB13 were obtained from GEO accession nos. GSE153585 (ref. 15) and GSE153586 (ref. 16). RNA-seq reads were aligned to the human reference genome (GRCh38). Source data have been provided as Source Data files. All other data supporting the findings of this study are available from the corresponding author on reasonable request. Source data are provided with this paper.
References
- 1.Miyahira AK et al. Meeting report from the Prostate Cancer Foundation PSMA theranostics state of the science meeting. Prostate 10.1002/pros.24056 (2020). [DOI] [PMC free article] [PubMed]
- 2.Israeli RS, Powell CT, Corr JG, Fair WR & Heston WD Expression of the prostate-specific membrane antigen. Cancer Res. 54, 1807–1811 (1994). [PubMed] [Google Scholar]
- 3.Narayan V. et al. PSMA-targeting TGF-β-insensitive armored CAR T cells in metastatic castration-resistant prostate cancer: a phase 1 trial. Nat. Med 10.1038/s41591-022-01726-1 (2022). [DOI] [PMC free article] [PubMed]
- 4.Sartor O. et al. Lutetium-177–PSMA-617 for metastatic castration-resistant prostate cancer. N. Engl. J. Med 385, 1091–1103 (2021). [DOI] [PMC free article] [PubMed] [Google Scholar]
- 5.Paschalis A. et al. Prostate-specific membrane antigen heterogeneity and DNA repair defects in prostate cancer. Eur. Urol 76, 469–478 (2019). [DOI] [PMC free article] [PubMed] [Google Scholar]
- 6.Hofman MS et al. [(177)Lu]Lu-PSMA-617 versus cabazitaxel in patients with metastatic castration-resistant prostate cancer (TheraP): a randomised, open-label, phase 2 trial. Lancet 397, 797–804 (2021). [DOI] [PubMed] [Google Scholar]
- 7.Evans MJ et al. Noninvasive measurement of androgen receptor signaling with a positron-emitting radiopharmaceutical that targets prostate-specific membrane antigen. Proc. Natl Acad. Sci. USA 108, 9578–9582 (2011). [DOI] [PMC free article] [PubMed] [Google Scholar]
- 8.Beltran H. et al. Divergent clonal evolution of castration-resistant neuroendocrine prostate cancer. Nat. Med 22, 298–305 (2016). [DOI] [PMC free article] [PubMed] [Google Scholar]
- 9.Bakht MK et al. Neuroendocrine differentiation of prostate cancer leads to PSMA suppression. Endocr.-Relat. Cancer 26, 131–146 (2019). [DOI] [PubMed] [Google Scholar]
- 10.Watt F. et al. A tissue-specific enhancer of the prostate-specific membrane antigen gene, FOLH1. Genomics 73, 243–254 (2001). [DOI] [PubMed] [Google Scholar]
- 11.Noss KR, Wolfe SA & Grimes SR Upregulation of prostate-specific membrane antigen/folate hydrolase transcription by an enhancer. Gene 285, 247–256 (2002). [DOI] [PubMed] [Google Scholar]
- 12.Yu J. et al. An integrated network of androgen receptor, polycomb, and TMPRSS2-ERG gene fusions in prostate cancer progression. Cancer Cell 17, 443–454 (2010). [DOI] [PMC free article] [PubMed] [Google Scholar]
- 13.Abida W. et al. Genomic correlates of clinical outcome in advanced prostate cancer. Proc. Natl Acad. Sci. USA 116, 11428–11436 (2019). [DOI] [PMC free article] [PubMed] [Google Scholar]
- 14.Brady L. et al. Inter- and intra-tumor heterogeneity of metastatic prostate cancer determined by digital spatial gene expression profiling. Nat. Commun 12, 1426 (2021). [DOI] [PMC free article] [PubMed] [Google Scholar]
- 15.Chen Z. et al. Diverse AR-V7 cistromes in castration-resistant prostate cancer are governed by HoxB13. Proc. Natl Acad. Sci. USA 115, 6810–6815 (2018). [DOI] [PMC free article] [PubMed] [Google Scholar]
- 16.Lu X. et al. HOXB13 suppresses de novo lipogenesis through HDAC3-mediated epigenetic reprogramming in prostate cancer. Nat. Genet 10.1038/s41588-022-01045-8 (2022). [DOI] [PMC free article] [PubMed]
- 17.Kron KJ et al. TMPRSS2-ERG fusion co-opts master transcription factors and activates NOTCH signaling in primary prostate cancer. Nat. Genet 49, 1336–1345 (2017). [DOI] [PubMed] [Google Scholar]
- 18.Grasso CS et al. The mutational landscape of lethal castration-resistant prostate cancer. Nature 487, 239–243 (2012). [DOI] [PMC free article] [PubMed] [Google Scholar]
- 19.Ross-Adams H. et al. Integration of copy number and transcriptomics provides risk stratification in prostate cancer: a discovery and validation cohort study. eBioMedicine 2, 1133–1144 (2015). [DOI] [PMC free article] [PubMed] [Google Scholar]
- 20.Chandrashekar DS et al. UALCAN: a portal for facilitating tumor subgroup gene expression and survival analyses. Neoplasia 19, 649–658 (2017). [DOI] [PMC free article] [PubMed] [Google Scholar]
- 21.Kasperzyk JL et al. Prostate-specific membrane antigen protein expression in tumor tissue and risk of lethal prostate cancer. Cancer Epidemiol. Biomarkers Prev 22, 2354–63 (2013). [DOI] [PMC free article] [PubMed] [Google Scholar]
- 22.Giambartolomei C. et al. H3K27ac HiChIP in prostate cell lines identifies risk genes for prostate cancer susceptibility. Am. J. Hum. Genet 108, 2284–2300 (2021). [DOI] [PMC free article] [PubMed] [Google Scholar]
- 23.Tang F. et al. Chromatin profiles classify castration-resistant prostate cancers suggesting therapeutic targets. Science 376, eabe1505 (2022). [DOI] [PMC free article] [PubMed] [Google Scholar]
- 24.Thang SP et al. Poor outcomes for patients with metastatic castration-resistant prostate cancer with low prostate-specific membrane antigen (PSMA) expression deemed ineligible for 177Lu-labelled PSMA radioligand therapy. Eur. Urol. Oncol 10.1016/j.euo.2018.11.007 (2019). [DOI] [PubMed]
- 25.Gusman M. et al. Review of 18F-fluciclovine PET for detection of recurrent prostate cancer. Radiographics 39, 822–841 (2019). [DOI] [PubMed] [Google Scholar]
- 26.Saarinen I. et al. Correlation between 18F-1-amino-3-fluorocyclobutane-1-carboxylic acid (18F-fluciclovine) uptake and expression of alanine-serine-cysteine-transporter 2 (ASCT2) and L-type amino acid transporter 1 (LAT1) in primary prostate cancer. EJNMMI Res. 9, 50 (2019). [DOI] [PMC free article] [PubMed] [Google Scholar]
- 27.Okudaira H. et al. Putative transport mechanism and intracellular fate of trans-1-amino-3–18F-fluorocyclobutanecarboxylic acid in human prostate cancer. J. Nucl. Med 52, 822–829 (2011). [DOI] [PubMed] [Google Scholar]
- 28.Bakht MK et al. Differential expression of glucose transporters and hexokinases in prostate cancer with a neuroendocrine gene signature: a mechanistic perspective for FDG imaging of PSMA-suppressed tumors. J. Nucl. Med 61, 904–910 (2020). [DOI] [PMC free article] [PubMed] [Google Scholar]
- 29.Beltran H. et al. The role of lineage plasticity in prostate cancer therapy resistance. Clin. Cancer Res 25, 6916–6924 (2019). [DOI] [PMC free article] [PubMed] [Google Scholar]
- 30.Khreish F. et al. Response and outcome of liver metastases in patients with metastatic castration-resistant prostate cancer (mCRPC) undergoing 177Lu-PSMA-617 radioligand therapy. Eur. J. Nucl. Med. Mol. Imaging 48, 103–112 (2021). [DOI] [PubMed] [Google Scholar]
- 31.Ewing CM et al. Germline mutations in HOXB13 and prostate-cancer risk. N. Engl. J. Med 366, 141–149 (2012). [DOI] [PMC free article] [PubMed] [Google Scholar]
- 32.Norris JD et al. The homeodomain protein HOXB13 regulates the cellular response to androgens. Mol. Cell 36, 405–416 (2009). [DOI] [PMC free article] [PubMed] [Google Scholar]
- 33.Pomerantz MM et al. Prostate cancer reactivates developmental epigenomic programs during metastatic progression. Nat. Genet 52, 790–799 (2020). [DOI] [PMC free article] [PubMed] [Google Scholar]
- 34.Epstein JI et al. Proposed morphologic classification of prostate cancer with neuroendocrine differentiation. Am. J. Surg. Pathol 38, 756–767 (2014). [DOI] [PMC free article] [PubMed] [Google Scholar]
- 35.Puca L. et al. Patient-derived organoids to model rare prostate cancer phenotypes. Nat. Commun 9, 2404 (2018). [DOI] [PMC free article] [PubMed] [Google Scholar]
- 36.Yang X. et al. A public genome-scale lentiviral expression library of human ORFs. Nat. Methods 8, 659–661 (2011). [DOI] [PMC free article] [PubMed] [Google Scholar]
- 37.Baca SC et al. Reprogramming of the FOXA1 cistrome in treatment-emergent neuroendocrine prostate cancer. Nat. Commun 12, 1979 (2021). [DOI] [PMC free article] [PubMed] [Google Scholar]
- 38.Huang Q. et al. A prostate cancer susceptibility allele at 6q22 increases RFX6 expression by modulating HOXB13 chromatin binding. Nat. Genet 46, 126–135 (2014). [DOI] [PubMed] [Google Scholar]
- 39.Kasashima H. et al. An orthotopic implantation mouse model of hepatocellular carcinoma with underlying liver steatosis. STAR Protoc. 1, 100185 (2020). [DOI] [PMC free article] [PubMed] [Google Scholar]
- 40.Malviya G. et al. 18F-Fluciclovine PET metabolic imaging reveals prostate cancer tumour heterogeneity associated with disease resistance to androgen deprivation therapy. EJNMMI Res. 10, 143 (2020). [DOI] [PMC free article] [PubMed] [Google Scholar]
- 41.He MX et al. Transcriptional mediators of treatment resistance in lethal prostate cancer. Nat. Med 27, 426–433 (2021). [DOI] [PMC free article] [PubMed] [Google Scholar]
- 42.Bakht MK et al. Identification of alternative protein targets of glutamate-ureido-lysine associated with PSMA tracer uptake in prostate cancer cells. Proc. Natl Acad. Sci. USA 119, e2025710119 (2022). [DOI] [PMC free article] [PubMed] [Google Scholar]
- 43.Beltran H. et al. Molecular characterization of neuroendocrine prostate cancer and identification of new drug targets. Cancer Discov. 1, 487–495 (2011). [DOI] [PMC free article] [PubMed] [Google Scholar]
- 44.Mootha VK et al. PGC-1α-responsive genes involved in oxidative phosphorylation are coordinately downregulated in human diabetes. Nat. Genet 34, 267–273 (2003). [DOI] [PubMed] [Google Scholar]
- 45.Torre D, Lachmann A. & Ma’ayan A. BioJupies: automated generation of interactive notebooks for RNA-seq data analysis in the cloud. Cell Sys. 7, 556–561 (2018). [DOI] [PMC free article] [PubMed] [Google Scholar]
- 46.Love MI, Huber W. & Anders S. Moderated estimation of fold change and dispersion for RNA-seq data with DESeq2. Genome Biol. 15, 550 (2014). [DOI] [PMC free article] [PubMed] [Google Scholar]
- 47.Wang L, Wang S. & Li W. RSeQC: quality control of RNA-seq experiments. Bioinformatics 28, 2184–2185 (2012). [DOI] [PubMed] [Google Scholar]
- 48.Crowe AR & Yue W. Semi-quantitative determination of protein expression using immunohistochemistry staining and analysis: an integrated protocol. Bio. Protoc 10.21769/BioProtoc.3465 (2019). [DOI] [PMC free article] [PubMed]
- 49.Zheng R. et al. Cistrome Data Browser: expanded datasets and new tools for gene regulatory analysis. Nucleic Acids Res. 47, D729–D735 (2018). [DOI] [PMC free article] [PubMed] [Google Scholar]
- 50.Beltran H. et al. Whole-exome sequencing of metastatic cancer and biomarkers of treatment response. JAMA Oncol. 1, 466–474 (2015). [DOI] [PMC free article] [PubMed] [Google Scholar]
Associated Data
This section collects any data citations, data availability statements, or supplementary materials included in this article.
Data Availability Statement
All RNA-seq generated for the study, including LNCaP-WT (n = 3) and LNCaP-LMD (n = 3) cell lines and 22Rv1 metastatic xenograft model tumors (primary (n = 3), lymph nodes (n = 3) and liver (n = 3)) are accessible via GEO (accession no. GSE211452). H3K27ac ChIP-seq data of in vitro models are accessible via GEO accession no. GSE221613. Peak calls of HOXB13 ChIP were obtained from GEO accession no. GSE96652. HOXB13 ChIP peak intensity among healthy (n = 15), localized prostate cancer (n = 13) and CRPC samples (n = 15) were from GEO accession no. GSE130408. RNA-seq data from LNCaP and 22Rv1 cell lines with overexpression and knockdown of HOXB13 were obtained from GEO accession nos. GSE153585 (ref. 15) and GSE153586 (ref. 16). RNA-seq reads were aligned to the human reference genome (GRCh38). Source data have been provided as Source Data files. All other data supporting the findings of this study are available from the corresponding author on reasonable request. Source data are provided with this paper.


