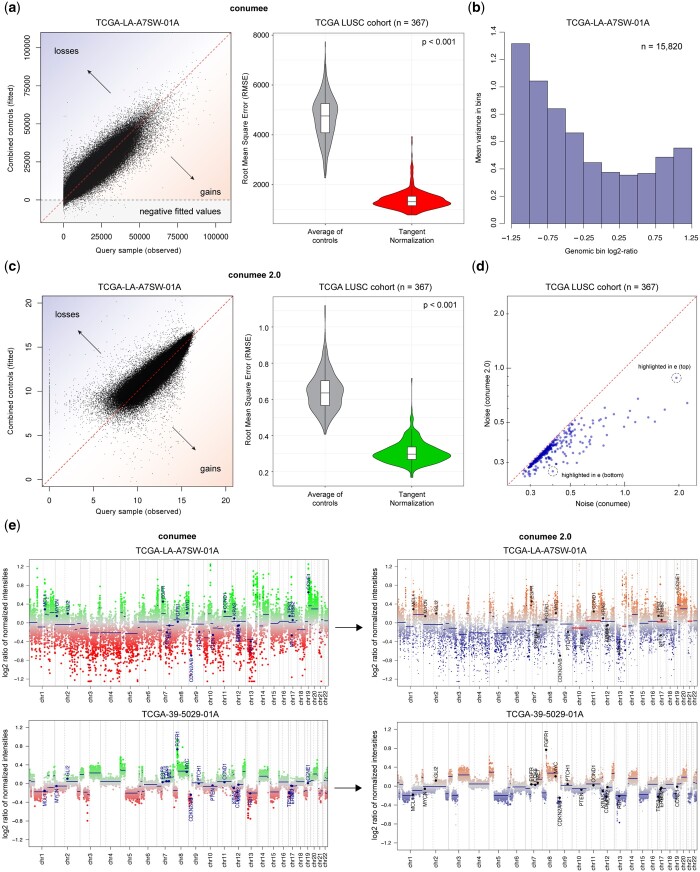
Figure 2.
Enhanced conumee algorithm. (a) Scatter plot shows a linear combination of a set of control samples that is fitted against a single query sample in the original tangent normalization approach. Violin plot shows the root mean square error (RMSE) for a set of 367 samples from the TCGA LUSC cohort, using the mean intensity across control samples or the tangent normalization approach. (b) Barplot shows the average probe variance within genomic bins. Higher probe variance is observed in low-intensity bins. (c) Scatter plot shows the updated tangent normalization approach implemented in conumee 2.0 that uses signal intensities that have been log2-transformed. Violin plot shows RMSE values using the mean intensity across control samples or the updated tangent normalization approach. (d) Scatter plots shows the noise level for the original (x-axis) and the updated (y-axis) tangent normalization approach for the TCGA LUSC cohort. The updated approach substantially reduces the noise in many samples. (e) Genome plots show results from the original (left) and updated (right) version of conumee for a low quality (top) and a high quality (bottom) sample. Weighted circular binary segmentation enables a more harmonic segmentation in low quality samples (major segmentation differences are highlighted in red). Weights are visualized as varying dot sizes representing individual bins.

