

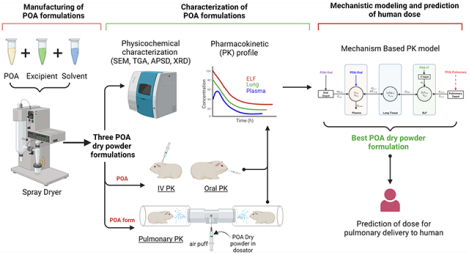
Abstract
Tuberculosis (TB), caused by Mycobacterium tuberculosis (Mtb), remains a leading cause of death with 1.6 million deaths worldwide reported in 2021. Oral pyrazinamide (PZA) is an integral part of anti-TB regimens, but its prolonged use has the potential to drive the development of PZA-resistant Mtb. PZA is converted to the active moiety pyrazinoic acid (POA) by the Mtb pyrazinamidase encoded by pncA, and mutations in pncA are associated with the majority of PZA resistance. Conventional oral and parenteral therapies may result in subtherapeutic exposure in the lung; hence, direct pulmonary administration of POA may provide an approach to rescue PZA efficacy for treating pncA-mutant PZA-resistant Mtb. The objectives of the current study were to (i) develop novel dry powder POA formulations, (ii) assess their feasibility for pulmonary delivery using physicochemical characterization, (iii) evaluate their pharmacokinetics (PK) in the guinea pig model, and (iv) develop a mechanism-based pharmacokinetic model (MBM) using in vivo PK data to select a formulation providing adequate exposure in epithelial lining fluid (ELF) and lung tissue. We developed three POA formulations for pulmonary delivery and characterized their PK in plasma, ELF, and lung tissue following passive inhalation in guinea pigs. Additionally, the PK of POA following oral, intravenous, and intratracheal administration was characterized in guinea pigs. The MBM was used to simultaneously model PK data following administration of POA and its formulations via the different routes. The MBM described POA PK well in plasma, ELF, and lung tissue. Physicochemical analyses and MBM predictions suggested that POA maltodextrin was the best among the three formulations and an excellent candidate for further development as it has: (i) the highest ELF-to-plasma exposure ratio (203) and lung tissue-to-plasma exposure ratio (30.4) compared with POA maltodextrin and leucine (75.7/16.2) and POA leucine salt (64.2/19.3) and (ii) the highest concentration in ELF (CmaxELF: 171 nM) within 15.5 min, correlating with a fast transfer into ELF after pulmonary administration (KPM: 22.6 1/h). The data from the guinea pig allowed scaling, using the MBM to a human dose of POA maltodextrin powder demonstrating the potential feasibility of an inhaled product.
Keywords: tuberculosis, pyrazinamide, pyrazinoic acid, dry powder inhalation, resistance, pharmacokinetic
Graphical Abstract
INTRODUCTION
Tuberculosis (TB), caused by the bacterial pathogen Mycobacterium tuberculosis (Mtb), currently ranks second only to SARS-CoV-2 as the deadliest infectious disease. In 2021, there were 10.6 million new Mtb infections and 1.6 million Mtb-related deaths worldwide, marking the first time in over a decade that deaths from TB increased.1 Further, one-fourth of the global population are thought to be infected with Mtb.2 Compounding the impact of Mtb, multi-drug-resistant TB (MDR-TB) cases are increasing, significantly challenging ongoing efforts to end the TB crisis.1
TB is usually treated with complicated multi-drug therapy regimens over an extended duration. Patients infected with drug-susceptible TB (DS-TB) are treated with a four-drug combination and, depending on the regimen, treatment duration can range from 4 to 6 months.3 MDR-TB treatment is based on the susceptibility profile of the clinical isolate and can last from 6 months to over 2 years.4,5 Treating MDR-TB is further challenged by a lack of adequate drug exposure at the site of infection, the prevalence of adverse effects associated with many second-line TB drugs, and a lack of novel treatment strategies effective against MDR-TB. Along with new drugs, strategies to shorten the duration of therapy, improve adherence, and limit periods of transmission are needed. Given this need, optimizing approved TB drugs to ensure efficacious drug exposures in lung tissue and epithelial lining fluid (ELF) is essential to limit the development of resistance and deserves consideration.6,7
Pyrazinamide (PZA), a prodrug, is a common and critical component of multi-drug regimens for both DS-TB and MDR-TB.8,9 It is metabolized to the active moiety pyrazinoic acid (POA) by Mtb. PZA is distinguished from many other TB drugs by its sterilizing activity and ability to kill Mtb while it is in a slow-growing and nonreplicating persister state.10,11 PZA is also active in the acidic, nutrient-starved, and hypoxic environments associated with the multicellular granulomas that typify the host immune response to Mtb.10 Importantly, PZA can penetrate cellular and necrotic granulomas, which does not occur for all TB drugs.12 Finally, PZA has synergistic activity in combination with other anti-Mtb drugs.11 For this reason, PZA is often included when new TB drug regimens are studied (e.g., BPaMZ, endTB, MDR-END, NeXT, TRUNCATE-TB).8,13–15
However, PZA’s role as a cornerstone TB treatment is challenged by the rise in PZA-resistant Mtb. Indeed, 50% of MDR Mtb strains are PZA-resistant.16,17 PZA is converted to POA by the Mtb pyrazinamidase (PZAse) enzyme encoded by the pncA gene.18,19 Additionally, host-mediated enzymatic conversion of PZA to POA has been reported in mice, guinea pigs, and humans.20 However, the largest category of PZA-resistant Mtb mutations map to pncA, indicating that the majority of POA is not produced by the host.9,20 As the active agent, direct administration of POA has been proposed as a strategy to rescue the PZA efficacy lost in pncA-mutant PZA-resistant Mtb.20–22 Several studies have now shown that POA is active against PZAase-negative Mtb strains, including some reporting POA as equally or more effective than PZA.10,22 However, POA delivered orally was ineffective compared with PZA at equivalent doses in mice21 Pharmacokinetic (PK) studies in mice demonstrate only limited penetration of oral POA into lung ELF compared with PZA, which may explain the poor efficacy observed in animal studies.21 We hypothesized that direct pulmonary delivery of POA would overcome this limitation by achieving higher, ideally therapeutic, local POA exposure in the ELF and in lung tissue.
Conventional therapies for respiratory infections delivered orally or parenterally have poor pulmonary distribution. This can result in subtherapeutic drug exposure in the lungs and high systemic concentrations associated with off-target toxicities. Direct pulmonary delivery circumvents the issue of suboptimal exposure within the lung while avoiding first-pass metabolism and minimizing systemic exposure.23,24 Pulmonary delivery would be included in a combination regimen where other drugs would treat the systemic manifestations of disease. More recently, studies on the pulmonary delivery of TB drugs to Mtb-infected animals indicated the feasibility of inhaled therapy.25–27 Understanding drug disposition following pulmonary delivery is important, as exposure at the site of infection determines efficacy. Hence, we evaluated the PK of POA following oropharyngeal inhalation as a strategy to achieve high local POA exposure in the ELF and lung tissue.23
Spray-dried powder preparations of antimicrobial agents in combination with inhalers that are actuated by the breath of the patient have the advantage of allowing high dose delivery, ease of use, storage, and transport stability suitable for use in a wide variety of global environments.28 We have demonstrated the feasibility of this approach for several antitubercular drugs, most notably capreomycin sulfate.29–32
The objectives of the current study were to (1) develop novel dry power POA formulations suitable for pulmonary delivery; (2) evaluate the PK of these POA formulations in guinea pigs to assess POA exposure in plasma, ELF, and lung tissue; and (3) develop a mechanism-based PK model to characterize POA exposure in plasma, ELF, and lung tissue for optimizing POA formulations with a view to maximizing efficacy.
MATERIALS AND METHODS
Drugs and Chemicals.
Pyrazinoic acid (POA), maltodextrin, and reagent-grade ethanol were obtained from Sigma-Aldrich (St. Louis, MO). l-Leucine was obtained from Alfa Aesar (Ward Hill, MA). KetaVed (ketamine hydrochloride injection), AnaSed (xylazine hydrochloride injection), and sodium pentobarbital were from Vedco, Inc. (Covetrus, Portland, MA), Akorn Animal Health Inc. (Lake Forest, IL), and Henry Schein Animal Health (Covetrus), respectively.
Formulation of POA Maltodextrin (PM), POA Maltodextrin and Leucine (PML), and POA Leucine Salt (PLS).
Manufacturing of PM, PML, and PLS.
A spray dryer (model B 290, Buchi Corporation, DE) equipped with a high-efficiency cyclone and two-fluid nozzle (inner orifice and outer orifice 0.7 and 1.5 mm, respectively)33 was used. POA alone, with excipient-PM, was dissolved in 100% ultrapure water (for each of the POA formulations, 5 mg/mL w/v solids). PML was prepared in 4:1 water: EtOH (v/v) (10 mg/mL w/v solids). The resulting solutions were fed via a peristaltic pump through a heated nozzle, where the solutions were atomized using N2, resulting in rapid evaporation of the solvent. The remaining dry powder particles were collected downstream via a cyclone separator and stored in amber vials at room temperature with a desiccant. In addition to the use of leucine as an additive in the spray-dried product (PML), stoichiometric leucine salt (PLS) was synthesized through the reaction of pyrazinecarboxylic acid (POA) with leucine heated to 60 °C, as previously reported (additional details can be found in the Supporting Information).34 The nominal concentration of POA and excipient in the final formulations were as follows. PM: 80% POA + 20% Maltodextrin, PML: 40% POA + 30% maltodextrin + 30% leucine, PLS: 50% POA + 50% leucine. Yields were calculated as a ratio of powder collected with respect to known starting solid material dispersed in spray-dried solution. Additional details can be found in the Supporting Information.
Physicochemical Characterization of Particles.
Particle morphology was assessed by scanning electron microscopy (SEM; Quanta 200 SEM, FEI, Hillsborough, OR). Thermal analysis and moisture content were determined by thermogravimetric analysis (TGA; Q50 TGA, TA Instruments, New Castle, DE). Aerodynamic characterization was performed using a Next Generation Impactor (NGI; MSP Corp., Shoreview, MN). Particles were characterized for crystallinity by X-ray powder diffraction (XRPD model D8 instrument, Bruker AXS Inc., Karlsruhe, Germany). Additional details can be found in the Supporting Information.
Aerodynamic Characterization.
Inertial impaction was performed using an NGI to generate aerodynamic particle size distribution (APSD) following United States Pharmacopeia (USP) <601> procedure outlined for dry powder manufacturing.35 The impactor was operated with a preseparator and at a flow rate of 60 L/min, which is a standard practice for evaluating dry powder inhaler performance.27 A nominal powder mass of 10 mg (including excipients) was loaded into a #3 hydroxypropyl methylcellulose (HPMC) capsule and placed in an RS00 Mod.8 inhaler (Plastiape, Osnago, Italy). The inhaler was actuated by piercing the capsule and then placed in a mouthpiece adapter at the NGI inlet, following which a vacuum was applied. The deposited mass within the NGI aerosol sampling stages and inlet, the inhaler, and capsule were collected by washing with a known volume of deionized water. POA content in the collected samples was quantified by UV spectroscopy (UV–vis spectrometer, SynergyMX, Biotech, Winooski, VT) at 269 nm. The APSD was reconstructed for the mass deposited at every calibrated NGI stage. The mass median aerodynamic diameter (MMAD), representing the median of the distribution, and the geometric standard deviation (GSD), the measure of the range of particle sizes in the distribution, were derived from plots of NGI data. For a detailed description, refer to the Supporting Information.
Fine Particle Dose and Fraction.
The fine particle dose and fraction (FPD and FPF < 4.46 μm) were estimated the latter is presented as a function of nominal dose. Specifically, the FPF is the ratio of mass collected at impactor stage 3 through the micro-orifice collector relative to the nominal dose (dose in the capsule) and is expressed as a percentage of the nominal dose.
In Vivo PK Studies.
The Institutional Animal Care and Use Committee (IACUC) of the University of North Carolina approved the experimental protocol. For PK characterization, male Dunkin-Hartley guinea pigs (417 ± 62.9 g) with indwelling jugular vein catheters (JVC) were purchased from Charles River Laboratories (Raleigh, NC). Guinea pigs were housed individually under standard environmental conditions (ambient temperature 21 °C, humidity 60%, 12:12 h light/dark cycle) with food and water ad libitum. Guinea pigs were euthanized at the end of each study. Plasma, bronchoalveolar lavage fluid (BALF), and lung tissue were collected and stored at −80 °C until liquid chromatography–mass spectrometry (LC–MS)/MS analysis.
Intravenous (IV) PK Studies.
POA formulated in 0.9% sodium chloride (saline) was intravenously administered to guinea pigs (n = 8) via JVCs. Following administration of this single 2 mg/kg IV bolus dose, 0.4 mL of blood was collected at 0.25, 0.5, 0.75, 1, and 1.5 h in lithium heparin tubes (BD Microtainer Capillary Collector; BD, Franklin Lakes, NJ). Plasma was separated by centrifugation and stored at −80 °C until LC–MS/MS analysis.
Intratracheal (IT) PK.
Tracheostomies were performed in anesthetized guinea pigs (n = 4). Guinea pigs were anesthetized with 50 mg/kg ketamine and 5 mg/kg xylazine administered intraperitoneally. An 18 G intravenous catheter was inserted into the tracheal lumen and PM dry powder (1.6 mg/kg POA) was insufflated through the catheter into the trachea followed by flushing with 10 mL of room air three times. The catheter was removed from the trachea and the incision was closed with a wound clip. Guinea pigs were maintained on 100% oxygen and monitored to ensure sufficient peripheral blood oxygenation. Following intratracheal (IT) administration, 0.4 mL of blood was collected at 0.25, 0.5, 0.75, 1, and 1.5 h via the JVCs.
Oral (PO) PK.
Guinea pigs (n = 9) were administered doses of 300 mg/kg as a suspension in 20% pumpkin puree/50% sucrose mixture supplemented with commercial Lactobacillus (BD Lactinex) and vitamin C orally. The oral POA dose matched the human-equivalent PZA dose as previously determined by PK analysis in guinea pigs.20,36 Blood (0.4 mL) was collected at 0.08, 0.25, 0.5, 0.75, 1, 1.5, 2, 4, and 6 h via JVCs after oral administration of POA.
Pulmonary PK.
A custom-built plexiglass, nose-only guinea pig aerosol dosing chamber (Supporting Information, Figure S1A) was used for pulmonary POA PK studies. Twenty-nine guinea pigs [PM (n = 11), PML (n = 10), and PLS (n = 8)] were used. Two guinea pigs were simultaneously dosed with 10 mg of spray-dried PM or PML or 8 mg PLS administered 8 times every 3 min (Figure 1). The formulation was pre-loaded in the dosator37 and injected into the center of the chamber through an inlet (Supporting Information, Figure S1B). Every spray of the formulation was followed by two puffs of room air (10 mL) every minute to aerosolize the powder. The animals were allowed to inhale the dose for 3 min before the subsequent dose was administered. The 3 min dosing interval was calculated based on the chamber saturation time (2.6 min) estimated using the MicroPEM device (RTI MicroPEM, NC).33 The actual dose of POA inhaled by the guinea pigs was computed using a previously published equation38 representing approximately 3.33 ± 0.098 mg/kg (PM), 1.67 ± 0.028 mg/kg (PML), and 1.65 ± 0.038 mg/kg (PLS) (see the Supporting Information). Blood samples (0.4 mL) were collected at 0.08, 0.17, 0.25, 0.5, 0.75, 1, and 1.5 h via JVCs after administration of all 8 doses every 3 min over 24 min.
Figure 1.
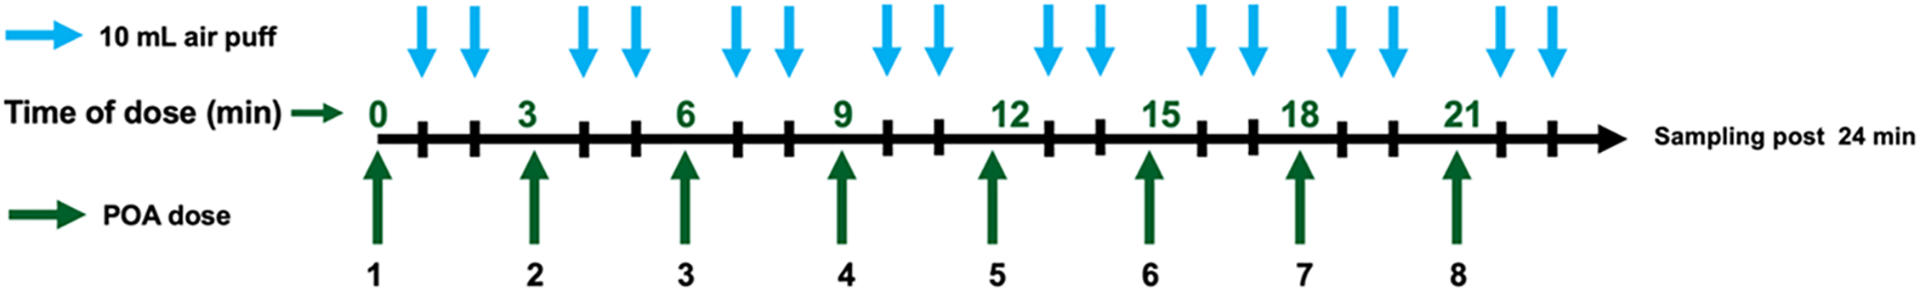
Dosing scheme for pulmonary administration of POA formulations. POA dry powder for direct pulmonary delivery was administered every 3 min as indicated by the dark green arrows. Guinea pigs received a total of 8 doses administered every 3 min over 24 min. An air puff (10 mL) was administered every minute as indicated by the blue arrows, twice after each dose administration, to assist with aerosolization of the powder deposited in the chamber. Blood samples for quantification of POA in plasma were obtained after the last dose was administered (i.e., after 24 min).
For all of the PK studies, the lung and BALF were collected from guinea pig after euthanasia using pentobarbital. For BALF collection, the trachea was isolated and 5 mL of phosphate-buffered saline (PBS) was injected into the trachea followed by aspiration to collect BALF. Urea dilution method was used to estimate the volume of ELF and concentration in ELF (detailed explanation is provided in the Quantification of POA in Epithelial Lining Fluid section). Lung and BALF samples were collected at 0.08, 0.25,0.5, 0.75, 1, and 1.5 h, and POA concentrations were determined in plasma, lung homogenate, and BALF.
Bioanalytical Assay for POA Quantification.
POA was quantified using an LC–MS/MS system consisting of AB-Sciex API 3200 triple-quadrupole mass spectrometer (AB SCIEX, Foster City, CA) with an Agilent 1100 HPLC system (Agilent Technologies, Santa Clara, CA). Agilent Eclipse XDB (C8, 150 × 4.6 mm, 5 μM) was used as the analytical column. A mobile phase of 0.1% formic acid in water (A) and acetonitrile (B) was used at a flow rate of 1 mL/min with a gradient elution starting from 20% B. The mass transitions (Q1/Q3) of m/z 125.216/106.786 and 609.263/194.9 were used for POA and reserpine (internal standard), respectively. The lower limit of quantification was 202 nM.
Quantification of POA in Epithelial Lining Fluid (ELF).
Urea in the plasma and BALF was detected using LC–MS/MS and the QuantiChrom Urea Assay Kit (detection limit 13 μM) (BioAssay Systems, Hayward, CA). Equation 1 was used to calculate the volume of the ELF (VELF), based on urea concentrations measured in the BALF and plasma. The POA concentration in the ELF (CPOA,ELF) was calculated based on POA quantified in BALF (CPOA,BALF) and VELF using the relationship in eq 239
| (1) |
| (2) |
5 mL of PBS was used to collect samples from excised lungs resulting in VBALF, the volume of BALF collected. UreaBALF and UreaPlasma are urea concentrations measured in BALF and plasma, respectively.
PK Analysis.
Non-Compartmental Analysis (NCA).
Non-compartmental analysis (NCA) was performed using Phoenix WinNonlin version 8.2.0 (Certara USA, Inc., Princeton, NJ). The area under the POA plasma concentration vs. time curve up to 1.5 h after dosing (AUC0–1.5h) and total AUC were calculated using the linear up-log down trapezoidal rule, and the elimination half-life (t1/2), time to reach peak concentration (Tmax), and peak concentration (Cmax) were also determined.
Mechanism-Based PK Model Development.
Time course PK data obtained following POA administration via the IV, PO, IT, or direct pulmonary routes were simultaneously modeled using a naïve pooled approach with the maximum likelihood estimation (ML) method in ADAPT5 (Biomedical Simulations Resource, Los Angeles, CA). Data were visualized using ggplot2 package (v3.3.6) in R (v4.2.1). The mechanism-based model was developed in a stepwise manner, modeling the time course of POA PK in plasma following IV administration first. This model was then expanded to include oral and intratracheal POA plasma PK data to estimate the first-order oral absorption rate (KaOral) and oral bioavailability (FOral) as well as first-order transfer rate (KIT) between intratracheal depot and ELF and intratracheal bioavailability (FIT). The model was then expanded by including time course in vivo PK for POA formulations following direct pulmonary administration. Formulation-specific parameters, first-order transfer rate (KForm) between inhalation depot and ELF, and bioavailability after pulmonary administration (FForm) were estimated.
Linear and nonlinear transfer between the lung tissue and plasma compartments were evaluated. The final model was selected based on model discrimination, evaluating the goodness of fit plots, the precision of the estimated parameters, and AIC values. Model-predicted plasma, ELF, and lung tissue concentration over time profiles were analyzed to estimate AUC0–1.5 h, Cmax, and Tmax, and these parameters were used to compare different POA formulations.
Drug Penetration in ELF and Lung Tissue.
Drug penetration into the ELF and lung tissue was calculated as a ratio of model-predicted exposure achieved in the ELF or lung tissue (AUC0–1.5 h, ELF or lung) to the systemic exposure (AUC0–1.5 h,Plasma) to assess and compare the penetration of the various formulations into the ELF as well as in the lung tissue.
Simulation of Human Dose.
The mechanism-based model was used to estimate the potential first-in-human dose for PM for pulmonary delivery. Simulations were performed using ADAPT5 (Biomedical Simulations Resource, Los Angeles, CA) using the “individual simulation with output error” method. Given the lack of information on the PK of POA in humans, we used clinical studies where PZA was administered and the PK of both PZA and POA were characterized to estimate human clearance and volume of distribution. From these clinical studies, we considered average clearance and volume of distribution values for POA.40–42 Allometric scaling was performed using fixed body weights for humans (BWH) and guinea pig (BWGP) of 70 and 0.42 kg, respectively, to scale other PK parameters from guinea pig (PGP) to humans (PH) using the equation below43
| (3) |
where the values for exponent b for volume of distribution, clearance, and first-order transfer rate constants were fixed to 1, 0.75, and −0.25, respectively.44 The partition of POA from lung to plasma in humans was assumed to be equal to the guinea pig. The PK/pharmacodynamic (PD) index for PZA is AUCplasma/MIC of 9.68–14.545–48 based on the PZA exposure achieved in plasma. This is considered to be a good predictor of PZA efficacy in the lung considering a 17.8–22-fold penetration of PZA to ELF46,48 and Cmax (>35 mg/L)46 is another predictor of efficacy.
Using the scaled PK parameters, POA exposure for 1000 subjects was simulated using different doses and dosing frequencies to select the POA dose and dosing frequency. The dose that achieved PK/PD index between 9.68 and 14.5 was selected as potential human dose for pulmonary administration.
RESULTS
Manufactured POA Dry Powder Formulations.
The total yield for POA, PM, PML, and PLS dry powders was 56.7–70.5% for all of the formulations, relative to the initial pre-sprayed mass. X-ray powder diffraction (XRPD) demonstrated that POA, PLS, and PML exhibited crystallinity, the latter showing slight amorphous qualities likely due to the maltodextrin content, which was amorphous as received (see the Supporting Information, Results).
Particle Morphology and Physicochemical Characterization.
Morphology and Thermogravimetric Analysis.
Figure 2 shows the morphology and physicochemical characterization of spray-dried POA formulations. Without the addition of excipients, POA microparticles formed irregular spheres (Figure 2A). However, PM, PML, and PLS formed regular spheres (Figure 2B–D). Thermogravimetric analysis in Figure 2E indicated that both the precursor POA (black), spray-dried POA (purple), and PLS (green) contained negligible moisture based on negligible mass lost up to 150 °C and degradation above 150 °C. In contrast, PM (blue) and PML (red) spray-dried samples contained a small amount of moisture (2–3%), likely from the maltodextrin content (dark green).
Figure 2.
(A–E) Results of scanning electron microscopy (SEM) and thermogravimetric analysis (TGA). SEM images showing the morphology of the spray-dried powder of (A) POA, (B) PM, (C) PML, and (D) PLS. (E) TGA thermograms for the different POA forms and excipients, pre-sprayed POA (black), pre-sprayed MAL (dark green), pre-sprayed LEU (aqua blue), SD POA (purple), PM (blue), PML (red), and PLS (green). MAL: maltodextrin, LEU: leucine, SD: spray-dried.
A semiquantitative indication of precursor weight content in the spray-dried product of these formulations was assessed by comparing degradation pattern/onset temperatures with their respective starting materials.
POA displays a monobasic decomposition with onset occurring at around 125 °C. The spray-dried POA (purple) closely matches the starting material. PM displays a biphasic decomposition starting at around 125 °C and culminating around 200 °C, the second event starts around 200 °C indicating the beginning of degradation due to maltodextrin (20% in PM formulation) based on a mass ratio of 80:20 for PM. Similarly, PML (red) shows a triphasic decomposition starting around 125 °C and culminating around 80 °C (~59%), the second phase starting around 180 °C suggesting degradation due to leucine followed by the third phase starting around 225 °C which is degradation due to maltodextrin at ~31% (dark green). For PLS, the mass ratio was 50:50. The degradation of PLS was biphasic, the first phase starting at 125 °C and degradation due to leucine starts around 175 °C (~50%).
Aerodynamic Characterization of POA Inhalational Formulations.
The aerodynamic properties of MMAD, GSD, FPD, and FPF for POA, PM, PML, and PLS are reported in Table 1. The POA MMAD of 4.30 μm was large, considering that respirable particles range from 1 to 5 μm and that 50% of the nominal 10 mg POA dose remained in the capsule or was deposited in the inlet of the NGI, implying that most of this POA aerosol would not enter the lungs. However, PM, PML, and PLS had acceptable MMADs between 2.4 and 3.1 μm. The distributions for PML and PLS were narrower (GSD ~ 1.7–1.8) compared with POA and PM (GSD ~ 2.0–2.2), indicating a higher likelihood of being within the respirable range. There was an improvement in the FPF of the formulation versus POA, indicating that the proportion of aerosol likely to enter the lungs was much higher: the FPF for POA was ~15%, while that for PM was ~68%. However, the highest FPFs were observed for PML and PLS (~84–86%). Graphical depictions of the APSDs are shown in the Supporting Information, Figure S2. XRPD demonstrated that POA, leucine, and PML exhibited crystallinity, and spray-dried PLS was previously shown to be amorphous (Supporting Information, Figure S3). All formulations with maltodextrin showed amorphous qualities.
Table 1.
Physiochemical Analysis of POA and POA-Based Formulations Based on Aerodynamic Particle Size Distribution (APSD)b Reported as Mean ± SDa
| POA | PM | PML | PLS | |
|---|---|---|---|---|
| % of POA | 100 | 80 | 40 | 50 |
| MMAD (μm) | 4.30 ± 0.21 | 2.43 ± 0.12 | 2.86 ± 0.12 | 3.12 ± 0.04 |
| GSD | 2.19 ± 0.08 | 2.03 ± 0.14 | 1.89 ± 0.05 | 1.78 ± 0.03 |
| FPD (<4.46 μm) (mg) | 1.55 ± 0.05 | 4.36 ± 0.09 | 1.35 ± 0.03 | 2.16 ± 0.11 |
| FPF (nominal) | 15.5 ± 0.478 | 54.6 ± 1.07 | 33.6 ± 0.820 | 43.2 ± 2.8 |
| FPF (normalized to 10 mg POA) | 15.5 ± 0.48 | 68.2 ± 1.34 | 84.1 ± 2.05 | 86.4 ± 4.57 |
Abbreviations: MMAD, median mass aerodynamic diameter; GSD, geometric standard deviation; FPD, fine particle dose; FPF, fine particle fraction.
See Figure S2 in the Supporting Information.
In Vivo PK Analysis.
The mean POA exposure in plasma, ELF, and lung tissue over time following administration via the IV, PO, IT, or pulmonary routes are shown in the Supporting Information, Figure S4A–C. Plasma PK profiles of IV-POA (n = 8) and IT-PM (n = 4) are shown in the Supporting Information, Figure S4A1, while Supporting Information, Figure S4A2 depicts the plasma PK profiles following direct pulmonary administration of POA-formulations [PM (n = 11), PML (n = 10), and PLS (n = 8)]. PO POA achieved higher exposure, as the oral POA dose was the human-equivalent dose, 300 mg/kg, which was much higher than that administered via the intravenous (120-fold), IT (150-fold IT-PM), or pulmonary (83-fold PM, 171-fold PML, and 162-fold PLS) routes (Supporting Information, Figure S4A3). The samples for characterizing POA PK in the ELF and lung tissue were sparse given the destructive nature of sampling. The PK profiles in the ELF and lung tissue are shown in the Supporting Information, Figure S4B,C, respectively.
The observed NCA PK parameters [Cmax, Tmax, AUC0-last, AUCtotal, t1/2, and mean residence time (MRT)] for POA in plasma for the different routes of administration and different formulations are reported in the Supporting Information, Table S1. The half-lives for the different POA formulations following pulmonary administration (PM: 20.6 ± 6.95, PML: 20.3 ± 6.14, and PLS: 26.6 ± 17.3 min) and intratracheal PM (19.5 ± 14.8 min) were longer than the POA half-life in plasma following IV administration (12.5 ± 3.54 min) (Supporting Information, Table S1 and Figure S4A1,A2). The Tmax values following administration of the last pulmonary dose of PM, PML, and PLS were 31.1 ± 2.88, 37.5 ± 6.89, and 36.1 ± 10.9 min, respectively, delayed relative to IT administration of PM (17.7 ± 11.5 min) and attributable to the slow release of POA from the inhalation site and the transit time to the absorption site in the lungs. Dose-normalized POA exposure in the plasma following PO administration was significantly higher (Supporting Information, Figure S4A3) (AUCtotal 1369 ± 481 μM·h) (dose-normalized plasma AUCtotal: 11.4 μM·h) than the pulmonary route [dose-normalized plasma AUCtotal for PM (1.15 μM·h), PML (2.15 μM·h), and PLS (1.89 μM·h)]. The MRTs for PM, PML, and PLS in plasma were 47.9 ± 7.06, 52.9 ± 7.75, and 67.6 ± 184 min, while the IT-PM had an MRT of 33.6 ± 16.3 min. PO POA administration had the longest MRT of 143 ± 59.8 min.
Guinea pigs are a USDA-protected species, and the study was designed with an emphasis on the 3Rs (replacement, reduction, and refinement). Sparse data were available for characterizing PK using NCA for ELF and lung tissue, which requires destructive sampling. For this reason, we utilized a pharmacokinetic modeling approach to explain the disposition of POA in plasma, ELF, and lung tissue using limited observations.
Mechanism-Based PK Model.
A total of 187 plasma PK samples [IV: 37, IT: 11, PO: 60, and pulmonary: 79 (PM:37, PML: 24, and PLS: 18)] were collected from 50 guinea pigs, with 14/187 observations (7.5%) below the limit of quantification (BLQ, 202 nM). Figure 3 depicts the schematic for the MBM developed to describe POA exposure measured in plasma, ELF, and lung tissue following IV, PO, IT, and pulmonary administration. POA PK was described using a three-compartment model with a linear clearance from plasma (CLPOA) and volume of distribution in plasma (VPOA). Linear intercompartmental clearance between lung and plasma (CLd) and between ELF and lung tissue (CLELF) described POA distribution to the lung and ELF compartments. The transfer of POA from the inhalational depot to ELF was described by a first-order transfer rate, denoted by (KForm). The systemic bioavailability after inhalation was denoted by respective bioavailability terms (FForm), where “Form” represents each of the three POA dry powder inhalation formulations. To account for tissue partitioning of POA, a lung-to-plasma partition coefficient (KPLung) was included in the model and was estimated separately for each POA inhalation formulation.
Figure 3.
Mechanism-based pharmacokinetic (PK) model to describe the disposition of pyrazinoic acid (POA) in plasma, lung tissue, and ELF following per oral (PO), intravenous (IV), intratracheal (IT), and pulmonary administration of POA and POA formulations. For IV and PO PK studies, POA was dosed as a solution. For the IT PK study, PM powder was dosed. For pulmonary administration, spray-dried dry powder POA formulations were used. CLPOA, POA clearance; VPOA, POA central volume of distribution; CLd, POA intercompartmental clearance between lung and plasma; Vlung, volume of the lung tissue compartment; CLELF, POA intercompartmental clearance between lung tissue and ELF compartment; VELF, volume of ELF compartment; KForm, first-order transfer rate from pulmonary depot to ELF following pulmonary administration of POA formulations; FForm, bioavailability of POA formulations following pulmonary administration; KIT, first-order transfer rate to ELF from IT depot following IT administration of PM; FIT, bioavailability of intratracheally administered PM; Kaoral, first-order absorption rate following oral administration of POA; FOral, bioavailability of orally administered POA; KPLung, lung to plasma partition coefficient.49
A semiphysiological approach was adopted to describe the POA PK in ELF and lung tissue. The lung tissue volume (Vlung) was fixed to a literature-reported value of 2.0 × 10⁻³ L, which was consistent with the lung tissue volume calculated using the average body weight of the guinea pigs used in the study (2.1 × 10⁻³ ± 3.1 × 10⁻⁴ L).50 Similarly, guinea pig VELF was fixed to the literature-reported value of 1 × 10⁻⁵ L,51 consistent with the calculated VELF of 3.86 × 10⁻⁴ ± 1.62 × 10⁻⁴ L (range: 4.71 × 10⁻⁵ to 8.56 × 10⁻⁴ L) using eq 1. Clearance of POA from ELF, CLELF, was estimated for each POA formulation, and depended on the dissolution of dry powders in ELF and release kinetics of POA from the different formulations. PK parameters CLd, CLELF, KForm, FForm, and KPLung for the systemic, intratracheal, and oral routes were fixed to the values estimated during the sequential development process. The KPLung determines the partitioning of POA between the lung tissue and plasma, depending on the composition of the formulation and release of POA from the POA-excipient complex.
The differential equations for simultaneously modeling the disposition of POA following administration of POA via the different routes of administration are described below.
IV-POA and Central Compartment.
The disposition of POA following IV administration is described by eq 4
| (4) |
Oral POA.
Disposition of oral POA is described by eq 5
| (5) |
Pulmonary and IT Dose of POA Formulations.
The pulmonary administration of POA formulations and intratracheal administration of PM via the depot compartment are described by eqs 6 and 7
| (6) |
| (7) |
From the depot compartments, the POA distributes to the ELF compartment (eq 8) followed by lung tissue (eq 9) and plasma (eq 4).
| (8) |
| (9) |
The residual unexplained variability is modeled using a combined additive plus proportional error model
| (10) |
where V is the variability in the observed POA concentration, Y; ε1 (%), the proportional error, is based on the performance of the LC–MS/MS assay for quantifying POA (25%) in the different matrices; and ε2 (nM), an additive error, is fixed to half the lower limit of quantification (101 nM). The Beal3 method was used to handle the BLQ data.52
The model describes the observed PK data well for the different POA formulations and POA administered via different routes (Figure 4 and Supporting Information, Figure S5). Initially, a one-compartment model was developed to describe the observed IV PK with good precision. During subsequent model development, the systemic disposition parameters (CLPOA and VPOA) were fixed to these estimated values. Similarly, oral POA PK was described by a one-compartment model with good precision, and the estimated absorption rate constant KaOral was estimated to be 0.958 h−1 and was fixed in the final model. Model performance was evaluated based on the goodness of fit plots (Supporting Information, Figures S6–S8). The observed versus predicted POA concentration plots (Supporting Information, Figure S6) indicated that the model better captured POA PK for the IV (Supporting Information, Figure S6A) route and following pulmonary administration of PM (Supporting Information, Figure S6D) and PML (Supporting Information, Figure S6E) than POA administration via the oral (Supporting Information, Figure S6B) and IT (Supporting Information, Figure S6C) routes and for PLS (Supporting Information, Figure S6F) following pulmonary administration. The standardized residuals versus PRED and Time were evenly distributed around zero, indicating no major bias in the model. The final PK model parameters were estimated with good precision, with a CV % < 32% (Table 2).
Figure 4.
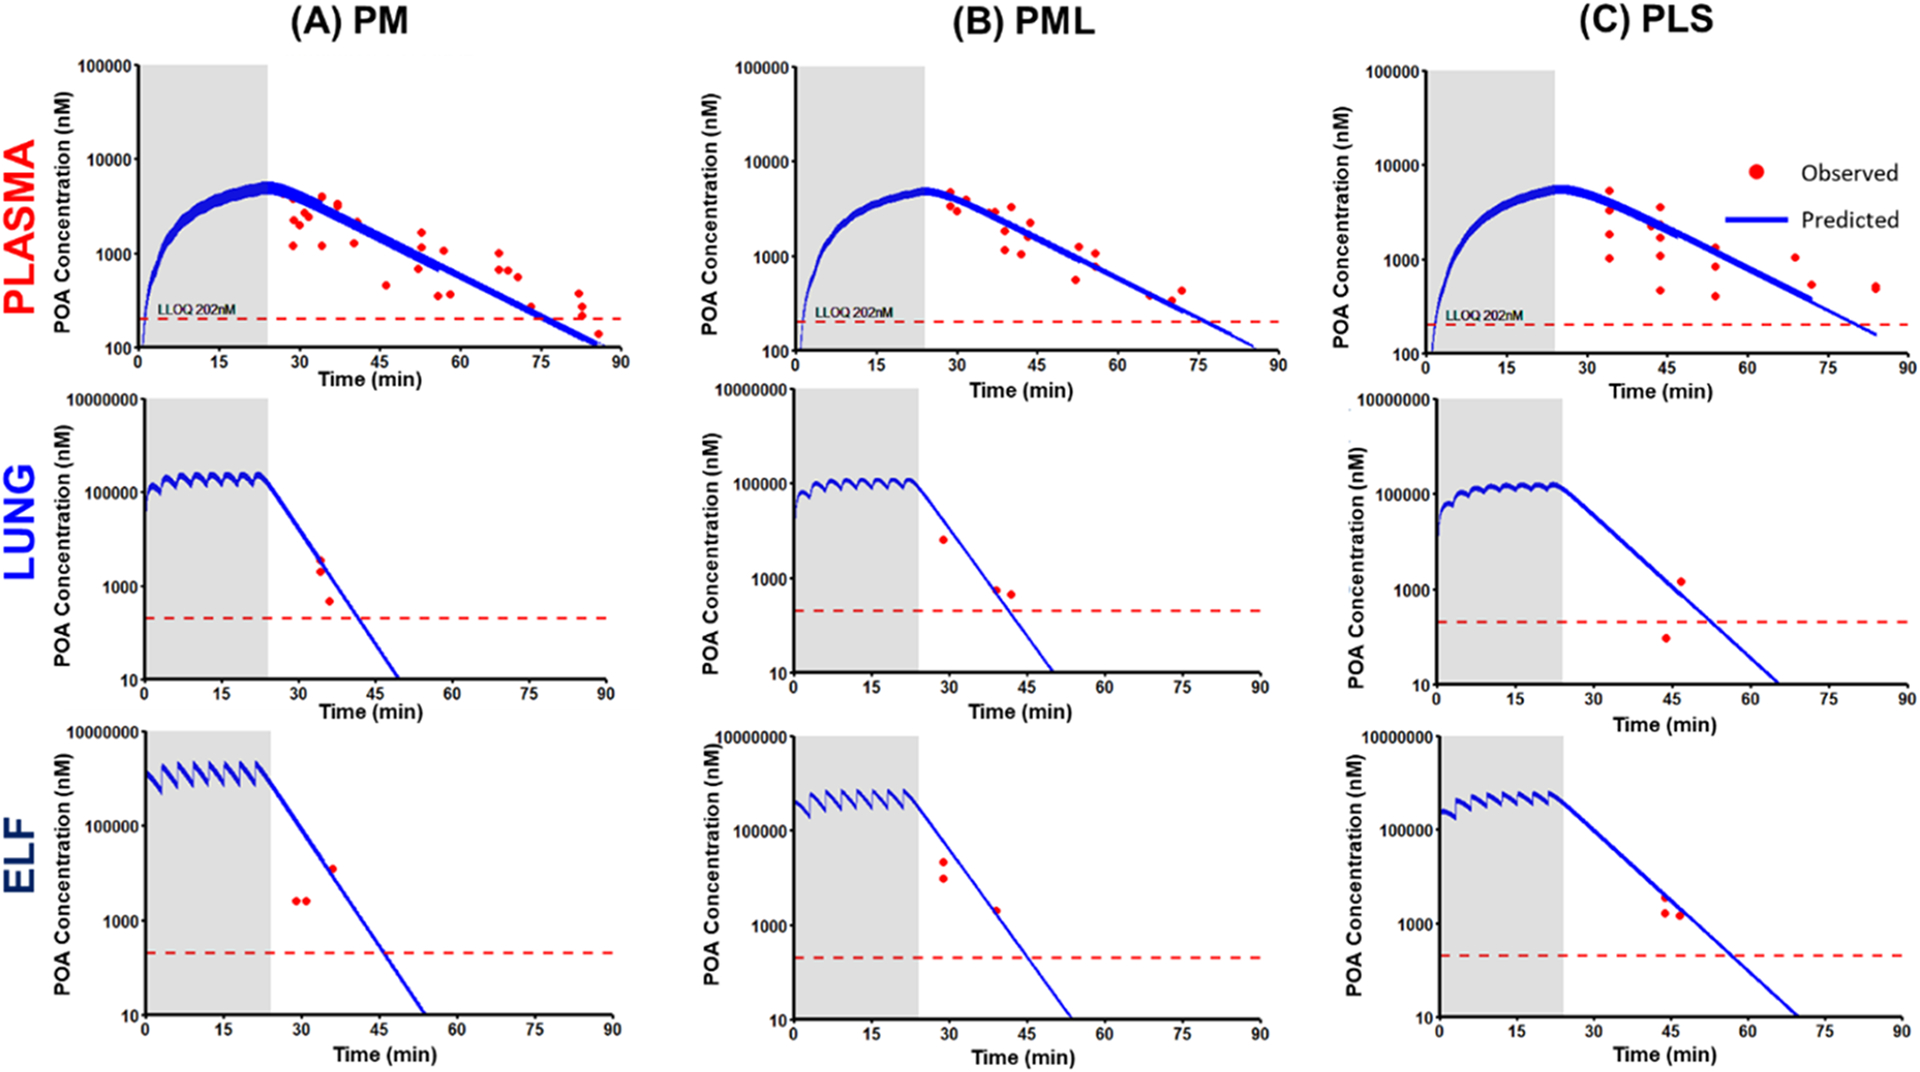
Mechanism-based model-predicted POA concentration versus time profiles following pulmonary administration of POA dry powder formulations (A) PM, (B) PML, and (C) PLS. Solid blue lines are model-predicted concentrations, while red dots are the observed POA concentrations. The figure shows the predicted concentration versus time profiles in plasma (top row), lung tissue (middle row), and ELF (bottom row). The dashed red line indicates the lower limit of quantification (LLOQ 202 nM). The shaded region represents the total duration of 24 min over which the POA formulation was dosed.
Table 2.
Mechanism-Based PK Model Estimates for Model Parameters Characterizing PK of POA in Plasma, Lung Tissue, and ELF Compartments Following PO, IV, IT and Pulmonary Administration of POA and POA Dry Powder Formulations (PM, PML, and PLS)a
| formulation-specific parameters | definition | PM | PML | PLS | |||
|---|---|---|---|---|---|---|---|
| estimate | CV % | estimate | CV % | estimate | CV % | ||
| CLd (L/h) | POA intercompartmental clearance between lung tissue and plasma | 0.188 | 0.109 | 0.172 | 14.3 | 0.129 | 0.478 |
| CLELF (L/h) | POA intercompartmental clearance between lung tissue and ELF | 0.0261 | 0.0564 | 0.0369 | 0.323 | 0.0442 | 0.208 |
| KForm (h−1) | first-order transfer rate to ELF after pulmonary administration of POA formulations | 22.6 | 0.0219 | 20.9 | 16.4 | 13.9 | 3.17 |
| FForm (%) | bioavailability of POA formulations after pulmonary administration | 17.7 | 2.01 | 36.0 | 32.0 | 40.6 | 19.5 |
| KPLung | lung to plasma partition coefficient of POA | 0.793 | 0.0033 | 0.795 | 14.3 | 0.800 | 0.314 |
| shared parameters | definition | ||||||
| CLPOA (L/h) | POA clearance from plasma | 0.808 | FIX | ||||
| VPOA (L) | volume of distribution, plasma | 0.205 | FIX | ||||
| Vlung (L) | volume of distribution, Lung tissue | 2 × 10⁻³ | FIX | ||||
| VELF (L) | volume of distribution, ELF | 1 × 10⁻⁵ | FIX | ||||
| KIT (h−1) | first-order transfer rate to ELF after intratracheal administration | 3.55 | FIX | ||||
| FIT (%) | bioavailability after intratracheal administration | 100 | FIX | ||||
| KaOral (h−1) | first-order absorption rate | 0.958 | FIX | ||||
| FOral (%) | bioavailability after oral administration | 100 | FIX | ||||
| error parameters | |||||||
| residual error (nM) | additive error | 101 | FIX | ||||
| residual error (%) | proportional error | 25 | FIX | ||||
Abbreviations: SE, standard error expressed as CV %, percentage coefficient of variation; IT, intratracheal.
The first-order transfer rate to ELF from the pulmonary depot was higher for PM (KPM: 22.6 h−1) than PML (KPML: 20.9 h−1), while PLS had the slowest transfer rate (KPLS: 13.9 h−1). The model-predicted systemic bioavailability for PM (FPM: 17.7%) was half that predicted for PML (FPML: 36.0%) and PLS (FPLS: 40.6%), indicating a lower systemic exposure for PM. The KPLung was comparable for all three POA formulations (79%), indicating ~79% of POA is available to partition between lung tissue and plasma.
The AUC0–1.5 h, Cmax, and Tmax were calculated using the model-predicted plasma, ELF, and lung tissue concentrations over time profiles for the three POA formulations and for POA administered via the different routes (Table 3). The parameters reported in Table 3 were dose-normalized. Systemic exposure based on the dose-normalized AUC0–1.5 h,Plasma was higher for the IV (1.23 nM·h) and IT (1.25 nM·h) routes than the oral (0.840 nM·h) route. Of the POA formulations, PM had the lowest systemic exposure (AUC0–1.5 h,Plasma: 0.226 nM·h) compared with PML (0.455 nM·h) and PLS (0.503 nM·h).
Table 3.
Comparison of Model-Predicted AUC, Cmax, and Tmax of POA in Plasma, Lung Tissue, and ELF Compartments Following PO, IV, IT, and Pulmonary Administration of POA and POA Dry Powder Formulations (PM, PML, and PLS)a·
| PK parameter | route of administration | formulation form | plasma | lung | ELF | lung-to-plasma exposure ratiob | ELF-to-plasma exposure ratiob |
|---|---|---|---|---|---|---|---|
| dose-normalized AUC0–1.5 h,pred (nM·h) | IV-POA | solution | 1.23 | 1.56 | 1.56 | 1.27 | 1.27 |
| PO-POA | solution | 0.840 | 1.05 | 1.05 | 1.25 | 1.25 | |
| IT-PM | dry powder | 1.25 | 6.83 | 45.1 | 5.48 | 36.2 | |
| pulmonary-PM | dry powder | 0.226 | 6.87 | 46.0 | 30.4 | 203 | |
| pulmonary-PML | dry powder | 0.455 | 7.35 | 34.4 | 16.2 | 75.7 | |
| pulmonary-PLS | dry powder | 0.503 | 9.69 | 32.3 | 19.3 | 64.2 | |
| dose-normalized Cmax,pred (nM) | IV-POA | solution | 4.85 | 5.18 | 5.18 | ||
| PO-POA | solution | 0.742 | 0.935 | 0.935 | |||
| IT-PM | solution | 1.49 | 20.4 | 144 | |||
| pulmonary-PM | dry powder | 0.425 | 20.0 | 171 | |||
| pulmonary-PML | dry powder | 0.844 | 20.9 | 121 | |||
| pulmonary-PLS | dry powder | 0.908 | 25.8 | 98.2 | |||
| Tmax (min) | IV-POA | solution | 0.091 | 2.48 | 2.52 | ||
| PO-POA | solution | 28.8 | 29.4 | 29.4 | |||
| IT-PM | solution | 13.4 | 2.58 | 1.06 | |||
| pulmonary-PM | dry powder | 23.9 | 21.6 | 15.5 | |||
| pulmonary-PML | dry powder | 24.1 | 22.0 | 18.5 | |||
| pulmonary-PLS | dry powder | 25.0 | 22.1 | 21.1 |
Abbreviations: IV, intravenous; PO, per oral; IT, intratracheal; Cmax,pred (nM), maximum predicted POA concentration; AUC0–1.5 h,pred (nM·h), model-predicted area under the curve from 0 to 1.5 h for POA.
Exposure ratio = AUCLung OR ELF/AUCPlasma.
PM achieved a higher Cmax,ELF of 171 nM within 15.5 min of administration than PML (Cmax,ELF 121 nM; Tmax,ELF: 18.5 min) and PLS (Cmax,ELF 98.2 nM; Tmax,ELF: 21.1 min). This rapid Tmax,ELF for PM was correlated with the faster transfer rate (KPM: 22.6 h−1) from depot to the ELF compartment. PM had the highest ELF-to-plasma and lung tissue-to-plasma exposure ratios (ELF: 203; lung tissue: 30.4) compared with PML (ELF: 75.7; lung tissue: 16.2) and PLS (ELF: 64.2; lung tissue: 19.3).
Since PM is transferred at a higher rate into the ELF following administration, allowing it to achieve a higher peak concentration within a short time frame and the ability to effectively penetrate both ELF and lung tissue, we regarded it as a superior formulation. PM had the lowest systemic bioavailability (i.e., lowest systemic exposure). Furthermore, PM achieved the highest exposure at likely sites of Mtb infection i.e., the AUCs in the ELF and lung tissue were high, which is necessary for the efficacy of TB therapy and to limit off-target effects.
Scaling of Human Parameters and Simulation of Human Dose.
The developed mechanism-based PK model along with published clinical PK data of PZA/POA were used to predict an efficacious human dose of inhaled PM dry powder.
For scaling the human PK parameters, we considered the clearance and volume of POA from previously published clinical studies where PZA and POA PK were characterized after dosing of PZA.40–42 Other POA PK parameters estimated for PM in guinea pigs using our mechanism-based model were scaled using single species allometric scaling (Supporting Information, Table S2). We calculated the POA Cmax,ELF based on the ELF to plasma PZA concentration ratio and penetration of PZA to the ELF. Based on the literature reports the calculated POA Cmax,ELF ranges between 91.4 and 134 mg/L.20,40,45,53,54 (Supporting Information, Table S3).
We performed our simulations targeting an AUCELF/MIC similar to the above-stated AUCplasma/MIC target for PZA (9.68–14.5) considering a dose of 300 mg administered once a day [total dry powder 375 mg: 300 mg POA (80%) + 75 mg maltodextrin (20%)] or 150 mg administered twice a day [total dry power 187.5 mg: 150 mg POA (80%) + 37.5 mg maltodextrin (20%)]. The total daily dose achieved an AUCELF/MIC of 14.1, and Cmax,ELF of 282 mg/L (range: 171–454 mg/L) for Mtb isolate with MIC of 8 mg/L (Supporting Information, Table S4). Given the limitation on the drug loading of the capsule in an inhalation device, the amount that can be delivered to the lung on a single breath (from a single capsule) and the number of capsules per dose, 187.5 mg administered twice a day is feasible. This calculated dose achieves the desired AUC and a Cmax > 35 μg/mL predictors of efficacy and would support human studies.
DISCUSSION
Given the scarcity of new drugs effective against drug-resistant Mtb, new therapeutics would be a welcome addition to existing therapies. In addition, improved dosing strategies for existing TB drugs would help to ensure adequate exposure at the site of infection (i.e., ELF and lung tissue) resulting in improved bacterial clearance, shorten treatment duration, and will limit the emergence of resistance. PZA is an integral component of current TB therapy that can shorten treatment duration.9,10 Among MDR-TB cases, defined as resistant to first-line drugs rifampicin and isoniazid, 60.5% are also resistant to PZA.17 The majority (~90%) of PZA-resistant Mtb isolates have pncA mutations.16 To circumvent this most common category of PZA resistance, direct delivery of POA, the active moiety of PZA, is a promising approach. POA and POA esters have shown activity against PZA-resistant pncA mutant strains in vitro.22,38,55 However, when tested in mice, orally administered POA at the human-equivalent dose for PZA was not efficacious and higher oral POA doses are not feasible without significant tolerability problems.21
Need for Direct Pulmonary Administration of POA.
Based on our NCA analysis of oral and IV PK, the oral bioavailability was estimated to be 97–100%. Despite this high systemic exposure, oral POA had poor penetration into the ELF based on the NCA-calculated ELF-to-plasma and lung tissue-to-plasma exposure ratios of 0.15 and 0.65, respectively. These observations are consistent with lung and tuberculous lesion tissue-to-plasma ratios ranging between 0.2 and 0.6 for rabbits infected with Mycobacterium bovis (a pncA-deficient strain) which were treated with PZA and POA was quantified.20 In a separate study, when POA was administered orally to Mtb-infected C3HeB/FeJ mice at 450 mg/kg twice daily, the ELF-to-plasma exposure ratio was 0.45.21 This lower penetration into ELF after oral dosing may explain the lack of efficacy observed previously in mouse21
Monte Carlo simulations based on the relationship between drug exposure at the site of infection and the resulting killing activity obtained from in vitro hollow fiber infection,56 preclinical, and clinical PZA PK data indicate that the drug exposure achieved in ELF is one predictor of long-term outcomes of PZA therapy. The sterilizing effect was associated with the PK/PD index, the ratio of exposure achieved in ELF (AUCELF), and the minimum inhibitory concentration (MIC), a surrogate of PD response. Similarly, a Cmax in plasma < 35 μg/mL was associated with PZA treatment failure and death.46,48 The lack of efficacy of oral POA in mice may be explained by low exposure achieved in the ELF.21 To overcome these limitations, we previously evaluated nebulized POA esters, POA analogs that release POA independent of Mtb pncA. We also evaluated inhaled pyrazinoic acid/ester dry powder (PDP), a combination of POA and POA esters. Both inhaled POA esters and PDP were effective in combination with oral rifampicin for treating Mtb-infected guinea pigs compared with untreated animals. Moreover, the results indicated that inhaled PDP plus rifampicin was more effective than nebulized POA ester plus rifampicin, suggesting that the POA in the PDP dry powder formulation is more effective.38,55
POA Dry Powder Formulations and Impact of Excipients on Pulmonary PK.
Here we developed three POA dry powder formulations for pulmonary delivery and evaluated their physicochemical characteristics and PK after direct pulmonary administration to guinea pigs. The aerodynamic diameter of dry powder particles and their flow and dispersion properties determine their ability to effectively penetrate deep into the lungs where Mtb reside.34 Maltodextrin and leucine were included as excipients to improve the flow characteristics of the dry powder formulations. Maltodextrin is a saccharide-based excipient with a lower dextrose equivalent (DE) rating and greater absorptive potential, as it exhibits a higher degree of branching and increased surface area. Its inclusion renders the formulation less hygroscopic while promoting its dissolution in mucus. Maltodextrin can provide a glassy matrix that helps improve stability and helps increase the encapsulation efficiency of the spray-dried powder.57
Leucine, when used with low-solubility compounds such as azithromycin, showed accelerated dissolution attributed to increase in solubility of azithromycin.58 The solubility increase in azithromycin was dependent on the leucine concentration. Also, as leucine is a hydrophobic amino acid, it can potentiate the penetration of spray-dried powder across different cell membranes. This was evidenced by the high systemic exposure for PLS containing 50% leucine compared with PML containing 30% leucine.58,59
Apart from improved dispersion, these excipients impacted the half-life of POA, helping to retain active POA and help redistribute it back to lung tissue and ELF to further contribute to efficacy. The plasma half-lives following pulmonary administration (IT: 19.5 min; inhalation: PM: 20.6 min, PML: 20.3 min, and PLS: 26.6 min) of POA dry powder formulations were longer than that after IV (12.5 min) administration. Similar observations have been noted with capreomycin in humans, where its apparent half-life after pulmonary administration increased by ~40% compared with its systemic half-life.29,31 Similarly, in guinea pigs, the half-life of capreomycin increased by ~36% with the addition of leucine (capreomycin/leucine 80:20).29,31
Pulmonary PK of POA and Mechanism-Based Modeling.
Guinea pigs were chosen for this study as they are a well-established animal model for evaluating inhaled therapies, and they have specific advantages for evaluating anti-Mtb therapies because they develop hypoxic caseous granulomas with necrotic centers, the pathological hallmark of human TB.60 However, a challenge of working with guinea pigs, a USDA-protected species is the number of animals used to characterize PK in plasma, ELF, and lung tissue while adhering to 3Rs principles. This resulted in sparse PK samples for POA PK characterization in ELF and lung tissue, as a significant proportion of samples (64% in lung and 56% in ELF) were BLQ. Further, because the inhalational dosing strategy involved repeated doses administered every 3 min in the inhalation chamber this limited our ability to obtain early PK samples (sampling was feasible only after administration of the last dose, i.e., at 24 min). Hence, our mechanism-based PK model was developed to effectively describe POA disposition following pulmonary administration to guinea pigs. The resulting in silico model and its use to select a POA formulation achieving the highest exposure at the site of infection is the first of its kind.
The approach used to develop this mechanism-based PK model was adopted from a model developed for nebulized colistin.61 Furthermore, using an innovative semiphysiological approach enabled us to optimize the model to estimate the POA exposure in ELF and lung tissue with improved precision. A similar approach has been used to describe the disposition of nebulized colistin in rats.61 Using this semiphysiological approach, we successfully estimated KForm, the model parameter describing the rate of transfer of POA to ELF after pulmonary administration of the POA formulation, to assist in the selection of the optimal inhalation formulation. Of the three formulations evaluated here, the model-predicted that PM had the fastest transfer rate to the ELF (22.6 h−1 vs. PML: 20.9 h−1 and PLS: 13.9 h−1). A lower MMAD is indicative of higher lung deposition,62 and PM had a comparatively lower MMAD than the other formulations. Based on transport by diffusion and mucociliary clearance in the lung, a fraction of POA will partition between the lung and plasma after pulmonary administration. Inclusion of partition coefficient KPLung was necessary to account for this distribution in the lung. The estimated KPLung values were consistent across the three formulations suggesting there is limited impact of excipients if any on the release of POA from the formulation. After dissolution and release from the formulation in the ELF, POA reaches the lung tissue and plasma independent of the excipient.
The model-based POA exposure predictions helped us to evaluate the penetration of these formulations into both ELF and lung tissue. The dose-normalized AUC0–1.5 h,ELF and AUC0–1.5 h,Lung calculated based on model-predicted concentrations in the ELF and lung tissue compartments were higher for POA dry powder formulations than POA administered via the IV and oral routes. PM achieved the highest POA exposure in the ELF (AUC0–1.5 h,ELF: 46.0 nM·h) and ELF-to-plasma exposure ratio (203) and the lowest systemic exposure (AUC0–1.5 h,plasma: 0.226 nM·h) of the inhaled POA formulations, indicating high pulmonary bioavailability. The low systemic exposure is attractive, as this will help to limit drugrelated toxicity,21,63 as pulmonary POA will be used as part of multi-drug therapy with other antitubercular drugs.
Feasibility of Pulmonary POA and Simulation of Human Dose.
One of the important considerations for inhalation therapy with PM is the amount of powder that can be delivered safely. Capreomycin, at a dose of 300 mg, was administered to human participants in a phase I trial (360 mg total dry powder, 12 capsule of 30 mg).31 Commercially, a tobramycin dose of 112 mg is available for the treatment of cystic fibrosis and is administered via a Podhaler as 4 capsules, each containing 28 mg of tobramycin, twice daily. The inhaled dry powder dose achieved systemic exposure comparable to that achieved with 300 mg tobramycin inhalation solution (TIS, TOBI, 300 mg tobramycin/5 mL).64 Colistin methanesulfonate (CMS) was delivered using a Twincer as a single dose65,66 of 25–55 mg, while a CMS dose of 125 mg was administered twice daily using the EMA-approved Colobreathe apparatus.67 In another phase I study, 32.5 mg of ciprofloxacin was delivered as a single capsule (50 mg total dry powder).68 For the different drugs administered via the inhalation route described above, the total dry powder delivered per day ranged from 250 to 360 mg, and no adverse events were reported except intermittent cough. Moreover, patient compliance and satisfaction were higher for dry powders than nebulization.
At present, no PK/PD index is established for POA, hence, based on the PK/PD index for PZA. Hence, the simulations to calculate the human dose for pulmonary administration targeted AUCELF/MIC of 9.68–14.5 as the target PK/PD for pulmonary POA.46,48 We also considered, plasma Cmax > 35 μg/mL as another predictor of efficacy.46 Using these predictors and anticipated limit on the amount of dry powder per dose, a dose of 150 mg POA (187.5 mg total PM dry powder) (80% POA and 20% maltodextrin) given twice a day was calculated. At this dose, the POA Cmax,ELF is above the calculated Cmax,ELF (91.4–134 μg/mL) from clinical studies with AUCELF/MIC of 14.1 for a Mtb strain with MIC of 8 μg/mL. Hence, the calculated PM dose (5.36 mg/kg per day or 2.68 mg/kg per dose) could achieve an efficacious Cmax and exposure at a much lower dose than the clinical oral PZA regimen (15–30 mg/kg per day), leading to a reduction in systemic toxicities and preventing the development of bacterial resistance.
The predicted systemic exposure of POA after pulmonary administration of PM is 2-fold lower than POA exposure observed with a clinical dose of 25–30 mg/kg.20,40 Additionally, a plasma concentration greater than 10 mg/L is associated with arthralgia due to hyperuricemia caused by competitive inhibition of xanthine oxidase by POA. The predicted POA Cmax of 2.92 mg/L in plasma is 3-fold lower than this concentration. Based on these facts, further dose optimization in infected animals as monotherapy and in combination with currently used antitubercular agents is warranted to further strengthen our dose selection of PM for pulmonary delivery.
Perspective on POA Resistant Strains.
Shi et al.69 suggest multiple gene mutations which confer resistance to POA with a significant number of strains with mutation in panD. Drug exposure at the site of infection can be a factor that contributes to mutations in these bacterial genes. As reported by Gopal et al.,70 POA-resistant strains were observed at a POA concentration of 4 mM, equivalent to a POA concentration of 400 μg/mL. Dose-normalized Cmax,ELF achieved with pulmonary administration of PM formulation was much lower than this concentration. Given the fact that there are bacterial strains emerging with multiple new resistance mechanisms against PZA and POA, it is important to understand them in the context of the exposure achieved at the site of infection. Future in vivo studies in infected animals will help determine the pharmacodynamic response to exposure achieved at the site of infection with inhaled PM.
Our physicochemical characterization combined with in vivo and in silico PK analyses sets the stage for the future development of inhaled POA. However, the study design and approach have some limitations. Excipients counter strong interparticle cohesive forces and improve inspiratory flow rates and physiochemical characteristics. However, inclusion of excipients presents a challenge for balancing the percentage of excipient to total powder mass per dose to ensure that the total powder mass that can be inhaled in a single bolus or in rapid succession of actuations contains an adequate amount of drug, i.e., POA. This is compounded by the moderate lung delivery efficiencies that limit the maximum dose that can be delivered per dose via direct pulmonary administration without causing localized irritation or toxicity, which depends on the inspiration rate.64 PM consists of 80% POA and 20% maltodextrin, making it an ideal candidate with lower excipient and higher active drug content.
The results were obtained after inhalation of POA by guinea pigs in a custom-made chamber which do not represent the high efficiency of delivery that occurs with inhalers in humans. With the use of a dose calculation equation, we minimized nonspecific losses of the administered dose when developing the model. Finally, there is no clinically established PK/PD index for POA, especially for its direct pulmonary administration. The currently available PK/PD index is based on the parent drug, PZA dosed orally, which might be misleading as the POA penetration into ELF is significantly lower following oral administration of PZA. Further PK/PD multiple daily-dose studies in guinea pigs infected with Mtb would help to further our knowledge about the inclusion of inhaled POA in the management and treatment of MDR-TB. Cytotoxicity studies to understand the relationship between POA exposure in the lung and peak concentration in the ELF would be beneficial in designing POA treatment regimens. In addition, further PK studies might be conducted in infected animals to evaluate the effect of disease on the disposition of drug.
CONCLUSIONS
In conclusion, direct pulmonary administration of POA dry powder formulations achieved significantly higher exposure in ELF and lung tissue than POA administered via the oral and intravenous routes. Our mechanism-based model described the sparsely sampled data in lung and ELF. The data and model predictions suggest that PM is a suitable formulation for further characterization and evaluation in efficacy studies. PML has a PK profile comparable to PM and could serve as an alternative to PM. Future in vivo studies evaluating the POA exposure (PK) required for efficacy (PD) will further our knowledge about the inclusion of inhaled POA in the management and treatment of MDR-TB. The calculated human dose of 187.5 mg PM administered twice a day appears to be feasible via the inhalation route (5.36 mg/kg for a 70 kg person) to achieve the necessary drug exposure associated with efficacy, which is encouraging for future clinical evaluation. This approach of using in vivo PK analyses combined with compartmental modeling will help future model-informed drug development (MIDD) of inhalational formulations for current and newer TB drugs.
Supplementary Material
ACKNOWLEDGMENTS
The authors acknowledge financial support from the National Institute of Allergy and Infectious Diseases through grant number R21AI131241 and the Potts Foundation.
Funding
NIH R21AI131241 to M.B. and A.J.H. Potts Foundation to A.J.H. Ruth L. Kirschstein National Research Service Award T32AI007151 to A.A.S from NIH Allergy and Infectious Diseases.
ABBREVIATIONS
- TB
tuberculosis
- Mtb
Mycobacterium tuberculosis
- PZA
pyrazinamid
- POA
pyrazinoic acid
- PK
pharmacokinetic
- MBM
mechanism-based pharmacokinetic model
- ELF
epithelial lining fluid
- MDR-TB
multi-drug-resistant TB
- DS-TB
drug-susceptible TB
- PZAse
pyrazinamidase
- PM
POA maltodextrin
- PML
POA maltodextrin and leucine
- PLS
POA leucine Salt
- TGA
thermogravimetric analysis
- NGI
next generation impactor
- XRPD
X-ray powder diffraction
- APSD
aerodynamic particle size distribution
- USP
United States Pharmacopeia
- HPMC
hydroxypropyl methylcellulose
- MMAD
mass median aerodynamic diameter
- GSD
geometric standard deviation
- FPD
fine particle dose
- FPF
fine particle fraction
- IACUC
Institutional Animal Care and Use Committee
- JVC
Jugular vein catheter
- BALF
bronchoalveolar lavage fluid
- IV
intravenous
- IT
intratracheal
- PO
oral
- NCA
non-compartmental analysis
- AUC
area under the concentration curve
- t 1/2
half-life
- T max
time to peak concentration
- C max
peak concentration
- ML
maximum likelihood estimation
- KaOral
first-order oral absorption rate
- F Oral
oral bioavailability
- K IT
first-order transfer rate between intratracheal depot to ELF
- F IT
intratracheal bioavailability
- K Form
first-order transfer rate of POA formulations between inhalation depot to ELF
- F Form
bioavailability after pulmonary administration of POA formulations
- BWH
body weight of humans
- BWGP
body weight of guinea pig
- P H
Scaled PK parameter for human
- P GP
PK parameter for guinea pig
- MRT
mean residence time
- CLPOA
POA clearance from plasma
- V POA
volume of distribution in plasma
- CLd
intercompartmental clearance between lung and plasma
- CLELF
intercompartmental clearance between ELF and lung
- KPLung
lung-to-plasma partition coefficient
- V Lung
lung tissue volume
- V ELF
volume of the ELF
- MIC
minimum inhibitory concentrati
Footnotes
Supporting Information
The Supporting Information is available free of charge at https://pubs.acs.org/doi/10.1021/acs.molpharmaceut.3c00199.
Experimental setup for pulmonary dosing of guinea pigs; APSD from NGI for spray-dried POA and POA formulations; X-ray powder diffraction; PK profiles for POA in plasma, ELF, and lung tissue; predicted concentration versus time after IV, oral POA, and IT-PM; goodness-of-fit plots of the final mechanism-based PK model; non-compartmental analysis for plasma PK; scaling of human PK parameters for POA; literature-reported Cmax values for PZA in plasma and ELF; model-simulated AUC and Cmax after pulmonary delivery of PM; and summary of PK studies (PDF)
Complete contact information is available at: https://pubs.acs.org/10.1021/acs.molpharmaceut.3c00199
The authors declare no competing financial interest. None of the authors have conflicts with respect to the work described in this paper.
Contributor Information
Shekhar B. Yeshwante, Division of Pharmacotherapy and Experimental Therapeutics, Eshelman School of Pharmacy, University of North Carolina at Chapel Hill, Chapel Hill, North Carolina 27599, United States
Patrick Hanafin, Division of Pharmacotherapy and Experimental Therapeutics, Eshelman School of Pharmacy, University of North Carolina at Chapel Hill, Chapel Hill, North Carolina 27599, United States.
Brittany K. Miller, Department of Microbiology, UNC School of Medicine, University of North Carolina at Chapel Hill, Chapel Hill, North Carolina 27599, United States
Laura Rank, Department of Microbiology, UNC School of Medicine, University of North Carolina at Chapel Hill, Chapel Hill, North Carolina 27599, United States.
Sebastian Murcia, Department of Microbiology, UNC School of Medicine, University of North Carolina at Chapel Hill, Chapel Hill, North Carolina 27599, United States.
Christian Xander, Department of Microbiology, UNC School of Medicine, University of North Carolina at Chapel Hill, Chapel Hill, North Carolina 27599, United States.
Ayano Annis, Department of Microbiology, UNC School of Medicine, University of North Carolina at Chapel Hill, Chapel Hill, North Carolina 27599, United States.
Victoria K. Baxter, Department of Pathology and Laboratory Medicine, University of North Carolina at Chapel Hill, Chapel Hill, North Carolina 27599, United States;
Elizabeth J. Anderson, Department of Pathology and Laboratory Medicine, University of North Carolina at Chapel Hill, Chapel Hill, North Carolina 27599, United States;
Brian Jermain, Division of Pharmacotherapy and Experimental Therapeutics, Eshelman School of Pharmacy, University of North Carolina at Chapel Hill, Chapel Hill, North Carolina 27599, United States.
Robyn Konicki, Division of Pharmacotherapy and Experimental Therapeutics, Eshelman School of Pharmacy, University of North Carolina at Chapel Hill, Chapel Hill, North Carolina 27599, United States.
Alan A. Schmalstig, Department of Microbiology, UNC School of Medicine, University of North Carolina at Chapel Hill, Chapel Hill, North Carolina 27599, United States
Ian Stewart, Technology Advancement and Commercialization, RTI International, Research Triangle Park, North Carolina 27709, United States.
Miriam Braunstein, Department of Microbiology, UNC School of Medicine, University of North Carolina at Chapel Hill, Chapel Hill, North Carolina 27599, United States.
Anthony J. Hickey, Technology Advancement and Commercialization, RTI International, Research Triangle Park, North Carolina 27709, United States; Division of Pharmacoengineering and Molecular Pharmaceutics, Eshelman School of Pharmacy, University of North Carolina at Chapel Hill, Chapel Hill, North Carolina 27599, United States;
Gauri G. Rao, Division of Pharmacotherapy and Experimental Therapeutics, Eshelman School of Pharmacy, University of North Carolina at Chapel Hill, Chapel Hill, North Carolina 27599, United States;
REFERENCES
- (1).Organization WH. Global Tuberculosis Report 2022; World Health Organization: Geneva, 2022. [Google Scholar]
- (2).Houben RMGJ; Dodd PJ The Global Burden of Latent Tuberculosis Infection: A Re-estimation Using Mathematical Modelling. PLoS Med. 2016, 13, No. e1002152. [DOI] [PMC free article] [PubMed] [Google Scholar]
- (3).Organization WH. WHO Consolidated Guidelines on Tuberculosis: Module 4: Treatment: Drug-Susceptible Tuberculosis Treatment: Web Annexes. WHO Consolidated Guidelines on Tuberculosis: Module 4: Treatment: Drug-Susceptible Tuberculosis Treatment: Web Annexes; World Health Organization, 2022. [PubMed] [Google Scholar]
- (4).Nahid P; Mase SR; Migliori GB; et al. Treatment of drug-resistant tuberculosis. An official ATS/CDC/ERS/IDSA clinical practice guideline. Am. J. Respir. Crit. Care Med 2019, 200, e93–e142. [DOI] [PMC free article] [PubMed] [Google Scholar]
- (5).Organization WH. WHO Consolidated Guidelines on Tuberculosis. Module 4: Treatment-Drug-Resistant Tuberculosis Treatment, 2022 Update; World Health Organization, 2022. [PubMed] [Google Scholar]
- (6).Dartois V The path of anti-tuberculosis drugs: from blood to lesions to mycobacterial cells. Nat. Rev. Microbiol 2014, 12, 159–167. [DOI] [PMC free article] [PubMed] [Google Scholar]
- (7).Pasipanodya JG; Gumbo T The Relationship between Drug Concentration in Tuberculosis Lesions, Epithelial Lining Fluid, and Clinical Outcomes; Oxford University Press: US, 2021; pp e3374–e3376. [DOI] [PubMed] [Google Scholar]
- (8).Li S-Y; Tasneen R; Tyagi S; et al. Bactericidal and sterilizing activity of a novel regimen with bedaquiline, pretomanid, moxi-floxacin, and pyrazinamide in a murine model of tuberculosis. Antimicrob. Agents Chemother 2017, 61, No. e00913–17. [DOI] [PMC free article] [PubMed] [Google Scholar]
- (9).Lamont EA; Dillon NA; Baughn AD The bewildering antitubercular action of pyrazinamide. Microbiol. Mol. Biol. Rev 2020, 84, No. e00070–19. [DOI] [PMC free article] [PubMed] [Google Scholar]
- (10).Zhang Y; Mitchison D The curious characteristics of pyrazinamide: a review. Int. J. Tuberc. Lung Dis 2003, 7, 6–21. [PubMed] [Google Scholar]
- (11).Zhang Y; Shi W; Zhang W; Mitchison D Mechanisms of pyrazinamide action and resistance. Microbiol. Spectrum 2014, 2, 2–4. [DOI] [PMC free article] [PubMed] [Google Scholar]
- (12).Prideaux B; Via LE; Zimmerman MD; et al. The association between sterilizing activity and drug distribution into tuberculosis lesions. Nat. Med 2015, 21, 1223–1227. [DOI] [PMC free article] [PubMed] [Google Scholar]
- (13).Seaworth BJ; Griffith DE Therapy of Multidrug-Resistant and Extensively Drug-Resistant Tuberculosis. In Tuberculosis and Nontuberculous Mycobacterial Infections; Wiley, 2017; pp 129–158. [DOI] [PMC free article] [PubMed] [Google Scholar]
- (14).endTb. https://endtb.org (accessed January 15, 2023).
- (15).Drugs WGoNT. Working Group on New TB Drugs. https://www.newtbdrugs.org/pipeline/regimens (accessed December 18, 2022).
- (16).Mphahlele M; Syre H; Valvatne H; et al. Pyrazinamide Resistance among South African Multidrug-Resistant Mycobacterium tuberculosis Isolates. J. Clin. Microbiol 2008, 46, 3459–3464. [DOI] [PMC free article] [PubMed] [Google Scholar]
- (17).Whitfield MG; Soeters HM; Warren RM; et al. A global perspective on pyrazinamide resistance: systematic review and meta-analysis. PLoS One 2015, 10, No. e0133869. [DOI] [PMC free article] [PubMed] [Google Scholar]
- (18).Raynaud C; Lanéelle M-A; Senaratne RH; Draper P; Lanéelle G; Daffé M Mechanisms of pyrazinamide resistance in mycobacteria: importance of lack of uptake in addition to lack of pyrazinamidase activity. Microbiology 1999, 145, 1359–1367. [DOI] [PubMed] [Google Scholar]
- (19).Scorpio A; Zhang Y Mutations in pncA, a gene encoding pyrazinamidase/nicotinamidase, cause resistance to the antituberculous drug pyrazinamide in tubercle bacillus. Nat. Med 1996, 2, 662–667. [DOI] [PubMed] [Google Scholar]
- (20).Via LE; Savic R; Weiner DM; et al. Host-mediated bioactivation of pyrazinamide: implications for efficacy, resistance, and therapeutic alternatives. ACS Infect. Dis 2015, 1, 203–214. [DOI] [PMC free article] [PubMed] [Google Scholar]
- (21).Lanoix J-P; Tasneen R; O’Brien P; et al. High systemic exposure of pyrazinoic acid has limited antituberculosis activity in murine and rabbit models of tuberculosis. Antimicrob. Agents Chemother 2016, 60, 4197–4205. [DOI] [PMC free article] [PubMed] [Google Scholar]
- (22).Speirs RJ; Welch J; Cynamon M Activity of n-propyl pyrazinoate against pyrazinamide-resistant Mycobacterium tuberculosis: investigations into mechanism of action of and mechanism of resistance to pyrazinamide. Antimicrob. Agents Chemother 1995, 39, 1269–1271. [DOI] [PMC free article] [PubMed] [Google Scholar]
- (23).Hickey AJ; Misra A; Fourie PB Dry powder antibiotic aerosol product development: inhaled therapy for tuberculosis. J. Pharm. Sci 2013, 102, 3900–3907. [DOI] [PubMed] [Google Scholar]
- (24).Stewart IE; Lukka PB; Liu J; et al. Development and characterization of a dry powder formulation for anti-tuberculosis drug spectinamide 1599. Pharm. Res 2019, 36, No. 136. [DOI] [PMC free article] [PubMed] [Google Scholar]
- (25).Muttil P; Wang C; Hickey AJ Inhaled Drug Delivery for Tuberculosis Therapy. Pharm. Res 2009, 26, 2401–2416. [DOI] [PubMed] [Google Scholar]
- (26).Braunstein M; Hickey AJ; Ekins S Why Wait? The Case for Treating Tuberculosis with Inhaled Drugs. Pharm. Res 2019, 36, 166. [DOI] [PMC free article] [PubMed] [Google Scholar]
- (27).Misra A; Hickey AJ; Rossi C; et al. Inhaled drug therapy for treatment of tuberculosis. Tuberculosis 2011, 91, 71–81. [DOI] [PubMed] [Google Scholar]
- (28).Hickey AJ; Durham PG; Dharmadhikari A; Nardell EA Inhaled drug treatment for tuberculosis: Past progress and future prospects. J. Controlled Release 2016, 240, 127–134. [DOI] [PubMed] [Google Scholar]
- (29).Garcia-Contreras L; Fiegel J; Telko M; et al. Inhaled large porous particles of capreomycin for treatment of tuberculosis in a guinea pig model. Antimicrob. Agents Chemother 2007, 51, 2830–2836. [DOI] [PMC free article] [PubMed] [Google Scholar]
- (30).Fiegel J; Garcia-Contreras L; Thomas M; et al. Preparation and in vivo evaluation of a dry powder for inhalation of capreomycin. Pharm. Res 2008, 25, 805–811. [DOI] [PubMed] [Google Scholar]
- (31).Dharmadhikari AS; Kabadi M; Gerety B; Hickey AJ; Fourie PB; Nardell E Phase I, Single-Dose, Dose-Escalating Study of Inhaled Dry Powder Capreomycin: a New Approach to Therapy of Drug-Resistant Tuberculosis. Antimicrob. Agents Chemother 2013, 57, 2613–2619. [DOI] [PMC free article] [PubMed] [Google Scholar]
- (32).Garcia-Contreras L; Muttil P; Fallon JK; Kabadi M; Gerety R; Hickey AJ Pharmacokinetics of sequential doses of capreomycin powder for inhalation in guinea pigs. Antimicrob. Agents Chemother 2012, 56, 2612–2618. [DOI] [PMC free article] [PubMed] [Google Scholar]
- (33).Durham PG; Young EF; Braunstein MS; Welch JT; Hickey AJ A dry powder combination of pyrazinoic acid and its n-propyl ester for aerosol administration to animals. Int. J. Pharm 2016, 514, 384–391. [DOI] [PMC free article] [PubMed] [Google Scholar]
- (34).Durham PG; Zhang Y; German N; et al. Spray Dried Aerosol Particles of Pyrazinoic Acid Salts for Tuberculosis Therapy. Mol. Pharmaceutics 2015, 12, 2574–2581. [DOI] [PubMed] [Google Scholar]
- (35).Pharmacopeia US. and National Formulary 29. US Pharmacopeial Convention; Pharmacopeia US: Rockville, MD, 2011. [Google Scholar]
- (36).Ahmad Z; Nuermberger EL; Tasneen R; et al. Comparison of the ‘Denver regimen’ against acute tuberculosis in the mouse and guinea pig. J. Antimicrob. Chemother 2010, 65, 729–734. [DOI] [PMC free article] [PubMed] [Google Scholar]
- (37).Durham PG; Hanif SN; Contreras LG; Young EF; Braunstein MS; Hickey AJ Disposable dosators for pulmonary insufflation of therapeutic agents to small animals. J. Visualized Exp 2017, No. e55356. [DOI] [PMC free article] [PubMed] [Google Scholar]
- (38).Montgomery SA; Young EF; Durham PG; et al. Efficacy of pyrazinoic acid dry powder aerosols in resolving necrotic and non-necrotic granulomas in a guinea pig model of tuberculosis. PLoS One 2018, 13, No. e0204495. [DOI] [PMC free article] [PubMed] [Google Scholar]
- (39).Rennard SI; Basset G; Lecossier D; et al. Estimation of volume of epithelial lining fluid recovered by lavage using urea as marker of dilution. J. Appl. Physiol 1986, 60, 532–538. [DOI] [PubMed] [Google Scholar]
- (40).Mugabo P; Mulubwa M Population Pharmacokinetic Modelling of Pyrazinamide and Pyrazinoic Acid in Patients with Multi-Drug Resistant Tuberculosis. Eur. J. Drug Metab. Pharmacokinet 2019, 44, 519–530. [DOI] [PubMed] [Google Scholar]
- (41).Sundell J; Wijk M; Bienvenu E; Äbelö A; Hoffmann K-J; Ashton M Factors Affecting the Pharmacokinetics of Pyrazinamide and Its Metabolites in Patients Coinfected with HIV and Implications for Individualized Dosing. Antimicrob. Agents Chemother 2021, 65, No. e00046–21. [DOI] [PMC free article] [PubMed] [Google Scholar]
- (42).Lacroix C; Phan Hoang T; Nouveau J; et al. Pharmacokinetics of pyrazinamide and its metabolites in healthy subjects. Eur. J. Clin. Pharmacol 1989, 36, 395–400. [DOI] [PubMed] [Google Scholar]
- (43).Hanafin PO; Jermain B; Hickey AJ; et al. A mechanism-based pharmacokinetic model of remdesivir leveraging interspecies scaling to simulate COVID-19 treatment in humans. CPT: Pharmacometrics Syst. Pharmacol 2021, 10, 89–99. [DOI] [PMC free article] [PubMed] [Google Scholar]
- (44).Alskär O; Karlsson MO; Kjellsson MC Model-Based Interspecies Scaling of Glucose Homeostasis. CPT: Pharmacometrics & Systems. Pharmacology 2017, 6, 778–786. [DOI] [PMC free article] [PubMed] [Google Scholar]
- (45).Conte JE; Golden JA; Duncan S; McKenna E; Zurlinden E Intrapulmonary Concentrations of Pyrazinamide. Antimicrob. Agents Chemother 1999, 43, 1329–1333. [DOI] [PMC free article] [PubMed] [Google Scholar]
- (46).Alsultan A; Savic R; Dooley KE; et al. Population Pharmacokinetics of Pyrazinamide in Patients with Tuberculosis. Antimicrob. Agents Chemother 2017, 61, No. e02625–16. [DOI] [PMC free article] [PubMed] [Google Scholar]
- (47).Gumbo T; Angulo-Barturen I; Ferrer-Bazaga S Pharmacokinetic-Pharmacodynamic and Dose-Response Relationships of Antituberculosis Drugs: Recommendations and Standards for Industry and Academia. J. Infect. Dis 2015, 211, S96–S106. [DOI] [PubMed] [Google Scholar]
- (48).Chigutsa E; Pasipanodya JG; Visser ME; et al. Impact of nonlinear interactions of pharmacokinetics and MICs on sputum bacillary kill rates as a marker of sterilizing effect in tuberculosis. Antimicrob. Agents Chemother 2015, 59, 38–45. [DOI] [PMC free article] [PubMed] [Google Scholar]
- (49).Biorender. https://www.biorender.com (accessed February 10, 2023).
- (50).Chen K; Seng K-Y Calibration and validation of a physiologically based model for soman intoxication in the rat, marmoset, guinea pig and pig. J. Appl. Toxicol 2012, 32, 673–686. [DOI] [PubMed] [Google Scholar]
- (51).Brewer NR; Cruise LJ The respiratory system of the guinea pig: Emphasis on species differences. J. Am. Assoc. Lab. Anim. Sci 1997, 36, 100–108. [PubMed] [Google Scholar]
- (52).Beal SL Ways to fit a PK model with some data below the quantification limit. J. Pharmacokinet. Pharmacodyn 2001, 28, 481–504. [DOI] [PubMed] [Google Scholar]
- (53).Naftalin CM; Verma R; Gurumurthy M; et al. Coadministration of Allopurinol To Increase Antimycobacterial Efficacy of Pyrazinamide as Evaluated in a Whole-Blood Bactericidal Activity Model. Antimicrob. Agents Chemother 2017, 61, No. e00482–17. [DOI] [PMC free article] [PubMed] [Google Scholar]
- (54).Pasipanodya JG; McIlleron H; Burger A; Wash PA; Smith P; Gumbo T Serum Drug Concentrations Predictive of Pulmonary Tuberculosis Outcomes. J. Infect. Dis 2013, 208, 1464–1473. [DOI] [PMC free article] [PubMed] [Google Scholar]
- (55).Young EF; Perkowski E; Malik S; et al. Inhaled Pyrazinoic Acid Esters for the Treatment of Tuberculosis. Pharm. Res 2016, 33, 2495–2505. [DOI] [PubMed] [Google Scholar]
- (56).Gumbo T; Siyambalapitiyage Dona CSW; Meek C; Leff R Pharmacokinetics-Pharmacodynamics of Pyrazinamide in a Novel In Vitro Model of Tuberculosis for Sterilizing Effect: a Paradigm for Faster Assessment of New Antituberculosis Drugs. Antimicrob. Agents Chemother 2009, 53, 3197–3204. [DOI] [PMC free article] [PubMed] [Google Scholar]
- (57).Wang H; Connaughton P; Lachacz K; et al. Inhalable microparticle platform based on a novel shell-forming lipid excipient and its feasibility for respirable delivery of biologics. Eur. J. Pharm. Biopharm 2022, 177, 308–322. [DOI] [PubMed] [Google Scholar]
- (58).Mangal S; Nie H; Xu R; et al. Physico-chemical properties, aerosolization and dissolution of co-spray dried azithromycin particles with l-leucine for inhalation. Pharm. Res 2018, 35, No. 28. [DOI] [PMC free article] [PubMed] [Google Scholar]
- (59).Alhajj N; O’Reilly NJ; Cathcart H Leucine as an excipient in spray dried powder for inhalation. Drug Discovery Today 2021, 26, 2384–2396. [DOI] [PubMed] [Google Scholar]
- (60).Clark S; Hall Y; Williams A Animal Models of Tuberculosis: Guinea Pigs. Cold Spring Harbor Perspect. Med 2015, 5, No. a018572. [DOI] [PMC free article] [PubMed] [Google Scholar]
- (61).Gontijo AVL; Grégoire N; Lamarche I; Gobin P; Couet W; Marchand S Biopharmaceutical characterization of nebulized antimicrobial agents in rats: 2. Colistin. Antimicrob. Agents Chemother 2014, 58, 3950–3956. [DOI] [PMC free article] [PubMed] [Google Scholar]
- (62).Poli G; Lipworth B P291 Relationship of In Vitro Particle Size to In Vivo Lung Deposition and Exhaled Fraction; BMJ Publishing Group Ltd, 2015. [Google Scholar]
- (63).Mitchison D; Fourie P The near future: improving the activity of rifamycins and pyrazinamide. Tuberculosis 2010, 90, 177–181. [DOI] [PubMed] [Google Scholar]
- (64).Geller DE; Weers J; Heuerding S Development of an Inhaled Dry-Powder Formulation of Tobramycin Using PulmoSphere Technology. J. Aerosol Med. Pulm. Drug Delivery 2011, 24, 175–182. [DOI] [PMC free article] [PubMed] [Google Scholar]
- (65).Akkerman-Nijland AM; Grasmeijer F; Kerstjens HAM; et al. Colistin dry powder inhalation with the Twincer: An effective and more patient friendly alternative to nebulization. PLoS One 2020, 15, No. e0239658. [DOI] [PMC free article] [PubMed] [Google Scholar]
- (66).Westerman EM; De Boer AH; Le Brun PPH; et al. Dry powder inhalation of colistin in cystic fibrosis patients: A single dose pilot study. J. Cystic Fibrosis 2007, 6, 284–292. [DOI] [PubMed] [Google Scholar]
- (67).Smith S; Rowbotham NJ Inhaled anti-pseudomonal antibiotics for long-term therapy in cystic fibrosis. Cochrane Database Syst. Rev 2022, 3, No. CD001021. [DOI] [PMC free article] [PubMed] [Google Scholar]
- (68).Stass H; Nagelschmitz J; Willmann S; Delesen H; Gupta A; Baumann S Inhalation of a Dry Powder Ciprofloxacin Formulation in Healthy Subjects: A Phase I Study. Clin. Drug Invest 2013, 33, 419–427. [DOI] [PMC free article] [PubMed] [Google Scholar]
- (69).Shi W; Chen J; Zhang S; Zhang W; Zhang Y Identification of Novel Mutations in LprG (rv1411c), rv0521, rv3630, rv0010c, ppsC, and cyp128 associated with pyrazinoic acid/pyrazinamide resistance in Mycobacterium tuberculosis. Antimicrob. Agents Chemother 2018, 62, No. e00430–18. [DOI] [PMC free article] [PubMed] [Google Scholar]
- (70).Gopal P; Yee M; Sarathy J; et al. Pyrazinamide Resistance Is Caused by Two Distinct Mechanisms: Prevention of Coenzyme A Depletion and Loss of Virulence Factor Synthesis. ACS Infect. Dis 2016, 2, 616–626. [DOI] [PMC free article] [PubMed] [Google Scholar]
Associated Data
This section collects any data citations, data availability statements, or supplementary materials included in this article.