Abstract
Argonaute (AGO) proteins use small RNAs to recognize transcripts targeted for silencing in plants and animals. Many AGOs possess an endoribonuclease activity towards target RNAs termed ‘slicing’. Structures of Thermus thermophilus AGO (TtAgo) have been used to model RNA slicing, but how well DNA-guided slicing by this bacterial thermophile resembles RNA-guided slicing by eukaryotic AGOs is not known. We present cryo-EM structures of the Arabidopsis thaliana Argonaute10 (AtAgo10)-guide RNA complex with and without a target RNA representing a slicing substrate. The AtAgo10-guide-target complex adopts slicing-competent and -incompetent conformations that are unlike known TtAgo structures. AtAgo10 slicing activity is licensed by docking target (t) nucleotides t9-t13 into a surface channel containing the AGO endoribonuclease active site. A ß-hairpin in the L1 domain secures the t9-t13 segment and coordinates t9-t13 docking with extended guide-target pairing. Results show bacterial and eukaryotic AGOs use distinct mechanisms for slicing target RNAs and provide insights into small interfering RNA (siRNA) potency.
Introduction
Small RNAs, including microRNAs (miRNAs) and small interfering RNAs (siRNAs), are essential regulators of gene expression in plants and animals1,2. Small RNAs function as guides for Argonaute (AGO) proteins, directing them to complementary sites in RNAs targeted for silencing. The most broadly conserved silencing mechanism used by AGO proteins is endoribonucleolytic target cleavage, or “RNA slicing”3. RNA slicing drives RNA interference (RNAi) in animals4 and is central to therapeutic siRNA activity in humans5. RNA slicing is also essential in plants, where it is the predominant mechanism used by miRNAs6 and is used to trigger the biogenesis of phased siRNAs from target transcripts7-9.
The slicing mechanism has been characterized in Thermus thermophilus AGO (TtAgo), a DNA-guided bacterial AGO that can cleave both DNA and RNA targets10-12. TtAgo nucleates guide-target base-pairing using the guide (g) proximal seed region (nucleotides g2–g4, counting from the guide 5' end) and propagates base-pairing to the guide 3' end11,13,14. Target slicing is licensed by extended guide-target pairing, which induces large structural rearrangements in the TtAgo PIWI domain, forming the endonuclease active site10,11.
TtAgo is widely referenced as a model for RNA slicing in eukaryotes2,3,15-18. However, it is not known if the RNA guides of eukaryotic AGOs behave like the DNA guides of TtAgo. Indeed, structural and biochemical studies suggest mammalian Ago2 propagates guide-target pairing in a manner distinct from the linear 5'-3' trajectory proposed for TtAgo15,19,20. Moreover, the PIWI domains in eukaryotic AGO structures contain a preformed endoribonuclease active site21, indicating that mechanisms distinct from the structural rearrangements observed in TtAgo are used to license target slicing. Previous attempts to crystallize eukaryotic AGOs in an RNA-slicing conformation have instead captured alternative, non-catalytic conformations associated with miRNA-mediated repression and miRNA-decay19,20. Thus, despite its fundamental role in small RNA biology and significance to the development of siRNA therapeutics, steps leading to RNA-guided slicing, including how AGOs achieve a slicing-competent conformation and the mechanisms licensing target cleavage, remain unknown.
Results
Plant and animal AGOs share a common core structure
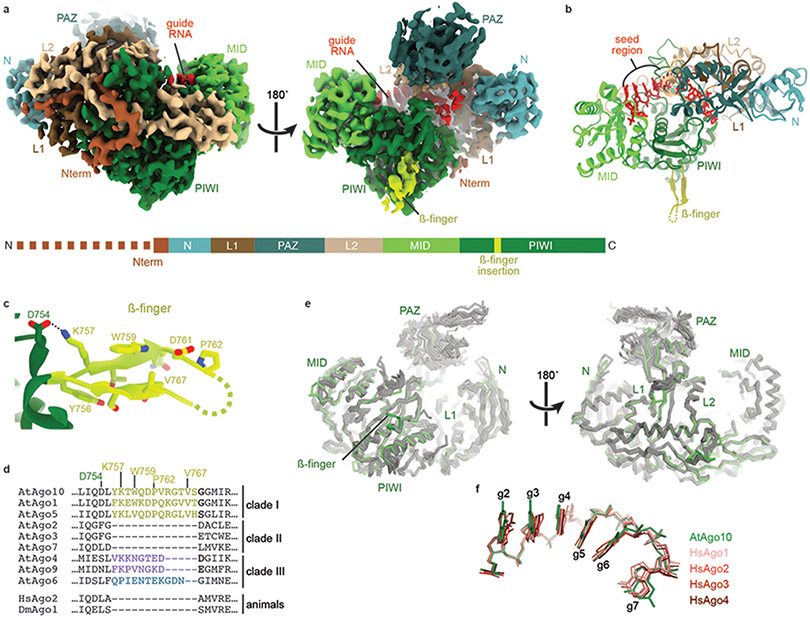
To visualize the RNA slicing mechanism without trapping the AGO complex in a particular conformation, we employed cryo-EM and single-particle analysis. We found Arabidopsis thaliana Ago10 (AtAgo10) behaves particularly well on cryo-EM grids, allowing us to determine its structure despite its small size (110 kDa). As no structure of a plant AGO-RNA complex has yet been reported, we first determined the structure of the AtAgo10-guide RNA complex to 3.3 Å overall resolution (Fig. 1a, EV1, EV2, and Table 1). As in human AGO structures, AtAgo10 contains N-terminal (N), Linker-1 (L1), PAZ, Linker-2 (L2), MID, and PIWI domains, which form a bilobed structure with a central cleft that contains the guide RNA. AtAgo10 has an additional β-finger structure, not present in human AGOs, that extends 20 Å from the body of the PIWI domain (Fig. 1b, c). The ß-finger is present in clade I AGOs in Arabidopsis and found in representatives from all four plant phyla (Fig. 1d, EV3a), indicative of an ancient and conserved function in plants. Apart from the β-finger, the AtAgo10 Cα backbone aligns with human AGOs with an average RMSD of 1.22 Å and is grouped with human AGO structures in an all-against-all correspondence analysis (Fig. 1e, EV3b-c). AtAgo10 also displays the guide RNA seed region (g2–g7) in a pre-organized conformation identical to seed display in human AGOs, including a notable kink between g6 and g7 (Fig. 1f)22-26. Thus, AGO-guide RNA complexes from Plantae and Animalia kingdoms share a common and deeply conserved core structure.
Fig. 1. Structure of the AtAgo10-guide RNA complex without target RNA.
a. Cryo-EM reconstruction with individual domains segmented and colored as in the schematic (lower panel). The dashed line indicates unstructured N-terminal residues. Guide RNA density colored red. b. Cartoon representation of the AtAgo10-guide RNA atomic model. c. Close-up of the ß-finger structure. d. Sequence alignment near the ß-finger insertion of AGOs from Arabidopsis, human, and Drosophila. Plant AGO clades indicated. e. Cα backbone superposition of AtAgo10-guide structure (green) and human AGO-guide (silver) crystal structures. f. Superposition of guide nucleotides (shown as sticks) from the seed regions of AtAgo10 (green) and representatives of the four human AGOs (shades of red).
Fig. EV1. Imaging and processing of the AtAgo10-guide RNA complex.

a. Representative cryo-EM micrograph (one of 2,656 micrographs in total) b. Cryo-EM data processing workflow. Particles isolated from micrographs were sorted by reference-free 2D classification. Only particles containing high-resolution features for the intact complex were selected for downstream processing. 3D classification was used to further remove low-resolution or damaged particles, and the remaining particles were refined to obtain a 3.26 Å resolution reconstruction.
Fig. EV2. Reconstruction of the AtAgo10-guide complex.
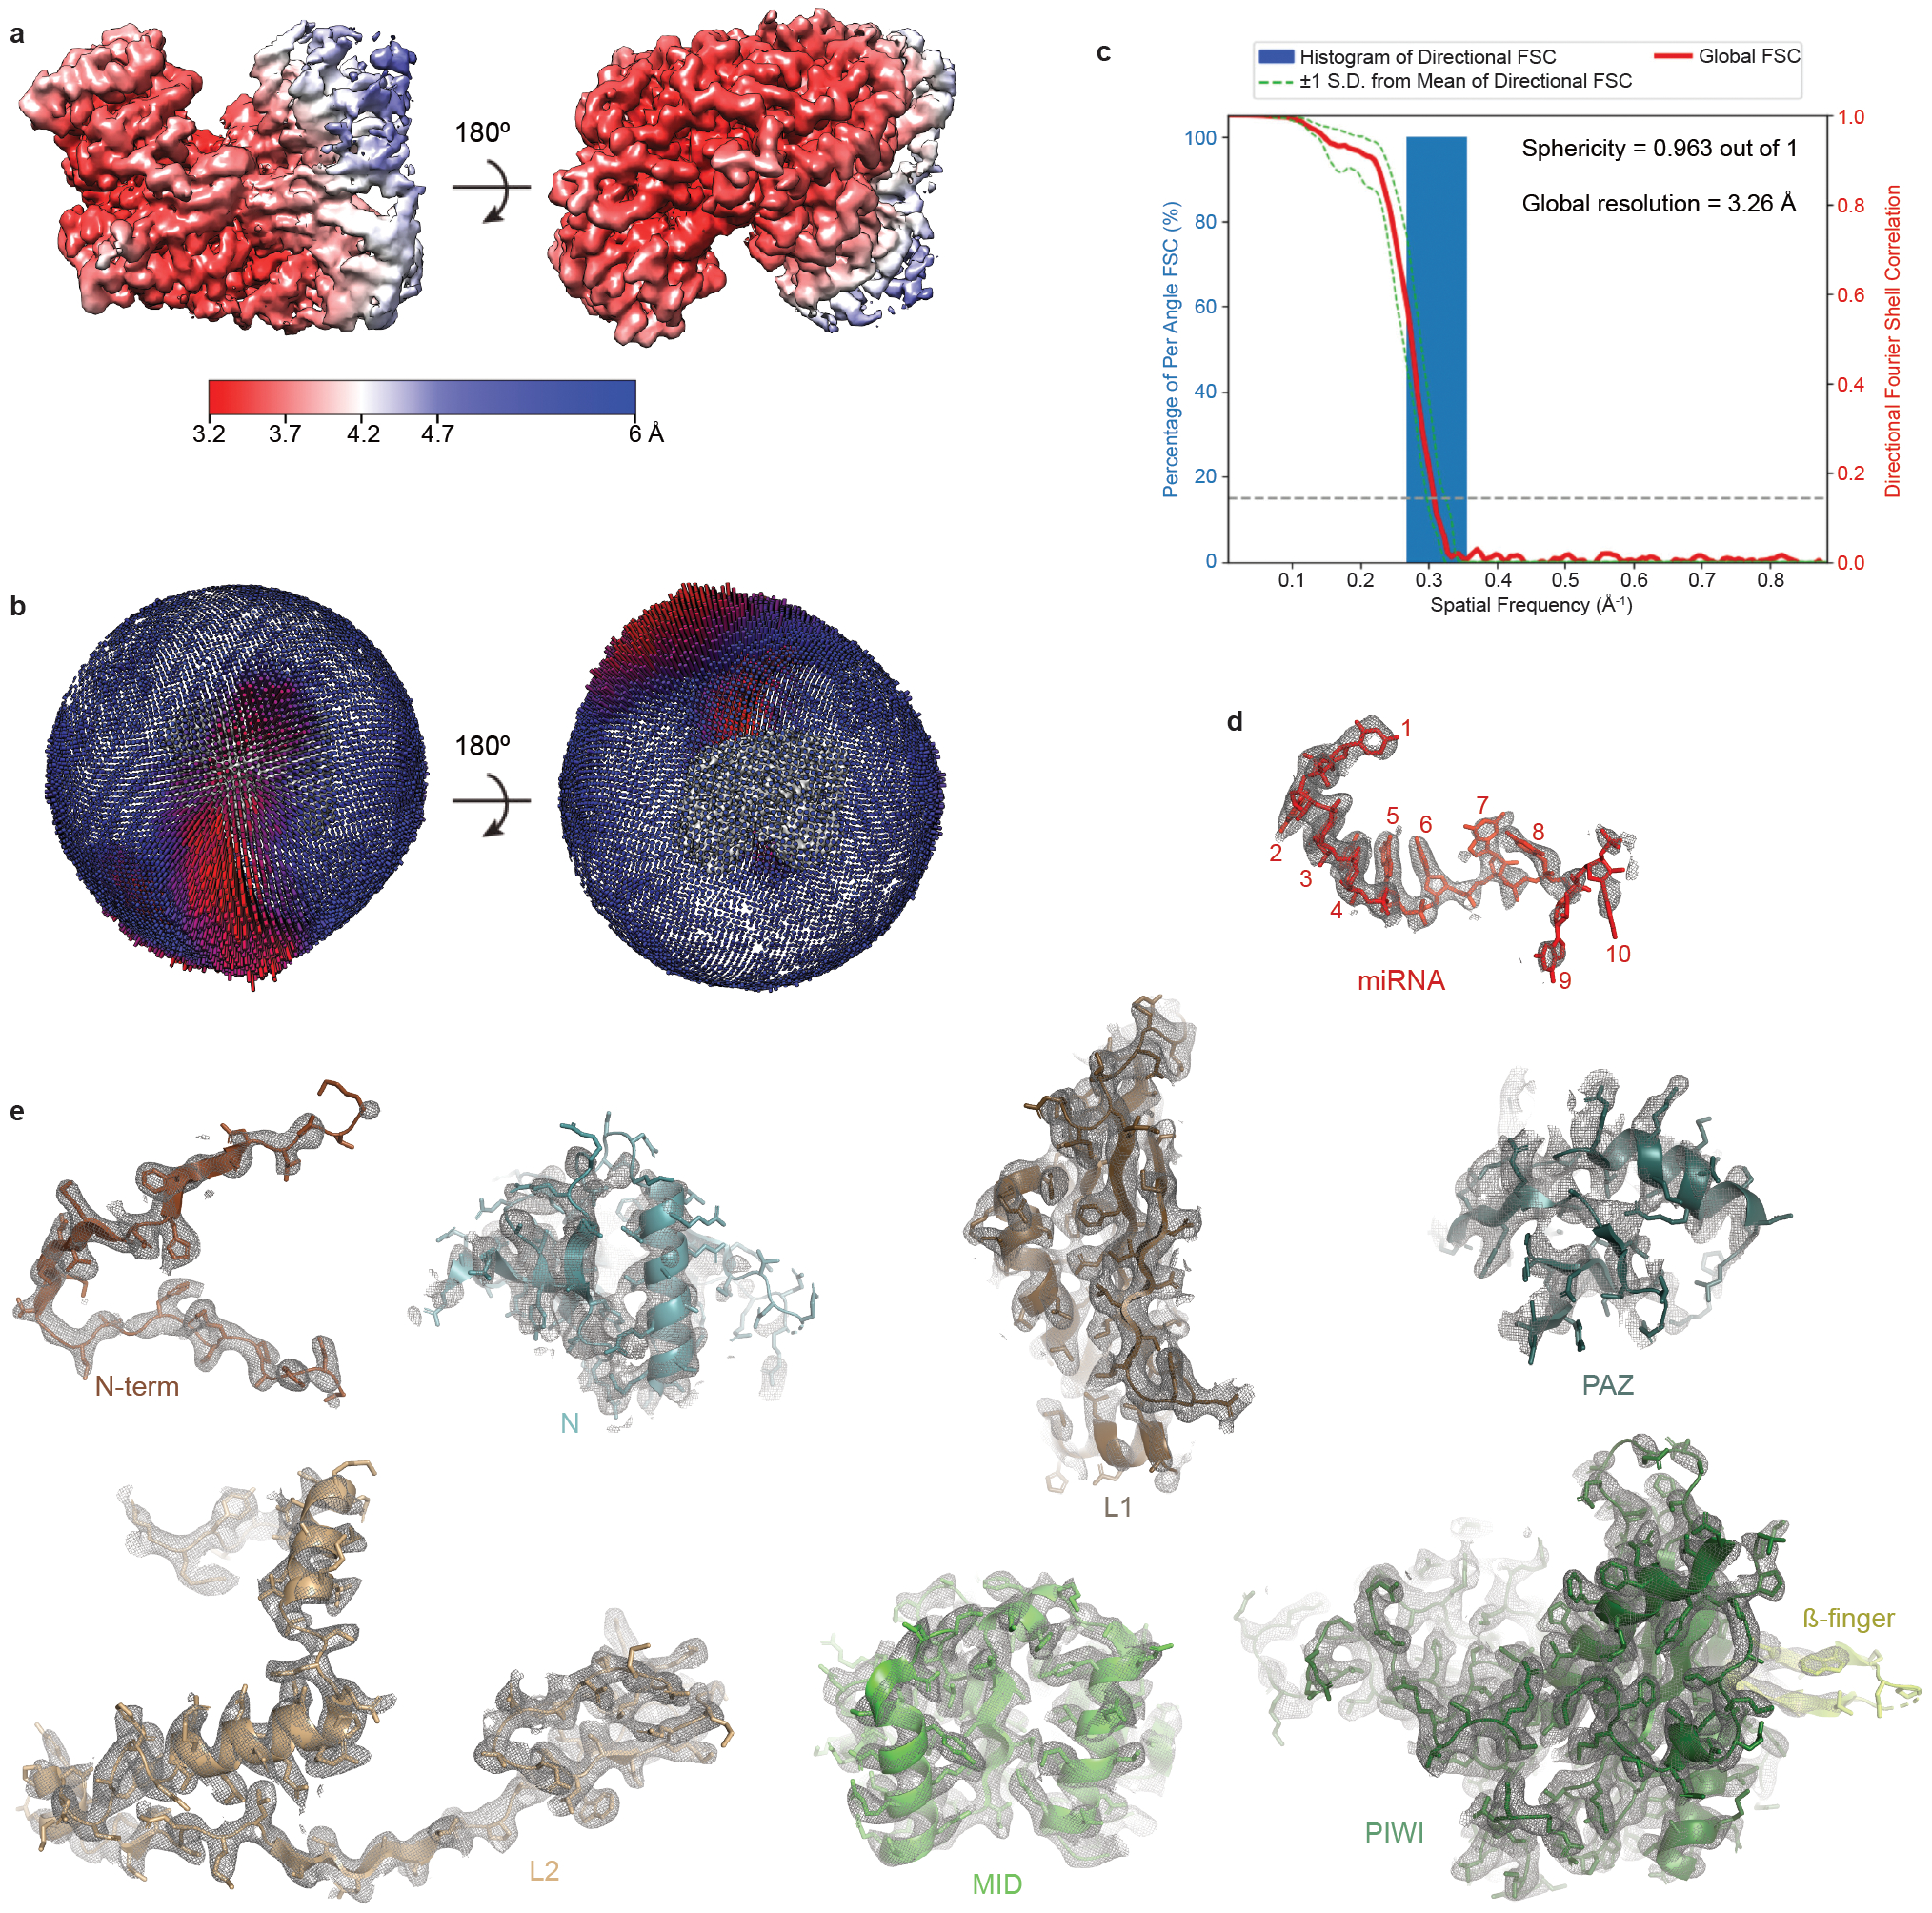
a. The final 3D map for the AtAgo10-guide RNA complex colored by local resolution values, where the majority of the map was resolved between 3.3 Å and 3.7 Å, and the map covering the more mobile PAZ and N domains has lower resolution. b. Angular distribution plot showing the Euler angle distribution of the AtAgo10-guide particles in the final reconstruction. The position of each cylinder corresponds to the 3D angular assignments and their height and color (blue to red) correspond to the number of particles in that angular orientation. c. Directional Fourier Shell Correlation (FSC) plot representing 3D resolution anisotropy in the reconstructed map, with the red line showing the global FSC, green dashed lines correspond to ±1 standard deviation from mean of directional resolutions, and the blue histograms correspond to percentage of directional resolution over the 3D FSC. d. EM density (mesh) quality of the guide RNA (sticks). e. Individual domains of AtAgo10 fit into the EM density, EM density shown in mesh; molecular models (colored as in Fig. 1) shown in cartoon representation with side chains shown as sticks.
Table 1.
Cryo-EM data collection, refinement, and validation statistics.
| Sample name | AtAgo10-guide RNA |
AtAgo10-guide- target |
AtAgo10-guide- target |
|---|---|---|---|
| (central duplex) | (bent duplex) | ||
| EMDB ID | EMD-25446 | EMD-25472 | EMD-25482 |
| PDB ID | 7SVA | 7SWF | 7SWQ |
| Microscope | Talos Arctica | Talos Arctica | |
| Detector (Mode) | Gatan K2 Summit, counting mode | Gatan K2 Summit, counting mode | |
| Voltage (kV) | 200 | 200 | |
| Magnification (nominal) | 73,000x | 45,000x | |
| Total electron fluence (e−/Å2) | 66.51 | 66.88 | |
| Defocus range (μm) | −0.8 to −1.3 | −1.0 to −1.7 | |
| Pixel size (Å) | 0.566 | 0.91 | |
| Total exposure time (sec) | 11 | 8.4 | |
| Total frames/micrograph | 55 | 42 | |
| Exposure per frame (e−/Å2/frame) | 1.21 | 1.59 | |
| Micrographs collected (no.) | 2,656 | 2,049 | |
| Total extracted particles (no.) | 736,209 | 1,935,081 | |
| Particles used for 3D analyses (no.) | 381,087 | 405,690 | 190,349 |
| Final refined particles (no.) | 53,766 | 38,833 | 28,499 |
| Symmetry imposed | C1 | C1 | C1 |
| Map Global Resolution (Å) | 3.26 | 3.79 | 3.79 |
| FSC threshold | 0.143 | 0.143 | 0.143 |
| FSC Sphericity | 0.963 | 0.964 | 0.949 |
| Local resolution range (Å) | 3.0 – 6.0 | 3.5 – 6.5 | 3.5-6.5 |
| Map Sharpening B factors (Å2) | −115.7 | −70 | −88.3 |
| Refinement | |||
| Refinement package (s) | Phenix | Phenix | Phenix |
| Model composition | |||
| Non-hydrogen atoms | 6515 | 6873 | 6998 |
| Protein residues | 792 | 778 | 791 |
| RNA residues | 11 | 34 | 35 |
| Mg2+ ions | 1 | 1 | 1 |
| Model resolution (Å) | |||
| FSC 0.5 | 3.4 | 3.9 | 3.9 |
| FSC 0.143 | 3.1 | 3.6 | 3.6 |
| B factors (Å2) | |||
| Protein | 40.38 | 83.05 | 34.47 |
| Nucleotide | 39.44 | 93.19 | 90.16 |
| Map Correlation Coefficient | |||
| Global | 0.82 | 0.82 | 0.76 |
| Local | 0.79 | 0.80 | 0.74 |
| R.m.s. deviations | |||
| Bond lengths (Å) | 0.004 | 0.010 | 0.004 |
| Bond angles (°) | 0.957 | 0.976 | 0.739 |
| Validation | |||
| EMRinger score | 3.41 | 2.89 | 2.76 |
| MolProbity score | 1.85 | 2.31 | 2.19 |
| Clashscore | 8.64 | 15.32 | 12.99 |
| Rotamer outliers (%) | 0.29 | 1.33 | 0.00 |
| Cβ deviations (%) | 0.00 | 0.00 | 0.00 |
| Ramachandran plot | |||
| Favored (%) | 94.36 | 90.89 | 89.35 |
| Allowed (%) | 5.64 | 9.11 | 10.65 |
| Disallowed (%) | 0.00 | 0.00 | 0.00 |
Fig. EV3. Details of AtAgo10 structural analysis.
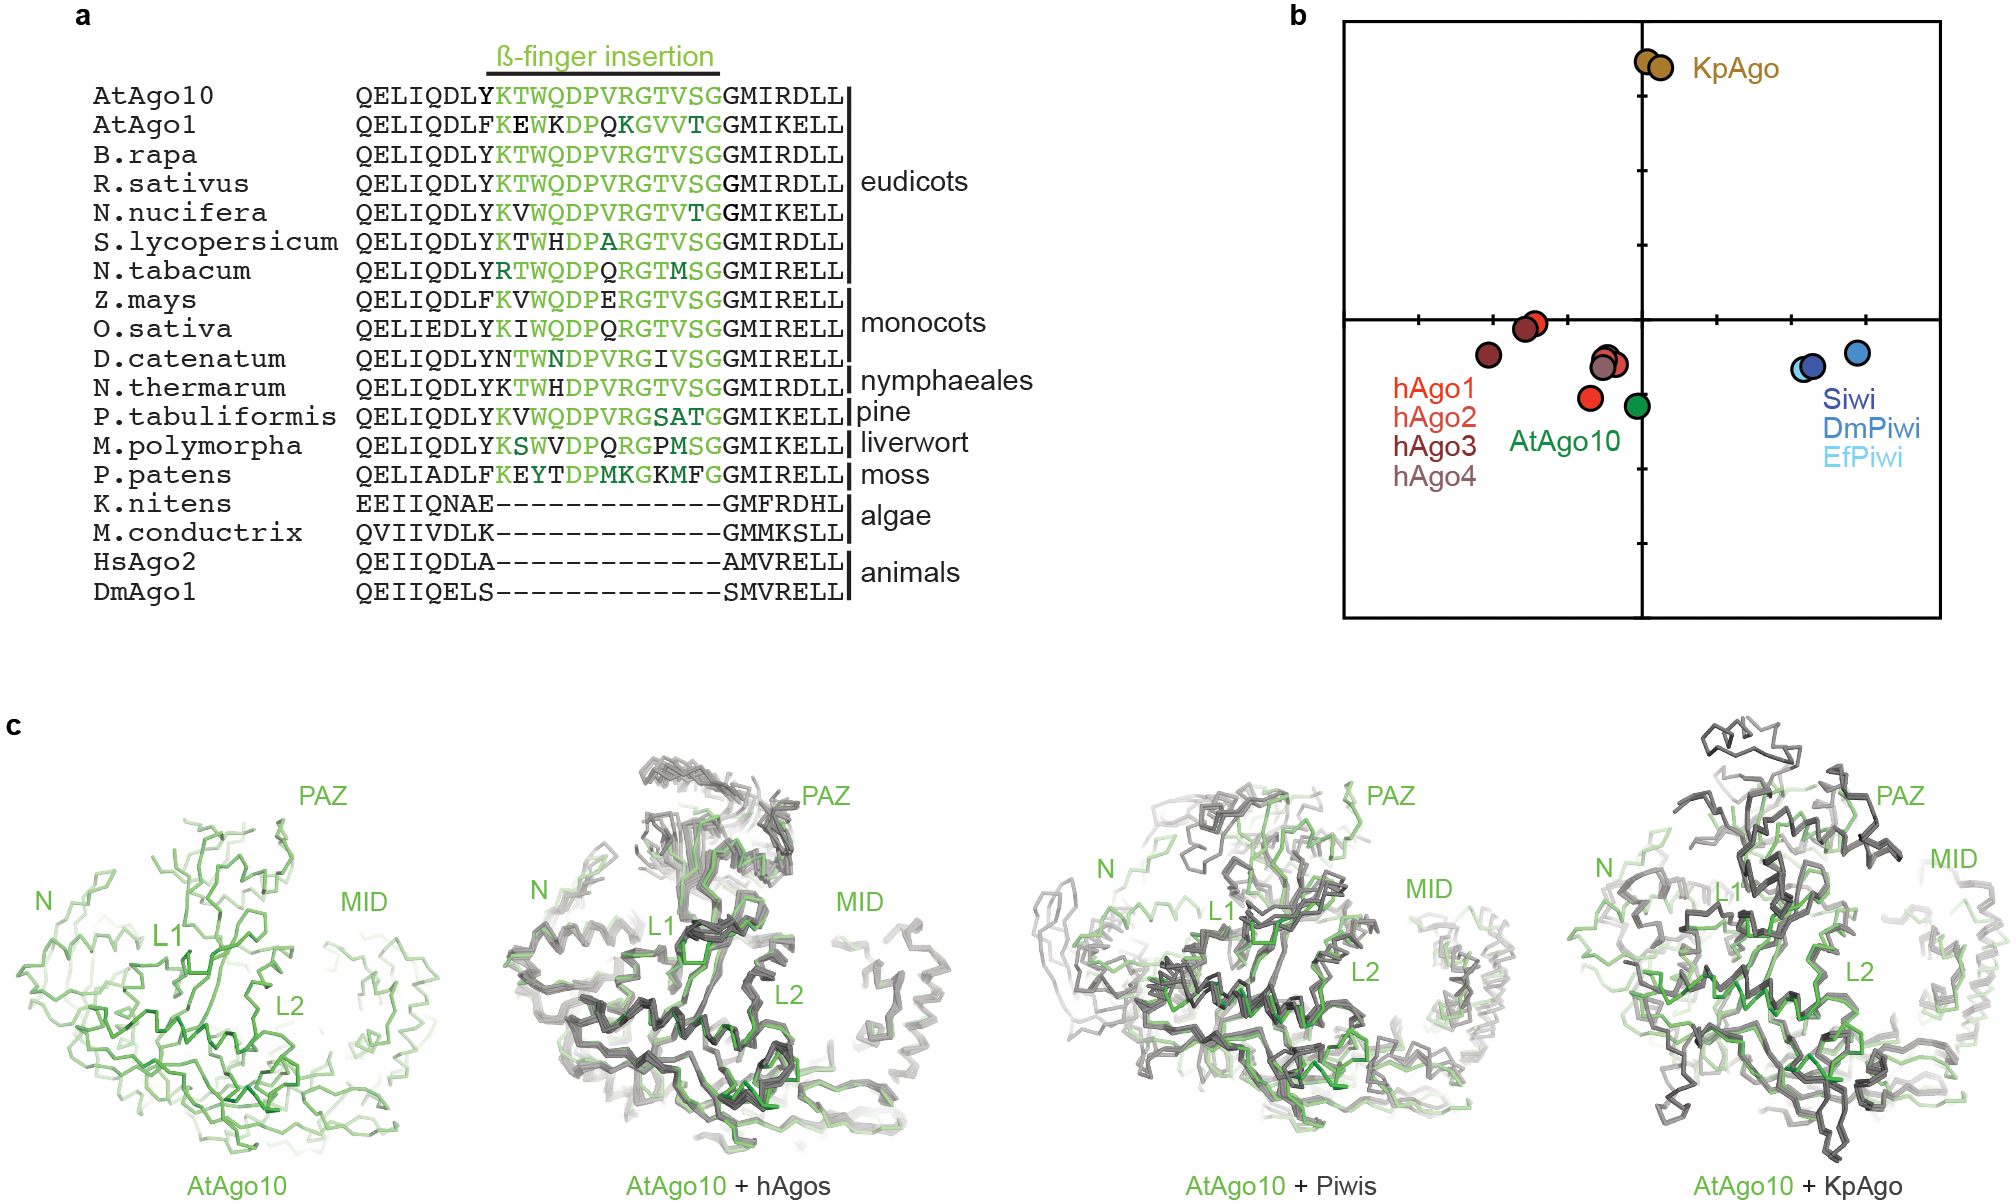
a. Alignment of ß-finger sequences from clade I AGOs from diverse plants, algae, and animals. The insertion can be found in clade I AGOs in all plant phyla but is not apparent in animals or algae, indicating β-finger arose around the emergence of land plants and has been broadly maintained in the clade I AGOs over the last ~500 million years. b. All-against-all correspondence analysis34 of known eukaryotic AGO and PIWI guide-bound structures (target-bound structures not included). c. Cα alignment of AtAgo10 with known human AGO (PDB: 4KRF, 4KXT, 4OLA, 4W5N, 5JS1, 5VM9, 6OON), PIWI (PDB: 5GUH, 6KR6, 7KX7), and yeast AGO (PDB: 4F1N) guide-bound structures.
AtAgo10-guide-target complex adopts multiple conformations
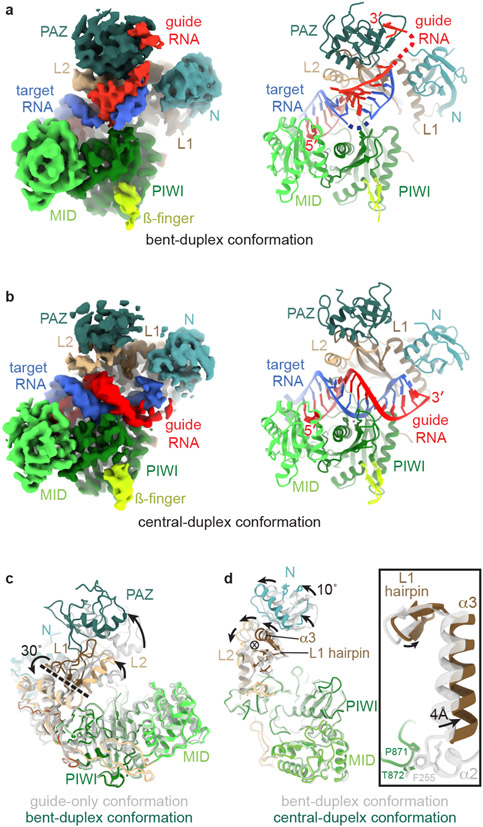
We next examined the ternary complex of AtAgo10 bound to a guide RNA and target with complementary to guide nucleotides g2-g16 by cryo-EM (Fig. EV4, Table 1). A catalytically inactive AtAgo10 mutant (D795A) was used to observe conformations that occur after target recognition but before target slicing. Initial 3D reconstructions indicated the presence of multiple RNA configurations within the AtAgo10 central cleft, leading to the refinement of two structures of the ternary AtAgo10-guide-target complex at ~3.8 Å overall resolution (Fig. 2a,b). The two reconstructions were derived from comparable particle numbers (Fig. EV4).
Fig. EV4. Imaging and processing of the AtAgo10-guide-target RNA complex.
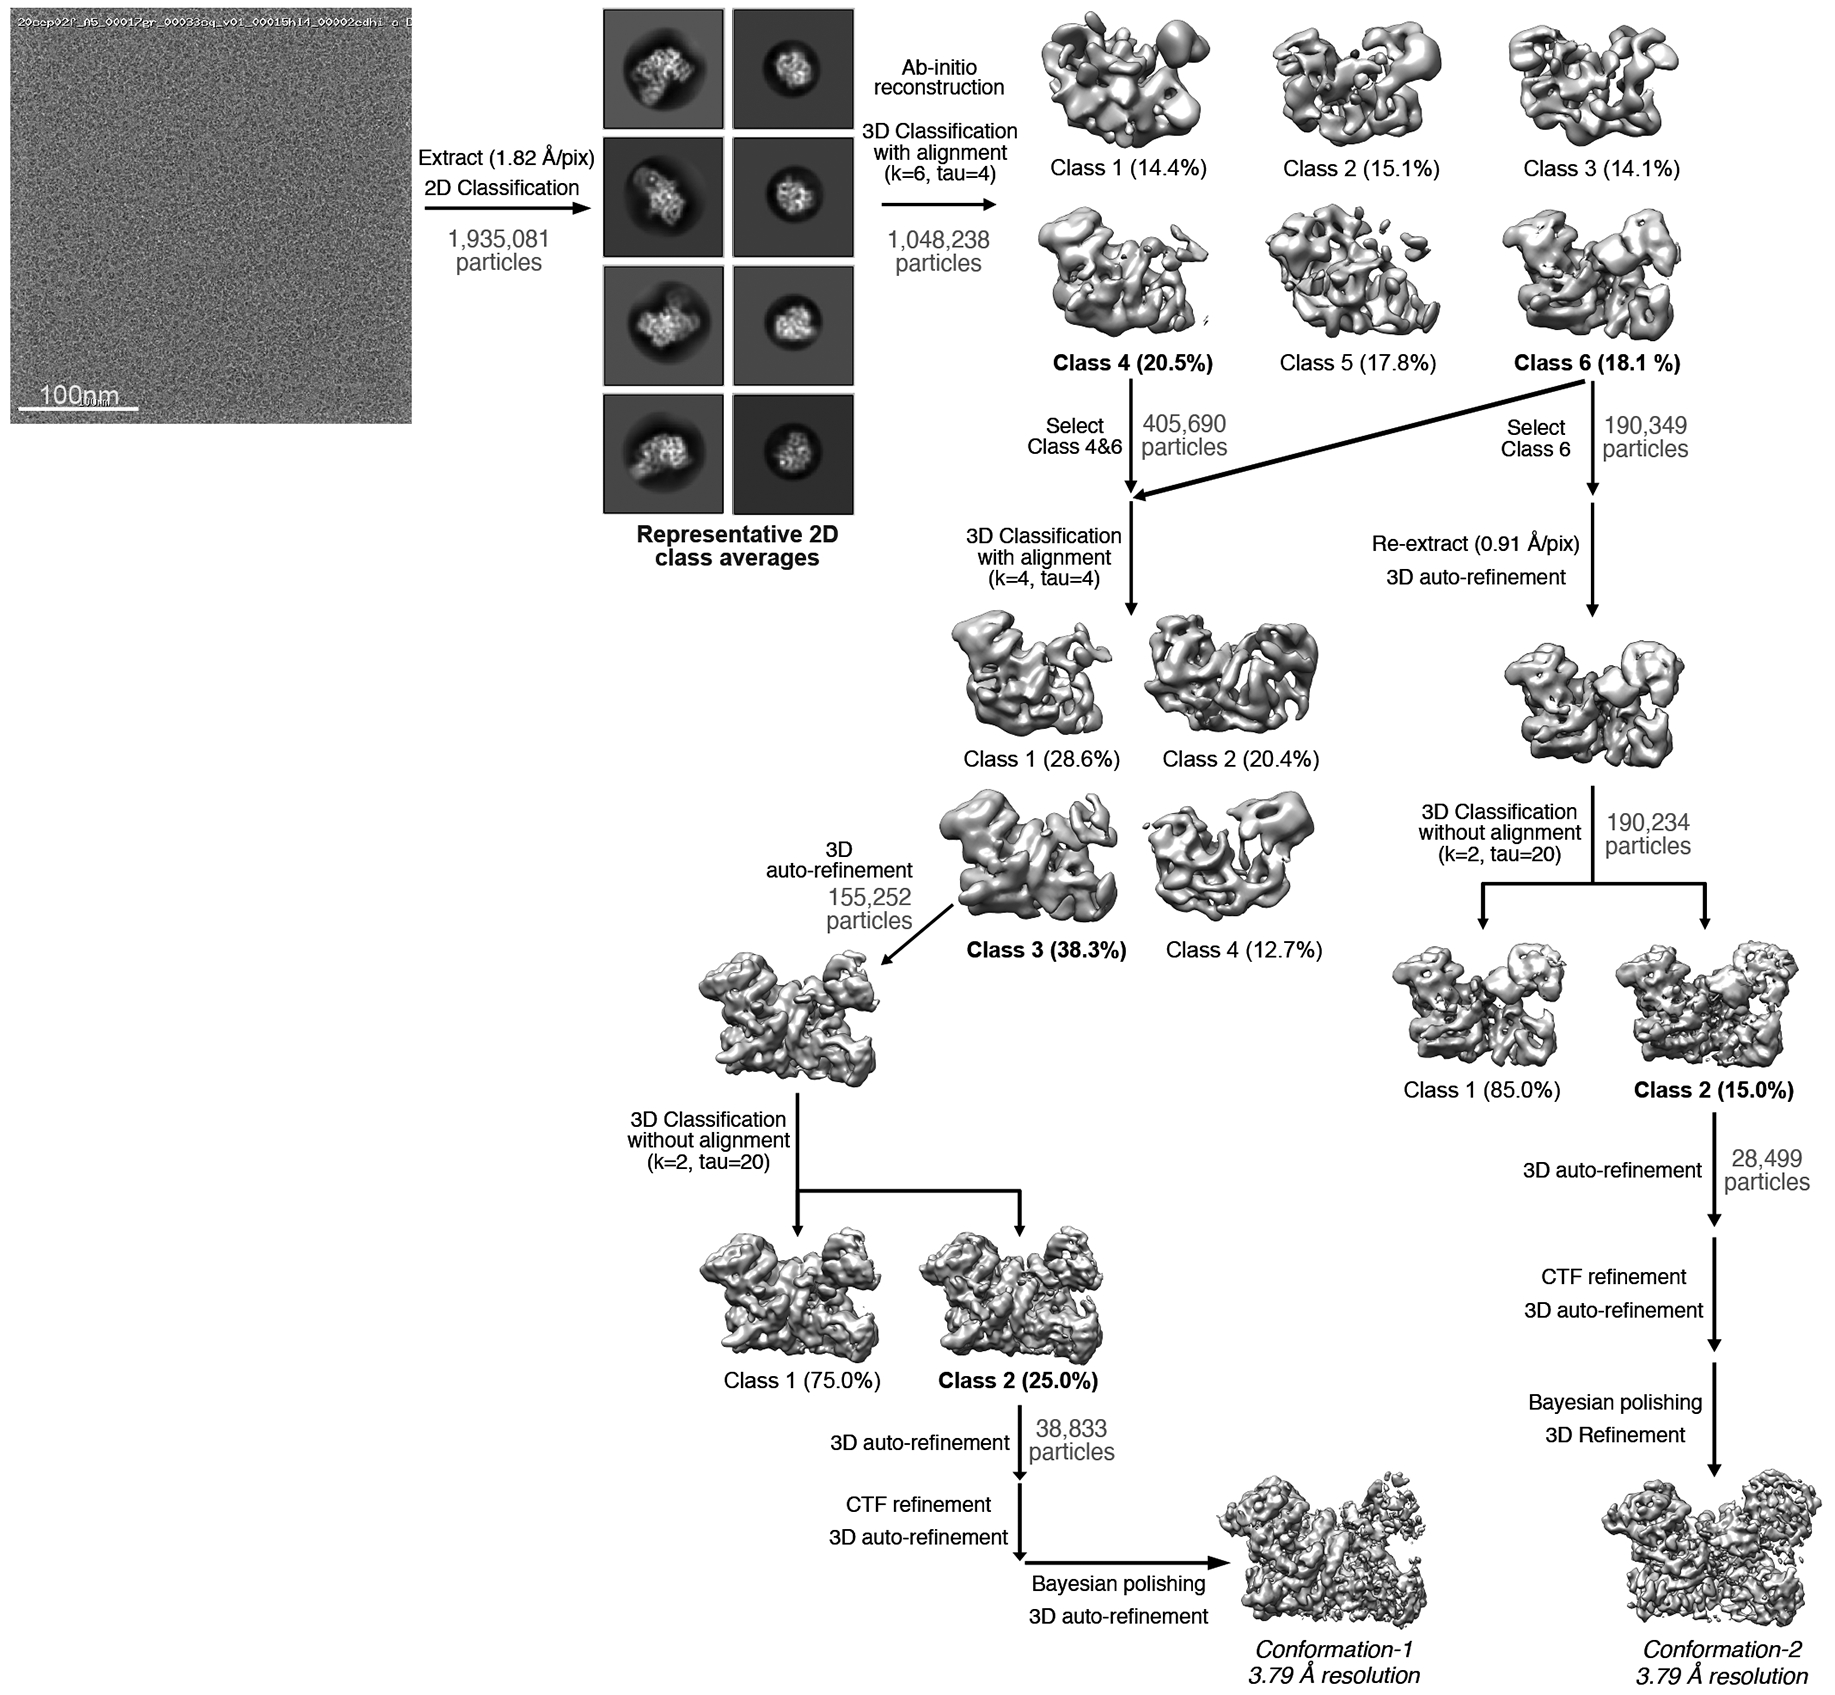
Representative cryo-EM micrograph (one out of 2,049 micrographs collected in total) in upper left, proceeded by cryo-EM data processing workflow. Particles isolated from micrographs were sorted by reference-free 2D classification. Only particles containing high-resolution features for the intact complex were selected for downstream processing. 3D classification was used to further remove low-resolution or damaged particles, and isolate classes with distinct RNA conformations. 3D classification and particles in the two major classes were further refined to obtain two 3.79 Å resolution reconstructions. Conformation-1 is the ‘central-duplex’, catalytic conformation. Conformation-2 corresponds to the ‘bent-duplex’, inactive family of conformations.
Fig. 2. AtAgo10-guide-target complex captured in two functional states.
a. Reconstruction (left) and model (right) of the AtAgo10-guide-target complex in the bent-duplex conformation. b. Reconstruction (left) and model (right) of the AtAgo10-guide-target complex in the central-duplex conformation. c. Superposition of AtAgo10 guide-only (grey/translucent) and bent-duplex (colored) conformations (RNAs not shown). Arrows indicate movement directions from guide-only to the bent-duplex structure. The dashed line indicates the axis of rotation (viewed from the side). d. Superposition of AtAgo10 bent-duplex (grey/translucent) and central-duplex (colored) conformations (RNAs and PAZ domain not shown). Arrows indicate movement directions from the bent-duplex to the central-duplex structure. The circled X indicates the axis of rotation (viewed down the axis). Inset shows a closeup of the L1 hairpin, α3, and α2. α2 is disordered in the central-duplex structure, revealing L1-PIWI contacts are lost upon moving from the bent-duplex to the central-duplex conformation.
In the first structure (bent-duplex conformation), guide and target RNAs form a discontinuous duplex, with base-paired segments at g2–g8 and g13–g15 interrupted by an unpaired segment at g9–g11 (Fig. 2a, EV5). The unpaired segment forms a bend in the duplex that allows the guide 5' and 3' ends to remain anchored to nucleotide-binding pockets in the AtAgo10 MID and PAZ domains, respectively. The density for the guide-target duplex preceding the bend resolves its helical shape but is blurry, indicating the reconstruction represents a heterogenous family of guide-target interactions centered around pairing at g13–g15. Target-binding is associated with widening of the AtAgo10 central cleft via rotation of the PAZ domain about a hinge in the L1 and L2 domains (Fig. 2c). AtAgo10 conformation in the bent-duplex structure is nearly identical to a previous bent-duplex crystal structure of HsAgo220, revealing conformational changes driven by extended guide-target pairing are conserved between plant and animal AGOs (Fig. EV5e). Target (t) nucleotides t9-t11 (where t9 is the target nucleotide that is complementary to guide nucleotide g9) are disordered. Therefore, as slicing activity involves hydrolysis of the phosphodiester bond between t10 and t1127, the bent-duplex structure represents a family of related AtAgo10-guide-target conformations that are incapable of target slicing.
Fig. EV5. Reconstruction of the AtAgo10-guide-target bent-duplex conformation.
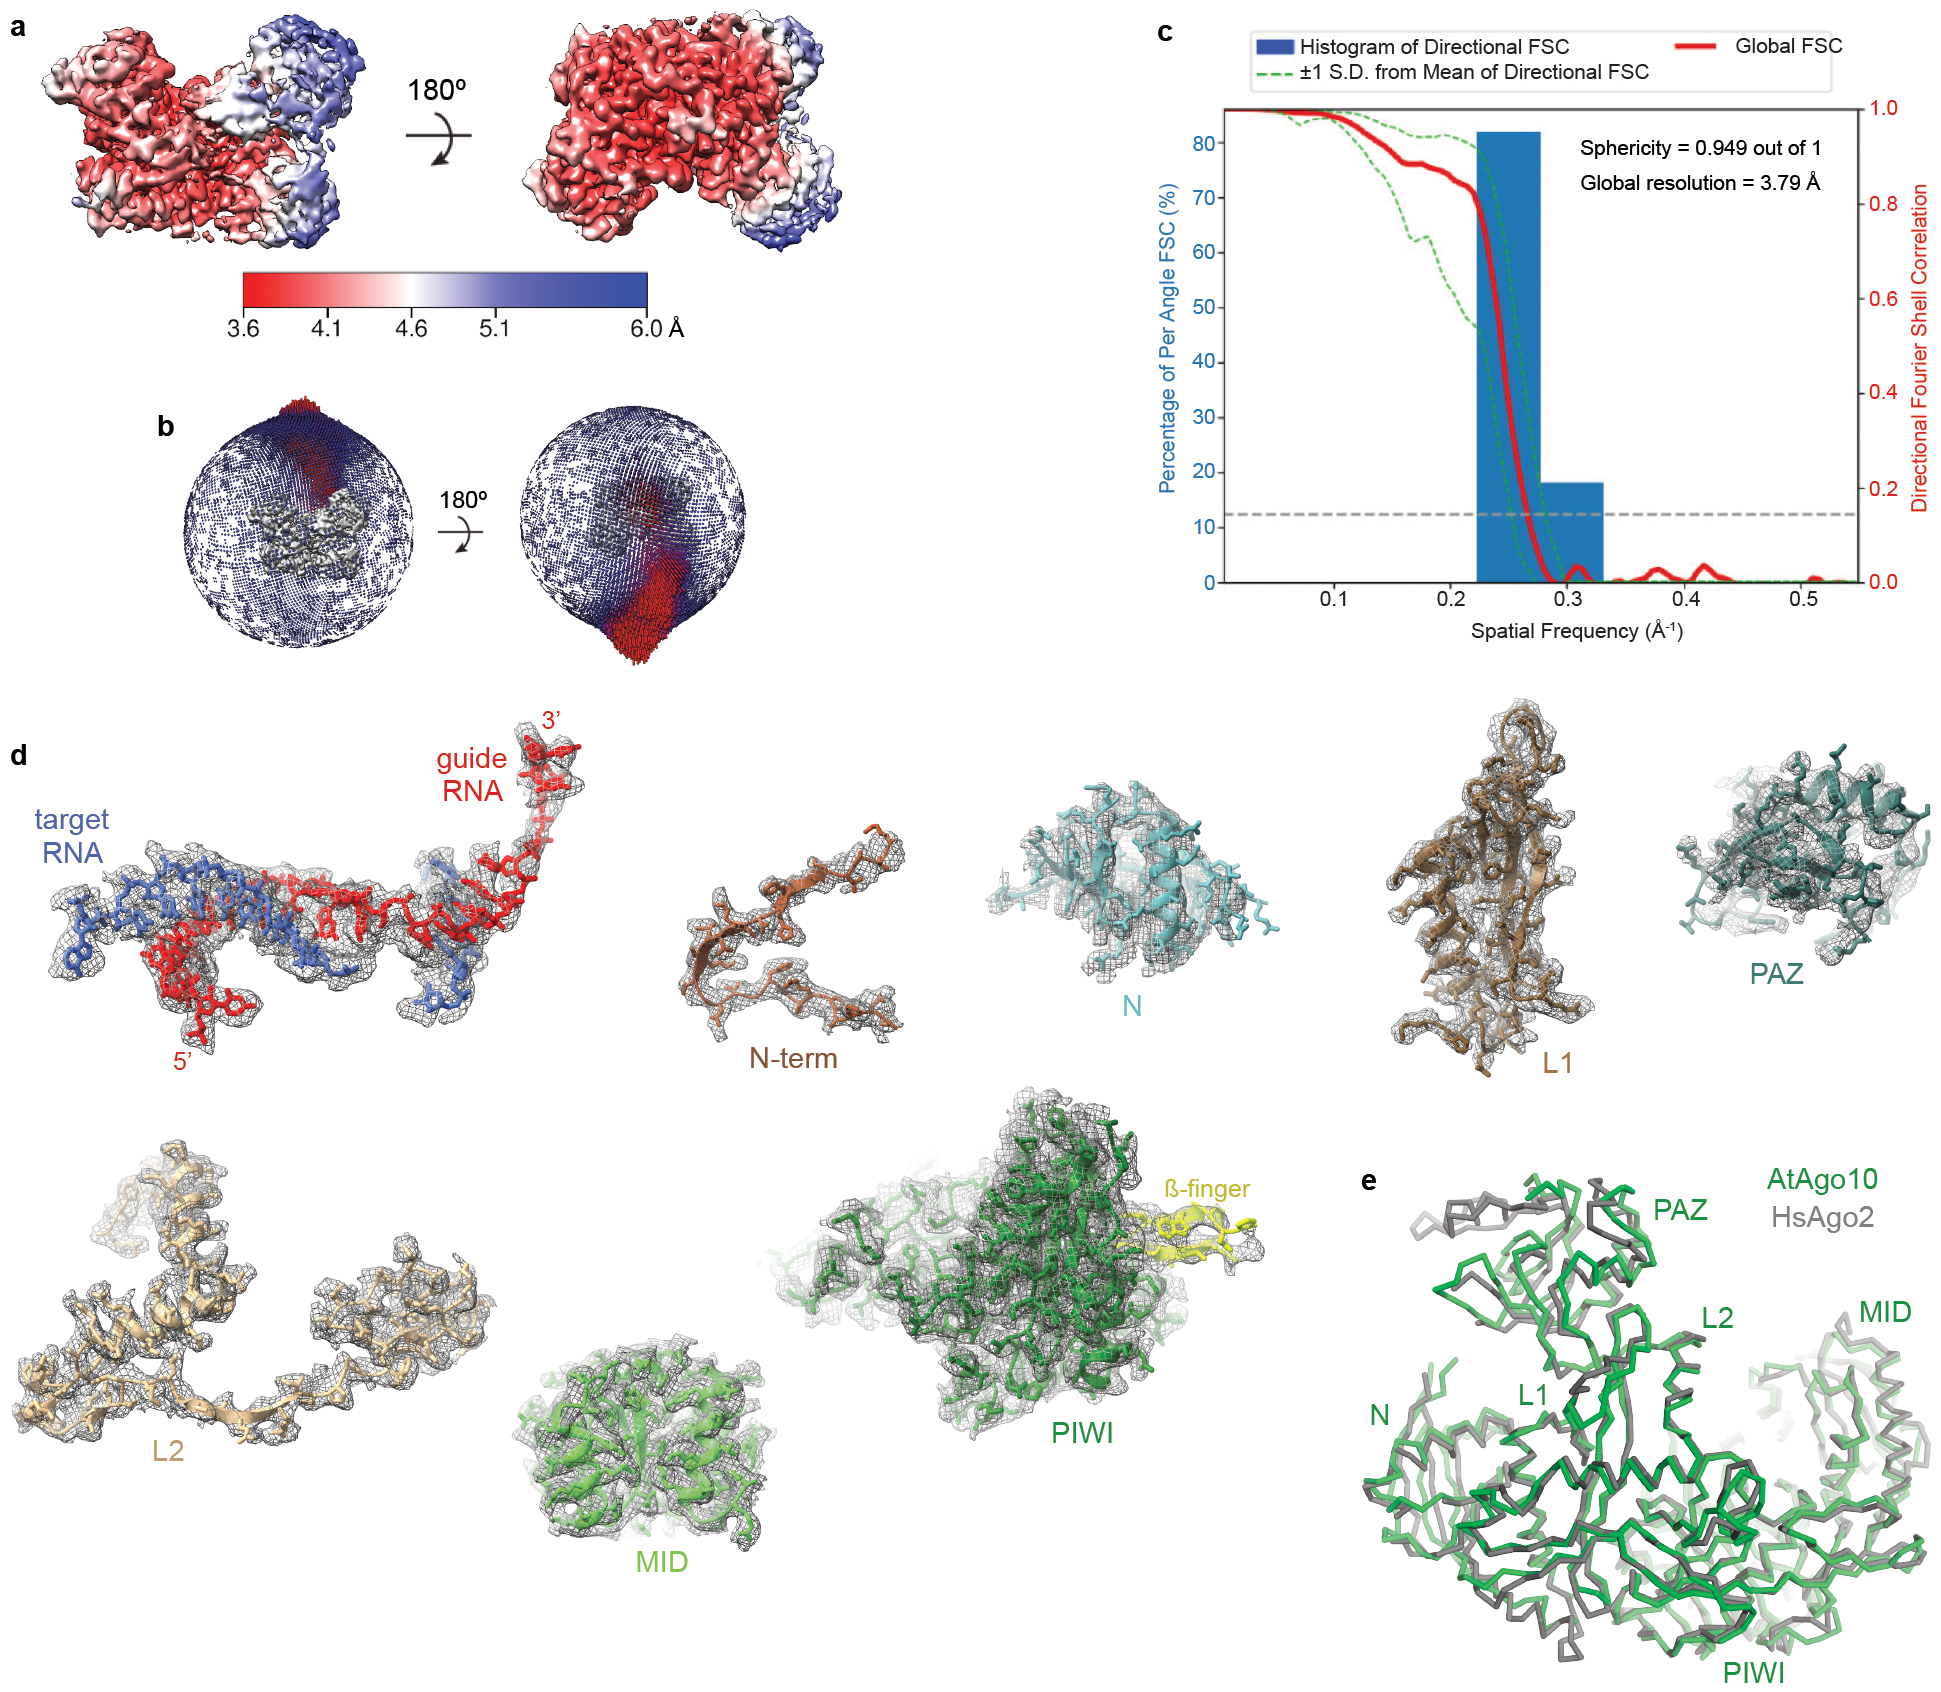
a. Final 3D map for Conformation-2 (see Fig. EV4) of the AtAgo10-guide-target RNA complex colored by local resolution values. b. Angular distribution plot showing the Euler angle distribution of the AtAgo10-guide-target particles in the final reconstruction. The position of each cylinder corresponds to the 3D angular assignments and their height and color (blue to red) corresponds to the number of particles in that angular orientation. c. Directional Fourier Shell Correlation (FSC) plot representing 3D resolution anisotropy in the reconstructed map, with the red line showing the global FSC, green dashed lines correspond to ±1 standard deviation from mean of directional resolutions, and the blue histograms correspond to percentage of directional resolution over the 3D FSC. d. Guide-target duplex (shown as sticks) and individual AtAgo10 domains (shown in cartoon representation with side chains shown as sticks) fit into the EM density (shown in mesh). e. The bent-duplex conformation of AtAgo10 strongly resembles a previous bent duplex structure of HsAgo2 (PDB 6MDZ), with an RMSD of 1.5 Å for 634 equivalent Cα atoms.
The second structure (central-duplex conformation) has density for a continuous guide-target RNA duplex passing through the AtAgo10 central cleft with the guide 3' end released from the PAZ domain (Fig. 2c, EV6). The target RNA scissile phosphate is bound to catalytic residues D709 and H935 through a Mg2+ ion (Fig. EV6e) in a configuration resembling the catalytic centers of T. thermophilus AGO and bacterial RNase H10,28, indicating this reconstruction represents a slicing-competent conformation. AtAgo10 structure is similar to the bent-duplex conformation, with the exception of movement and increased mobility in the PAZ and N domains. Compared to the bent-duplex conformation, the N domain is rotated ~10° about an axis near helix-3 (α3) of the L1 domain (Fig. 2d). α3, portions of the L2 domain, and a conserved ß-hairpin structure in the L1 domain (L1 hairpin) are also rotated about this axis (Fig. 2d). The observed rotation breaks contacts between the L1 and PIWI domains (Fig. 2d, inset) and is necessary to avoid steric clashes between the protein and target nucleotides after t13 (Fig. EV7).
Fig. EV6. Reconstruction of the AtAgo10-guide-target central-duplex conformation.
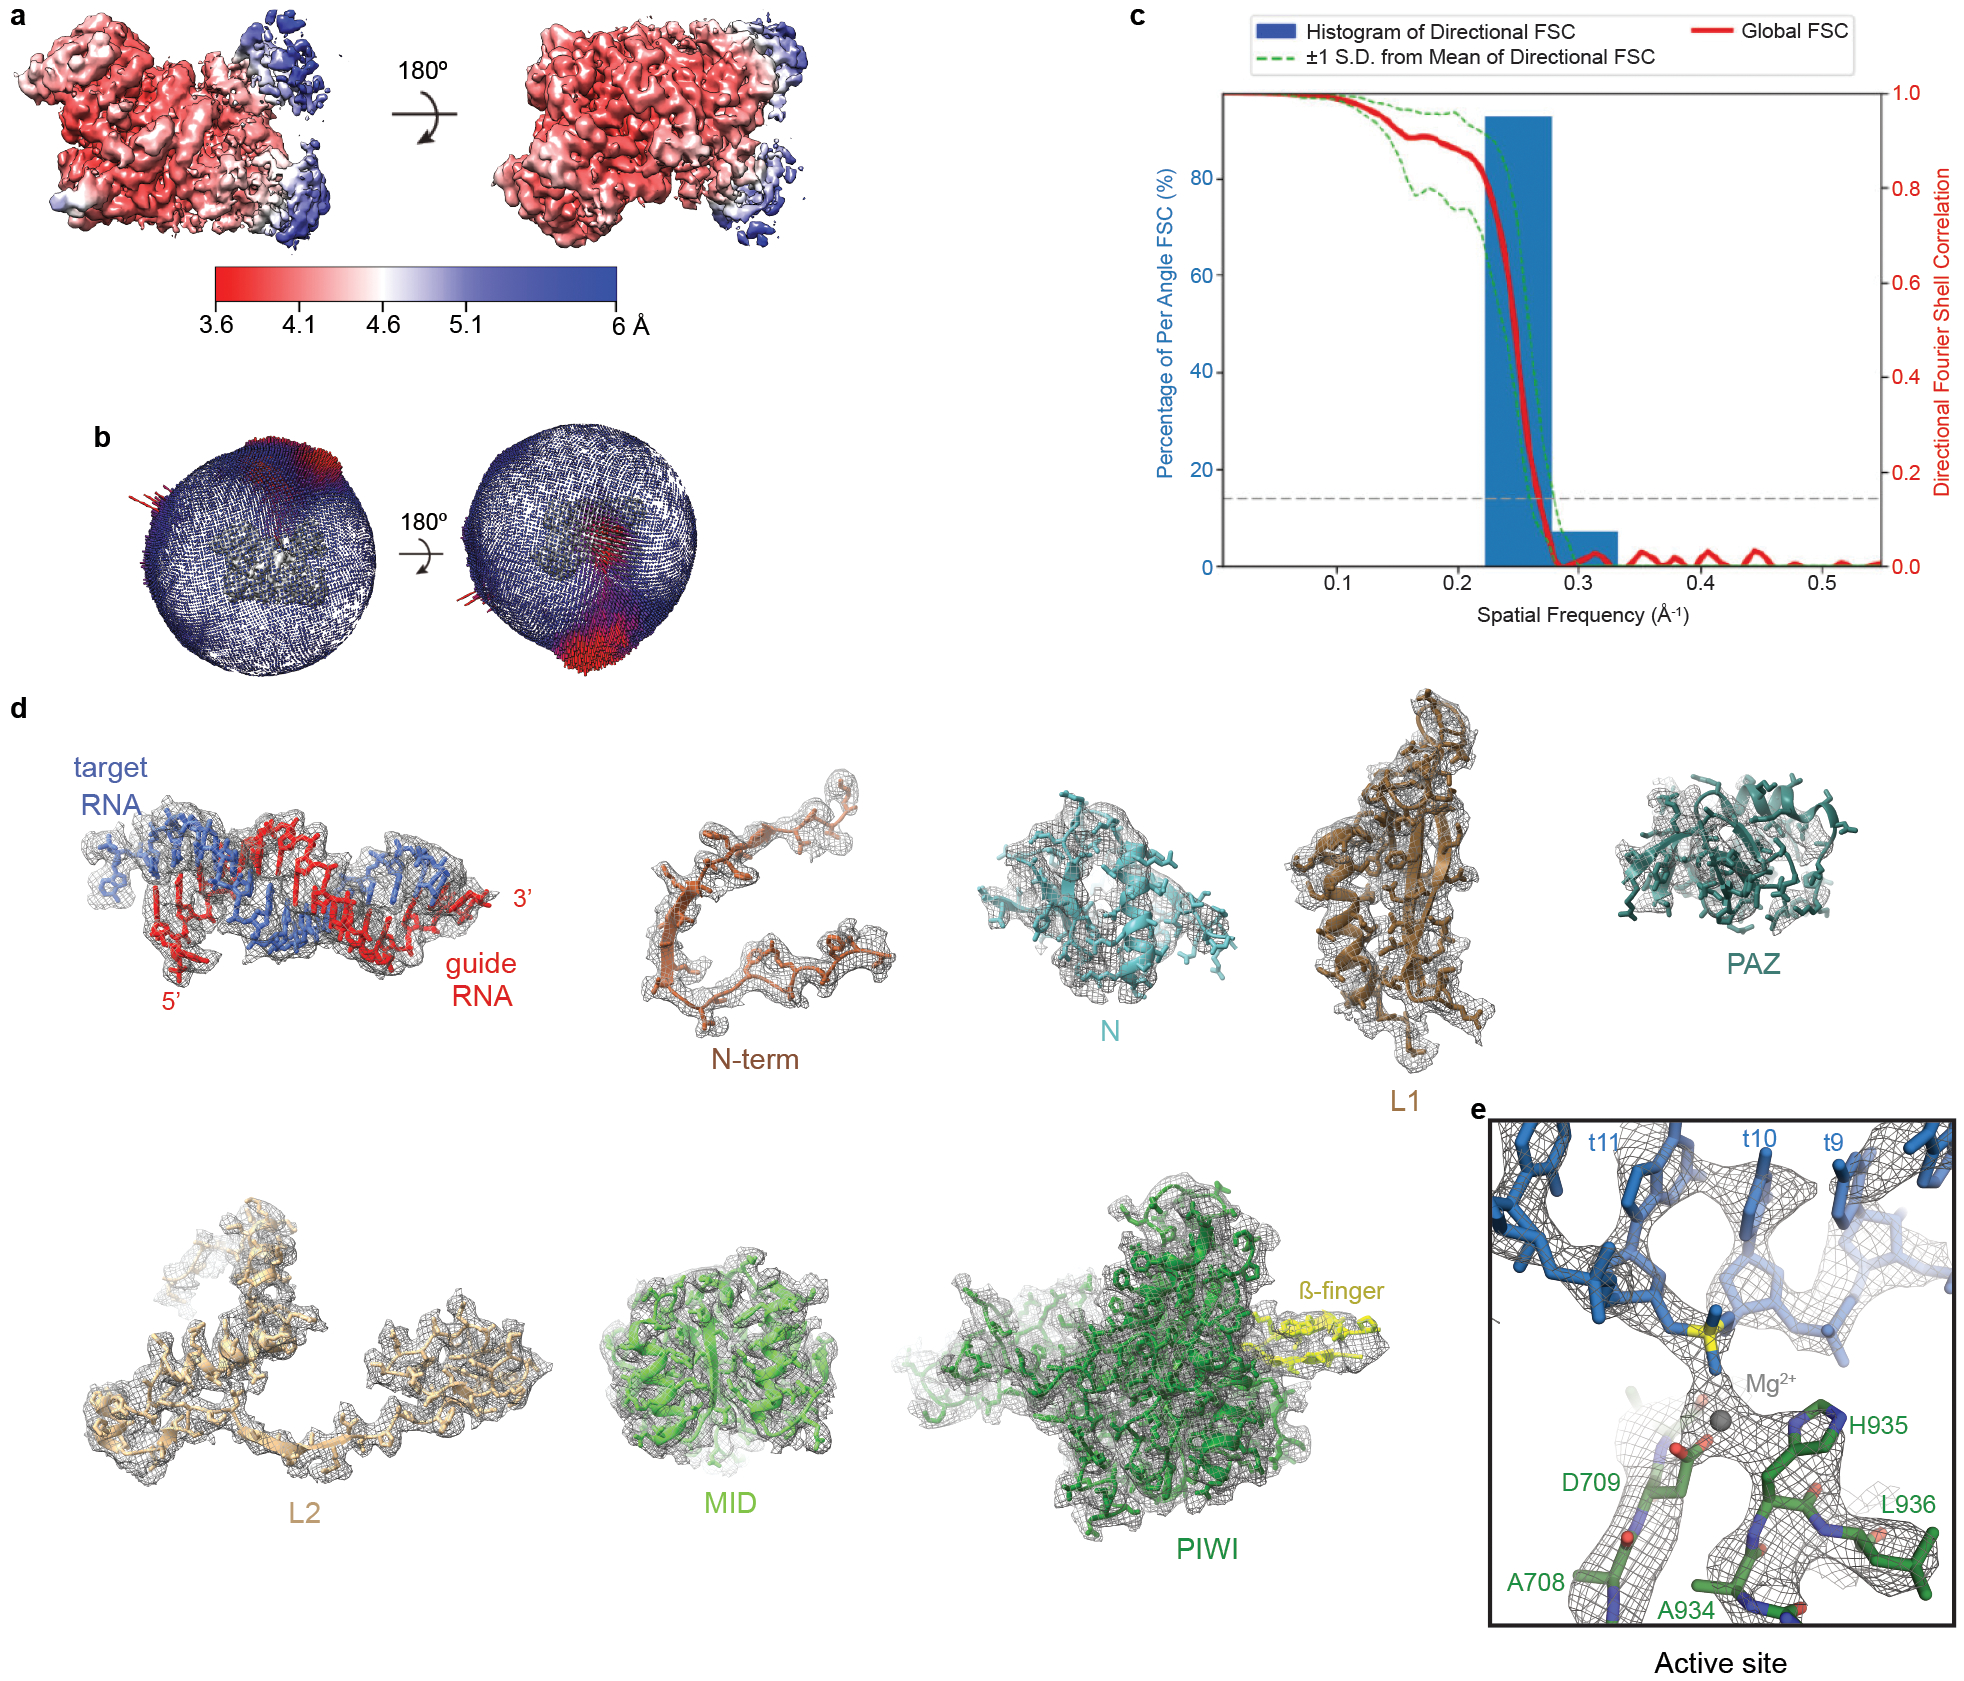
a. Final 3D map for Conformation-1 (see Fig. EV4) of the AtAgo10-guide-target RNA complex colored by local resolution values. b. Angular distribution plot showing the Euler angle distribution of the AtAgo10-guide-target particles in the final reconstruction. The position of each cylinder corresponds to the 3D angular assignments and their height and color (blue to red) corresponds to the number of particles in that angular orientation. c. Directional Fourier Shell Correlation (FSC) plot representing 3D resolution anisotropy in the reconstructed map, with the red line showing the global FSC, green dashed lines correspond to ±1 standard deviation from mean of directional resolutions, and the blue histograms correspond to percentage of directional resolution over the 3D FSC. d. Guide-target duplex (shown as sticks) and individual AtAgo10 domains (shown in cartoon representation with side chains shown as sticks) fit into the EM density (shown in mesh). e. Close-up view of density surrounding the scissile phosphate (yellow).
Fig. EV7. Bent-duplex conformation of AtAgo10 cannot bind a central guide-target duplex with pairing beyond t13.
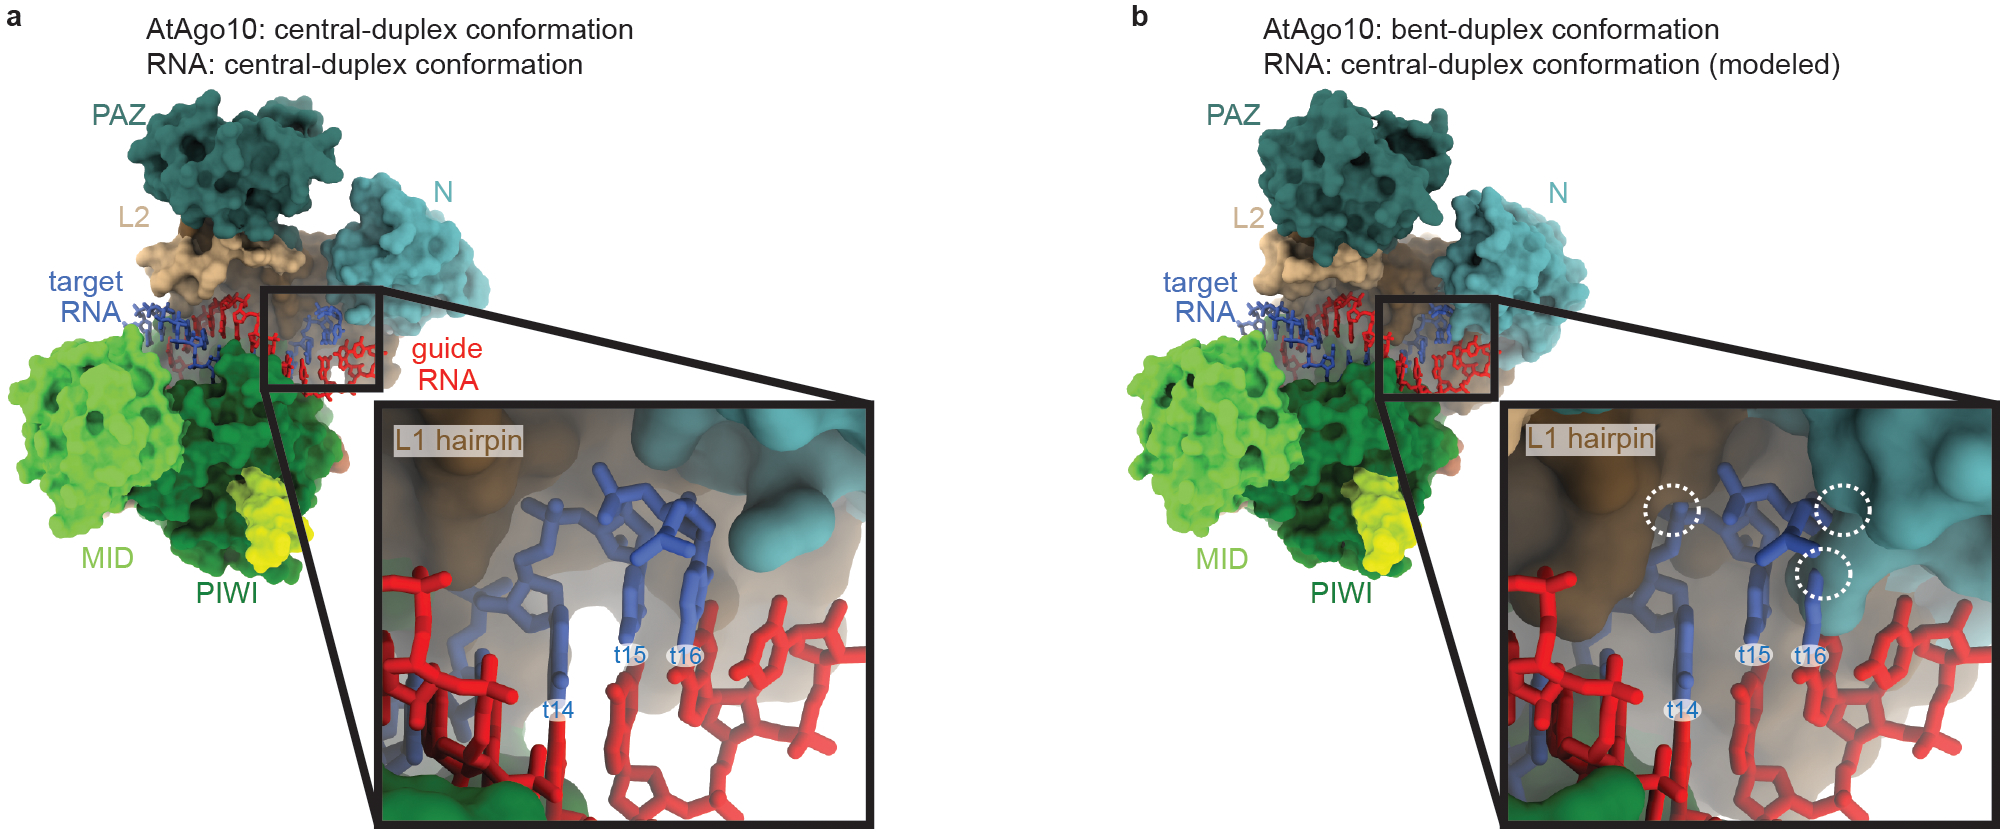
a. Surface representation of the AtAgo10 central-duplex structure with the guide-target RNA duplex shown as sticks. Inset shows no steric clashes between AtAgo10 and the end of the RNA duplex. b. Surface representation of AtAgo10 in the bent-duplex conformation with a modeled continuous guide-target RNA duplex (taken from the central-duplex structure). Inset shows steric clashes (white dashed circles) between t14/t16 of the modeled RNA and the L1 hairpin/N domain of AtAgo10.
Target RNA contacts in the slicing-competent conformation
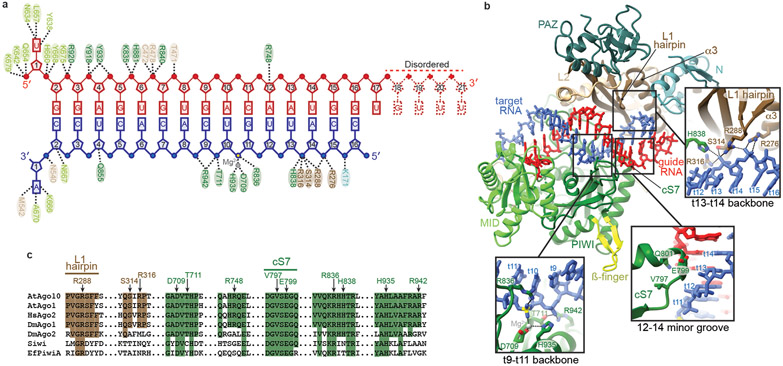
The central-duplex structure reveals protein-RNA interactions associated with target slicing. AtAgo10 holds the guide-target duplex through contacts to both guide and target RNA backbones (Fig. 3a). In the seed region, the AtAgo10 MID, PIWI, and L2 domains contribute contacts to the guide backbone. These contacts are also present in the bent-duplex structure and similar to interactions in target-bound HsAgo2 crystal structures19,20,29, indicating a conserved role in small RNA targeting.
Fig. 3. Catalytic-competent conformation of the AtAgo10-guide-target complex.
a. Schematic of major contacts between AtAgo10 and the guide (red) and target (blue) RNAs. Residues colored by domain, as in Fig. 1. b. Structure of the AtAgo10-guide-target central-duplex conformation. Insets detail protein-RNA contacts specific to the central-duplex conformation. c. Sequence alignment of select plant and animal AGO and PIWI proteins. AtAgo10 residues contacting t9-t14 are indicated. Residues forming L1 hairpin and cS7 are also indicated. Shaded residues are identical to AtAgo10.
Contacts unique to the central-duplex structure occur downstream of the seed region. Notably, after the seed region, nearly all direct contacts to the guide-target duplex are made to the target RNA and not the guide. AtAgo10 binds the target RNA backbone using residues from the PIWI and L1 domains, including the L1 hairpin, which forms salt linkages with the phosphates of t13 and t14 (Fig. 3b). Additional contacts are made by a loop in the PIWI domain, previously termed ‘conserved sequence 7’ (cS7)21, which docks with the minor groove of the guide-target duplex at positions 12-14. AtAgo10 residues that recognize the backbone of target nucleotides t9-t14 are perfectly conserved in HsAgo2 (Fig. 3c).
t9-t13 docks into the active site channel
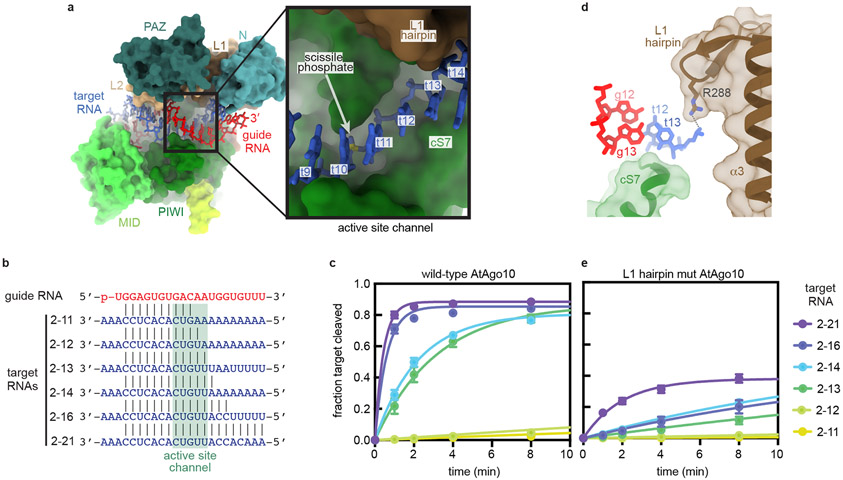
Based on the central-duplex structure, we propose a model for target recognition during RNA slicing. Previous studies showed mouse Ago2 slicing rates are most potently reduced by guide-target mismatches in a region spanning t9–t1316. A surface representation of AtAgo10 shows the backbone of t9-t13 docks into a narrow channel containing the AtAgo10 active site (Fig. 4a). This ‘active site channel’ has shape complementarity to A-form RNA. Thus, we propose that docking of paired target nucleotides t9-t13 into the active site channel is the primary means by which AtAgo10 positions target RNA scissile phosphate for catalysis. The end of the active site channel is formed by cS7, explaining why cS7 is essential for RNA slicing23. Importantly, docking of t9-t13 requires the release of the guide 3' end from the PAZ domain and rearrangement of the protein-RNA contacts compared to the observed non-catalytic conformation (Fig. EV8).
Fig. 4. Structural basis for RNA Slicing.
a. Surface representation of the AtAgo10 central-duplex model. Inset shows t9–t13 (blue sticks) docked in the active site channel (guide RNA omitted for clarity). b. Base pairing schematic of guide and target RNAs used in slicing reactions in panels c and e. Target nucleotides falling within the active site channel are indicated. c. Fraction of target RNAs cleaved by a saturating excess of wild-type AtAgo10-guide complex versus time. d. Side-view of the end of the active site channel where the L1 hairpin secures t13 against cS7. e. Fraction of target RNAs cleaved by a saturating excess L1-hairpin-mut AtAgo10-guide complex versus time. Data points are the mean values of n=3 independent experiments. Error bars indicate SEM.
Fig. EV8. Comparison of catalytic and non-catalytic AtAgo10-guide-target structures.
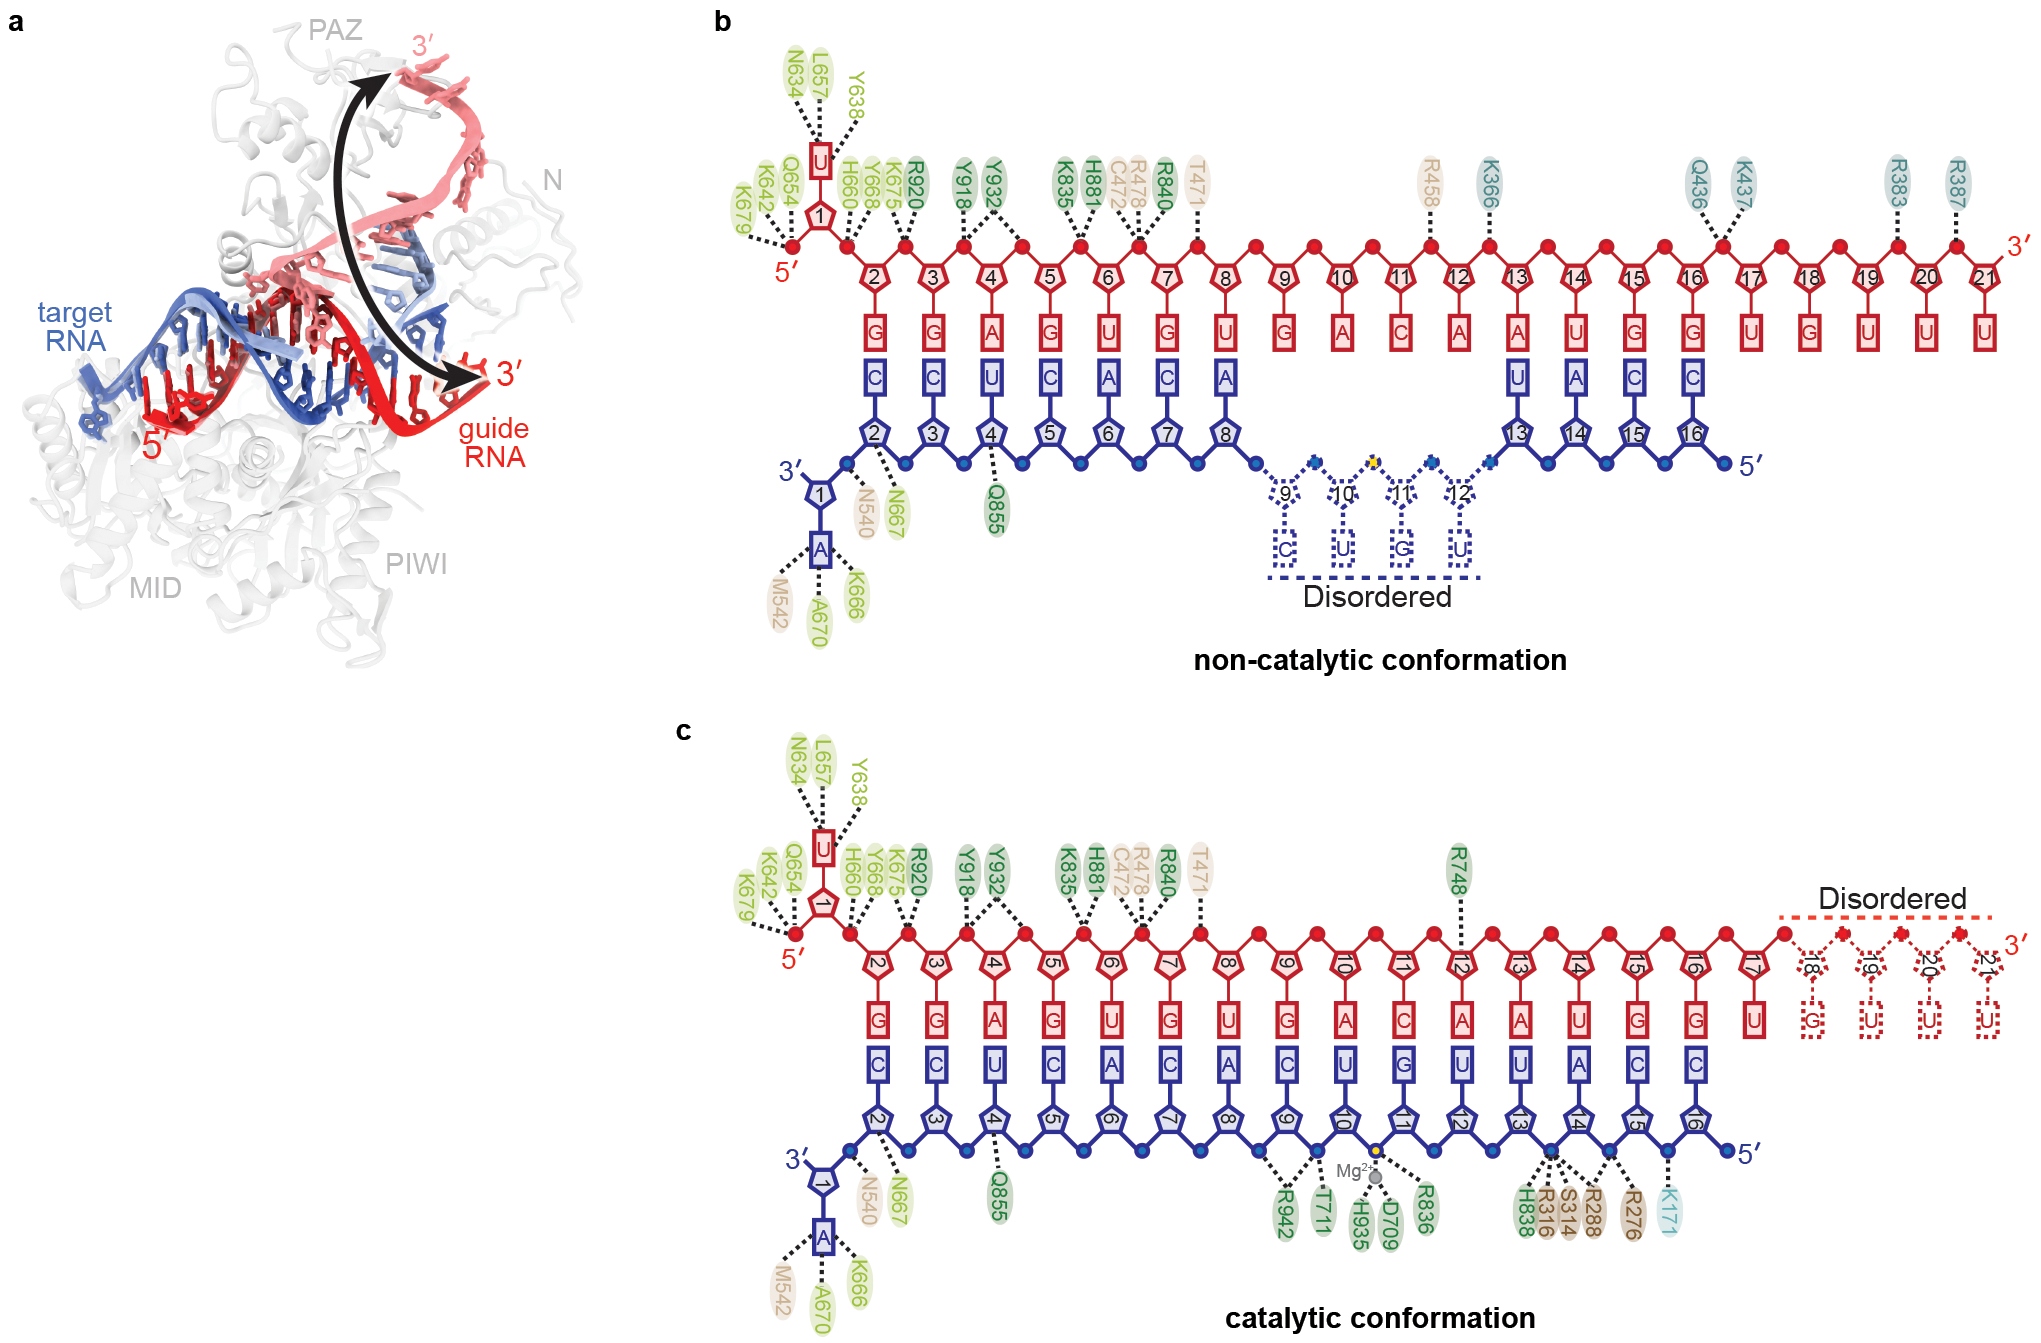
a. Superposition of catalytic (central duplex) and non-catalytic (bent duplex) conformations. Arrow indicates the magnitude of movement traversed by the guide RNA 3' end between conformations. b. Schematic of major contacts between AtAgo10 and the guide (red) and target (blue) RNAs in the non-catalytic (bent duplex) conformation. c. Schematic of major contacts between AtAgo10 and the RNAs in the catalytic (central duplex) conformation. Residues colored by domain, as in Fig. 1.
To test this model, we measured single turnover slicing rates by AtAgo10 using targets with increasing complementarity to the guide 3' end (Fig. 4b). Slicing rates increased 40-fold as guide-target complementarity extended from t2-t12 to t2-t13, supporting the importance of pairing within the t9-t13 segment (Fig. 4c). Increasing complementarity to t2-t16 stimulated slicing rate an additional 5-fold, likely by stabilizing the opened conformation of the L1/N domain (Fig. 2d, EV7), and/or facilitating the release of the guide RNA 3' end from the PAZ domain.
The L1 hairpin directs targets into the active site channel
The central-duplex structure indicates that the L1 hairpin holds the t9-t13 segment in the active site channel (Fig. 4d). Indeed, an AtAgo10 mutant (L1-hairpin-mut AtAgo10), in which the apical loop of the L1 hairpin was replaced with a Gly-Gly linker, cleaved target RNAs ~10 times slower than wild-type AtAgo10 (Fig 4e). Inhibition of slicing was not due to a target-binding defect as all target RNAs were bound by L1-hairpin-mut AtAgo10 (Fig. EV9a,b). Additionally, unlike wild-type AtAgo10, the t2-t14 and t2-t16 targets were cleaved at identical rates by L1-hairpin-mut AtAgo10. Taken with the conformational coupling between the L1 hairpin and N domain (Fig. 2d), we suggest the L1 hairpin coordinates docking of the paired t9–t13 segment with rotation of the N domain and thereby enables guide-target pairing downstream of position 13 in the slicing-competent conformation (Fig. EV7). Finally, although >90% of the 2-21 target RNA molecules in our slicing reactions were bound to L1-hairpin-mut AtAgo10, <50% were cleaved after extended incubation (Fig. EV9c). Thus, by directing t9–t13 into the active site channel, the L1 hairpin helps prevent AtAgo10-guide-target complexes from becoming trapped in stable, non-catalytic conformations.
Fig. EV9. L1-hairpin-mut AtAgo10 is impaired in target-slicing but not target-binding.
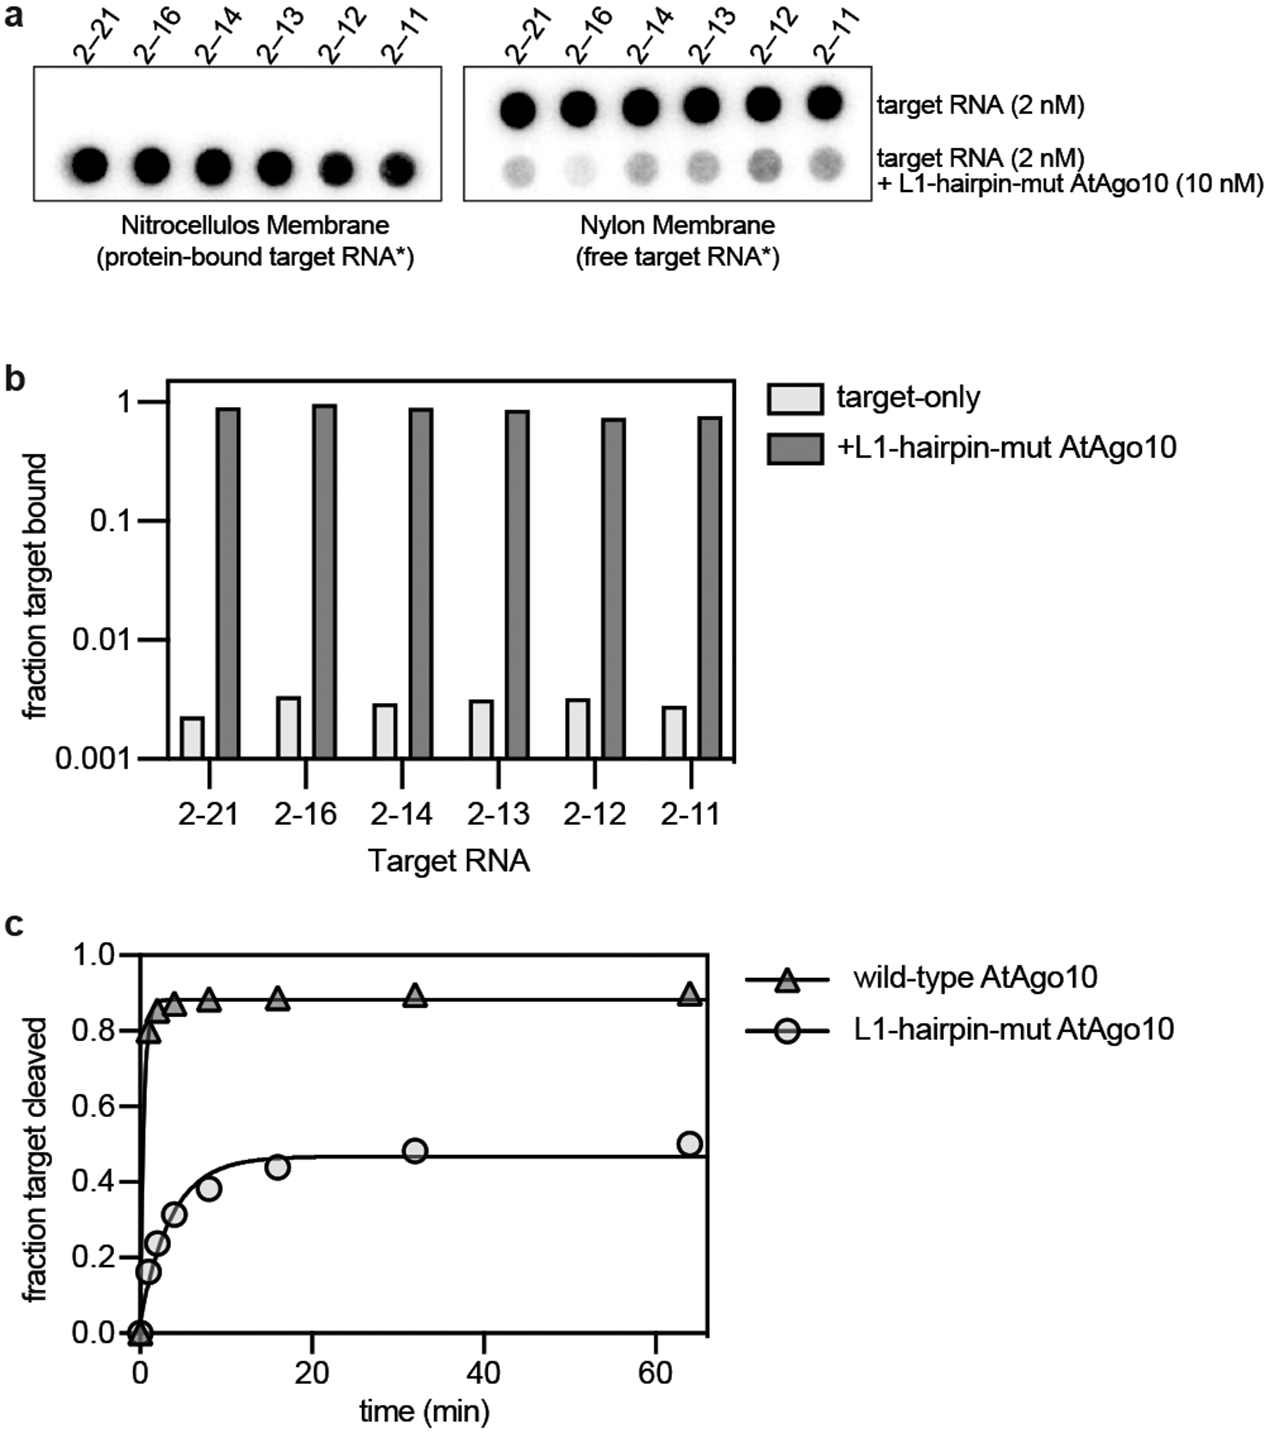
a. Blots from an RNA filter-binding experiment using L1-hairpin-mut AtAgo10 (10 nM) and target RNAs (2 nM) used in this study (shown in Fig. 4B). Complexes were formed with 32P-labeled target RNAs under conditions used for slicing experiments (except Mg2+ was omitted to prevent target cleavage) and passed through a nitrocellulose membrane (to capture protein-RNA complexes) followed by a nylon membrane (to capture RNAs not retained on the nitrocellulose). b. Quantitation of data in panel a. Plotted data are the values from n=1 experiments. c. Fraction of 2-21 target RNA (2 nM) cleaved by wild-type (10 nM) or L1-hairpin-mut AtAgo10 (10 nM) versus time. Data points are the mean values of n=3 independent experiments. Error bars indicate SEM.
Discussion
Seminal studies of TtAgo showed guide 3'-end release and docking of the scissile phosphate in coordination with a divalent cation are critical steps toward achieving the catalytic conformation for target slicing10,11. Our results reveal that AtAgo10 shares these fundamental requirements for slicing. We also note differences between these prokaryotic and eukaryotic AGOs. TtAgo uses the propagation of the guide-target duplex to trigger conformational changes that form its active site and license target slicing (Fig. EV10a)10,11. By contrast, AtAgo10 uses large movements of relatively rigid domains (Fig. 2c,d, and EV10b) to direct the flexible guide-target duplex into its pre-formed active site channel, with t9-t13 docking licensing slicing (Fig. 4a).
Fig. EV10. Comparison of TtAgo and AtAgo10 PIWI domain conformational changes.
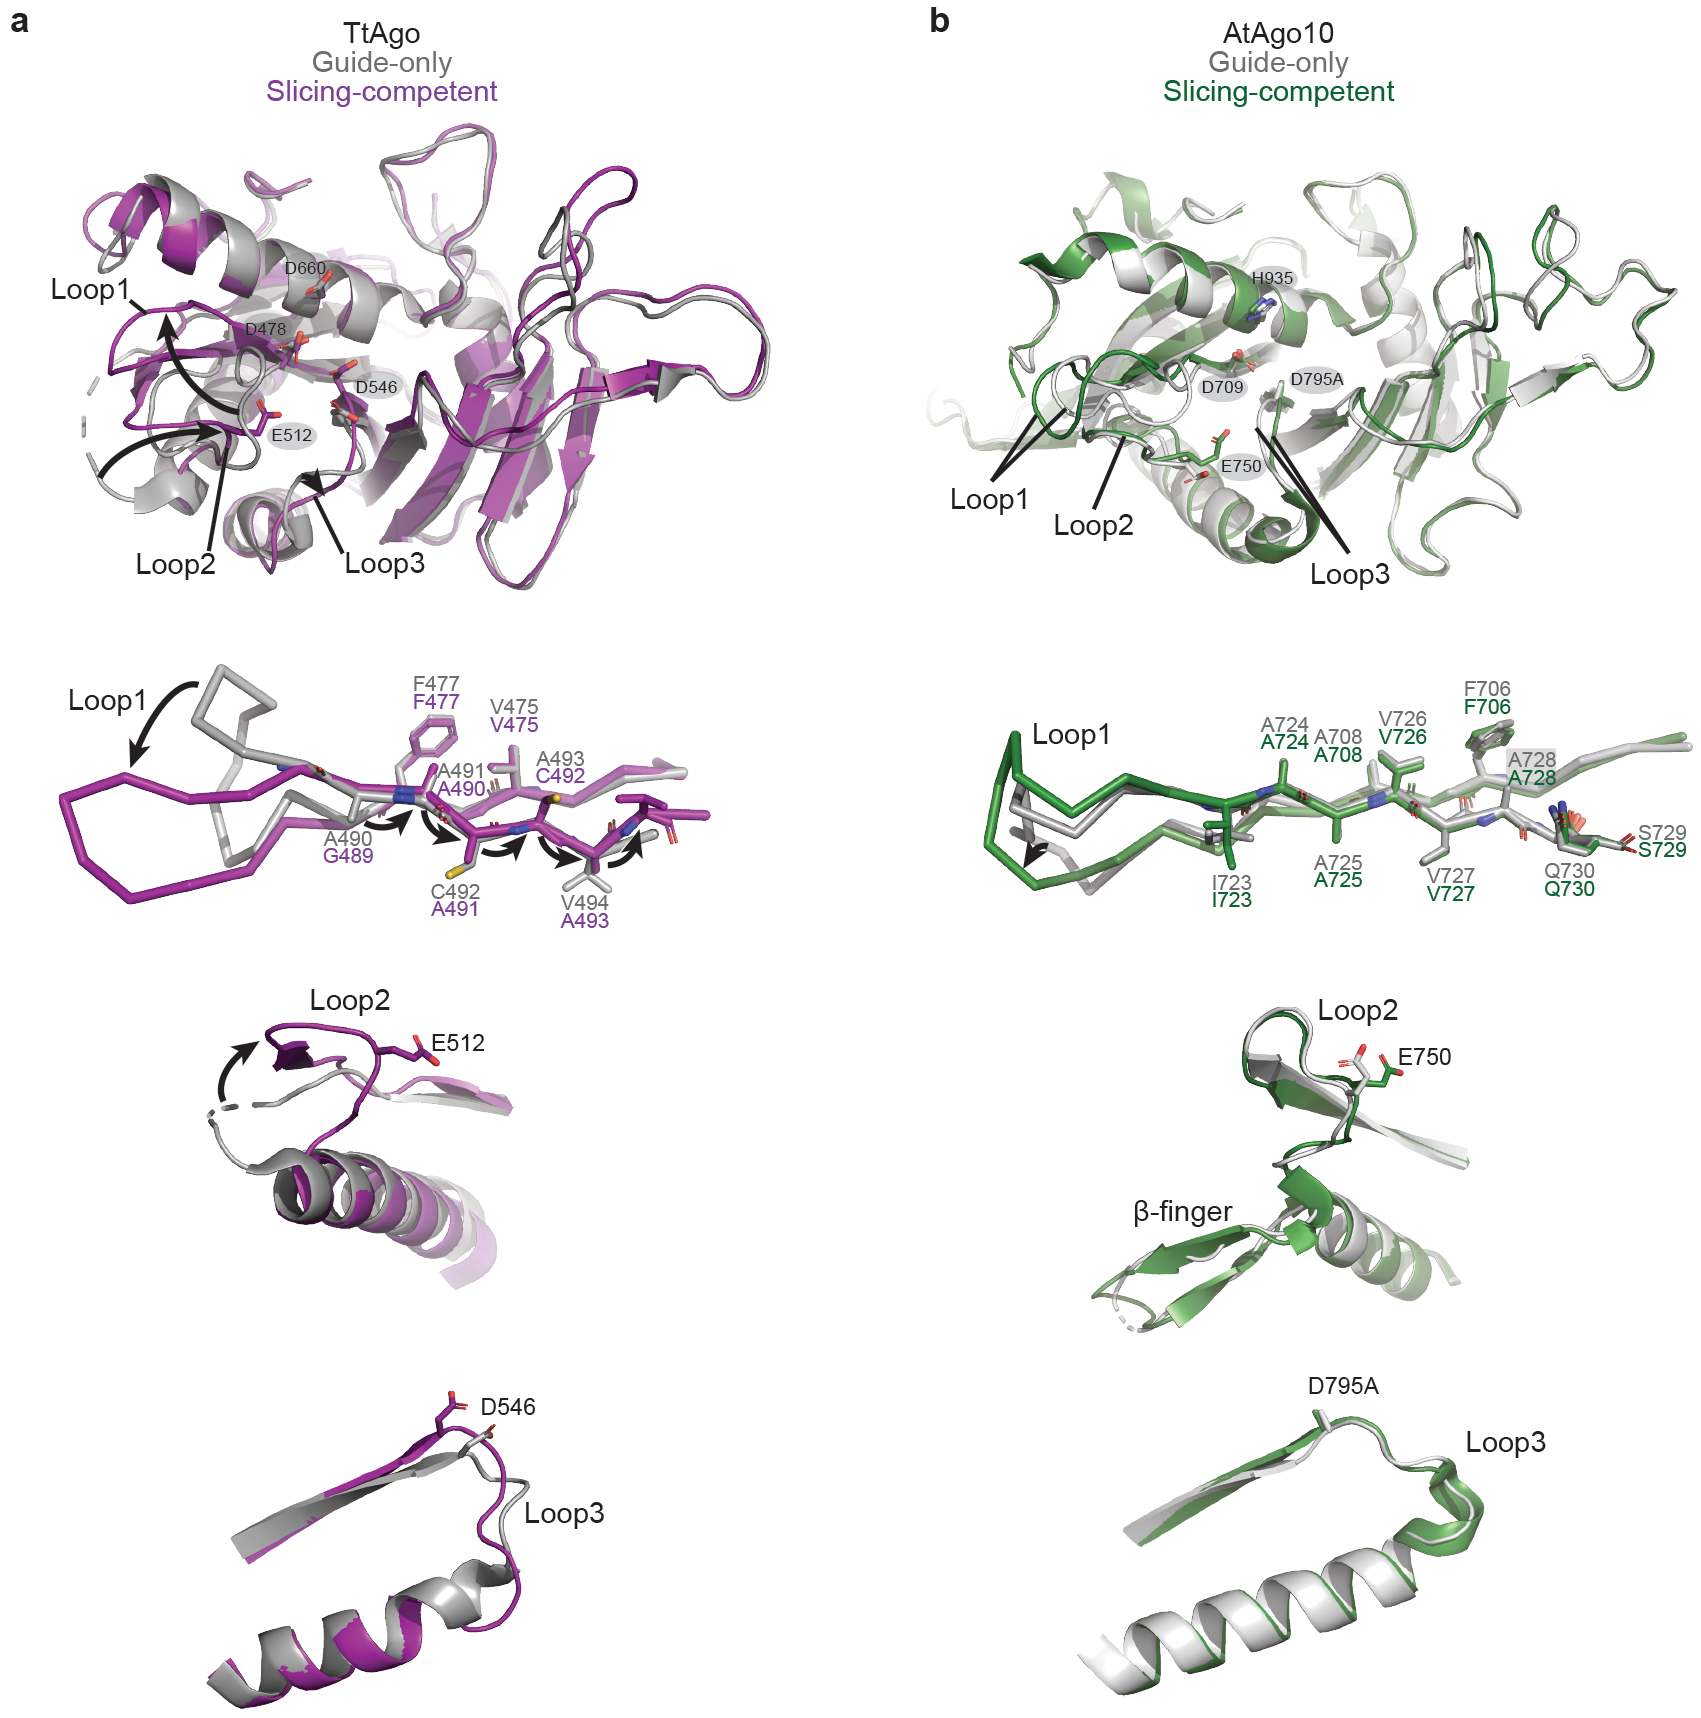
a. Superimposition of TtAgo PIWI domains from guide-only (grey, PDB: 3DLH) and slicing competent (purple, PDB: 4NCB) conformations. Top panel: an overview of the TtAgo PIWI domain with active site residues shown as sticks and labeled. Bottom panel: Detailed views showing the formation of the catalytic conformation involves three rearranged loops and flipping+translation of a ß-strand connected to loop-1 in the TtAgo PIWI domain. Arrows indicate major shifts from the guide-only to the slicing-competent conformation. b. Superimposition of the AtAgo10 PIWI domains from guide-only (grey) and slicing competent (central-duplex) conformations (green) shows relatively few changes and no ß-strand repositioning.
We propose a ‘binder-clip’ mechanism for RNA slicing by AtAgo10. In the guide-only conformation, AtAgo10 is held closed, like a binder clip, with the L1 hairpin blocking the active site channel. Formation of the guide-target duplex at positions 9–13 stimulates movement of the L1 hairpin into an open conformation, like a binder clip when force is applied to open it. Tension within AtAgo10 may allow the L1 hairpin to hold the guide-paired t9-t13 segment in the active site channel, like a binder clip holding paper within its grip. The overall structure (Fig. 1e,f), conformations (Fig. EV5e), and RNA-contacting residues (Fig. 3c) are shared between AtAgo10 and HsAgo2, indicating this model may describe the RNA slicing mechanism used in both Plantae and Animalia kingdoms of life.
The updated view of RNA slicing has implications for understanding siRNA potency. siRNA efficacy has long been known to be influenced by guide strand selection30,31 and target site accessibility32, and yet even after taking these factors into consideration highly potent siRNA sequences are relatively rare33. Our results indicate that the distribution of catalytic and non-catalytic conformations adopted by the AGO-guide-target complex is an additional factor that influences siRNA potency, wherein siRNA sequences that are prone to dwelling in bent-duplex conformations will be less potent than siRNAs that favor the central-duplex conformation. Thus, structural insight into AGO-guide-target conformations and the role of t9–t13 docking provides a rational basis for considering new motifs and modifications that dictate siRNA efficacy.
Methods
Bacterial strains and plasmids
Bacteria used for cloning were chemically competent E. coli OmniMAX™ (Thermo Fisher). Bacteria used for bacmid production were chemically competent DH10Bac™ (Thermo Fisher).
Bacterial media and growth conditions
All bacterial cultures were grown in Luria-Bertani (LB) medium at 37 °C. When needed, media was supplemented with one or more of the following antibiotics at the following concentrations: ampicillin (100 μg/mL), kanamycin (40 μg/mL), tetracycline (5 μg/mL), gentamycin (7 μg/mL), 5-Bromo-4-Chloro-3-Indolyl β-D-Galactopyranoside (X-gal, 25 μg/mL in dimethylformamide), and/or Isopropyl β-D-1-thiogalactopyranoside (IPTG, 1 mM).
Insect cell media and growth conditions
Sf9 cells were grown in Lonza Insect XPRESS™ medium supplemented with 1x Gibco™ Antibiotic-Antimycotic in suspension at 27 °C.
Cloning and mutagenesis
DNA fragments encoding full-length AtAgo10 were generated by PCR using a cDNA clone encoding Arabidopsis thaliana ARGONAUTE 10 (TAIR: AT5G43810, a gift from Dr. Wenrong He and Dr. Yingnan Hou) as a template. PCR products were cloned as SfoI-KpnI fragments into a modified form of pFastBac HTA (Thermo Fisher) to generate expression plasmids for the Bac-to-Bac baculovirus expression system (Thermo Fisher). The active site mutation D795A was generated by quick-change PCR. The L1 hairpin mutation was generated by first amplifying two AtAgo10 fragments with PCR primers overlapping and replacing codons for the L1 hairpin residues 286-289 (VGRS) with GG codons, and then assembling the two gel purified PCR fragments with digested pFastBac HTA using NEBuilder® HiFi DNA Assembly Master Mix.
Preparation of AtAgo10-guide RNA complex
His6-Flag-Tev-tagged AtAgo10 proteins were expressed in Sf9 cells using a baculovirus system (Invitrogen). Flasks containing 750 mL 3.4 x 10⁶ cells/mL Sf9 cells were infected with ~15 mL virus and were harvested after 60 hours by centrifugation. Usually, cell pellets from two flasks were combined and resuspended in ~200 mL Lysis Buffer (50 mM NaH2PO4, pH 8, 300 mM NaCl, 5% glycerol, 20 mM imidazole, 0.5 mM TCEP). Resuspended cells were lysed by passing twice through a M-110P lab homogenizer (Microfluidics). The resulting total cell lysate was clarified by centrifugation (30,000 x g for 25 min) and the supernatant fraction was applied to 8 mL packed Ni-NTA resin (Qiagen) and gently rocked at 4°C for 1.5 hours in 50 mL conical tubes. The Ni-NTA resin was then pelleted by brief centrifugation and the supernatant solution was discarded. The resin was washed with ~50 mL ice-cold Nickel Wash Buffer (300 mM NaCl, 20 mM imidazole, 0.5 mM TCEP, 50 mM Tris, pH 8). Centrifugation/wash steps were repeated a total of three times. Co-purified cellular RNAs were degraded by incubating the washed resin with 400 units of micrococcal nuclease (Clontech) in ~25 mL of Nickel Wash Buffer supplemented with 5 mM CaCl2 at room temperature for ~1 hour. The nuclease-treated resin was washed three times again with Nickel Wash Buffer. Protein was then eluted in four column volumes of Nickel Elution Buffer (300 mM NaCl, 300 mM imidazole, 0.5 mM TCEP, 50 mM Tris, pH 8). Eluted protein was incubated with 24 nmol synthetic guide RNA and 150 μg TEV protease during a ~1 hour dialysis against 1 L of Dialysis Buffer (300 mM NaCl, 0.5 mM TCEP, 50 mM Tris, pH 8) at room temperature. During dialysis, a capture resin for isolation of guide-loaded AtAgo10 was prepared by incubating 345.6 uL packed High Capacity Neutravidin Resin (Thermo Fisher) with 28.8 nmol capture oligo in Wash A Buffer (100 mM KOAc, 2 mM MgOAc, 0.01% CHAPS, 30 mM Tris, pH 8) for 30 min at 4 °C, followed by 10 mL wash A buffer wash. The dialyzed RNA-protein sample was then supplemented with 0.01% CHAPS and 2 mM MgOAc and then incubated with capture resin at RT for 1 hour, with gentle mixing by inverting the tube every 5-10 minutes). The resin was then washed, in order, three times with 10 mL Wash A, four times with 10 mL Wash B (2 M KOAc, 2 mM MgOAc, 0.01% CHAPS, 30 mM Tris, pH 8), and three times with 10 mL Wash C (1 M KOAc, 2 mM MgOAc, 0.01% CHAPS, 30 mM Tris, pH 8). The resin was then re-suspended in 1900 μL Wash C supplemented with 57.6 nmol competitor DNA at RT for ~2 hours, with gentle mixing by inverting the tube every 5-10 minutes. The eluate was recovered and dialyzed against 1 L Q dialysis buffer (150 mM NaCl, 0.01% CHAPS, 0.5 mM TCEP, 20 mM Tris, pH 8) at 4 °C overnight. After dialysis, the sample was passed through 240 μl of Q Sepharose Fast Flow anion exchange resin (GE Healthcare) (pre-equilibrated in Q dialysis buffer) to remove unbound oligonucleotides, and the flow-through solution was collected. The flow-through was then concentrated to 1~3 mg/mL and exchanged to Tris Crystal Buffer (10 mM Tris pH 8, 100 mM NaCl, 0.5 mM TCEP). The concentrated protein was aliquoted, flash-frozen in liquid N2, and stored at −80 °C. The concentration of the AtAgo10-guide RNA complex was determined by Bradford assay using BSA as a standard.
Grid preparation for cryo-EM
For AtAgo10-guide RNA binary complex grids, 3-4 μL of 0.3 mg/mL AtAgo10-guide RNA in Tris Crystal Buffer was added onto fresh plasma-cleaned (75% nitrogen, 25% oxygen atmosphere at 15 W for 7 seconds in Solarus plasma cleaner, Gatan), 300 mesh holey gold grids (UltrAuFoil R1.2/1.3, Quantifoil). Excess sample solution was removed from grids by manual blotting with Whatman No.1 filter paper for 1-2 seconds. Samples were immediately vitrified by plunge freezing in liquid-ethane at −179 °C using a manual plunge freezing device. Grid vitrification was performed in a cold room maintained at 4°C with relative humidity between 90-98% to minimize sample evaporation. For AtAgo10-guide-target RNA ternary complex grids, 1.2 molar equivalents of target RNA was added to purified AtAgo10-miRNA complex, which was incubated on ice for ~1h in Tris Crystal Buffer with 2 mM MgCl2. Grid preparation procedure was the same as the AtAgo10-guide RNA binary complex.
Cryo-EM data acquisition
Cryo-EM data acquisition was performed on a 200kV Talos Arctica (Thermo Fisher Scientific) transmission electron microscope. Micrographs were acquired using a K2 Summit (Gatan) direct electron detector, operated in electron-counting mode, using the automated data collection software Leginon35 by image shift-based movements from the center of four adjacent holes to target the center of each hole for exposures. Each micrograph for the AtAgo10-guide RNA binary complex was collected as 55 dose-fractionated movie frames over 11 s and with a cumulative electron exposure of 66.51 e-/Å2. The data set was collected at a nominal magnification of 73kx, corresponding to 0.566 Å/pixel on the detector, with random nominal defocus values varying between 0.8 μm and 1.3 μm. For the AtAgo10-guide-target RNA ternary complex, each micrograph was acquired as 42 dose-fractionated movie frames over 8.4 s with a cumulative electron exposure of 66.88 e-/Å2. The data set was collected at a nominal magnification of 45kx, corresponding to 0.91 Å/pixel on the detector, with random nominal defocus values varying between 1 μm and 1.7 μm. 2,656 and 2,049 micrographs were collected for the AtAgo10-guide and AtAgo10-guide-target complexes, respectively.
Image processing and 3D reconstruction
For the Atago10-guide-target ternary complex map, raw movies were imported into the RELION 3.1 data processing pipeline36. Beam-induced motion correction and radiation damage compensation over spatial frequencies (dose-weighting) of the raw movies, was performed using RELION embedded MotionCor2 with its own implementation. Contrast Transfer Function (CTF) parameters for these micrographs were estimated using gCTF37. The micrographs with estimated max resolution lower than 7Å were eliminated for following processing. Laplacian of Gaussian based automated particle picking program in RELION was used for picking particles from the first 125 micrographs yielding a stack of 358,840 picks that were binned 4 x 4 (3.64 Å/pixel, 50-pixel box size) and subjected to reference-free 2D classification. The best four classes that represented orthogonal views of AtAgo10 were then used for template-based particle picking.1,935,081 picks were extracted from 1318 micrographs, binned 2 x 2 (1.82 Å/pixel, 100-pixel box size) and subjected to reference-free 2D classification using a 120 Å soft circular mask. The best 2D class averages that represented side or top/bottom views of AtAgo10 (i.e., the longest dimensions of AtAgo10) were then isolated (972,516 particles). Those class averages that contained “end-on” pr tilted views of AtAgo10 were combined and subjected to another round of reference-free 2D classification using a 80 Å soft circular mask to focus on alignment of the smaller “end-on” views. The best 2D class averages were then selected (75,722 particles) and combined with previously selected particles containing the longer side views for further processing. A total of 1,048,238 particles corresponding to the best 2D class averages that displayed strong secondary-structural elements and multiple views of AtAgo10 were selected for homogenous ab initio model generation using cryoSPARC38. The generated model was imported back into RELION and low-pass filtered to 35 Å for use as an initial model for 3D classification with alignment (6 classes, tau_fudge = 4). For the bent duplex conformation (conformation-2), particles comprising the best-resolved class (Class 4) was then subjected to 3D auto-refinement. A subsequent no-alignment classification (2 classes, tau_fudge = 20) was performed and the class that possessed the best-resolved side-chain and backbone densities were re-centered and re-extracted unbinned (0.91 Å/pixel, 200-pixel box size). Due to the close proximity of neighboring particles, any re-centered particle within 40 Å of another was considered a duplicate and subsequently removed. This final stack of 28,499 particles was 3D auto-refined using a soft mask (0-pixel extension, 5-pixel soft cosine edge). Following per-particle defocus, beam-tilt refinement and Bayesian polishing, the final resolution of the reconstruction improved to 3.79 Å (gold-standard FSC at 0.143 cutoff) for this conformation. For central duplex conformation, particles comprising Class 4 and Class 6 was combined and subjected to another round of 3D classification with alignment (4 classes, tau_fudge = 4). Particles comprising the best-resolved class was then subjected to 3D auto-refinement. A subsequent no-alignment classification (2 classes, tau_fudge = 20) was performed and the class that possessed the best-resolved side-chain and backbone densities were re-centered and re-extracted unbinned (0.91 Å/pixel, 200-pixel box size). Due to the close proximity of neighboring particles, any re-centered particle within 40 Å of another was considered a duplicate and subsequently removed. The final stack of 38,833 particles was 3D auto-refined using a soft mask (0-pixel extension, 5-pixel soft cosine edge). Following per-particle defocus, beam-tilt refinement and Bayesian polishing, the final resolution of the reconstruction improved to 3.79 Å (gold-standard FSC at 0.143 cutoff) for this conformation. Three-dimensional FSC analyses were done on the remote 3DFSC processing server39.
For the AtAgo10-guide RNA binary complex dataset, beam-induced motion correction and radiation damage compensation over spatial frequencies (dose-weighting) of the raw movies, was performed using UCSF MotionCor240 implemented in the Appion41 image processing workflow. Motion corrected, summed micrographs were imported into the RELION 3.1 data processing pipeline. Contrast Transfer Function (CTF) parameters for these micrographs were estimated using gCTF. Laplacian of Gaussian based automated particle picking program in RELION was used for picking particles from random 843 micrographs yielding a stack of 716,944 picks that were binned 4 x 4 (2.264 Å/pixel, 72-pixel box size) and subjected to reference-free 2D classification. The best four classes that represented orthogonal views of AtAgo10 were then used for template-based particle picking.763,209 picks were extracted from 2645 micrographs, binned 2 x 2 (1.132 Å/pixel, 164-pixel box size) and subjected to reference-free 2D classification using a 120 Å soft circular mask. A total of 381,087 particles corresponding to the best 2D class averages that displayed strong secondary-structural elements and multiple views of AtAgo10 were isolated. Previous AtAgo10-guide-target RNA ternary complex map (bent duplex conformation) was down-scaled and low-pass filtered to 30 Å for use as an initial model for 3D auto-refinement. 381,087 particles were 3D auto-refined into a single class. Upon convergence, the run was continued with a soft mask (3-pixel extension, 5-pixel soft cosine edge), followed by subsequent re-centering and re-extraction binned 2 × 2 (1.132 Å/pixel, 164-pixel box size). Due to the close proximity of neighboring particles, any re-centered particle within a 40 Å of another was considered a duplicate and subsequently removed. These particles were then 3D auto-refinement into a single class using the same soft mask, followed by A subsequent no-alignment classification (2 classes, tau_fudge = 20) was performed and the class that possessed the best-resolved side-chain and backbone densities were re-centered and re-extracted unbinned (0.566 Å/pixel, 328-pixel box size). This final stack of 53,766 particles was 3D auto-refined using a soft mask (0-pixel extension, 5-pixel soft cosine edge). Following per-particle defocus and beam tilt refinement, the final resolution of the reconstruction improved to 3.26 Å (gold-standard FSC at 0.143 cutoff).
Model building and refinement
The homology model of AtAgo10 was generated using Human Ago2 structure (PDB: 4OLA) by Modeller(homology) in UCSF Chimera42,43. The initial homology model was then docked into the AtAgo10-guide RNA reconstruction using UCSF Chimera, followed by manual model building using Coot44. The two AtAgo10-guide-target models were built in a similar fashion using the AtAgo10-guide RNA structure as an initial model. Models were refined through iterative rounds of manual building and fixing of geometric and rotameric outliers in Coot and real-space refinement optimizing global minimization, atomic displacement parameters and local grid search using PHENIX45. Model validation was performed using MolProbity (http://molprobity.biochem.duke.edu) and PDB validation servers (https://www.rcsb.org). Structural figures were made using PyMOL (Schrödinger, LLC) and UCSF ChimeraX.
Target Slicing assay
Purified AtAgo10-guide and AtAgo10-L1-mut-guide RNA complexes (10 nM, final concentration) were incubated at room template with complementary 32P 5'-radiolabelled target RNAs (2 nM, final concentrations) in reaction buffer composed of 30 mM Tris pH 8.0, 100 mM potassium acetate, 2 mM Magnesium acetate, 0.5 mM TCEP, and 0.01 mg/mL baker’s yeast tRNA. Target slicing reactions were stopped at various times by mixing aliquots of each reaction with an equal volume of denaturing gel loading buffer (98% w/v formamide, 0.025% xylene cyanol, 0.025% w/v bromophenol blue, 10 mM EDTA pH 8.0). Intact and cleaved target RNAs were resolved by denaturing PAGE (15%) and visualized by phosphorimaging. Quantification of 32P signal was performed using ImageQuant TL (GE Healthcare). Fraction target RNA cleaved was calculated by dividing the 32P signal in bands on the gel corresponding to the cleavage products by the sum of the 32P signals in intact and cleavage bands for each target RNA at each time point. Data were analyzed using Prism version 8.0 (GraphPad Software, Inc.).
Target binding assays
Purified AtAgo10-L1-mut-guide RNA complexes (10 nM, final concentration) were incubated at room template for 1 hour with complementary 32P 5'-radiolabelled target RNAs (2 nM, final concentrations) in a reaction buffer composed of 30 mM Tris pH 8.0, 100 mM potassium acetate, 0.5 mM TCEP, 0.01 mg/mL baker’s yeast tRNA and 0.005% NP-40. Mg2+ was excluded from the reaction buffer to prevent target slicing. Using a dot-blot apparatus (GE Healthcare Life Sciences), protein-RNA complexes were captured on Protran nitrocellulose membrane (0.45 μm pore size, Whatman, GE Healthcare Life Sciences) and unbound RNA on Hybond Nylon membrane (Amersham, GE Healthcare Life Sciences). Samples were applied with vacuum and immediately washed once with 100 μL of ice-cold wash buffer (30 mM Tris pH 8.0, 100 mM potassium acetate, 0.5 mM TCEP). Membranes were air-dried and 32P signal was visualized and by phosphor-imaging and quantified using ImageQuant TL (GE Healthcare). Fraction target RNA bound was calculated by dividing the 32P signal retained on the nitrocellulose membrane by the sum of the 32P signals on nitrocellulose and nylon membranes for each target RNA. Data were analyzed using Prism version 8.0 (GraphPad Software, Inc.).
Acknowledgments
We are grateful to Dr. Wenrong He and Dr. Yingnan Hou for plasmids containing Arabidopsis thaliana AGO cDNAs and to MacRae lab members, Guy Riddihough, and Jamie Williamson for advice. The research was funded by NIH grants R35GM127090 (I.J.M.), R01GM092740 (T.O.), and S10OD021634.
Footnotes
Competing interests
The author declares no competing interests.
Data availability
Maps for the AtAgo10-guide, AtAgo10-guide-target (central-duplex), and AtAgo10-guide-target (bent-duplex) complexes were deposited in the Electron Microscopy Data Bank under accession IDs EMD-25446, EMD-25472, EMD-25482, respectively. Corresponding atomic models were deposited in the Protein Data Bank under accession IDs 7SVA, 7SWF, 7SWQ.
References
- 1.Singh A et al. Plant small RNAs: advancement in the understanding of biogenesis and role in plant development. Planta 248, 545–558, doi: 10.1007/s00425-018-2927-5 (2018). [DOI] [PubMed] [Google Scholar]
- 2.Bartel DP Metazoan MicroRNAs. Cell 173, 20–51, doi: 10.1016/j.cell.2018.03.006 (2018). [DOI] [PMC free article] [PubMed] [Google Scholar]
- 3.Iwakawa HO & Tomari Y Life of RISC: Formation, action, and degradation of RNA-induced silencing complex. Molecular cell 82, 30–43, doi: 10.1016/j.molcel.2021.11.026 (2022). [DOI] [PubMed] [Google Scholar]
- 4.Zamore PD, Tuschl T, Sharp PA & Bartel DP RNAi: double-stranded RNA directs the ATP-dependent cleavage of mRNA at 21 to 23 nucleotide intervals. Cell 101, 25–33, doi: 10.1016/S0092-8674(00)80620-0 (2000). [DOI] [PubMed] [Google Scholar]
- 5.Hu B et al. Therapeutic siRNA: state of the art. Signal Transduct Target Ther 5, 101, doi: 10.1038/s41392-020-0207-x (2020). [DOI] [PMC free article] [PubMed] [Google Scholar]
- 6.Llave C, Xie Z, Kasschau KD & Carrington JC Cleavage of Scarecrow-like mRNA targets directed by a class of Arabidopsis miRNA. Science 297, 2053–2056, doi: 10.1126/science.1076311 (2002). [DOI] [PubMed] [Google Scholar]
- 7.Allen E, Xie Z, Gustafson AM & Carrington JC microRNA-directed phasing during trans-acting siRNA biogenesis in plants. Cell 121, 207–221, doi: 10.1016/j.cell.2005.04.004 (2005). [DOI] [PubMed] [Google Scholar]
- 8.Axtell MJ, Jan C, Rajagopalan R & Bartel DP A two-hit trigger for siRNA biogenesis in plants. Cell 127, 565–577, doi: 10.1016/j.cell.2006.09.032 (2006). [DOI] [PubMed] [Google Scholar]
- 9.Creasey KM et al. miRNAs trigger widespread epigenetically activated siRNAs from transposons in Arabidopsis. Nature 508, 411–415, doi: 10.1038/nature13069 (2014). [DOI] [PMC free article] [PubMed] [Google Scholar]
- 10.Sheng G et al. Structure-based cleavage mechanism of Thermus thermophilus Argonaute DNA guide strand-mediated DNA target cleavage. Proceedings of the National Academy of Sciences of the United States of America 111, 652–657, doi: 10.1073/pnas.1321032111 (2014). [DOI] [PMC free article] [PubMed] [Google Scholar]
- 11.Wang Y et al. Nucleation, propagation and cleavage of target RNAs in Ago silencing complexes. Nature 461, 754–761, doi: 10.1038/nature08434 (2009). [DOI] [PMC free article] [PubMed] [Google Scholar]
- 12.Ober-Reynolds B et al. High-throughput biochemical profiling reveals functional adaptation of a bacterial Argonaute. Molecular cell 82, 1329–1342 e1328, doi: 10.1016/j.molcel.2022.02.026 (2022). [DOI] [PMC free article] [PubMed] [Google Scholar]
- 13.Wang Y et al. Structure of an argonaute silencing complex with a seed-containing guide DNA and target RNA duplex. Nature 456, 921–926, doi: 10.1038/nature07666 (2008). [DOI] [PMC free article] [PubMed] [Google Scholar]
- 14.Wang Y, Sheng G, Juranek S, Tuschl T & Patel DJ Structure of the guide-strand-containing argonaute silencing complex. Nature 456, 209–213, doi: 10.1038/nature07315 (2008). [DOI] [PMC free article] [PubMed] [Google Scholar]
- 15.Wee LM, Flores-Jasso CF, Salomon WE & Zamore PD Argonaute divides its RNA guide into domains with distinct functions and RNA-binding properties. Cell 151, 1055–1067, doi: 10.1016/j.cell.2012.10.036 (2012). [DOI] [PMC free article] [PubMed] [Google Scholar]
- 16.Becker WR et al. High-Throughput Analysis Reveals Rules for Target RNA Binding and Cleavage by AGO2. Molecular cell, doi: 10.1016/j.molcel.2019.06.012 (2019). [DOI] [PMC free article] [PubMed] [Google Scholar]
- 17.Niaz S The AGO proteins: an overview. Biol Chem 399, 525–547, doi: 10.1515/hsz-2017-0329 (2018). [DOI] [PubMed] [Google Scholar]
- 18.Pourjafar-Dehkordi D & Zacharias M Binding-induced functional-domain motions in the Argonaute characterized by adaptive advanced sampling. PLoS Comput Biol 17, e1009625, doi: 10.1371/journal.pcbi.1009625 (2021). [DOI] [PMC free article] [PubMed] [Google Scholar]
- 19.Sheu-Gruttadauria J, Xiao Y, Gebert LF & MacRae IJ Beyond the seed: structural basis for supplementary microRNA targeting by human Argonaute2. The EMBO journal, doi: 10.15252/embj.2018101153 (2019). [DOI] [PMC free article] [PubMed] [Google Scholar]
- 20.Sheu-Gruttadauria J et al. Structural Basis for Target-Directed MicroRNA Degradation. Molecular cell, doi: 10.1016/j.molcel.2019.06.019 (2019). [DOI] [PMC free article] [PubMed] [Google Scholar]
- 21.Nakanishi K, Weinberg DE, Bartel DP & Patel DJ Structure of yeast Argonaute with guide RNA. Nature 486, 368–374, doi: 10.1038/nature11211 (2012). [DOI] [PMC free article] [PubMed] [Google Scholar]
- 22.Schirle NT & MacRae IJ The crystal structure of human Argonaute2. Science 336, 1037–1040, doi: 10.1126/science.1221551 (2012). [DOI] [PMC free article] [PubMed] [Google Scholar]
- 23.Nakanishi K et al. Eukaryote-specific insertion elements control human ARGONAUTE slicer activity. Cell Rep 3, 1893–1900, doi: 10.1016/j.celrep.2013.06.010 (2013). [DOI] [PMC free article] [PubMed] [Google Scholar]
- 24.Park MS et al. Human Argonaute3 has slicer activity. Nucleic acids research 45, 11867–11877, doi: 10.1093/nar/gkx916 (2017). [DOI] [PMC free article] [PubMed] [Google Scholar]
- 25.Park MS et al. Multidomain Convergence of Argonaute during RISC Assembly Correlates with the Formation of Internal Water Clusters. Molecular cell 75, 725–740 e726, doi: 10.1016/j.molcel.2019.06.011 (2019). [DOI] [PMC free article] [PubMed] [Google Scholar]
- 26.Faehnle CR, Elkayam E, Haase AD, Hannon GJ & Joshua-Tor L The making of a slicer: activation of human Argonaute-1. Cell Rep 3, 1901–1909, doi: 10.1016/j.celrep.2013.05.033 (2013). [DOI] [PMC free article] [PubMed] [Google Scholar]
- 27.Elbashir SM, Lendeckel W & Tuschl T RNA interference is mediated by 21- and 22-nucleotide RNAs. Genes & development 15, 188–200 (2001). [DOI] [PMC free article] [PubMed] [Google Scholar]
- 28.Nowotny M, Gaidamakov SA, Crouch RJ & Yang W Crystal structures of RNase H bound to an RNA/DNA hybrid: substrate specificity and metal-dependent catalysis. Cell 121, 1005–1016, doi: 10.1016/j.cell.2005.04.024 (2005). [DOI] [PubMed] [Google Scholar]
- 29.Schirle NT, Sheu-Gruttadauria J & MacRae IJ Structural basis for microRNA targeting. Science 346, 608–613, doi: 10.1126/science.1258040 (2014). [DOI] [PMC free article] [PubMed] [Google Scholar]
- 30.Schwarz DS et al. Asymmetry in the assembly of the RNAi enzyme complex. Cell 115, 199–208 (2003). [DOI] [PubMed] [Google Scholar]
- 31.Khvorova A, Reynolds A & Jayasena SD Functional siRNAs and miRNAs exhibit strand bias. Cell 115, 209–216 (2003). [DOI] [PubMed] [Google Scholar]
- 32.Ameres SL, Martinez J & Schroeder R Molecular basis for target RNA recognition and cleavage by human RISC. Cell 130, 101–112, doi: 10.1016/j.cell.2007.04.037 (2007). [DOI] [PubMed] [Google Scholar]
- 33.Reynolds A et al. Rational siRNA design for RNA interference. Nature biotechnology 22, 326–330, doi: 10.1038/nbt936 (2004). [DOI] [PubMed] [Google Scholar]
- 34.Holm L & Rosenstrom P Dali server: conservation mapping in 3D. Nucleic acids research 38, W545–549, doi: 10.1093/nar/gkq366 (2010). [DOI] [PMC free article] [PubMed] [Google Scholar]
Methods-only references
- 35.Suloway C et al. Automated molecular microscopy: the new Leginon system. J Struct Biol 151, 41–60, doi: 10.1016/j.jsb.2005.03.010 (2005). [DOI] [PubMed] [Google Scholar]
- 36.Kimanius D, Forsberg BO, Scheres SH & Lindahl E Accelerated cryo-EM structure determination with parallelisation using GPUs in RELION-2. Elife 5, doi: 10.7554/eLife.18722 (2016). [DOI] [PMC free article] [PubMed] [Google Scholar]
- 37.Zhang K Gctf: Real-time CTF determination and correction. J Struct Biol 193, 1–12, doi: 10.1016/j.jsb.2015.11.003 (2016). [DOI] [PMC free article] [PubMed] [Google Scholar]
- 38.Punjani A, Rubinstein JL, Fleet DJ & Brubaker MA cryoSPARC: algorithms for rapid unsupervised cryo-EM structure determination. Nature methods 14, 290–296, doi: 10.1038/nmeth.4169 (2017). [DOI] [PubMed] [Google Scholar]
- 39.Tan YZ et al. Addressing preferred specimen orientation in single-particle cryo-EM through tilting. Nature methods 14, 793–796, doi: 10.1038/nmeth.4347 (2017). [DOI] [PMC free article] [PubMed] [Google Scholar]
- 40.Zheng SQ et al. MotionCor2: anisotropic correction of beam-induced motion for improved cryo-electron microscopy. Nature methods 14, 331–332, doi: 10.1038/nmeth.4193 (2017). [DOI] [PMC free article] [PubMed] [Google Scholar]
- 41.Lander GC et al. Appion: an integrated, database-driven pipeline to facilitate EM image processing. J Struct Biol 166, 95–102, doi: 10.1016/j.jsb.2009.01.002 (2009). [DOI] [PMC free article] [PubMed] [Google Scholar]
- 42.Goddard TD, Huang CC & Ferrin TE Visualizing density maps with UCSF Chimera. J Struct Biol 157, 281–287, doi: 10.1016/j.jsb.2006.06.010 (2007). [DOI] [PubMed] [Google Scholar]
- 43.Pettersen EF et al. UCSF Chimera--a visualization system for exploratory research and analysis. J Comput Chem 25, 1605–1612, doi: 10.1002/jcc.20084 (2004). [DOI] [PubMed] [Google Scholar]
- 44.Emsley P, Lohkamp B, Scott WG & Cowtan K Features and development of Coot. Acta crystallographica. Section D, Biological crystallography 66, 486–501, doi: 10.1107/S0907444910007493 (2010). [DOI] [PMC free article] [PubMed] [Google Scholar]
- 45.Liebschner D et al. Macromolecular structure determination using X-rays, neutrons and electrons: recent developments in Phenix. Acta Crystallogr D Struct Biol 75, 861–877, doi: 10.1107/S2059798319011471 (2019). [DOI] [PMC free article] [PubMed] [Google Scholar]
Associated Data
This section collects any data citations, data availability statements, or supplementary materials included in this article.
Data Availability Statement
Maps for the AtAgo10-guide, AtAgo10-guide-target (central-duplex), and AtAgo10-guide-target (bent-duplex) complexes were deposited in the Electron Microscopy Data Bank under accession IDs EMD-25446, EMD-25472, EMD-25482, respectively. Corresponding atomic models were deposited in the Protein Data Bank under accession IDs 7SVA, 7SWF, 7SWQ.


